Embed Size (px)
Citation preview

S1
Supporting Information for
Explosion Study of Nitromethane Confined in CNT Nanocontainer via Reactive Molecular
Dynamics
Jeong Hyeon Lee,†,⊥ Jin Chul Kim,†,⊥ Woo Cheol Jeon,†,⊥ Soo Gyeong Cho, *,‡ and Sang
Kyu Kwak*,†
† School of Energy and Chemical Engineering, Ulsan National Institute of Science and
Technology (UNIST), Ulsan 44919, Republic of Korea
‡ Agency for Defense Development (ADD), P.O. Box 35, Yuseong, Daejeon 305-600,
Republic of Korea
⊥ These authors are equally contributed
* Corresponding author: Email address: [email protected], [email protected]
Office:+82-52-217-2541, Fax:+82-52-217-2649
Table S1. Grand Canonical Monte Carlo (GCMC) results for system modeling
Table S2. Energy conservation test from non-equilibrium reactive MD simulation for 200 ps
Table S3. Bond order cut-off value for species analysis.

S2
Figure S1. CNT cap model constructed in this study using the solution of Thomson problem.
Figure S2. Connolly surface and cavity volume of CNT container.
Figure S3. Potential energy profile of the system at each density
Figure S4 – S8. Reaction intermediates at density = 1.137 g/cm3, 1.2 g/cm3, 1.3 g/cm3, 1.5 g/cm3, and 1.7 g/cm3 with each initial heating temperature, respectively.
Figure S9 – S13. Stable products at density = 1.137 g/cm3, 1.2 g/cm3, 1.3 g/cm3, 1.5 g/cm3, and 1.7 g/cm3 with each initial heating temperature, respectively.
Figure S14. The number of carbon atoms in CNT and CO during simulation time for each system.
Figure S15. Temperature profile for reactive dynamics with and without point defect for density = 1.137 g/cm3.
Figure S16. CNT bursting mechanism with defective and pristine container at 1.137 g/cm3 3500 K, respectively.
Criteria of proper diameter of nanobomb
As an initial step prior to system modeling, we chose the appropriate size (radius or chiral
index) of the CNT to contain enough NM molecules to be ruptured itself by the heat released
from the internally contained NM. The number of NM loaded in the unit length of CNT with
each radius was confirmed through the GCMC simulation, and the maximum heat of reaction
was calculated. Reaction enthalpy of NM was estimated when NM was exactly decomposed
in the form of gas molecules.1
3 2 2 2 2 Rxn1 1CH NO CO + N + H O + H ΔH = -67 kcal/mol2 2→
Bond Dissociation Energy (BDE) of the C-C bond in CNT was calculated using
following form of the overall reaction
*2 2 RxnCNT + O CNT + CO ΔH = -63.703 kcal/mol→
S3
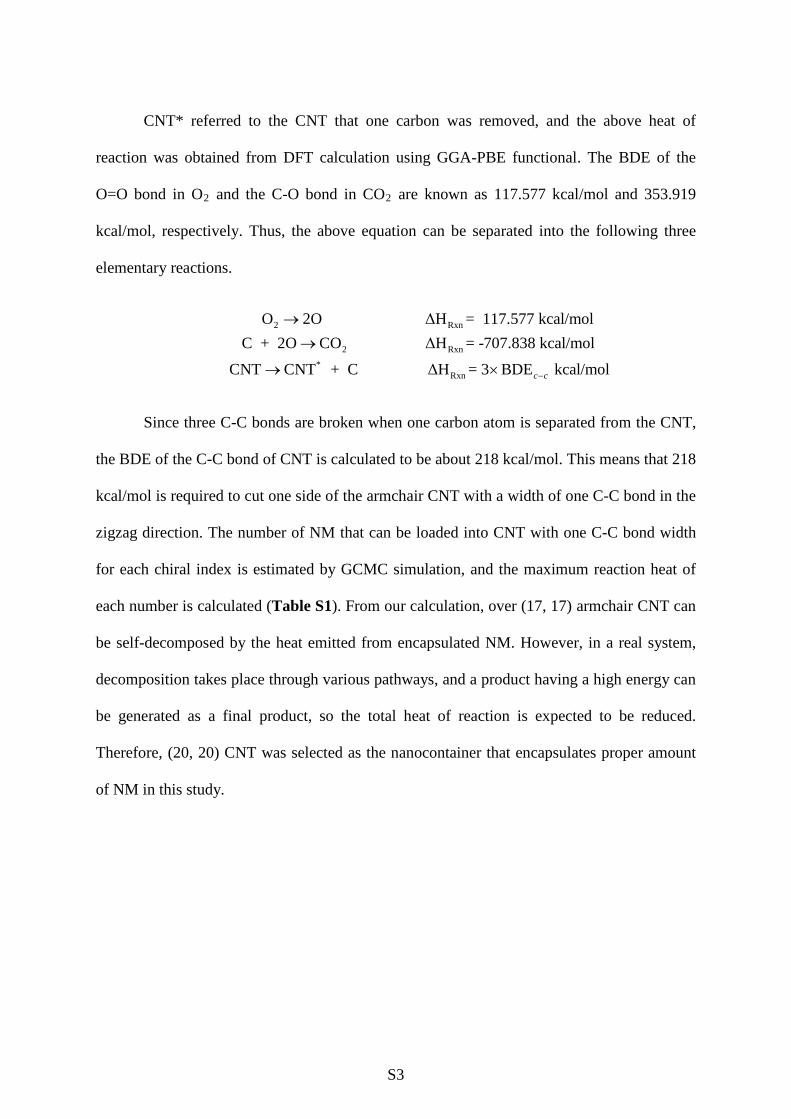
CNT* referred to the CNT that one carbon was removed, and the above heat of
reaction was obtained from DFT calculation using GGA-PBE functional. The BDE of the
O=O bond in O2 and the C-O bond in CO2 are known as 117.577 kcal/mol and 353.919
kcal/mol, respectively. Thus, the above equation can be separated into the following three
elementary reactions.
2 Rxn
2 Rxn*
Rxn
O 2O ΔH = 117.577 kcal/mol C + 2O CO ΔH = -707.838 kcal/mol
CNT CNT + C ΔH = 3 BDE kcal/molc c-
→→
→ ×
Since three C-C bonds are broken when one carbon atom is separated from the CNT,
the BDE of the C-C bond of CNT is calculated to be about 218 kcal/mol. This means that 218
kcal/mol is required to cut one side of the armchair CNT with a width of one C-C bond in the
zigzag direction. The number of NM that can be loaded into CNT with one C-C bond width
for each chiral index is estimated by GCMC simulation, and the maximum reaction heat of
each number is calculated (Table S1). From our calculation, over (17, 17) armchair CNT can
be self-decomposed by the heat emitted from encapsulated NM. However, in a real system,
decomposition takes place through various pathways, and a product having a high energy can
be generated as a final product, so the total heat of reaction is expected to be reduced.
Therefore, (20, 20) CNT was selected as the nanocontainer that encapsulates proper amount
of NM in this study.

S4
Table S1. Grand Canonical Monte Carlo (GCMC) results for system modeling
Chiral index # of loaded NM (/1 bond CNT) Ideal heat of reaction (6, 6) 0.209 13.984 (7, 7) 0.278 18.611 (8, 8) 0.389 26.056 (9, 9) 0.659 44.183
(10, 10) 0.884 59.224 (11, 11) 1.156 77.471 (12, 12) 1.485 99.491 (13, 13) 1.813 121.482 (14, 14) 2.189 146.663 (15, 15) 2.567 171.996 (16, 16) 2.996 200.747 (17, 17) 3.650 244.550 (18, 18) 4.037 270.469 (19, 19) 4.690 314.200 (20, 20) 5.335 357.472

S5
Table S2. Energy conservation test from non-equilibrium reactive MD simulation for 200 ps
Model system Initial
(kcal/mol) Max. energy (kcal/mol)
diff (%) Min. energy (kcal/mol)
diff (%) Density (g/cm3)
Initial heating temperature
1.137
2500 -615263.170 -607067.470 1.332 -615276.150 0.002 3000 -602429.720 -587248.200 2.520 -602510.150 0.013 3500 -589173.600 -569645.290 3.315 -589242.210 0.012 4000 -574882.670 -558511.100 2.848 -574973.550 0.016
1.2
2500 -624571.900 -615250.190 1.492 -624574.180 0.000 3000 -610880.390 -592457.540 3.016 -610887.000 0.001 3500 -597690.250 -576010.330 3.627 -597725.730 0.006 4000 -583722.720 -573991.810 1.667 -583818.540 0.016
1.3
2500 -639339.010 -628286.480 1.729 -639349.130 0.002 3000 -625412.870 -603669.090 3.477 -625426.940 0.002 3500 -611041.450 -596486.970 2.382 -611121.260 0.013 4000 -597139.620 -586345.130 1.808 -597209.490 0.012
1.5
2500 -667982.730 -658170.830 1.469 -667993.600 0.002 3000 -652376.690 -637216.170 2.324 -652419.040 0.006 3500 -636864.430 -628365.290 1.335 -636901.740 0.006 4000 -621000.440 -611432.000 1.541 -621049.940 0.008
1.7
2500 -695501.820 -684883.790 1.527 -695517.480 0.002 3000 -679307.440 -669631.650 1.424 -679316.560 0.001 3500 -662427.870 -654184.330 1.244 -662467.830 0.006 4000 -644397.430 -634575.360 1.524 -644427.130 0.005

S6
Table S3. Bond order cut-off value for species analysis2
Bond Cut off C-N 0.30 C-C 0.55 C-O 0.80 C-H 0.40 O-O 0.65 N-O 0.55 O-H 0.40 H-H 0.55 H-N 0.55 N-N 0.55

S7
Figure S1. CNT cap model constructed in this study using the solution of Thomson problem. 5-7 carbon atoms rings are colored as blue and red lines, respectively.
CNTCap
Side view Front view

S8
Figure S2. Connolly surface and cavity volume of CNT container. a) Gold area is the Connolly surface of CNT container. b) Cavity volume of nanobomb, which is the enclosed region of Connolly surface drawn as the shaded yellow. NM molecules are packed in the shaded yellow region.
b)
a)

S9
Figure S3. Potential energy profile of the system at density of a) 1.137 g/cm3, b) 1.2 g/cm3, c) 1.3 g/cm3, d) 1.5 g/cm3, and e) 1.7 g/cm3, respectively.
0 50 100 150 200
-670000
-665000
-660000
-655000
-650000
-645000
-640000
-635000
Time (ps)
2500K 3000K 3500K 4000K
0 50 100 150 200
-720000
-710000
-700000
-690000
-680000
Time (ps)
2500K 3000K 3500K 4000K
0 50 100 150 200
-760000
-750000
-740000
-730000
-720000
-710000
Time (ps)
2500K 3000K 3500K 4000K
0 50 100 150 200-690000
-680000
-670000
-660000
-650000
Pot
entia
l Ene
rgy
(kca
l/mol
)
Time (ps)
2500K 3000K 3500K 4000K
0 50 100 150 200-660000
-655000
-650000
-645000
-640000
-635000
-630000
-625000
Pote
ntia
l Ene
rgy
(kca
l/mol
)
Time (ps)
2500K 3000K 3500K 4000K
a)
c) d) e)
density = 1.137 g/cm3 density = 1.2 g/cm3
density = 1.3 g/cm3 density = 1.5 g/cm3 density = 1.7 g/cm3
b)
Pot
entia
l Ene
rgy
(kca
l/mol
)
Pot
entia
l Ene
rgy
(kca
l/mol
)
Pot
entia
l Ene
rgy
(kca
l/mol
)
Pot
entia
l Ene
rgy
(kca
l/mol
)
Pot
entia
l Ene
rgy
(kca
l/mol
)
Time (ps) Time (ps)
Time (ps) Time (ps) Time (ps)
S10
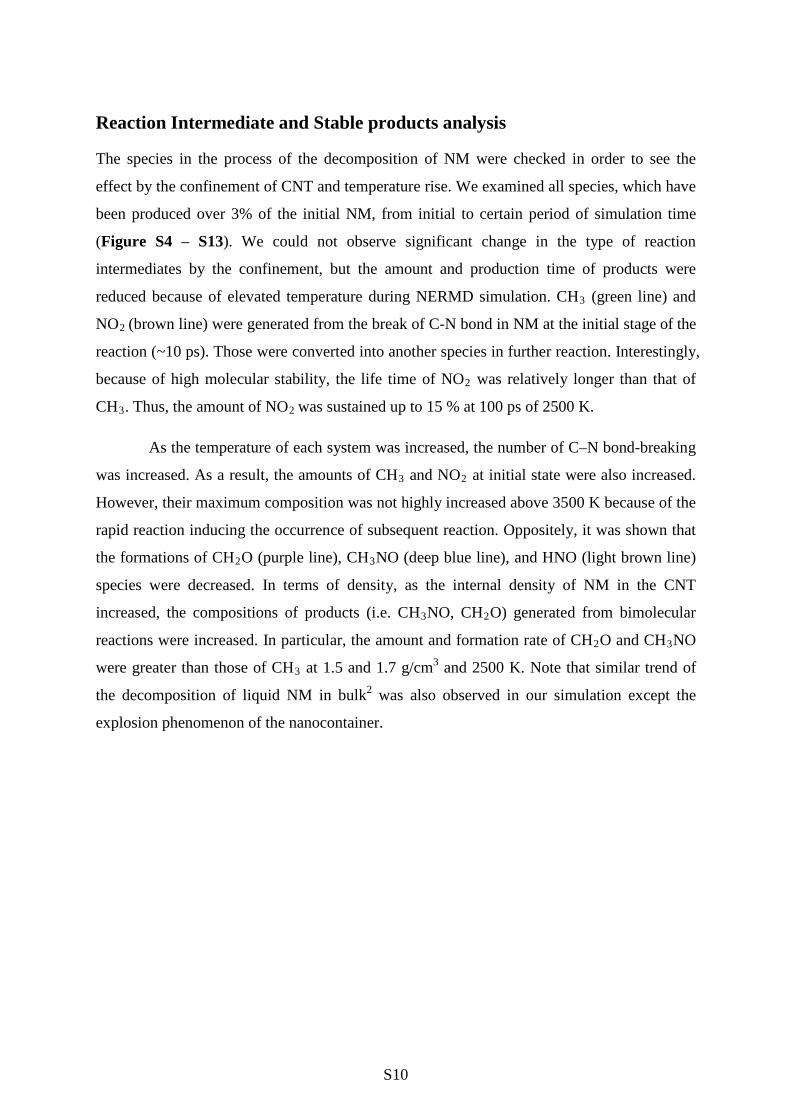
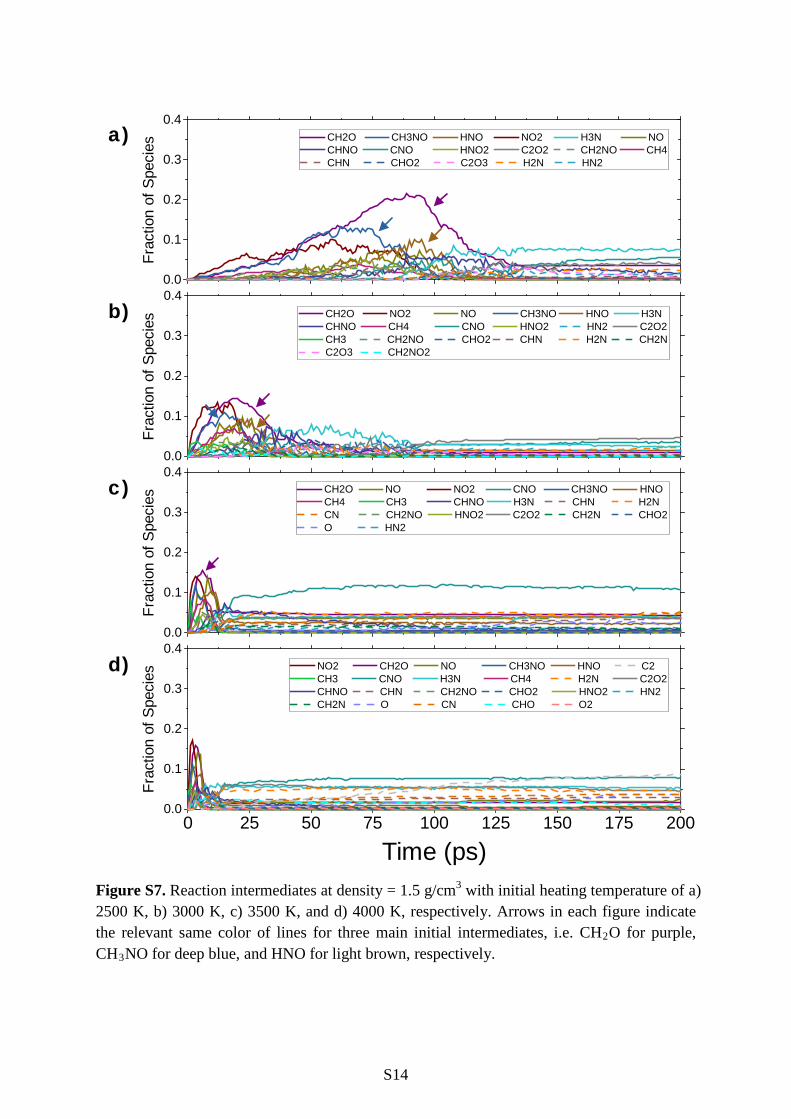
Reaction Intermediate and Stable products analysis
The species in the process of the decomposition of NM were checked in order to see the
effect by the confinement of CNT and temperature rise. We examined all species, which have
been produced over 3% of the initial NM, from initial to certain period of simulation time
(Figure S4 – S13). We could not observe significant change in the type of reaction
intermediates by the confinement, but the amount and production time of products were
reduced because of elevated temperature during NERMD simulation. CH3 (green line) and
NO2 (brown line) were generated from the break of C-N bond in NM at the initial stage of the
reaction (~10 ps). Those were converted into another species in further reaction. Interestingly,
because of high molecular stability, the life time of NO2 was relatively longer than that of
CH3. Thus, the amount of NO2 was sustained up to 15 % at 100 ps of 2500 K.
As the temperature of each system was increased, the number of C–N bond-breaking
was increased. As a result, the amounts of CH3 and NO2 at initial state were also increased.
However, their maximum composition was not highly increased above 3500 K because of the
rapid reaction inducing the occurrence of subsequent reaction. Oppositely, it was shown that
the formations of CH2O (purple line), CH3NO (deep blue line), and HNO (light brown line)
species were decreased. In terms of density, as the internal density of NM in the CNT
increased, the compositions of products (i.e. CH3NO, CH2O) generated from bimolecular
reactions were increased. In particular, the amount and formation rate of CH2O and CH3NO
were greater than those of CH3 at 1.5 and 1.7 g/cm3 and 2500 K. Note that similar trend of
the decomposition of liquid NM in bulk2 was also observed in our simulation except the
explosion phenomenon of the nanocontainer.

S11
Figure S4. Reaction intermediates at density = 1.137 g/cm3 with initial heating temperature of a) 2500 K, b) 3000 K, c) 3500 K, and d) 4000 K, respectively. Arrows in each figure indicate the relevant same color of lines for three main initial intermediates, i.e. CH2O for purple, CH3NO for deep blue, and HNO for light brown, respectively.
0 25 50 75 100 125 150 175 2000.0
0.1
0.2
0.3
0.4 NO2 NO CH3 CH2O HNO CH4 CH3NO CNO C2O2 HN2 CHNO HNO2 CHN CHO2 H3N CH2NO CHO H2N O C2 CN CH2N O2 C2HO2 C2O3 H2N2 C2O C3O2
0.0
0.1
0.2
0.3
0.4 CH2O NO2 HNO CH3NO NO CHNO HNO2 H3N CH4 CNO CHN CH3 CH2NO C2O2 NO3 CHO2 HN2 N2O2 H2N C2O3 CH2NO2 HNO3 CNO2
0.0
0.1
0.2
0.3
0.4 CH2O NO2 NO HNO CH3 CH3NO CH4 CHNO HNO2 C2O2 H3N CH2NO CNO CHN CHO2 HN2 C2O3 C3O3
H2N CH3N C2HO2 C3O2 CH2N CHO CH2O2 CN
0.0
0.1
0.2
0.3
0.4 NO2 NO CH3 CH2O HNO CH3NO CH4 CHNO CHN C2O2 H3N CNO HN2 CH2NO HNO2 CHO2 H2N CHO CH2N C2HO2 C2O3 CH2O2 CN
Frac
tion
of S
peci
es
Time (ps)
a)
b)
c)
d)
Frac
tion
of S
peci
esFr
actio
n of
Spe
cies
Frac
tion
of S
peci
es

S12
Figure S5. Reaction intermediates at density = 1.2 g/cm3 with initial heating temperature of a) 2500 K, b) 3000 K, c) 3500 K, and d) 4000 K, respectively. Arrows in each figure indicate the relevant same color of lines for three main initial intermediates, i.e. CH2O for purple, CH3NO for deep blue, and HNO for light brown, respectively.
Time (ps)
0.0
0.1
0.2
0.3
0.4 NO2 CH2O NO HNO CH3 CH4 CH3NO C2O2 CHNO CHO2 H3N HN2 HNO2 CNO CH2NO CHN C2O3 H2N C2HO2 CH2NO2 CHO CH2O2 CH2N CN
0.0
0.1
0.2
0.3
0.4 CH2O NO2 HNO NO H3N CH3 CH3NO CHNO CH4 HNO2 CNO C2O2 CH2NO CHN CHO2 HN2 CH2N N2O2 H2N C2O3
0.0
0.1
0.2
0.3
0.4 CH2O NO2 HNO NO CH3NO CH3 CHNO CH4 H3N HNO2 CNO HN2 C2O2 CH2NO CHO2 CHN H2N CH2N C2HO2 C2O3 CHO NO3 H2N2 C3O2
0 25 50 75 100 125 150 175 2000.0
0.1
0.2
0.3
0.4 NO2 NO CH3 CH2O HNO CH4 CH3NO H3N CHNO CNO CHN CHO2 C2O2 HNO2 H2N O HN2 CH2NO CH2NO2 CH2N CHO CN C2 H2O2 C2HO2
Frac
tion
of S
peci
esa)
b)
c)
d)
Frac
tion
of S
peci
esFr
actio
n of
Spe
cies
Frac
tion
of S
peci
es

S13
Figure S6. Reaction intermediates at density = 1.3 g/cm3 with initial heating temperature of a) 2500 K, b) 3000 K, c) 3500 K, and d) 4000 K, respectively. Arrows in each figure indicate the relevant same color of lines for three main initial intermediates, i.e. CH2O for purple, CH3NO for deep blue, and HNO for light brown, respectively.
Time (ps)
0.0
0.1
0.2
0.3
0.4 NO2 CH2O NO CH3 HNO CH4 CH3NO H3N CHNO CNO HN2 CH2NO CHO2 C2O2 HNO2 CHN H2N CHO C2O3 O CH2N C2HO2 CH2O2
0.0
0.1
0.2
0.3
0.4 CH2O NO2 NO HNO H3N CHNO CH3NO CH2NO CNO HNO2 CH4 C2O2 CHN CH3 HN2 CHO2 H2N C2O3 N2O2
0.0
0.1
0.2
0.3
0.4 CH2O NO2 NO HNO CH3NO CH3 H3N CH4 CHNO CH2NO HN2 C2O2 HNO2 CHN CNO CHO2 H2N C2O3 CH2N NO3 CHO H2N2
0 25 50 75 100 125 150 175 2000.0
0.1
0.2
0.3
0.4 NO2 CH2O NO CH3 HNO CH3NO C2 CH4 H3N CHN CHNO CNO CH2NO HN2 CHO2 HNO2 C2O2 H2N O2 CHO CH2N CH2NO2 CN O C2O3
Frac
tion
of S
peci
esa)
b)
c)
d)
Frac
tion
of S
peci
esFr
actio
n of
Spe
cies
Frac
tion
of S
peci
es
S14
Figure S7. Reaction intermediates at density = 1.5 g/cm3 with initial heating temperature of a) 2500 K, b) 3000 K, c) 3500 K, and d) 4000 K, respectively. Arrows in each figure indicate the relevant same color of lines for three main initial intermediates, i.e. CH2O for purple, CH3NO for deep blue, and HNO for light brown, respectively.
Time (ps)
0.0
0.1
0.2
0.3
0.4 CH2O NO NO2 CNO CH3NO HNO CH4 CH3 CHNO H3N CHN H2N CN CH2NO HNO2 C2O2 CH2N CHO2 O HN2
0 25 50 75 100 125 150 175 2000.0
0.1
0.2
0.3
0.4 NO2 CH2O NO CH3NO HNO C2 CH3 CNO H3N CH4 H2N C2O2 CHNO CHN CH2NO CHO2 HNO2 HN2 CH2N O CN CHO O2
0.0
0.1
0.2
0.3
0.4 CH2O CH3NO HNO NO2 H3N NO CHNO CNO HNO2 C2O2 CH2NO CH4 CHN CHO2 C2O3 H2N HN2
0.0
0.1
0.2
0.3
0.4 CH2O NO2 NO CH3NO HNO H3N CHNO CH4 CNO HNO2 HN2 C2O2 CH3 CH2NO CHO2 CHN H2N CH2N C2O3 CH2NO2
Frac
tion
of S
peci
esa)
b)
c)
d)
Frac
tion
of S
peci
esFr
actio
n of
Spe
cies
Frac
tion
of S
peci
es

S15
Figure S8. Reaction intermediates at density = 1.7 g/cm3 with initial heating temperature of a) 2500 K, b) 3000 K, c) 3500 K, and d) 4000 K, respectively. Arrows in each figure indicate the relevant same color of lines for three main initial intermediates, i.e. CH2O for purple, CH3NO for deep blue, and HNO for light brown, respectively.
0.0
0.1
0.2
0.3
0.4 CH3NO CH2O H3N NO2 NO HNO CNO CHNO CHN C2O2 H2N HNO2 CH2NO C2O3 CHO2
0.0
0.1
0.2
0.3
0.4 CH2O CH3NO CNO NO2 NO HNO H3N CHNO CH4 H2N HNO2 CH2NO C2O2 CHO2 CH2N CHN CN
0.0
0.1
0.2
0.3
0.4 CH2O NO2 CH3NO CNO NO HNO CHNO CH2NO CH4 H3N HNO2 CHN H2N CN CH3 O CHO CHO2
0 25 50 75 100 125 150 175 2000.0
0.1
0.2
0.3
0.4 CH2O NO CNO CH3NO NO2 HNO CN CHNO CH4 CHN H2N CH2NO H3N C2 HNO2 CH3 CHO2 O O2 CHO
Time (ps)
Frac
tion
of S
peci
esa)
b)
c)
d)
Frac
tion
of S
peci
esFr
actio
n of
Spe
cies
Frac
tion
of S
peci
es

S16
Figure S9. Stable products at density = 1.137 g/cm3 at initial heating temperature of a) 2500 K, b) 3000 K, c) 3500 K, and d) 4000 K, respectively. Orange dashed-line represents the bursting time.
b)
d)

S17
Figure S10. Stable products at density = 1.2 g/cm3 at initial heating temperature of a) 2500 K, b) 3000 K, c) 3500 K, and d) 4000 K, respectively. Orange dashed-line represents the bursting time.
b)a)
c) d)

S18
Figure S11. Stable products at density = 1.3 g/cm3 at initial heating temperature of a) 2500 K, b) 3000 K, c) 3500 K, and d) 4000 K, respectively. Orange dashed-line represents the bursting time.
b)a)
c) d)

S19
Figure S12. Stable products at density = 1.5 g/cm3 at initial heating temperature of a) 2500 K, b) 3000 K, c) 3500 K, and d) 4000 K, respectively. Orange dashed-line represents the bursting time.
d)
S20
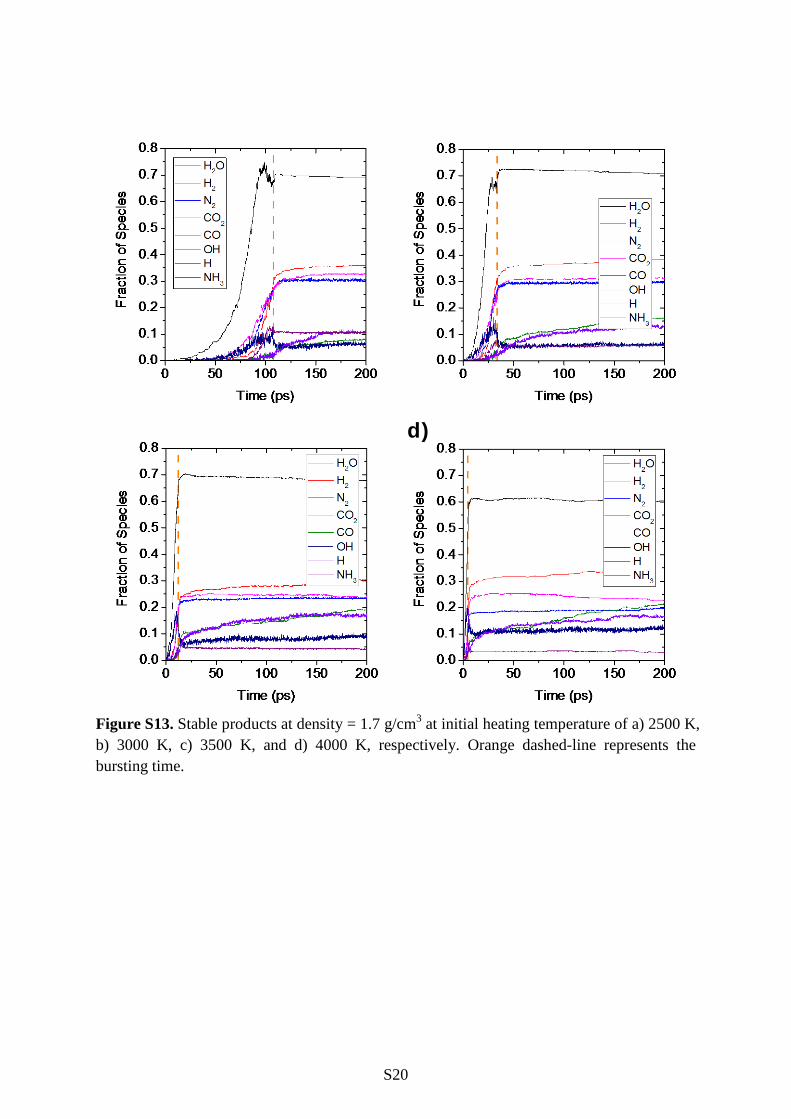
Figure S13. Stable products at density = 1.7 g/cm3 at initial heating temperature of a) 2500 K, b) 3000 K, c) 3500 K, and d) 4000 K, respectively. Orange dashed-line represents the bursting time.
d)

S21
Figure S14. The number of carbon atoms in CNT (upper panel) and CO (lower panel) during simulation time for each system. Green dashed-line represents the bursting time.
2500K 3000K 3500K 4000K
2500K 3000K 3500K 4000K
2500K 3000K 3500K 4000K
2500K 3000K 3500K 4000K
0 50 100 150 200
2500K 3000K 3500K 4000K
Time (ps)0 50 100 150 200
2500K 3000K 3500K 4000K
Time (ps)0 50 100 150 200
2500K 3000K 3500K 4000K
Time (ps)0 50 100 150 200
2500K 3000K 3500K 4000K
Time (ps)0 50 100 150 200
0
40
80
120
160
200 2500K 3000K 3500K 4000K
Num
ber o
f CO
mol
ecul
es
Time (ps)
2200
2240
2280
2320
2360
2400
2500K 3000K 3500K 4000K
Num
ber o
f Car
bon
atom
s in
CN
T
1.137 g/cm3 1.2 g/cm3 1.3 g/cm3 1.5 g/cm3 1.7 g/cm3
1.137 g/cm3 1.2 g/cm3 1.3 g/cm3 1.5 g/cm3 1.7 g/cm3

S22
Figure S15. Temperature profile for reactive dynamics with and without point defect for density = 1.137 g/cm3. Light color ones represent the results from non-defective system, and deep ones are the result from 0.5% point defect systems.
0 50 100 150 2002000
2500
3000
3500
4000
4500
5000
5500
6000
Tem
pera
ture
(K)
Time (ps)
2500K 3000K 3500K 4000K
S23
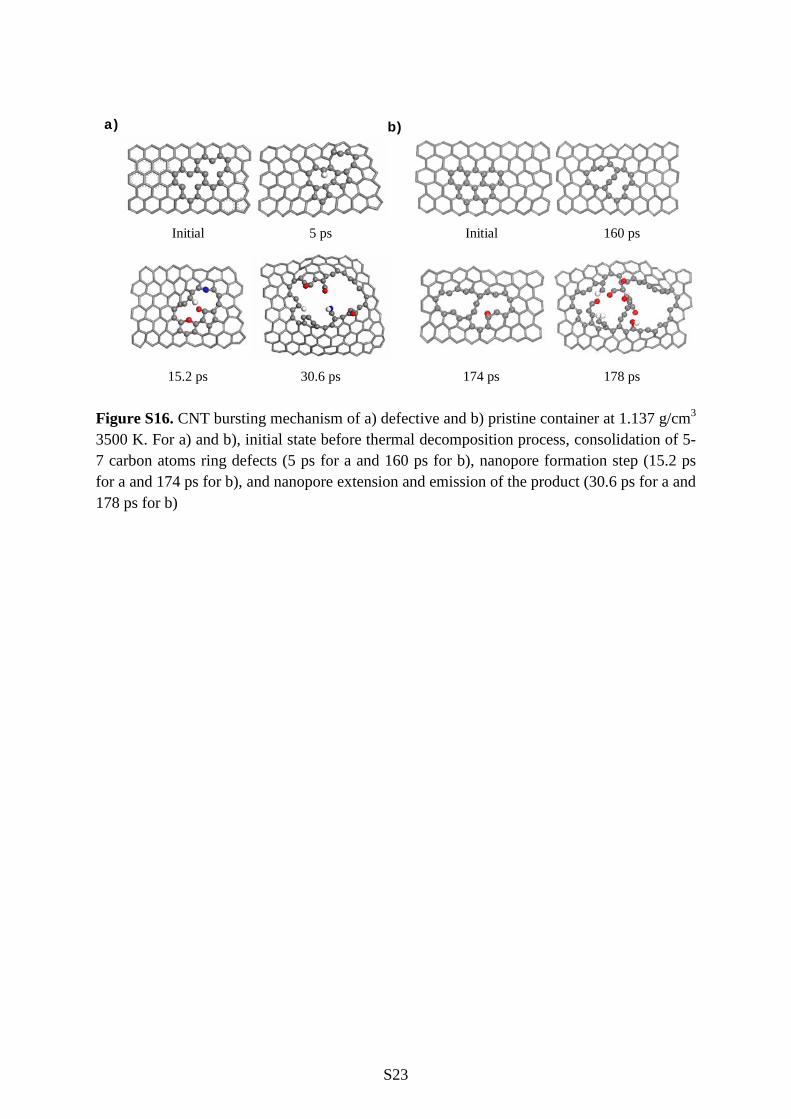
Figure S16. CNT bursting mechanism of a) defective and b) pristine container at 1.137 g/cm3 3500 K. For a) and b), initial state before thermal decomposition process, consolidation of 5-7 carbon atoms ring defects (5 ps for a and 160 ps for b), nanopore formation step (15.2 ps for a and 174 ps for b), and nanopore extension and emission of the product (30.6 ps for a and 178 ps for b)
Initial 5 ps
15.2 ps 30.6 ps 174 ps 178 ps
160 psInitial
a) b)

S24
References
1. Melius, C. F. Thermochemistry and Reaction Mechanisms of Nitromethane Ignition. J. Phys. IV 1995, 5, 535–552.
2. Rom, N.; Zybin, S. V.; van Duin, A. C. T.; Goddard, W. A.; Zeiri, Y.; Katz, G.; Kosloff, R. Density-Dependent Liquid Nitromethane Decomposition: Molecular Dynamics Simulations Based on ReaxFF. J. Phys. Chem. A 2011, 115, 10181–10202.