Embed Size (px)
Citation preview

EXPLORING THE RELATIONSHIP BETWEEN INDIVIDUAL CULTURAL VALUES AND
EMPLOYEE SILENCE
by
Sumeth Tanyaovalaksna
A thesis submitted in conformity with the requirements
for the degree of Doctor of Philosophy
Department of Leadership, Higher and Adult Education
Ontario Institutes for Studies in Education
University of Toronto, Ontario
@ Copyright by Sumeth Tanyaovalaksna 2016

ii
ABSTRACT
This study examines the relationship between individual cultural values and employee
silence among nurses, medical laboratory technologists, and primary care paramedics in Canada.
The study has four parts: Part A looks at the relationship between power distance, uncertainty
avoidance, quiescent silence, and acquiescent silence. It also investigates the mediating role of
psychological safety, using the Sobel formula and bootstrapping techniques. Part B investigates
the relationship among collectivism, long-term orientation, competition, prosocial silence, and
opportunistic silence. Part C investigates how the three professions use their silence in the
workplace and Part D examines their perceptions relating to power distance, uncertainty
avoidance, and competition.
The study comprised 378 healthcare professionals including 156 registered nurses, 115
medical laboratory technologists, and 107 primary care paramedics. Part A results indicate that,
for the professions combined, uncertainty avoidance and power distance have positive
relationships with acquiescent silence but not with quiescent silence. These results are not
replicable for the professions separately, indicating there are differences in cultural values among
nurses, medical laboratory technologists and primary care paramedics.
Across the professions, psychological safety has mediating roles between uncertainty
avoidance, and both acquiescent and quiescent silence. However, psychological safety has no
mediating role between power distance and acquiescent or quiescent silence. For the professions
separately, these results are not replicable.
The relationships among collectivism, competition and long-term orientation, prosocial
silence and opportunistic silence are also investigated in Part B. Collectively, the three
professions show significant relationships between competition and opportunistic silence,
Exploring the Relationship between Individual Cultural Values and Employee Silence Sumeth Tanyaovalaksna, Doctor of Philosophy, Leadership, Higher and Adult Education, University of Toronto, 2016

iii
competition and prosocial silence, and collectivism and prosocial silence. These patterns are not
replicable when each profession is examined separately.
In Part C, both MANOVA and latent variable means indicate significant differences in
the mean cultural values among the three professions. However, latent variable means and the
post hoc tests disagree on the sub-construct differences between nurses and primary care
paramedics, and between medical laboratory technologists and primary care paramedics. This
implies that each individual construct will not be a good predictor for all three professions.
Both MANOVA and latent variable means suggest significant differences in perceptions
of individual cultural values among nurses, primary care paramedics, and medical laboratory
technologists in Part D. Here also, latent variable means and the post hoc tests disagree on the
differences of the sub-constructs between nurses and medical laboratory technologists, and
between nurses and primary care paramedics.
This study has implications for healthcare administrators who will need to develop
communication and reporting policies that fit these three professions, especially the medical
laboratory technologists. This group exhibits a positive relationship between power distance and
acquiescent silence. These employees might most benefit from a workplace that is conducive to
speaking up and a leader who seriously listens and legitimizes their concerns.

iv
ACKNOWLEDGEMENTS
This work could not be completed without the guidance and support of my advisors and
committee members. Thank you to Prof. Ruth Childs who continually helped me improve my
paper, provided constructive criticism, and pointed out the weakness of my manuscripts.
I wish to acknowledge the Canadian Society of Medical Laboratory Sciences and the
Ontario Society of Medical Laboratory Technologists who informed their members about my
project through e-letters and their magazines without adding any financial burden to this project.
I wish to thank to my relatives and friends who connected me to their network of
registered nurses, primary care paramedics and medical laboratory technologists. Their
assistance enabled this project to maximize its exposure to the healthcare community. Special
thanks go to Zabel Ashukian and Maurice Prindiville, who took time out of their busy schedule
to review and edit this manuscript.
I also need to thank all the participants who spent their valuable time filling the survey.
Your work will not be wasted as I intend to publish my work in your professional journals in the
future.
Lastly, I have to thank my wife who always supports my work and is patiently awaiting
this project to be completed.

v
TABLE OF CONTENTS
ABSTRACT .................................................................................................................................... ii
ACKNOWLEDGEMENTS .......................................................................................................... iv
TABLE OF CONTENTS ................................................................................................................ v
LIST OF TABLES ........................................................................................................................ vii
LIST OF FIGURES ....................................................................................................................... ix
LIST OF ABBREVIATIONS ........................................................................................................ xi
LIST OF APPENDICES ............................................................................................................... xii
CHAPTER ONE: THE PROBLEM .............................................................................................. 1
Background of the Research Problem ..................................................................................... 4
Statement of the Problem ...................................................................................................... 10
Empirical Questions .............................................................................................................. 10
CHAPTER TWO: LITERATURE REVIEW ............................................................................... 12
Values .................................................................................................................................... 12
Culture ................................................................................................................................... 14
Silence in Organizations ........................................................................................................ 35
Psychological Safety ............................................................................................................. 54
Summary of the Literature Review ....................................................................................... 66
Conceptual Framework ......................................................................................................... 67
Hypothesis Development ...................................................................................................... 72
CHAPTER THREE: METHODOLOGY AND PROCEDURES ................................................ 77
Ethical Consideration .............................................................................................................77
Participants ............................................................................................................................ 78
Instrumentation ...................................................................................................................... 79

vi
Managing Data ...................................................................................................................... 81
Statistical Analysis ................................................................................................................ 89
Validation of the Results ..................................................................................................... 105
Conclusion ........................................................................................................................... 109
CHAPTER FOUR: RESULTS ................................................................................................... 112
PART A: The Relationship among Power Distance, Uncertainty Avoidance, Quiescent
Silence, and Acquiescent Silence ........................................................................................ 118
PART B: The Relationship among Competition, Long-Term Orientation, Collectivism,
Prosocial, and Opportunistic Silence ................................................................................... 145
PART C: The Usage of Silence among Professions ........................................................... 156
PART D: The Relationship between Occupations and Individual Cultural Values ............ 168
CHAPTER FIVE: DISCUSSION ............................................................................................... 181
REFERENCES ........................................................................................................................... 202

vii
LIST OF TABLES
Table 1 Dimensions of Silence ......................................................................................................47
Table 2 Decision for Establishing Types of Mediation and Non-mediation ...............................104
Table 3 Participants’ Demographics ............................................................................................113
Table 4 Fit Parameters of the CFA Model for POD, UNA, ACS, QUS, and PSY..................... 121
Table 5 Reliability, Construct Validity and the Unstandardized Correlations among POD, UNA,
ACS, QUS, and PSY ....................................................................................................................122
Table 6 χ2 and CFI Values of Configural and Measurement Invariances ...................................125
Table 7 Pre- and Post-Mediation and Sobel Indirect Effects .......................................................132
Table 8 Bootstrapping Indirect Effects ...................................................................................... 133
Table 9 Standardized Regression Weights of Path Analysis for POD, UNA, ACS, and
QUS ........................................................................................................................................... 137
Table 10 The Effects of Mediation on the Path Analysis ............................................................139
Table 11 Reliability, Construct Validity, and Unstandardized Correlations among COM, PRS,
COL, LTO, and OPS ....................................................................................................................147
Table 12 Comparison of Fit Parameters among the Four CFA Models ......................................148
Table 13 Relationships among COM, COL, LTO, OPS, and PRS for the Three Professions ....155
Table 14 Comparison of Fit Indices between CFA Model 1 and Model 2 for Silence Dimensions
......................................................................................................................................................158
Table 15 Reliability, Construct Validity and the Unstandardized Correlations among Silence
Dimensions ..................................................................................................................................159
Table 16 Tests for Configural and Measurement Invariance ......................................................160

viii
Table 17 Comparison of Mean Values for QUS, PRS, ACS, and OPS among the Three
Professions ...................................................................................................................................162
Table 18 Means, Standard Deviations and Correlation Matrix of OPS, ACS, PRS, and QUS for
the Three Professions ...................................................................................................................163
Table 19 Skewness and Kurtosis of OPS, ACS, PRS, and QUS for the Three Professions ........164
Table 20 Pair-wise Comparisons between Latent Variable Means and Post Hoc Test for the
Silence Dimensions ......................................................................................................................167
Table 21 Goodness-of-Fit Statistics for Tests of Multigroup Invariance ....................................170
Table 22 Reliability, Construct Validity and Unstandardized Correlations among COM, UNA,
and POD .......................................................................................................................................170
Table 23 Comparison of Mean Values for UNA, POD, and COM among the Three Professions
............................................................................................................................................172
Table 24 Means, Standard Deviations, and Correlations among POD, TPOD, COM, TCOM,
UNA, and TUNA .........................................................................................................................173
Table 25 Means and Standard Deviations of the Dependent Variables Pre- and Post-
Transformation of the Three Profession ..................................................................................... 176
Table 26 Levene’s Test with Pre- and Post-Transformation ...................................................... 177
Table 27 Pair-wise Comparison between Post Hoc and Latent Variable Means of ICV
Dimensions, Post-Transformation ...............................................................................................178
Table 28 Comparison between Yoo et al.’s Results and the Current Study on the Mean Values of
ICV Dimensions...........................................................................................................................182
Table 29 Factor Loadings of POD and COM Items from the Literature .....................................183
Table 30 Comparison of Means and Standard Deviations between the Current Study and Knoll
and van Dick’s Study ...................................................................................................................194

ix
LIST OF FIGURES
Figure 1. PSY mediates the effects of POD and UNA on ACS and QUS .................................... 68
Figure 2. The relationships among COL, COMP, LTO, PRS, and OPS ...................................... 69
Figure 3. A graphic representation of MANOVA for a set of three independent variables and
the four silence dimensions ........................................................................................................... 70
Figure 4. A graphic representation of MANOVA for three independent variables and three
Individual Cultural Value dimensions .......................................................................................... 71
Figure 5. Model identification of cultural dimensions .................................................................. 99
Figure 6. Conceptualized model of mediation adapted from Barron and Kenny ....................... 102
Figure 7. Schematic diagram of the investigation ...................................................................... 108
Figure 8. Age distributions of RN, MLT, and PCP groups ........................................................ 115
Figure 9. CFA model of the constructs comprising POD, UNA, ACS, QUS, and PSY ............ 120
Figure 10. Measurement invariant model with regression weights constrained to be equivalent
across groups ............................................................................................................................... 124
Figure 11. The common latent factor model with standardized regression weights and
correlations .................................................................................................................................. 126
Figure 12. The SEM model of the relationship among POD, UNA, ACS, and QUS of the pooled
sample ................................................................................................................................... 128
Figure 13. The mediation model of the pooled sample .............................................................. 131
Figure 14. Relationships among POD, UNA, ACS, and QUS for the RN group ....................... 135
Figure 15. Relationships among POD, UNA, ACS, and QUS for the MLT group .................... 136
Figure 16. Relationships among POD, UNA, ACS, and QUS for the PCP group ..................... 137
Figure 17. The mediation effect of PSY between the dependent and independent variables
for the RN group ......................................................................................................................... 140

x
Figure 18. The mediation effect of PSY between the dependent and independent variables for the
MLT group .................................................................................................................................. 141
Figure 19. The mediation effect of PSY between the relationship of the dependent and
independent variables for the PCP group .................................................................................... 142
Figure 20. The Moderation effect of PSY between the relationship of the dependent and
independent variables of the pooled sample .............................................................................. 143
Figure 21. SEM model of Hypotheses 3A, 3B, 4A, 4B, 5A, and 5B ......................................... 151
Figure 22. SEM model for the relationship among COL, COM, LTO, PRS, and OPS for the RN
group ........................................................................................................................................... 152
Figure 23. SEM model for the relationship among COL, COM, LTO, PRS, and OPS for the
MLT group .................................................................................................................................. 153
Figure 24. SEM model for the relationship among COL, COM, LTO, PRS, and OPS for the
for the PCP group........................................................................................................................ 154
Figure 25. Outline of the investigation for group differences using MANOVA and latent
variable means ............................................................................................................................ 156
Figure 26. CFA structure of the RN group with fixed mean value ............................................ 161
Figure 27. Boxplot of OPS, ACS, PRS, and QUS by profession ............................................... 165
Figure 28. Structured mean model of the RN group ................................................................... 171
Figure 29. Boxplot of the pre-transformation of COM, POD, and UNA by profession ............ 174
Figure 30. Boxplot of post-transformation of COM, POD, and UNA by profession ................. 175

xi
LIST OF ABBREVIATIONS
ACS ................Acquiescent Silence
CA ..................Communication Apprehension
CFA ................Confirmatory Factor Analysis
CFI .................Comparative Fit Index
CLF ................Common Latent Factor
CBCA ............Context-based Communication Apprehension
COL................Collectivism
COM .............Competition
EFA ................Exploratory Factor Analysis
FOC ...............Felt Obligation for Constructive Change
GLOBE .........Global Leadership and Organizational Behavior Effective Research
ICV .................Individual Cultural Values
LTO ................Long-term Orientation
LVM ..............Latent Variable Means
MLE ..............Maximum Likelihood Estimation
OBSE ............Organization-based self-esteem
OPS ................Opportunistic Silence
OS .................Organizational Silence
PA .................Psychological Availability
PGCA .............Person-group Communication Apprehension
PM .................Psychological Meaningfulness
POD ...............Power Distance
PRS ...............Prosocial Silence
PSY ...............Psychological Safety
QUS................Quiescent Silence
SCA ...............Situational Comprehension Apprehension
SEM ..............Structural Equation Modeling
TLCA ............Trait-like Communication Apprehension
UNA ..............Uncertainty Avoidance
VC .................Voice Climate

xii
LIST OF APPENDICES
Appendix A Questionnaire ......................................................................................................... 227
Appendix B Descriptive Statistics of Questionnaire Items......................................................... 233
Appendix C Correlation Matrix for variables investigated in Part A ......................................... 235
Appendix D EFA Patterns of QUS, UNA, ACS, POD, and PSY............................................... 237
Appendix E Comparison of Standardized Regression Weights between MLE and Bootstrapping
Technique (Part A) ...................................................................................................................... 238
Appendix F Standardized Regression Weights of Pre- and Post-Common Latent Factor ......... 239
Appendix G Moderation Effects ................................................................................................. 241
Appendix H Correlation Matrix for variables investigated in Part B ......................................... 243
Appendix I EFA model of PRS, LTO, COL, COM, and OPS ................................................... 245
Appendix J CFA patterns of PRS, LTO, COL, COM, and OPS ................................................ 246
Appendix K Comparison of Standardized Regression Weights between MLE and Bootstrapping
Technique (Part B) ...................................................................................................................... 247
Appendix L CFA-CLF of Part B ................................................................................................ 248
Appendix M Comparison of Standardized Regression Weights of Pre- and Post-CLF of LTO,
COL, COM, OPS and PRS ......................................................................................................... 249
Appendix N Correlation Matrix for variables investigated in Part C ......................................... 250
Appendix O EFA Pattern of QUS, PRS, ACS, and OPS ............................................................ 252
Appendix P CFA Model of the Silence Dimensions .................................................................. 253
Appendix Q Common Latent Factor for Silence Dimensions .................................................... 254
Appendix R Comparison of Standardized Regression Weights of Pre- and Post-CLF of QUS,
PRS, ACS and OPS..................................................................................................................... 255
Appendix S Correlation Matrix for variables investigated in Part D .......................................... 256

xiii
Appendix T The EFA Pattern Matrix of UNA, POD, and COM ............................................... 257
Appendix U CFA Model of Part D ............................................................................................. 258
Appendix V Comparison of Standardized Regression Weights between MLE and Bootstrapping
Technique (Part D) ...................................................................................................................... 259
Appendix W CFA-CLF of UNA, COM, and POD ..................................................................... 260
Appendix X Comparison of Standardized Regression Weights Pre- and Post-CLF .................. 261

1
CHAPTER ONE: THE PROBLEM
In 2000, the Institute of Medicine (IOM) reported in To Err is Human that 2.9 percent of
hospitalized patients in New York and 3.7 percent in Colorado and Utah experienced adverse
medical events (Kohn, Corrigan, & Donaldson, 2000). In New York hospitals, 13.6 percent of
adverse events led to death, as compared to 6.6 percent in the Colorado and Utah hospitals.
When extrapolated to 33.6 million admissions to hospitals in the United States, the results
suggest that between 44,000 and 98,000 Americans die each year as a result of medical errors.
Even using the lower estimate, the number of deaths in hospitals due to medical errors is higher
than the number from motor accidents, breast cancer or AIDS. In the same report, the authors
recommend several methods to improve patient safety practices, including identifying and
learning from errors through mandatory and voluntary error reporting. The IOM hoped that its
recommendations would encourage healthcare workers to report adverse events without fear of
reprisal, humiliation, and punishment from coworkers, and supervisors.
In spite of the recommendations and even though hospitals in the US have been able to
reduce medical error rates by 12.5 percent through the adoption of computerized order entry
systems (Radley et al., 2013), almost 15 years later, the healthcare sector is still troubled with the
same issues. For example, the Joint Commission Center for Transformation Healthcare reported
that wrong site surgery occurred 40 times a week in 2011 (Crane, 2011). The Office of the
Inspector General stated that hospital employees failed to report 86 percent of incidents that
could harm patients (Levinson, 2012). The most recent survey of labor and delivery teams found
that while 92 to 98 percent of physicians, midwives, and nurses observed at least one incident of
unsafe practice among their colleagues, only 9 percent of physicians and 13 percent of midwives
and nurses confronted their coworkers (Maxfield, Lyndon, Kennedy, O'Keefe, & Zlatnik, 2013).

2
A cohort study of five provinces in Canada found that 7.5 percent (range 5.65 -9.25) of
patients in acute care hospitals experienced an adverse event (AE), among 2.5 million
admissions in the year 2000. Among these AEs, 6.5% to 10.2% resulted in deaths, which means
that between 9,250 and 23,750 people died from preventable medical errors (G. R. Baker et al.,
2004). More recent research from the University of Montreal in Quebec showed that 15.3% of
hospitalized patients in the province encountered AEs attributed to nursing care (D'Amour,
Dubois, Tchouaket, Clarke, & Blais, 2014). The study looked at six issues that could contribute
to the AEs: pressure sores, falls, medication administration errors, pneumonia, urinary tract
infections, and inappropriate use of restraints. Laboratories also contributed to AEs. Research in
the US suggested that 0.4% to 6.4% of all AEs came from the diagnostic services. There are
multiple sources that contribute to these errors, from the pre-analytical stage (sample condition,
insufficient sample, incorrect labelling) to the analytical stage (sample mix-up, equipment
malfunction) and to the post-analytical stage (reporting, improper data entry, turn-around time)
(Kalra, Kalra, & Baniak, 2013). A survey of the Canadians who had laboratory work done
showed that 4% of them had been given incorrect results of diagnostic or laboratory tests
between 2006 and 2007 (O'Hagan, MacKinnon, Persaud, & Etchegary, 2009). A high profile
example related to laboratory error appeared in the Toronto Star in 1999, when a well-known
singer, Sharon Hampson, was misdiagnosed as having cancer, and had 15 lymph nodes removed
at Sunnybrook and Women’s College Health Science Centre (McIver, 2001).
There were no data available to learn about the adverse events in the paramedical group.
Primary care paramedics perform several high profile procedures where mistakes could lead to a
loss of life. This includes identification of early stroke protocols and myocardial infarction,
cardiopulmonary resuscitation, and intubation. Research suggests that many primary care

3
paramedics lack the adequate skills needed for intubation procedures and electrocardiogram
interpretation (Bigham et al., 2011; Wang, Lave, Sirlo, & Yealy, 2006; B. Williams & Boyle,
2008).
Similarly to the US, Canadian health care workers are reluctant and afraid to speak up for
fear of retaliation and lawsuits. Nurses who attempted to warn their supervisors of medical errors
and negligent nursing care have been ignored and dismissed as personal conflicts (McIver,
2001). A culture of silence is created and patients’ families are not even aware that mistakes
have happened until medical inquests are done. As a father of a child said, “my right to serve my
child’s best interest was stolen from me by lies and misrepresentation” (as cited in McIver,
2001).
The issue of employee silence in the healthcare setting is not unique to North America. In
Queensland, Australia, an incompetent head surgeon has been implicated in the death of eight
patients. The professional incompetence and gross negligence of this head surgeon had been
noticed by subordinate physicians, but they opted to remain silent, being fearful of losing their
jobs (Greenberg & Edwards, 2009; Sandall, 2005). “Doctor Death”, as the nursing staff called
him, was not only incompetent in the surgical procedures, but was also notoriously indifferent to
hand washing hygiene which caused fatal infections (Sandall, 2005).
The healthcare sector is not the only industry that suffers from the consequences of
employee silence. The US National Transportation Safety Board (NTSB), which investigated the
plane crash of United Airlines Flight 173 in 1979, suggested that two flight crew members
contributed to the accident by failing to communicate their concern about the criticality of the
fuel levels to the captain (J. B. King, Driver, McAdams, & Hogue, 1979). In the case of the
space shuttle Challenger disaster, an engineer who was afraid of a catastrophe resulting from an

4
O-ring failure in cold weather remained silent at the teleconference in the evening prior to the
morning launch of the space shuttle (Bergin, 2007; Vaughan, 1998). The Columbia disaster is
another example resulting from employee silence. The engineers made requests for the images of
the left wing so they could assess the severity of the damage done by the 1.7 pounds of foam
debris that struck the carbon panel. If those engineers had relentlessly persisted in their request
for imagery assessment, they might have been able to repair the damaged wing and save the lives
of seven astronauts (Farjoun & Starbuck, 2005).
Why do employees remain silent? Researchers have been looking for the reasons in
various disciplines such as personal psychology, communication, and organizational behaviour.
However, there has been no study on the relationship between individual cultural values and
employee silence in the healthcare professions. This investigation intends to fill the gap and
contribute to the literature.
Background of the Research Problem
This investigation studies the relationship among three constructs: employee silence,
psychological safety, and individual cultural values, which will be briefly discussed in this
section, and at more length in the literature review. This chapter also provides statements of the
problem and empirical questions that form the basis for hypotheses in the research.
Employee silence is “the withholding of any form of genuine expression about the
individual’s behavioral, cognitive and/or affective evaluations of his or her organizational
circumstance to persons who are perceived to be capable of effecting change or redress” (Pinder
& Harlos, 2001, p. 334). Past research on employee silence explored the motives for silence; for
example, Van Dyne, Ang, and Botero (2003) and Knoll and van Dick (2013b) categorized
silence into three broad types . Acquiescent silence is keeping one’s opinion to oneself because
5
of resignation and disengagement; prosocial silence withholds information for fear of seeming to
be uncooperative; quiescent (or defensive) silence is motivated by fear; and opportunistic
silence, recently added by Knoll and van Dick (2013b), offers no help or advice to coworkers
who are about to commit mistakes. Brinsfield (2013) categorized silence into six dimensions:
relational, defensive, diffident, disengaged, ineffectual and deviant. Brinsfield’s (2013) relational
and deviant dimensions are similar to Knoll and van Dick’s (2013b) prosocial and opportunistic
silence. Brinsfield’s diffident and defensive become quiescent silence, and the disengaged and
ineffectual silence types become acquiescent silence.
Investigators have studied the relationships between organizational silence and two types
of fairness: procedural justice and distributive justice. Procedural justice refers to the fairness of
the decision making procedures that lead to outcomes. Distributive justice is the fairness in
distribution of resources (Colquitt, Greenberg, & Zapata-Phelan, 2005). Tangirala and
Ramanujam (2008) reported that work group identification and professional commitment were
negatively related to employee silence among nurses (that is, less employee silence occurred
where there was strong group identification and professional commitment), and that procedural
justice contributed to and increased employee voice in the organization. Another team of
researchers (Khan, Quratulain, & Crawshaw, 2013) found that procedural injustice led to sadness
and withdrawal, but distributive injustice (fairness of resource distribution such as pay, rewards,
and promotion) made employees angry, abusive, and defiant. Some investigators also focused on
the whistleblower, finding that management and coworkers sometimes punish the offenders by
ostracism, which results in social exclusion, or the silent treatment (maintaining silence toward
another as a means of rejection) in organizations (Lustenbuerger & Williams, 2009).

6
Leadership openness appears to encourage voice among silent employees (Knoll & van
Dick, 2013b; Kopald, 2012). However, Sumanth (2011) warned readers that even though
inclusive leadership increased voice in organizations, it could diminish communication quality.
Leadership alone may not be able to induce employees’ voice. Culture also influences silent
behaviour.
Every year, hundreds of thousands of immigrants come to the US and Canada to seek a
new life (Migration Policy Institute, n.d.; Ministry of Citizenship and Immigration, 2013). They
spread their cultures as well as absorbing host cultures and modifying the host cultures to fit their
ways of life. Thus, culture is not static, but is in a continuing state of flux. This study defines
culture as “the complex system of meaning and behavior that defines the way of life for a given
group or society. It includes beliefs, values, knowledge, art, morals, laws, customs, habits,
language, and dress, among other things” (M. L. Anderson & Taylor, 2011, p. 27). Studies have
shown that individuals raised in cultures which emphasize group wellbeing over individual
wellbeing, such as in India, Japan and Korea, prefer silence or indirect communication (Kapoor,
Hughes, Baldwin, & Blue, 2003; Lustig & Koester, 2006; Neuliep, 2012). A study in New
Zealand found that a majority of Chinese students failed to articulate their complaint of
dissatisfaction (FitzPatrick, Davey, & Dai, 2002). In Swaziland, there is a tendency to be
suspicious of those who talk excessively (Lustig & Koester, 2006), and as a result silence is a
common means of communication.
Cultural values influence people’s perceptions and shape their worldviews. As Schwartz
(1999) puts it, “Cultural values represent implicit or explicit shared abstract ideas about what is
good, right, and desirable in a society” (p. 25). Multinational corporations have tried to
understand employees’ values and beliefs through surveys of employees in their subsidiary

7
companies across the globe. The aim of these studies is for international management and cross
cultural leadership (Builtjens & Noordehaven, 1996). Hofstede (2001), who conducted a survey
for IBM consisting of 72,215 employees in 71 countries between 1967 and 1973, identified four
cultural value dimensions: power distance, uncertainty avoidance, masculinity/femininity, and
individualism/collectivism. In 1987, He added long-term orientation after he learned that
dimension correlated with economic growth. These five cultural dimensions are defined below.
1. Power distance (POD) is “the extent to which the less powerful members of
institutions and organizations within a country expect and accept that power is
distributed unequally” (Hofstede, Hofstede, & Minkov, 2010, p. 61).
2. Uncertainty avoidance (UNA) compels people to be resistant to change, and to avoid
considering alternatives. Uncertainty avoidance is the extent to which people feel
threatened by ambiguous situations. Individuals with high UNA scores feel
threatened by unknown situations that could lead them to stressful feelings like
anxiety and nervousness.
3. Masculinity/femininity now would be considered gender stereotyping, but was less
controversial when Hofstede devised the term more than 40 years ago (The Hofstede
Centre, n.d.). Newer labels for the dimension are competitive versus cooperative
(Akkermans, Harzing, & van Witteloostuijn, 2009), human orientation (Javidan,
House, Dorfman, Hanges, & de Luque, 2006), quantity versus quality of life (Bennett,
1999), and assertive versus nurturant (Boeree, 2007). In this paper I will use the term
competitive (COM), referring to the extent to which the dominant values of society
are assertiveness, and competitiveness, where winning is important. In contrast,

8
societies that are low on the COM dimension prefer cooperation and good
relationships in the workplace.
4. Collectivism (COL) refers to societies that prefer solidarity, loyalty, and tolerance.
Societies that are low on COL are “societies in which the ties between individuals are
loose: Everyone is expected to look after him- or herself and his or her immediate
family” (Hofstede et al., 2010, p. 92).
5. Long-term Orientation (LTO) emphasizes saving for the future, and being willing to
maintain efforts toward slow results.
Hofstede used mean responses for each country as the unit of analysis (Dorfman &
Howell, 1988). There were several problems with Hofstede’s study, both methodological and
conceptual. In fact he only used mean values of 50 countries to conduct factor analysis of thirty
two items. The small ratio of observations to variables (50/32) is below the minimum of Hair et
al.’s (2010) recommendation of 5 to 1. Also, by using country means, Hofstede simply assumed
that cultural values were homogenous within countries, rather than testing this idea empirically.
His study provides no evidence on individual variation in cultural values within vs. between
countries.
Hofstede et al. (2010) defined culture as “the collective programing of the mind that
distinguishes the member of one group or category of people from others” (p. 6). Other
researchers have found this definition of culture problematic but have found the cultural value
dimensions useful when applied at the individual level rather than the group level (Harris, 1993;
Mancheno-Smoak, Endres, Polak, & Athanasaw, 2009). Yoo and Donthu (1998) applied
Hofstede’s cultural typology at the individual level in their study of the cultural influence on
service quality expectations. They argued that the term culture is not synonymous with the term

9
country. In other words, the values of an individual can be identified in terms of the selected
dimensions of culture. In addition, it seems possible that Hofstede’s research was more accurate
in the past (1960s – 1970s) when societies were more culturally homogeneous, but outdated now.
Fischer and Poortinga (2012) examined the similarities of the personal and social cultural value
structures and concluded that “we have found no evidence to suggest that individual and cultural
value dimensions should be treated as distinct” (p. 166), indicating that cultural values should be
studied at the individual level. Other investigators who used Hofstede’s typology of cultural
dimensions at the individual level are Dorfman and Howell (1988) for dimensions of culture and
leadership, and Yoo and Donthu (2002) for the effects of marketing education and individual
cultural values, and Mancheno-Smoak et al. (2009) for the relationship of individual cultural
values and job satisfaction. Following this body of recent literature, the present study will also
consider cultural values to be individual-level characteristics and will use some of the
dimensions from Hofstede’s typology.
Schein (1990) was the first person to hypothesize the importance of psychological safety
(PSY) in the workplace; he suggested that organizations can use it to alleviate employees’ fear of
learning new skills. Edmondson (1999) tested the hypothesis in her study of work teams and
learning behaviours in a furniture manufacturing firm. PSY is defined as “the general belief that
one is comfortable being oneself – to be open, authentic, and direct – in a particular setting or
role” (Nembhard & Edmondson, 2012, para. 6). Edmondson, Bohmer, and Pisano (2001)
suggested that PSY encourages employees to adopt new behaviours, promotes shared meaning,
and develops process improvement. Eggers (2011) asserted that PSY influences relationship
behaviour and promotes trust and healthy exchange of information between leaders and

10
followers. These would lead to process improvement, effective problem-solving, and decision
making.
Statement of the Problem
To date, there is no study examining individual cultural value differences with respect to
the prevalence of employee silence in organizations in European and North American countries.
This study will investigate the relationship between individual cultural values and the four
dimensions of employee silence: prosocial, opportunistic, acquiescent, and quiescent. The results
may help organizational leaders better understand silence in organizations. It will also examine
whether psychological safety – that is, a shared belief that the work unit is “safe for interpersonal
risk taking” (Edmondson, 1999, p. 354) – can play a mediating role between the cultural values
and acquiescent silence, and cultural values and quiescent silence. In addition, it will compare
profiles on the dimensions of employee silence of three healthcare professions: nurses, primary
care paramedics, and medical laboratory technologists.
Empirical Questions
Individuals vary and some of the variation may be related to differences in the cultural
norms with which they identify. Studies of cultures and human behaviours have shown in the
literature that individuals with certain cultural values do not express their opinions and feelings
when they disagree with their superiors and coworkers. In many cases, silence occurs because
subordinates are intimidated, and threatened. The laws that are intended to protect employees
from retaliation for disclosure of employers’ wrongdoing (Whistleblower Protection Act in the
US and Public Interest Disclosure Act in the UK and in Canada) appear ineffectual because they
only apply to employers’ wrongdoing. The Criminal Code does not protect employees who
report other employees’ wrongdoing. For the interest of the organizations, Edmondson (2004b)

11
advised leaders to provide conditions that support psychological safety for employees to voice
their opinions.
Currently there are many professions (nurses, pharmacists, business administrators, and
physicians) that occupy the chief executive position in the hospitals. However, from the
viewpoint of social structure, the hospital sector is designed as a top-down bureaucracy, with
physicians at the top of the hierarchy of caregivers (Ballatine & Roberts, 2012; Brown, 1961).
Nurses, medical laboratory technologists and primary care paramedics are the three professions
that operate in the middle of the hospital hierarchical system. Therefore psychological safety
can play an important role between individual cultural values and employee silence. For these
reasons, this study asks four research questions:
1. Do employees’ cultural values have any relationship with the use of silence in an
organization?
2. Does psychological safety mediate the relationship between individual cultural values
and employee silence?
3. Does the use of silence differ among nurses, primary care paramedics, and medical
laboratory technologists?
4. Does employees’ self-rating of individual cultural values differ among nurses, medical
laboratory technologists, and primary care paramedics?

12
CHAPTER TWO: LITERATURE REVIEW
This chapter comprises three related parts: literature review, conceptual framework and
hypothesis development. The literature review examines the issues of values, culture, silence in
organizations, and psychological safety. It also looks at current measures for individual cultural
values, and employee silence. The second part explains the conceptual framework of the
investigation; the last part provides hypotheses and their rationales.
Values
All human societies develop norms and values concerning their desirable mode of
conduct and obligations for what are desirable or undesirable. Values comprise knowledge and
beliefs, and are defined as “an enduring belief that a specific mode of conduct or end-state of
existence is personally or socially preferable to an opposite or converse mode of conduct or end-
state of existence” (Rokeach, 1973, p. 5). When values are internalized, they become our guiding
criteria for our actions, consciously, and unconsciously. Values are instrumental when they lead
us to believe that certain modes of conduct are personally and socially desirable. They are
internalized when values tell us that a certain end state of existence is worth striving for.
Rokeach (1973) spent several years conducting research on human values in the United States
and presents his findings of 18 terminal and 18 instrumental values. There are many more, but he
only selected those with high correlations (r = .45 to .72) based on test-retest reliabilities. Some
of the terminal values are prosperity, accomplishment, equality, freedom, happiness, harmony,
self-respect, and social recognition. The instrumental value examples are ambition,
broadmindedness, capability, honesty, independence, obedience, politeness, responsibility, and
self-control. With regard to human beliefs, Rokeach (1973) distinguishes them into three types
based on existential beliefs (true/false), evaluative beliefs (good/bad), and prescriptive beliefs
13
(desirable/undesirable). By the time we become adults, we have countless beliefs concerning
physical and social realities (Rokeach, 1972). When we organize several beliefs on specific
objects we develop attitudes toward objects, which make us respond in specific ways toward
related physical objects or social situations. Therefore, humans do not differ from one another
based on the possession of particular or terminal values, “but in the way they organize them to
form value hierarchies or priorities” (Rokeach, 1979, p. 49). These value hierarchies or priorities
are guiding principles that lead to individual values.
Inglehart (1997, 2012) investigated the World Value Survey (WVS) that began in 1981
from 22 to 97 societies in 2007, covering almost 90% of the world population. WVS uses a
common questionnaire to study economic development, democratization, religion, gender
equality, social capital, and subjective well-being. The author used the information to focus on
the shift from “Materialist” values (economic and security) to “Postmaterialist” priorities (self-
expression and quality of life). Based on theories of scarcity and socialization, he suggests that
societies gradually change when the younger generation replaces the old. For example, during
World War I and II, people looked for order and strong leaders and during economic hardship
and recession, their priority is economic growth. Once the security returns, they deemphasize
political authority and are more concerned with quality of life rather than long working hours for
income security. In the latest survey, Inglehart and Welzel (World Values Survey, 2015) showed
how countries and regions have gradually shifted their values based on traditional vs. secular
(TS) and survival vs. self-expression (SS). In the English speaking cluster of countries (Ireland,
North Ireland, USA, Canada, Australia, New Zealand and UK), Australia has shifted from weak
tradition to weak secular from 1996 to 2015. Over the same period, Canada maintains its balance
on the TS scale, but shifts itself more to self-expression. Under the Confucian system, Taiwan

14
had a lower secular value in 1996 than Korea; however, by 2008 it surpassed Korea under the
same scale. The Netherlands used to have stronger self-expression values than Finland, but has
now decreased its score, and the two countries are now in close rank. The country that breaks
away from their own cluster is the Philippines, which was in the South Asian group and now
joins the Latin American cluster as a result of value changes from weak survival to weak self-
expression (World Values Survey, 2015).
Other scholars use different dimensions to categorize human values. Schwartz (1999,
2004) factors values into seven dimensions. Autonomy refers to individuals who believe in their
own feelings, ideas, and abilities. It is further divided into pursuing one’s own ideas (intellectual
autonomy) and pursuing affectively positive experiences (effective autonomy). Embeddedness
(conservatism) refers to those who prefer to maintain the status quo and avoid disrupting group
solidarity. Egalitarianism is a moral value that recognizes equality among individuals.
Egalitarians believe in social justice, responsibility, and honesty. Hierarchy, on the contrary,
implies the unequal distribution of power, role, wealth, and resources. Harmony emphasizes
appreciation of nature, peace and protecting the environment. The last cultural value, mastery,
focuses on changing the natural and social environment to achieve personal and group goals.
One of the large scale survey projects that applies Schwartz’s values concept is the Global
Leadership and Organizational Behavior Effectiveness Research program (GLOBE) which
studies 62 societies throughout the world.
Culture
Culture has many definitions. More than 300 different definitions have been identified in
the last 50 years (Neuliep, 2012). Definitions of culture usually contain values and beliefs in
their descriptions. For example, Boyd and Richerson (2005) defined culture as “information –
15
skills, beliefs, values – capable of affecting individuals’ behavior, which they acquire from
others by teaching, imitation, and other forms of social learning” (p. 105). For Lustig and
Koester (2006), “culture is a learned set of shared interpretations about beliefs, values, norms,
and social practices, which affect the behaviors of a relatively large group of people” (p. 25).
Neuliep (2012) defines it as “an accumulated pattern of values, beliefs, and behaviors, shared by
an identifiable group of people with a common history and verbal and nonverbal symbol system”
(p. 19).
Hofstede et al.(2010) defined culture as “the collective programing of the mind that
distinguishes the members of one group or category of people from another” (p. 6). Culture
directs our perceptions, interpretations, and actions to the external world. The definition
compared culture to computer software that directs people to act under various circumstances.
Implicit to this notion is that belief guides behaviour; however, behaviour can change belief as
well. In this study I use M.L. Anderson and Tylor’s (2011) definition, “Culture is the complex
system of meaning and behavior that defines the way of life for a given group or society” (p. 27).
It has a broader scope that includes beliefs, values, knowledge, art, morals, laws, customs, habits,
language, and dress, among other things. This study, however, focuses on the cultural values that
represent “implicit or explicit shared abstract ideas about what is good, right, and desirable in a
society. These cultural values (e.g. freedom, prosperity, security) are the basis for the specific
norms that tell people what is appropriate in various situations” (Schwartz, 1999, p. 25). The
individual cultural value is the individual’s perception of culture as their personal values. “It will
be based on the individual’s perceptions of cultural dimensions and the respective value
significance such that nationality is not a direct determinant of this cultural orientation”

16
(Mancheno-Smoak et al., 2009, p. 12). The perception of cultural dimension can change over
time through the diffusion process (Vago, 1999).
One popular approach to cultural study is to conceptualize it as the layers of an onion.
The outer covering membrane is equivalent to symbols such as words, gestures, pictures or
objects with particular meanings (Hofstede, 1984). The next layer contains the heroes of the
culture who could be alive, dead, real or imaginary characters. This is followed with the layer of
rituals, such as greetings, paying respect, and religious ceremonies. The innermost layer of
culture, values, is not visible to the observer. Values are the preference for situations that deal
with pairing, for example: good versus evil, beautiful versus ugly, and moral versus immoral.
Individuals exhibit their symbols, heroes, and rituals through their practices, which are visible to
external observers. People absorb values and practices early in life from families, schools and
workplaces.
Hofstede’s (2001) research came from his survey done as a consultant for IBM in the late
1960s and early 1970s. He faced many criticisms from scholars, such as the ratio of sample size
to items (Dorfman & Howell, 1988), academic freedom (Javidan et al., 2006; R. V. Robinson,
1983), participant selection (R. V. Robinson, 1983), and gender bias (Moulettes, 2007).
In his study, Hofstede (2001) applied factor analysis to the IBM employees’ responses,
and named the four dimensions power distance, uncertainty avoidance, individualism versus
collectivism, and masculinity versus femininity. The four dimensions were later replicated with
data from over 9000 pilots from 26 airlines in 19 countries in 1993 (Merrit, 2000). Hofstede later
added another dimension, long-term versus short-term, after Canadian scientist Michael Harris
Bond (1988) identified this dimension (originally called Confucius dynamism) in the Chinese
population. Individuals may have different scores for each dimension.

17
Power Distance
In many countries people acknowledge that leaders should have more authority, power,
and privileges. Power distance is “the degree to which members of an organization or society
expect and agree that power should be stratified and concentrated at higher levels of an
organization or government”(House & Javidan, 2004, p. 12).
One important feature of power distance is social order. People with a high power
distance score are willing to accept the authority of their leaders. Power holders are entitled to
privileges, seniority is important, and older people are respected and feared. In the family,
children respect and are obedient to their parents. At school, teachers are at the centre, and
initiate communication in the class. Students expect teachers to come up with answers to their
queries.
Power distance (POD) is negatively correlated to voice, suggesting that employees who
strongly believe in POD would stay silent. In field studies to learn about employees’ reaction to
negative workplace situations, Park (2011) reports that workers in countries with high POD and
high collectivism, such as Korea, use face-saving and conflict avoidance as a response to poor
working conditions. Park’s study gains support from Yoon (2012) who agrees that POD is
negatively associated with employee voice. A meta-analysis of 26 empirical studies also
confirms that individuals with high POD are sensitive to face-saving concerns, prefer indirect
communication, and have a low propensity to interrupt others (Merkin, Taras, & Steel, 2014).
Employees in a society with high POD tend to agree with their employers as they are socialized
not to contradict their bosses. The way to get their participation and help them become more
productive is through formalized employee involvement activities (X. Huang, van de Vliert, &
van der Vegt, 2005). This finding does not apply to empowered leaders, as POD appears to

18
increase their voices and performances (Yoon, 2012). From the perspective of leaders, managers
in high POD cultures do not really discount the evaluation or advice of their followers. A study
of managers’ reactions to 360-degree feedback indicates that it is the educational background of
the managers that makes them view the feedback appraisal as a positive, non-threatening
process. The cultural background of the managers, whether they come from low, medium or high
POD, has no effect on whether they adopt feedback information (Nash, 2005). Yet, senior
managers with high POD are more likely to impose tighter supervision styles, and prefer
centralizing the decision-making process as well as indirect communication. Managers with high
POD also behave like father figures that need to take care of their employees (Lu & Lee, 2005).
Countries and people with low POD exhibit the opposite characteristics, such as parents
treating children as equals and vice versa. Children speak up in class, and they treat teachers as
equals. In the workplace, low POD countries have flat organizational structures, and decentralize
decision making to lower levels in the hierarchy. Managers rely on personal experience and are
expected to consult subordinates (Carl, Gupta, & Javidan, 2004).
The concept of POD was derived from three main items in Hofstede’s (2010) survey
questionnaire at the national level: (a) non-managerial employees’ perception that employees are
afraid to disagree with their managers, (b) employees’ perception that their bosses make
decisions in an autocratic way, and (c) subordinates’ dislike of a consultative style of decision
making by their bosses. Results suggested that people in Malaysia scored the highest on POD
followed by Guatemala, Panama, Philippines, and Mexico. South Korean and Japanese scores
are in the middle. The US, Canada, Great Britain and Austria are at the lower end of the scale.
There is research that studied the association of POD to various indices at the national
level: for example, POD and income inequality (r = .42), POD and accident rates (r =.68), POD

19
and government transparency (r = -.55), and POD (low and high) and balance (balanced,
unbalanced) of power in government [(χ2(1, n = 50) =18.1, p < .01] (Hofstede, 2001).
There was a study that links Hofstede’s cultural values to personality traits. This study
using self-reporting indicated that POD is negatively correlated with extraversion, but positively
correlated with conscientiousness (Migliore, 2011). Another study of personality traits using peer
reports found negative correlations between POD and extraversion (r = -.41), POD and .openness
(r = -.49), and POD and agreeableness (r = -.41) (Minkov, 2013).
Since the publication of To Err is Human, hospitals around the world have become aware
of the medical error issues in healthcare institutes. A study in Taiwan identifies fear, saving face,
POD, and administration as barriers to reporting medication administration errors. One reason
that POD becomes a barrier is the fear that the authority will impose a penalty on employees.
Senior staff members do not welcome bad news and often react negatively to them when
employees report errors (Chiang, 2005). A more recent study of safety climate in a Chinese
hospital in Shanghai confirms a previous report which suggests that POD is negatively correlated
with self-report rate of accidents. Compared to their counterparts in Japan, Chinese physicians
and nurses show less error awareness but more safety awareness. Compounded with a lack of
communication between staff and their superiors, this study identifies that hospital administrators
have to revise their punitive system to encourage error reporting (X. Gu & Itoh, 2011).
Researchers found that the Filipino nurses who work in the US have lower POD than
nurses who live in the Philippines. However, Filipino nurses still show significantly higher
scores than their US born counterparts, even though 80 percent of this group of participants has
been working in US hospitals between 12 and 25 years (Poliko-Harris, 1995). In normal
circumstances, minorities adopt cultural attributes of the dominant group through a diffusion
20
process. This study indicates that acculturation of POD occurs slowly. It confirms Margaret
Mead’s observation that it is more difficult to splice two cultures than to adopt the new one in its
entirety (Vago, 1999).
Uncertainty Avoidance
Uncertainty avoidance (UNA) compels people to be resistant to change, and to avoid
considering alternatives. Uncertainty avoidance is the extent to which people feel threatened by
ambiguous situations. Individuals with high UNA scores feel threatened by unknown situations
which could lead them to stressful feelings like anxiety and nervousness. High UNA individuals
avoid ambiguous situations and tend to look for structure in their organizations to help them
interpret the events occurring in the workplaces, such as policies, rules and procedures. They are
sensitive to losing face and less open in their communication (Merkin et al., 2014). Children with
high UNA parents are more likely to learn that the world is hostile, and are taught to be cautious
when speaking with strangers (Hofstede et al., 2010).
On the contrary, individuals with low UNA have more tolerance towards ambiguity,
believe in common sense, and like flexible working hours. Children who grow up in a low UNA
household face few rules and accept non-traditional gender roles (Hofstede et al., 2010).
Although high UNA individuals prefer to work under stable conditions, Geletkanycz (1997)
found a reversed relationship between high UNA top executives and commitment to the status
quo. This counterintuitive finding could be explained (even though the executives were
comfortable with the status quo) if we assume that top executives acknowledged that they had to
be adaptive to the changing environment. Baker and Carson’s (2011) research illustrated the
strategies that high UNA executives applied in order to reduce risks. One strategy was
attachment through identification with the work group and modeling their behaviour after group

21
norms: for example, feeling successful when the company succeeds. Another method that high
UNA executives used was being proactive in dealing with changes that could threaten their
success.
Hofstede (2001) employed three questions to study uncertainty avoidance dimensions:
job stress, rule orientation, and the length of employment at IBM. The countries in which the
employees exhibited high UNA scores are Greece, Portugal, and Guatemala and those in the
group with low scores are Singapore, Jamaica, Denmark, and England. USA and Canada have
mid scores.
Using a questionnaire that comprises two manifestations of cultures, modal practice and
modal values, Javidan, House, and Dorfman (2004) found conflicting results. Modal practice
questions ask “what is” or “what are” common institutional practices. Modal values questions
ask participants to respond to “what should be”. With the modal values questionnaire they found
negative correlations between the cultural UNA value and economic prosperity (r = .80), and
between UNA and competitiveness index (r = -.49). With the modal practice questionnaire they
found positive correlations between UNA and economic prosperity (r = .60) and between UNA
and World Competitive Index (r = .60).
Pyc (2011) found that, at the individual level, high UNA nurses experience high anxiety
and even depression when working under abusive supervisors. One method that can alleviate
employee anxiety is job autonomy, where employees can make their decisions, and control their
work demands (Pyc, 2011).
According to Furnham (2006), UNA is identical to intolerance of uncertainty (IU), a
personality trait that was identified during the study of German Nazis after World War II. A
study among a selected group of Filipino elderly identifies four factors that lead to IU behavior.

22
The perfection-driven uncertainty individuals cannot stand being taken by surprise because it
makes them feel vulnerable, and unable to act with certainty. The apprehension-driven
uncertainty individuals feel anxious, stressful, and paralyzed by uncertainty. Individuals with this
type of IU appear to be in a higher state of anxiety in comparison to the perfection-driven
individuals. People with avoidance-driven uncertainty try to get away from uncertain situations
as they cannot move forward without knowing what is going to happen. The mildest form of IU
is the negative-driven uncertainty, which prevents individuals from having a firm opinion. All
these types of uncertainty have positive correlations with worry and depression (N. L. Anderson,
2013; de Guzman, 2015). One mechanism that people deploy in order to cope with uncertainty is
to avoid unpleasant or painful feelings. Avoidance of uncertainty exhibits itself in different ways.
Employees may try to withdraw from difficult situations in order to avoid confrontation. Another
type of avoidance is to deny distressing thoughts, which could happen when work environments
create uncertainty such as with layoffs during corporate downsizing. The former is known as
behavioural avoidance and the latter is cognitive avoidance. The third type, experiential
avoidance, exhibits both symptoms of the first and the second types. One study found that all
types of avoidance are good predictors of anxiety and depression symptoms (N. L. Anderson,
2013).
Collectivism
In societies where three or four generations of family members live together, children
learn how family members depend on each other, and put the interest of the group over self-
interest. In Korean and Chinese societies, people feel obligated to look after their elderly parents,
and to extend love and support beyond immediate family members. Confucianism has five moral
codes to regulate human relationships: the loyalty code for relationships between king and
subject or employer and employee, the closeness code for fathers and sons, the orders code for

23
elders and the young, the distinction in duty code for husband and wife, and the faith code
between friends (McDevitt, 2007). A collective society also calls for greater emotional
dependence of members on their organizations and, in return, for organizations to assume
broader responsibility for their members. Staying with one company is desirable and knowing
the right people is most important for one’s career (Gelfand, Bhawuk, Nishi, & Bechtold, 2004).
Collectivism describes societies in which people from birth onward are integrated into strong
cohesive in-groups (Ralston, Gustafon, Elsass, Cheung, & Terpstra, 1992).
In contrast to collectivism, individualism refers to “a social pattern that consists of
loosely linked individuals who view themselves as independent of collectives; are primarily
motivated by their own preferences, needs and rights” (H.C. Triandis, 1995, p. 2). In North
America and western European countries, individuals move out of their parents’ home, and start
their own families. Children from the “nuclear family” are taught to depend on themselves, and
tend to reduce their relationships with parents and other relatives after they leave home (Hofstede
et al., 2010).
In individualistic societies, work is rationalized so that self and employers’ interests
coincide. People in individualistic societies prefer work that leaves them enough time for family
and personal life. They tend to look for challenging work that is flexible enough to let them use
their own approaches.
Collectivism is defined as “a social pattern consisting of closely linked individuals who
see themselves as parts of one or more collectives (family, co-workers, tribe, nation)” (H.C.
Triandis, 1995, p. 2). These individuals like jobs that have training opportunities, have good
working conditions and fully use their skills and abilities. Collectivists are good organizational
citizens and commit to team work and future organizational success. However, Carson, Baker,

24
and Lanier (2014) learned that collectivists were not significantly more likely to exhibit
proactive behaviours at work. This surprising finding could be partly explained by the fact that
the proactive behaviours questionnaire comprises items that violate the values of collectivists: for
example, “No matter what the odds, if I believe in something, I will make it happen” (Carson et
al., 2014, p. 354).
This construct is sometimes labeled individualism-collectivism, but some scholars
disagree with this dichotomy. Schwartz (1990) asserted that a dichotomized view of
individualism-collectivism leads to three problems. First, it overlooks the values that serve both
individual and collective interests. Second, it ignores the values that benefit the social groups to
which individuals do not identify as being a member (out-group). Third, it promotes the
assumption that individualism and collectivism oppose one another. Personal achievements can
bring a sense of accomplishment to communities. For example, Parisella (2013) found that many
African-Americans felt that Obama’s election as president of the United States represented a
personal achievement that brought pride to black people. Independent thinking also leads to
creativity that benefits others, such as Thomas Edison’s inventions of the incandescent electric
lamp, phonograph, magnetic ore separator and many others (Beals, 1999).
Collectivist values (prosocial, conformity, security and tradition) not only benefit
communities, but also benefit individuals. Conformity, for instance, would make people more
obedient, polite, and disciplined. Security is also an obvious benefit to all individuals, and
societies (Schwartz, 1990).
Collectivism has been shown to resist acculturation among Filipino and Hispanic
immigrants in the US. The higher the collectivist value the lower the degree of acculturation. The
time spent in the US did not appear to increase the degree of individualism among the group of

25
Filipino registered nurses (Poliko-Harris, 1995). Scholars who studied the relationship between
collectivism and organizational commitment did not find a strong positive correlation between
the two constructs. Neither did they find a mediating effect of the collectivism on the relationship
between the degree of acculturation and organizational commitment (Liou, Tasai, & Cheng,
2013).
Competition
Competition is sometimes contrasted with cooperation and these constructs were
originally labeled as masculinity and femininity in the earlier versions of Hofstede’s surveys, but
were modified to reflect current trends. People from countries that value competition have been
encouraged to be assertive, ambitious, results-oriented, and recognition-seeking, and to place
importance on winning. They look for challenging jobs, and want to get promoted. Individuals
from cooperative societies, on the other hand, emphasize relationships, show empathy for the
weak, and promote a “work to live” attitude. Competitive and cooperative individuals have
opposing views with regard to politics, work situation, religion, family, and school (Hofstede,
2001).
Work situation. People in competitive countries focus more on their work, and emphasize
productivity and performance. Managers are assertive, decisive, and aggressive and there are
fewer women in management. Conflicts are resolved through either thwarting competitors or
fighting until the best man wins.
Populations in cooperative societies focus more on quality of life, and are more
concerned with working conditions than monetary compensation. People prefer to work fewer
hours and tend to resolve conflict through compromise and negotiation (Hofstede, 2001).

26
Family and school. In countries with high scores on competitiveness (COM), role
expectations are very clearly differentiated between fathers and mothers. Fathers are concerned
with facts and mothers with feelings. Girls can cry; boys should fight. Children in cooperative
countries see fathers and mothers take on similar roles. Both boys and girls can cry, but fighting
is never allowed (Hofstede, 2001).
Governments in competitive societies are more willing to sacrifice the environment for
the sake of economic prosperity, and are less permissive than in cooperative cultures.
Respondents from competitive societies agree with the view that individuals can make better
judgments and decisions than groups (Hofstede, 1991).
COM scores are more evenly distributed between eastern and western countries than any
of Hofstede’s other dimensions. The top five scores belong to Japan, Austria, Venezuela, Italy
and Switzerland, and the bottom four scores are from Scandinavian countries: Sweden, Norway,
Denmark, and Finland. Canada is on the high side of the scores, but it is still lower than the
Philippines, US, and Hong Kong (Hofstede, 2001).
Assertiveness is associated with career achievement, being more likely to take a
leadership role, and earning a higher income. Assertiveness is highly valued in North America
and in Western European countries, and was the focus of many career training programs in the
1970s. Outside western societies, humility, subservience, and tolerance are considered more
desirable than assertiveness. Hofstede did not include assertiveness items in his study, but his
COM index is correlated (r = .37, p <.05) with the GLOBE’s assertive practice scale (what is
now), but not correlated (r = .17, p > .10) with the assertive value scale (what it should be).
Long-Term Orientation
27
Confucianism teaches followers to support four principles to maintain balance and
happiness in society (Hofstede, 2001):
1. Some unequal relationships exist and are appropriate: master-follower, husband-wife,
elder brother-younger brother, and senior friend-junior friend.
2. Family is the basic model of social organization, and an organization can be a surrogate
of the family. Members of an organization are members of a family; harmony is desirable
in organizations.
3. You should treat others like you treat yourself. This principle does not extend to enemies.
4. One should work and study hard, persevere, and save money.
The Canadian psychologist Bond (1988) identified the Confucian work dynamism
dimension while developing a Chinese Value Survey (CVS) in 1980, which comprised 4
dimensions of 40 items: integration, human heartedness, Confucian work dynamism, and moral
discipline. Three of these dimensions correlate with Hofstede’s cultural value constructs.
Specifically, Confucian work dynamism is positively correlated with UNA (r = .22), moral
discipline with POD (r =.55), and human heartedness with COM (r = .67). Confucian work
dynamism is a common value of far eastern cultures (Chinese Culture Connection, 1987). The
integration items in the CVS survey focus on social stability and harmony: for example, filial
piety, tolerance of others, and solidarity trustworthiness. The moral discipline encompasses
prudence, adaptability, moderation, and having few desires. Human heartedness measures
courtesy, patience, righteousness, and kindness. Confucian work dynamism includes respect for
tradition, face saving, a sense of shame, thrift, and persistence (Chinese Culture Connection,
1987; Ralston et al., 1992).

28
The label ‘Confucian work dynamism’ does not imply that this dimension is strictly for
East Asian countries; India and Brazil also have high scores. Because the dimension appears to
correlate with economic growth, Hofstede et al. (2010) added it as a fifth cultural dimension and
renamed it long-term orientation (LTO) to reflect future rewards.
When Hofstede used LTO to label the dimension, implying that short- and long-term
orientations were two opposing views, critics argued that the two were complementary (Fang,
2003). Short-term orientation (reciprocation of favors, paying respect, saving face and personal
stability) deals with the past and present, and long-term orientation (persistence, thrift, observing
order, and a sense of shame) deals with the future.
Hofstede (2001) provided a list of countries, ranking them in order from highest to lowest
long-term orientation as follows: China, Hong Kong, Taiwan, Japan, South Korea, Brazil, India,
Australia, Canada, Philippines, Nigeria and Pakistan .
In terms of continuing education and skill upgrading, long-term oriented employees have
stronger motivation than their peers with short-term orientation. Lim and Chan (2003) used
Hofstede and Bond’s original fifteen-item questionnaire, but reduced it to only four items
because the rest did not yield distinct loading patterns. LTO does not show a significant positive
correlation with employees’ educational background, but was significantly correlated with
employees’ motivation and self-efficacy for skill upgrading, controlling for age, gender, and
monthly income. Nevertheless, a study in a multinational corporation indicates that employees
with higher LTO scores are more proactive due to their beliefs regarding the future goals of the
company (Carson et al., 2014). Comparing the LTO level between American-born and Filipino-
born nurses in the US, the results do not show any significant difference between the two groups
of employees (Poliko-Harris, 1995).

29
The Critique of Hofstede
Hofstede’s dimensions are widely used as a model in cultural research, but they have
faced many criticisms from scholars who suggest that the cultural instrument lacks construct
validity and face validity, has low reliability, and lacks a coherent structure in factor analysis
(Brewer & Venaik, 2012). Moulettes (2007) pointed out that Hofstede’s sample only consisted of
“a group of well-educated white ‘men’ from the middle classes working for the same company
and sharing identical or similar professions” ( p. 443). Ailon (2008) also criticized Hofstede’s
analysis suggesting he reinforced a certain set of perceptions and beliefs valued by Westerners,
and European managers. Javidan et al. (2006) raised doubt about the business interests of the
corporation that sponsored Hofstede’s research project – and whether the information collected
was centered on IBM’s needs. In addition, Javidan et al. (2006) argued that, contrary to
Hofstede’s assertion, his work was not action research. Action research is a method used for
improving practice involving action, evaluation, critical reflection, and change in practice.
Hofstede did not include these steps in his study. He was also criticized for seeming to add LTO
as an afterthought.
According to Fang (2003), LTO had a philosophical flaw: it was confusing and
incomprehensible to the Chinese. For the Chinese, short- and long-term are not opposing values,
but complement each other. For example, personal stability is under Hofstede’s short-term
orientation, but stability in Chinese is wenzhong, which means prudence. A person with
wenzhong has integrity, and makes valuable decisions based on solid and well-grounded
evidence. The opposite of wenzhong is not persistence (a characteristic of long-term orientation
as suggested by Hofstede), but bu-wenzhong. Bu-wenzhong individuals are not reliable and
trustworthy. “Protecting your face” is not a negative and short-term orientation as suggested by

30
Hofstede. Face is a positive, moral social value in Chinese culture, as shown in the Chinese
proverbs: “To be polite is to be face-caring” (Y. Gu, 1990, p. 241), and “Chinese businesspeople
value ‘face’ when doing business as gentlemen” (Fang, 2003, p. 357). Face-saving implies more
of a long-term than a short-term orientation. The other two Chinese cultural practices,
reciprocation of gifts, and respect for tradition cannot be categorized as positive or negative or as
long- or short-term orientation; they are a way of life. Non-Chinese friends eating at a restaurant
together will likely ask for individual checks when paying the bill. In China, one person will pay
for the whole party, but the other friends remember that, and on the next occasion one of them
will take their turn to pay.
Hofstede (2001) conducted his cultural analysis at the country level and insisted that its
use for individual level analysis amounts to “ecological fallacy” (p. 16). Therefore, researchers
should not apply national-level cultural characteristics onto the individual level. For example, the
correlation between the questions “employees not afraid” to express disagreement with their
manager and “perceived manager autocratic” was not significant (r = -.05) at the individual-
level, but was strongly significant (r = -.67) at the country-level (Hofstede, 2001, p. 125).
However, others researchers have cautioned that “although this is true, too much can be made of
the ecological fallacy” (Bochner & Hesketh, 1994). Other scholars argue that culture is not
nationality, and people do not conform to the cultures of their countries. Most countries consist
of multiple cultures and corresponding subcultures which have common and different beliefs in
their value systems. For example, the United States and Canada are multicultural countries in
which people from all over the world come to live and work, bringing their beliefs, values, and
religious practice with them. As Matsumoto (1994) asserts in his book

31
…culture is as much an individual, psychological construct as it is a macro, social
construct. That is to some extent, culture exists in every one of us individually as much as
it exists as a global, social construct. Individual differences in culture can be observed
among people in the degree to which they adopt and engage in the attitudes, values,
beliefs and behaviors that, by consensus, constitute their culture. (p. 4)
This statement indicates that culture is multilevel or hierarchical in nature. As Triandis
(1995) has pointed out it depends on how researchers apply their analysis. If researchers obtain
responses from their 20-item questionnaire from 10 countries with each country having 100
respondents, they can analyze the data in two ways. They can combine the individuals’ responses
within each country. This method gives researchers 20 numbers for each culture, and 200
numbers for 10 cultures (10 cultures x 20 items). This is an ecological–level or cross-cultural
analysis. The intra-cultural analysis (individual-level) is based on individual countries, each with
2000 numbers (100 respondents x 20 items). More recent studies apply multilevel analysis to
study cultural issues at the organizational and country levels (Taras, Kirkman, & Steel, 2010;
Yammarino & Dansereau, 2013). Scholars also suggest that, on any given attributes, the within
culture variances may be as large as or even larger than the between culture variances (Au, 2000;
Ratzlaff, Matsumoto, Kouznetsova, Raroque, & Ray, 2000; Rottig, 2009). For example,van
IJzendoorn and Kroonenberg (1988) studied cross-cultural patterns of infant-mother attachment
reports showing that intra-cultural variation was nearly 1.5 times that of cross-cultural variation.
Au (2000) analyzed World Value Survey data from 42 countries, and found that all six items
from the questionnaire have higher within-country variances than between country variances. For
example, on the question about the right to refuse jobs, the standard deviation of the 42 means is
.95, but the average of the within-country SD is 2.82. This suggests that the variance within

32
country is (2.82
.95) (
2.82
.95) = (2.97)
2 greater than the variance between country. Therefore, it is
incorrect to think of everyone in a culture as having the same practice and belief.
More recently, Hofstede’s assumptions have been challenged by investigators into the
issue (Ailon, 2008; McSweeney, 2013). First, Fischer and Schwartz (2011) compared cultural
values across 67 countries. The ten values the two investigators used in their study were: power,
achievement, hedonism, stimulation, self-direction, universalism, benevolence, tradition,
conformity, and security. All of these values except conformity were highly valued in all of the
countries, suggesting they were not good candidates for measuring cultural difference; only
conformity was suitable as an indicator. Second, Fischer and Poortinga (2012) compared two
sets of secondary data from two surveys. One survey asked participants to rate the importance of
their own values. Another survey, using the same questions, asked participants to rate the priority
given the value by people within their society. Data from both surveys were analyzed separately
and compared for similarities and differences between the answers on individual cultural values
and national cultural values. The authors concluded that there was no justification to differentiate
between the value structure at the individual and country levels. Another study that utilized small
space analysis (also called nonmetric multidimensional scaling) yielded similar results (Fischer,
Vauclair, Fontaine, & Schwartz, 2010). A strong challenge to Hofstede’s survey questionnaire
module comes from the work of Spector, Cooper, and Sparks (2001) who studied the internal
consistency of the instrument based on responses from 6,737 employees of 23 countries. This
study shows that among the 23 x 5 constructs (POD, UNA, COL, COM, LTO), only LTO yields
at least moderate Cronbach’s alpha values (M = .63, SD = .12). Other constructs show very poor
reliabilities. For example, UNA has values varying from -.30 (France) to .23 (Romania), COM -
.33 (Canada) to .46 (USA), POD -.18 (Germany) to .42 (Brazil), and LTO .40 (Belgium) to .77

33
(USA). Moreover, factor analysis of participants in the US and the UK only yields three factors,
but the two countries do not have the same items in the corresponding factors.
Currently cultural values are typically measured at the individual level, and this is what
my study will do, using Hofstede’s typology as suggested by Yoo, Donthu, and Lenartowicz
(2011)
Measurements
The debate over whether Hofstede’s questionnaire is suitable for the measurement of
individual cultural values has led scholars to develop their own instruments for measuring the
constructs. Taras’s (2008) catalogue of instruments for measuring culture showed 142 measures
at the national and individual levels. These instruments usually measure one, two or three
constructs at the individual levels. For example, Triandis (1995) developed COL, and Baird,
Lyles, and Wharton (1990) advanced POD and UNA. Two individual cultural value
measurement scales that are commonly found in the literature are those developed by Dorfman
and Howell (1988) and Yoo and Donthu (2002).
Dorfman and Howell (1988) were the first scholars to attempt to measure cultural
dimensions at the individual level of analysis. The scale, comprised of 22 items, was tested with
samples of managers from multinational firms in Mexico and Taiwan. Dorfman and Howell’s
(1988) study investigated relationships among individual cultural values (POD, UNA, COM and
COL), job satisfaction, organizational commitment, reward, and leadership style. Robertson and
Hoffman (2000) later developed a questionnaire to measure the fifth dimension (LTO) at the
individual level, and test its relationship with the other four constructs. Long-term orientation
(LTO) positively correlated with power distance (POD) and uncertainty avoidance (UNA), but
did not correlate with collectivism (COL) or competition (COM). Another research team applied

34
Dorfman and Howell’s questionnaire to study the relationship between individual cultural values
and transformational leadership (Mancheno-Smoak et al., 2009). The results supported the
hypothesis that transformational leadership positively correlated with UNA and COL, but had a
negative correlation with COM and POD. Wu (2006) re-examined cultural change over time, and
compared Hofstede’s cultural values in Taiwan and the US. Wu justified the use of Dorfman and
Howell’s instrument by stating that the instrument had been employed by several investigators
and was found to be theoretically equivalent. She reported similar scores in both the US and
Taiwan, indicating changes over the 30-year period between Hofstede’s and Wu’s studies. For
example, Hofstede (2001) reported collectivism values for Taiwan and the US as 17 and 91,
while Wu reported them as .67 and .64. Hofsted’s (2001) LTO of Taiwan (87) and the US (29)
became .57 and .58 in Wu’s report. Although Hofstede’s and Wu’s scales are different in
metrics, Wu’s updated results suggested the two countries are closer now than before.
Yoo and Donthu (2002) argued that individual cultural values, in fact, have the same
dimensionality as Hofstede’s cultural values. The researchers measured the effects of marketing
education and individual cultural values on the marketing ethics of business students. Five
dimensional cultural values at the individual level were measured by 26 items – six each for
COL and LTO, five each for UNA and POD, and four for COM. COL and UNA were positively
associated with marketing ethics, while COM and POD were negatively associated. Smith (2009)
confirmed the negative association of POD with marketing ethics when he applied the same
instrument to business students; however, he could not confirm the positive relationship between
UNA and marketing ethics. Smith (2011) also extended Mancheno-Smoak et al.’s (2009)
research on the relationship between individual cultural values and transformational leadership
by adding the Confucian work dynamism dimension into the study. His results using cultural

35
value scale (CVSCALE) indicated that UNA, COL and LTO were positively associated with
transformational leadership, while POD and COM were negatively associated. Other researchers
who also used CVSCALE in their investigations are: Chelariu, Brashear, Osmonbekove and Zait
(2008) for individual cultural values and entrepreneurial propensity; Patterson, Cowley and
Prasongsukarn (2006) for the moderating impact of individual cultural values on the association
of service failure and perception of justice; and Reid’s (2011) dissertation on the influence of
individual cultural values and customer expectation.
Silence in Organizations
Research relating to silence in the workplace covers many aspects of organizations
(Brinsfield, Edwards, & Greenberg, 2009). This paper will review some of the issues related to
silence that appear in the literature: spiral of silence, mum about undesirable messages (MUM),
mobbing, ostracism, organizational silence, and employee silence and its dimensions.
Spiral of Silence
Individuals have a tendency to stay silent on an issue if they perceive a lack of public
support for their positions on that issue. People’s reluctance to speak up for fear of isolation
strengthens the perception of weak public support on the issue. The repeating cycle of silence
and perception of weak public support becomes a spiral of increasing silence (Noelle-Neumann,
1974). This spiral of silence requires four key elements: threat of isolation, fear of isolation, a
lack of willingness to speak out, and the perception of a lack of public support (H. Huang, 1997).
This spiral of silence is a social-psycho mechanism which has, as its counterpart, pluralistic
ignorance; that is, the misjudgment of majority opinions relative to one’s own opinion (Ploeger,
2011).

36
One of the key elements of the spiral of silence (fear of isolation) has been tested for
cultural variations in individual opinion expression in the US and Taiwan. Researchers studied
the incongruence of participant opinions in the in-group (family, friends) and in the out-group
(national majority, media positions). The results showed contrasting pictures of the participants
of the two countries. More Americans were willing to express their opinions when those
opinions disagreed with the majority, while the Taiwanese were less likely to express their
opinions under the same conditions because they wanted to maintain collective harmony (H.
Huang, 2003). Organizational leaders can use strategies that give people who would otherwise
remain silent the confidence to speak out. Such strategies could include: identifying the
receivers’ attitudes and beliefs that will be resistant to the message, and preparing in advance and
presenting arguments to compensate for the specific resistant attitudes and beliefs of the
receivers. Research has indicated that these strategies appear to help participants in collectivist
societies such as Taiwan gain confidence and speak up, and make them better able to resist
pressure to conform (Lin & Pfau, 2007).
MUM
Rosen and Tesser (1970) coined the term MUM (mum about undesirable messages) in an
experiment to compare people’s preferences for delivering either good news and bad news. Both
male and female subjects preferred to convey good messages to their recipients. Another
experiment showed that anonymity did not alleviate communicators’ feelings of failure when
delivering bad news (Rosen & Tesser, 1972). Conlee and Tesser (1973) suggested that potential
communicators transmitted more good than bad news because they assumed that recipients did
not want to hear the bad. However, communicators became more willing to give bad news to
people who were willing to hear it. A more recent experiment incorporated ingratiation

37
techniques into the study. Ingratiation is a class of strategic behaviors intended to influence other
people for the benefit of the presenter. There are four potential benefits of ingratiation:
likeability, ulterior motive, expectation of gratitude and perceived favour for doing (Uysal &
Oner-Ozkan, 2007).
Marler, McKee, Cox, Simmering, and Allen (2012) investigated the relationship between
the MUM effect and organizational norms. The authors suggested that MUM manifested in two
ways. Avoidance MUM omits or delays the delivery of negative information. Sugar-coating
MUM distorts the information by mitigating the bad news.
Organizational norms also influence employees’ behaviors regarding information
sharing. Employees usually adjust their behaviors to fit in with organizational practices.
Organizations that promote information sharing encourage employees to engage with their
superiors and coworkers. Using a combination of organizational norms and self-monitoring
behaviour, Marler et al. (2012) found that in organizations that do not encourage information
sharing, employees will not omit bad news, but will sugar-coat it to mitigate the impact.
Moreover, some employees who monitor their own behaviours can tailor them to situational
cues, and apply MUM avoidance or MUM sugar-coating techniques.
Mobbing
Mobbing is a workplace behaviour in which a group of employees target an individual
and subject him or her to psychological harassment. This phenomenon is also known as gang up,
or psychic terror. Mobbing is defined as “hostile and unethical communication which is directed
in a systemic way by one or a number of persons mainly toward one individual” (Leymann,
1990, p. 120). Mobbing incidents usually stem from some previous conflict and develop into
attacks on the victim’s reputation, attempts to silence the victim, the assignment of humiliating

38
tasks to the victim, and threats of violence. By the time management steps in, the victim has
become a marked individual and is mistakenly believed to have a deviant personality. Victims of
mobbing often become sick and take long-term leave (Samnani, 2013). In-depth interviews with
20 human resources managers who were experienced in mobbing prevention in their
organizations pointed to four contributing factors: power distance, collectivism, a lack of trust
and gossip culture (Yuksel, 2010).
According to Blase, Blase, and Du (2008) and Blase and Blase (2002), mobbing
offenders use seven strategies to attack the victim: making the target appear incompetent;
refusing to communicate; criticizing the target’s private life; harassing sexually or physically;
attacking the victim’s attitude, nationality or religion; shouting or cursing; and slandering the
victim.
One study applied the Leymann Inventory of Psychological Terrorization to Turkish
workers and extracted five dimensions (Akar, Anafarta, & Sarvan, 2011). Another in Germany,
using the same instrument, extracted seven dimensions (Zapf, Knorz, & Kulla, 1996). Both
studied the relationship between job satisfaction and mobbing. As predicted, the job satisfaction
of the targeted employees was negatively correlated with mobbing in both studies. The
discrepancy in the number of dimensions might come from the differences in the cultures of
Germany and Turkey.
The term bullying is sometimes used interchangeably with mobbing (Einarsen, 2000).
However, they are not synonymous. Bullying is “unwanted, offensive, humiliating, undermining
behavior towards an individual or groups of employees” (Vega & Comer, 2005, p. 103). The
Canada Safety Council (2000) uses the definition of the International Labour of Organization:
“any incident in which a person is abused, threatened or assaulted in circumstances relating to

39
their work” (¶ 5). The Council suggests that 72% of the bullies are bosses. The Canadian
Institutes of Health Research (Canadian Institute of Health Research, 2012) indicated that 40%
of Canadian workers experience bullying on a weekly basis.
Bullying has deleterious effects on targeted individuals, with varying outcomes, such as
fear, depression, irritation, psychosomatic complaints, loss of self-esteem, and anxiety (Niedl,
1996). A survey of 172 elementary, middle, and high school teachers who experienced
mistreatment by their principal reported that they felt stress (91%), anger (75%), insecurity
(70%), and anxiety (66%) (Blase & Blase, 2002).
There are a multitude of strategies that can be used by victims of bullying to cope with
stress, anxiety and resentment; chief among them are avoidance and looking for support.
Bullying causes stress, resentment, anger, and maintaining silence (Vega & Comer, 2005). Vega
and Comer’s study did not factor culture as a variable, but the authors identified power distance
as a contributing factor.
Ostracism
Also known as silent treatment, ostracism is one strategy used by group members to
punish dissidents in organizations (Blase et al., 2008; Moore, 2014). To be ostracized is to be
ignored or excluded by others (S. L. Robinson, O'Reilly, & Wang, 2013). Ostracism may also be
called social exclusion, social rejection, organizational shunning, and linguistic ostracism. Rather
than using verbal harassment, group members employ shunning and ignoring to make the victims
lose their sense of belonging and decrease their self-esteem. K. D. Williams (2007) employed
functional magnetic resonance imaging (fMRI) in his investigation and learned that ostracized
subjects experience the same type of brain activity in the same location (dorsal anterior cingulate
cortex) as individuals experiencing physical pain.

40
O'Reilly, Robinson, Berdahl, and Banki (2014) conducted three surveys and reported in
the first survey that participants (n = 100) view ostracism as less harmful, less socially
inappropriate, and less likely to be prohibited in organizations than bullying. The second survey
of 1,300 participants in the US suggested that a full 71% of them had experienced one or more
incidents of ostracism in the past six months, but only 47% had experienced bullying incidents
over the same period. The research, however, did not mention how many of the participants
experienced both ostracism and bullying. The third survey of a large public research university in
Canada indicated that at least 91% of the 1,048 university staff had experienced ostracism at
least once in the six-month period prior to the study. The same report also shows a significant
positive relationship between ostracism and depression, sense of belonging, physical health, and
intention to quit.
Individuals who are the subject of ostracism can respond to the offenders in a positive or
negative way. Research on work behavior in response to abusive employers has suggested that
victims can adopt antisocial behaviors such as sabotage, withdrawal, theft, and low productivity
(Wei & Si, 2013). The same study also shows that the locus of control moderates the anti-social
behaviours of the victims. Theft, sabotage and low productivity appear less frequently when
employees blame themselves for the errors; that is, when the locus of control is internal.
However, there is no significant difference in job withdrawal between those with internal versus
external loci of control. Employee job withdrawal can take many behavioural forms such as
absenteeism, lateness, turnover, and low job involvement (Beehr & Gupta, 1978). One common
strategy that victims employ is ingratiation: trying to make themselves more attractive to the
abuser through techniques such as conformity, flattery, and offering personal assistance. L. Wu,
Yim, Kwan, and Zhang (2012) indicated that having good political skills, including networking

41
abilities, apparent sincerity, and interpersonal influence helps abused employees maintain
effectiveness in their workplaces. They also suggested that ingratiation by itself is often
ineffective.
In extreme cases, ostracism can lead to aggression such as school shootings. Leary,
Kowalski, Smith, and Phillips (2003) reviewed school shootings between 1995 and 2001, and
concluded that 12 of 18 cases were related to teasing, ostracism, and bullying. One perpetrator
left a note saying “people like me are mistreated everyday …No one ever really cared about me”
(p. 210).
Organizational Silence
Morrison and Milliken (2000) were the first to conceptualize organizational silence. They
presented a complex model that identified silence as the main factor that prevented change and
development. Organizational silence is a collective-level phenomenon that consists of two shared
beliefs: speaking up about problems in the organization is not worth the effort, and voicing one’s
opinions and concerns is dangerous (Morrison & Milliken, 2000). Two driving forces of
organizational silence are managers’ fear of negative feedback, and the implicit belief among
managers that employees are self-interested. These two reasons compel management to develop
centralized decision-making processes, and reject or respond negatively to negative feedback.
Organizational silence is more common in organizations that are dominated by executives from
financial backgrounds, have high homogeneity of management teams, have a great demographic
dissimilarity between management and lower-level employees, and have high power distance
and collectivist cultures. Vakola and Bouradas (2005) tested some of the above proposals, and
found a significant relationship between employee silence and the management attitudes of
supervisors and senior executives. They also found that a perceived climate of silence is a strong

42
negative predictor of job satisfaction and organizational commitment. Milliken, Morrison, and
Hewlin (2003) conducted interviews of 40 full-time employees in various business sectors
including consulting, financial services, news media, pharmaceuticals, and advertising. The
researchers found eight categories of issues that participants were unable to speak to supervisors
about: competencies, pay equity, organizational policies, career advancement, fairness,
harassment, conflict, and other issues (experience, tenure, and a lack of support).
The reasons employees decided not to speak out were fears of being viewed as negative,
being labelled as a trouble maker, damaging their work relationships, and losing trust or
acceptance (Knoll & van Dick, 2013b). Employees also feared retaliation and punishment. They
felt that speaking out would not make any difference. There are other reasons for not speaking
out, which included personal factors (lack of experience and tenure), and organizational contexts
(unsupportive culture, and hierarchical structure). Velbeck’s (2009) qualitative research
indicated that half of the participants (5 out of 10) experienced negative reactions from their
superior such as him or her getting angry, being upset or blaming the subordinate for the
problem. Participants who anticipated unpleasant experiences developed strategies to cope with
their supervisors, including offering solutions, mitigating the messages, and delaying message
delivery. McGowan (2002) developed a typology for three categories of organizational silencing
in social services for elderly care: absolute, revisionist, and selective silencing. In absolute
silencing, employees do not bring any issue to the table for discussion. In revisionist silencing,
reports are falsified to cover personal activities during work hours. In selective silencing,
employees only discuss positive activities and avoid embarrassing issues.
Millenson (2003) found that the report To Err is Human (Kohn et al., 2000) elicited
negative reactions from physicians, who responded that they “felt betrayed” and that “all past

43
efforts were discounted and inconsequential” (¶ 26). The author suggested that it was actually
pressure from the public, media and politicians, not the medical profession’s initiative, that
forced physicians to look at their work qualities (Millenson, 2003).
Henriksen and Dayton (2006) identified that individual, social and organizational factors
interact to contribute to silence. Firstly, the individual factors are rooted in self-serving bias,
whereby we tend to credit our own contribution to the success of events, but when events fall
short of expectations, we deflect the responsibility elsewhere. The status quo trap also makes us
resistant to changes; we resist making extra efforts and taking more responsibility for new
standards and procedures. Secondly, the social factors derive from conformity, diffusing
responsibility and microclimate distrust. Studies show that individuals will adapt their judgment
to accommodate people around them in order to gain acceptance in the group. Another social
factor is distrust, manifested in a lack of shared beliefs and in blame seeking among various units
of the organizations. Finally, the organizational factor has three attributes: unchallenged beliefs,
the good provider fallacy and neglect of independencies. Organizations that bring highly
qualified experts together to work normally expect good decisions to emerge as a result. This is
an unwarranted assumption, as groups sometimes err in their decisions because members fail to
challenge the beliefs of others in the group. Also, if there is an unexpected failure in the
operation and creative individuals are able to circumvent the problem, a crisis may have been
resolved but the root cause has not been brought to the surface. One last issue is that
organizations often overlook interdependencies such as the interplay of technology, people, and
work process. Computerized automation in the workplace will create chaos if the
interdependencies of technology, people and work process are undervalued.

44
Most of the research suggests that organizational silence is a dysfunctional behavior that
can poison the work environment, and block development and change, but Bies (2009) argued
that organizational silence could be beneficial, and often managers use it for problem solving and
gaining insights. For example, military units embed reflective silence in their “After Action
Review” to learn about the outcome of their missions (Bies, 2009, p. 163). In many instances,
workers use silence as a political tool to gain revenge, for dominance or to blame management.
Employees’ silence is used as a strategy to cope with their fear of tyrannical bosses, but
employees also use silence to wait for moments when the boss’s shifting mood becomes safer for
the delivery of bad news. Leaders also use silence to temporarily suppress the majority, allowing
minority voices to rise up, and be judged on their merits.
Employee Silence
Organizational silence (OS) and employee silence are used interchangeably in the
literature, but the two concepts are not identical. OS refers to “a collective-level phenomenon
characterized by the widespread withholding of information, opinions, or concerns by employees
about work related issues” (Brinsfield et al., 2009, p. 18). Employee silence is the “withholding
of any form of genuine expression about the individual’s behavioral, cognitive and/or affective
evaluations of his or her organizational circumstance to persons who are perceived to be capable
of effecting change or redress” (Pinder & Harlos, 2001, p. 334). Prior to van Dyne et al.’s (2003)
research, silence was considered unidimensional, but current research has shown that employee
silence is multidimensional.
Van Dyne et al. (2003), who investigated employees’ motives for silence, proposed three
types of silence (acquiescent, defensive, and prosocial silence), and three types of corresponding
voice (acquiescent, defensive, and prosocial voice). Acquiescent silence includes signs of

45
disengagement such as withdrawal from any effort to speak up or attempt to change the situation.
Employees in acquiescent silence believe that their efforts will not make a difference. They are
passive and prefer to keep their opinions to themselves. As the name implies, in defensive
silence, individuals keep their ideas to themselves out of fear of retaliation. Prosocial silence is
defined as withholding “work-related ideas, information, or opinions with the goal of benefiting
other people or the organization – based on altruism or cooperative motives” (Van Dyne et al.,
2003, p. 1368). It is a proactive and desirable organizational citizenship behavior in which
employees do not disclose organizational, confidential or proprietary information. The
counterparts of silence are the matching types of voice. Acquiescent voice agrees with the group
based on a feeling of resignation. Defensive voice deflects attention away from unfavorable
discussions and onto other topics. Prosocial voice offers solutions to problems based on
cooperation.
Brinsfield (2009) expanded the dimensions of employee silence to include deviant,
relational, diffident, and disengaged silences. In deviant silence, employees intentionally avoid
giving necessary information to coworkers or supervisors. In relational silence, employees keep
silent to avoid jeopardizing relationships with customers, peers or employers. In relational
silence, individuals stay silent rather than express their disagreement in order to maintain long-
term relationships. In diffident silence, individuals want to avoid embarrassing themselves
because they do not feel confident enough to speak up on issues they are uncertain about.
Diffident silence is a milder type of defensive silence which is based on a fear of losing one’s
job. Disengaged silence is exhibited by individuals who remain silent because they do not want
to get involved in issues that do not affect them. Brinsfield (2013) added another category,
46
ineffectual silence, to describe the silence of individuals who decide to keep their opinions to
themselves because they believe that speaking up would not change the outcome.
In the past two years, scholars have investigated the linkages of employee silence
dimensions to job satisfaction (Knoll & van Dick, 2013b), organizational justice (Tangirala &
Ramanujam, 2008; Whiteside & Barclay, 2013), trust (Zheng, Ke, Shi, & Zheng, 2008),
leadership (Ristig, 2004), antecedents and consequences (Vakola & Bouradas, 2005), and patient
safety (Garon, 2011; Maxfield et al., 2013).
Knoll and van Dick (2013b) were the first team of researchers to distinguish the quiescent
and acquiescent silence empirically. They also investigate the relationships between the
dimensions of silence and measures of the following: job satisfaction, turnover intention,
organizational identification, and well-being. The investigators developed their own
measurement scales based on the previous research of Pinder and Harlos (2001), Van Dyne et al.
(2003) and Brinsfield (2009). The 20 survey items represent acquiescent, quiescent, prosocial,
and opportunistic silences. Opportunistic silence is similar to Brinsfield’s deviant silence but
specifically with the intent of gaining an advantage over competitors. All four types of silence
have adverse effects on job satisfaction, well-being, and turnover intention. Table 1 lists the
types of silence as defined by the four groups of investigators.

47
Table 1
Dimensions of Silence as Defined by Knoll and van Dick (2013b), Brinsfield (2013), Van Dyne
et al. (2003) and Pinder and Harlos (2001)
Key Features Knoll and van
Dick (2013)
Brinsfield
(2013)
Van Dyne et
al. (2003)
Pinder and Harlos
(2001)
Avoid giving
necessary information
to coworkers
Opportunistic Deviant Not applicable Not applicable
Avoid jeopardizing
relationship with peers
Prosocial Relational Prosocial Not applicable
Avoid embarrassing
oneself
Quiescent Diffident Defensive Quiescent
Fear of retaliation Quiescent Defensive Defensive Not applicable
Avoid getting involved
on issues that do not
affect oneself
Acquiescent Disengaged Acquiescent Acquiescent
Believe that speaking
up would not change
outcomes
Acquiescent Ineffectual Acquiescent Acquiescent
Employee silence does not always involve the deliberate withholding of information, but
could result from an automatic and unintentional response to fear. Kish-Gephart, Detert, Trevino,
and Edmondson (2009) argue that defensive silence or quiescent silence should be categorized
into four types, based on the intensity and time-frame of responses. The first type is known as
deliberative silence which combines low fear intensity and an ample amount of time to respond.
For example, the supervisor asks about the laboratory report missing from the patient’s medical
record, resulting in a delay in discharge. The nurse who mistakenly misplaced the report might
stay silent because of a fear of being disciplined. The second type is non-deliberative defensive
silence, which occurs when individuals experience intensive fear and have little time to respond

48
to the threat cues. This can happen when employees begin to speak up but find that managers
become defensive and confrontational. The managers’ reactions cause employees to panic and
withdraw themselves from the discussion. The third type of silence, schema-driven defensive
silence, occurs in two situations: (a) little time to respond to low intensity fear, and (b) a longer
time to respond to high intensity. In type 3a, employees recognize the opportunity to make a
suggestion to the managers at meetings, but choose to stay silent because they need more time to
consult and gather information. An example of type 3b defensive silence is when an employee
discovers a flaw in computer software, but decides to keep quiet, well aware that the information
system is “a pet project” of the manager. The above three types of silence are triggered by fear
and over a period of time the defensive silence becomes ingrained in the individual’s routine
handling of their response to fear that is similar to acquiescent silence. However, there is no
evidence that the two are identical (Kish-Gephart et al., 2009).
Kish-Gephart and Breaux-Soignet (2013) suggest there are three types of personality
traits that may be associated with fear-based silence: trait anxiety, invisible social identities and
ego depletion. Trait anxiety refers to individuals who are anxiety-prone, and quick to detect
threatening (angry) faces. This phenomenon makes them hyper vigilant to threatening stimuli,
distracts their attention, and detracts from the efficiency of their performance. An example of a
person with an invisible social identity could be a gay employee who feels reluctant to give their
opinion on family benefits. The opportunity to voice the issue poses a risk to this employee, as
he has to reveal his identity. He may opt to stay silent because it is safer to keep his identity to
himself. According to the hypothesis of ego depletion, human beings have limited inner mental
resources they can draw from in order to suppress their real state of mind (Baumeister,
Bratslavsky, Maraven, & Tice, 1998). For example, an employee may force herself to stay silent

49
when the manager asks her to work overtime without additional pay. The exertion of self-control
depletes the employee’s mental energy and eventually the employee succumbs to her core
values, rejects the request, and faces hostility from her boss (Kish-Gephart & Breaux-Soignet,
2013).
Harvey, Martinko, and Douglas (2009) apply attribution theory to the reasons for staying
silent or reporting wrongdoing. Attribution theory assumes that “people are naïve psychologists
with an innate desire to understand the causes of their own behaviors and outcomes as well as the
causes of others’ behaviours and outcomes” (Harvey et al., 2009, p. 64). Key components of
attribution theory are the locus of control (internal/external) and stability (stable/unstable).
Individuals feel less angry with business owners who have to lay them off because of an
economic downturn that leads to major losses of revenue. In this circumstance, the economic
downturn is the locus of control (external) and over-staffing is an unstable situation. In a survey
of 1900 registered nurses from across the US, G. King (2001) learned that nurses are willing to
report colleagues who administered a wrong medication more than those who forgot to raise the
side-rails, even though raising the side-rails can prevent patients from falling and breaking their
hips. Nurses are likely to confront colleagues rather than report them to authorities when the
wrongdoers unintentionally commit errors. Yet, the decisions to report wrongdoing are also
dependent on individuals’ cultural values. Members of individualistic cultures tend to perceive
people’s behaviours as a product of the individual’s own responsibility. On the contrary,
members of collective societies tend to focus on the external drivers of mishaps. Based on this
perspective, members of the individualistic societies are more inclined to report wrongdoing
(Harvey et al., 2009).

50
The above discussion is related to employees who see someone else committing mistakes
but keep quiet out of fear of retaliation from the wrongdoers, embarrassing the bosses, protecting
colleagues, and in some cases to take advantage of others’ mistakes. However, when they
themselves make mistakes they will stay silent for fear of embarrassment and punishment. Most
often, individuals downplay the outcomes of their own mistakes by talking themselves out of
reporting their errors. They rationalize to themselves in a variety of ways such as saying the
mistake is inconsequential, no harm was done or the problems will go away. M. S. Edwards,
Ashkanasy, and Gardner (2009) identified four types of anticipated fear that discourage people
from speaking up: fear of being viewed negatively, fear of damaging the relationship, fear of
retaliation and fear of being labelled a trouble-maker. In the healthcare field, self-reporting one’s
own error is risky as it could lead to disciplinary action, dismissal, litigation or a loss of license.
Among physicians, legal litigation is the number one barrier to self-reporting errors. Discussions
about medical mistakes during medical rounds or at mortality and morbidity conferences are
used to embarrass “guilty” physicians rather than developing constructive ways to prevent errors
(Moskop, Gelderman, Hobgood, & Larkin, 2006). This type of organizational culture
discourages error reporting more than it encourages staff to tell the truth, and leads to lost
opportunities to learn from mistakes and prevent recurring errors (Milliken & Lam, 2009).
In a study of employee silence and its impact on trust in China, Zheng et al. (2008)
focused their efforts on employee trust in the organization and employee trust in supervisors. The
investigators found three forms of silence: acquiescent silence, defensive silence, and
disregardful silence. All three forms of employee silence lead to a distrust of supervisors, but
only acquiescent and disregardful silence lead to distrust of the organization. Defensive silence
has no significant relationship with employee trust in the organization. Employees with

51
disregardful silence are passive, have a low commitment to the organization, and show little
involvement in organizational activities.
In an investigation of employee silence and procedural justice, Tangirala and Ramanujam
(2008) selected five items from Van Dyne et al. (2003) and modified them for the context of
patient safety in hospitals. Their questions did not try to probe for motivation, but only to
confirm whether participants remained silent even though they knew their silence would
compromise patient safety. The investigators used hierarchical linear modeling to test their
hypotheses, and concluded that employee silence had a negative correlation with workgroup
identification, professional commitment, and a procedural justice climate at both the individual
and group levels. Whiteside and Barclay (2013), on the other hand, investigated overall justice,
and the dimensions of silence (acquiescent and quiescent). Overall justice (a combination of
procedural, distributive, and information justice) showed a significant negative correlation with
acquiescent silence and showed no significant relationship with either gender or quiescent
silence.
The reasons people stay silent do not always relate to fear of retaliation, embarrassment,
and prosocial behaviour but may also include communication apprehension.
Communication Apprehension
Almost 95% of the population reports having some type of communication apprehension
(CA). CA is defined as “an individual’s level of fear or anxiety associated with either real or
anticipated communication with another person or persons” (McCrosky, Richmond, & Davis,
1986, p. 171). The theory of communication avoidance viewed CA as a trait-like personality
characteristic that causes the trait-carriers to shy away from speaking up in public. In subsequent

52
research, the theory has extended to apprehension in writing and singing, as well as a non-
response to specific situations (McCrosky, 1984). There are four types of CA, described below.
Traitlike communication apprehension (TLCA). TLCA is defined as “a relatively
enduring, personality-type orientation towards a given mode of communication across a wide
variety of contexts” (McCrosky, 1984, p. 16). The communication mode is not restricted to oral
communication, but encompasses writing and singing. This is the type of CA that has been most
studied and reported in the literature (Butler, 2004; Soonthornsawad, 2009; Strohmaier, 1997).
Individuals with a TLCA personality reduce their apprehension to communicate after living in
societies that value self-expression. A comparison of Thai immigrants in the US indicated that
they have a tendency to communicate more than their fellow citizens who live in Thailand; the
longer they live in the US the lower they score on communication apprehension
(Soonthornsawad, 2009).
Context-based communication apprehension (CBCA). CBCA refers to a person with a
fear of communicating in a specific context, such as public speaking, speaking in class or in
meetings, speaking in small group discussions, and speaking in dyadic interactions. CBCA is
different from TLCA in that it is narrowly focused on a specific type of communication.
Research on communication apprehension shows that people experience physiological changes
during public speaking, notably in their heart rate. Four types of heart rates (strong, fast, weak,
average) have been demonstrated in a study in Finland. One study showed that Finnish speakers
had a heart rate 10 to 20 beats per minute higher than American speakers. The variation might
come from the different cultural demands, as the culture in Finland values low assertiveness in
comparison to the US (Porhola, 2002). Withers and Vernon (2006) found a positive correlation
between public speaking apprehension and embarrassment when they studied the linkages of the

53
two constructs in university students in the US. Females appear to feel more embarrassed than
males, which could result in more CBCA in female dominated industries such as the healthcare
sector.
Person-group communication apprehension (PGCA). For some people, communication
apprehension is dependent on the target (persons or groups) that the individuals have to discuss
the issues with. School teachers are comfortable speaking in front of students but often feel
apprehension in front of principals. People with TLCA and CBCA always experience
apprehension when speaking to a person, or groups in all situations, whereas PGCA only relates
to the circumstance.
Situational comprehension apprehension (SCA). This is similar to PGCA, except SCA
occurs at a given time. Most employees experience this type of apprehension at some point in
their working life. It can happen before performance appraisals or when managers call
subordinates into their offices to ask for an explanation of their behaviours. McCrosky et al.
(1986) showed that SCA is negatively correlated with employees’ opinion of their supervisor.
As satisfaction increases, anxiety about talking to managers decreases.
The four categories of communication apprehension mentioned earlier are not in
reference to types of people, as people may be affected by different categories at different times;
for instance, as students, we might avoid showing our report cards to our parents if we were not
doing well at school. However, McCrosky (1984) anticipated that, in rare cases, people suffering
from pathological communication apprehension will feel uncomfortable speaking in any
circumstances.
Scholars who study the negative effects of employee silence recommend multiple
remedies for leaders. Tangirala and Ramanujam (2008) suggested that a procedural justice

54
climate was one way to give employees more of a voice. Sayre, McNeese-Smith, Leach, and
Phillips (2012) conducted a quasi-experiment on a training intervention that appeared to improve
speaking up behavior in participating nurses. Edmondson (2004b) believed that psychological
safety could act as a mediator and reduce employee silence. My research will investigate the
effectiveness of psychological safety in mediating the relationship between individual cultural
values and employee silence in the workplace.
Psychological Safety
Psychological safety (PSY), felt obligation for constructive change (FOC) and
organization-based self-esteem (OBSE) belong to a second order construct referred to as
psychological antecedents of voice, which lead employees to express promotive or prohibitive
voices. Promotive voice is the expression of new ideas that could improve the function of an
organization; it could pose a challenge to supervisors or coworkers who want to maintain the
status quo of the work environment. However, promotive voice usually accompanies innovative
thinking that offers new ideas or suggestions that focus on a future state. Prohibitive voice, on
the other hand, is the expression of concerns regarding work practices or employee behaviours
that could harm organizations. Employees who express prohibitive voice can be viewed as fault
finding, as they do not come with a solution that could improve the work processes. FOC is the
belief that one is obligated to make a positive change in the organization. The motivational force
behind FOC is the social norms that affect ways of thinking and behaving. With OBSE, the
individual believes in his or her own social worth in the workplace. People with high OBSE are
more likely to engage and voice their opinions in the workplace (Liang, Farh, & Farh, 2012).
Psychological safety (PSY) is defined as “the general belief that one is comfortable being oneself
(to be open, authentic, and direct) in a particular setting or role” (Nembhard & Edmondson,

55
2012, para. 6 para 7). Among the three psychological antecedents of voice, PSY has the
strongest effect on prohibitive voice, but it is moderated by the level of OBSE. When OBSE is
low, PSY becomes weak. FOC on the other hand has the most influence on promotive voice and
it is free from the influence of OBSE (Liang et al., 2012).
Psychological safety enables employees to engage in open discussion, and to ask for and
give advice without fear of embarrassment or of retaliation from other employees or supervisors.
Questioning a superior’s judgment carries potential risks, as the superior is in a position to
impose sanctions or penalties. When PSY exists, employees feel respect and support from their
leaders. Employees are more willing to engage in the decision-making process and report
mistakes without fear of reprisal. PSY has been shown to mediate team learning, organizational
learning, organizational performance, product and process innovations, and employee
engagement (Glavin, 2010).
Edmondson (1999) found that leadership behavior, group dynamics, trust and respect,
the use of field practice, and supportive organizational context are the conditions in which
psychological safety played a mediating role to learning behaviours such as speaking up about
mistakes, and seeking help and feedback. Since then, much research has been conducted and
much has been learned about the relationship between PSY and the following topics: leadership
styles (Raes et al., 2013), diversity (Singh, Winkel, & Selvarajan, 2013), team emotional
intelligence (Ghosh, Shuck, & Petrosko, 2012), social network theories (Sims, 2009), and high-
quality relationships (Brueller & Carmelli, 2011; Carmeli, Bruller, & Dutton, 2009; Carmeli &
Gittel, 2009). So far, there has been no investigation into the linkages of cultural dimensions and
the dimensions of employee silence.

56
Psychological safety was first hypothesized by Schein (2004) to help organizations
manage changes by alleviating employees’ fear of learning new skills. He described PSY as “the
sense of being able to see a possibility of solving the problem and learning something new
without loss of identity or integrity”(Schein, 2004, p. 320). Kahn (1990), on the other hand,
grounded his concept of PSY in the factors that contributed to employee engagement and
disengagement. People unconsciously assess situations and decide whether to engage or
disengage depending on three aspects: psychological safety (PSY), psychological
meaningfulness (PM), and psychological availability (PA). According to Khan (1990), PSY is
the ability to express and employ one’s self without fear of negative consequences to self-image,
status, or career. PM is a return on the effort of putting physical and emotional energy into a task.
In a sense, the person asks himself or herself “what’s in it for me?” PA is dependent on whether
individuals have the physical, emotional or psychological resources to engage at a particular
moment.
Psychological safety not only makes employees feel safe to voice their concerns, but also
promotes collaboration and experimentation. Experiential learning comprises operational and
conceptual models which form a cycle of observation/reflection, formation of concepts and
testing of concepts in a new situation. Employees are most likely to experiment with the new
concept when they know they will not be penalized if the results yield negative outcomes.
Failure allows individuals to rectify and learn new ways of solving problems (Kim, 1993).
Collaboration is defined as “the degree of cooperation among individuals who seek to achieve a
common goal” (Nembhard & Edmondson, 2012, para. 6 para 15). Collaboration is one of the
foundations of organizational learning which uses conversation, and cooperation, allowing
employees to see what has gone wrong in their organization. The exchange of ideas eventually

57
leads to a solution that will be encoded in organization policies and becomes a standard of
practice in the workplace (Nembhard & Edmondson, 2012, para. 6). Argyris (2008) identifies
single and double-loop learning in organizations. Single-loop is a superficial type of learning in
which employees single out the problem and fix it; for example, laboratory employees learn that
a patient’s specimen is mislabeled and they discard it. This single-loop learning does not identify
the root cause and mistakes will continue. Double loop learning identifies the real problem, such
as high work volume, employees’ lack of attention to detail, and poor handwriting.
Frazier (2013) suggests that PSY encourages employees to speak up because it creates an
environment in which they feel safe from being punished or offending peers and supervisors.
PSY is similar to, but not the same as, voice climate (VC), another construct that scholars used as
a measurement of voice in organizations. VC is a subset of psychological safety. While VC
focuses solely on speaking up about work related issues, psychological safety extends to other
behaviours such as asking for help and making mistakes.
Psychological Oppression
If psychological safety promotes voice, psychological oppression inhibits voice. In her
book Femininity and Domination, Bartkey (1990) described the phenomenon she called
psychological oppression, in which minority individuals accept the social system that marks
them as inferior to the dominant groups or cultures. It is an internalization process in which the
psychologically oppressed become their own oppressors, and believe their inferiority is their
destiny. Lancia (2005) defines psychological oppression as “the denial of the ability for the
oppressed to define themselves independent of the dominant culture; unable to identify one
social agent as responsible for their oppression, they become alienated from a true sense of
personhood, which serves to maintain a larger system of privilege to which they are victims” (p.

58
60). Psychological oppression progresses through a 4-step systemization. First, the group in
power defines what is considered “normal” or correct. Second, the so-called “normal” is
consciously or unconsciously embedded in the society’s institutes. Third, the target groups
internalize the oppression as a norm they have to accept. Fourth, the dominant group’s culture is
imposed on the target groups (Evans & Chun, 2007). In a study of counselors who help
chemically dependent people, the researcher learned that many of the female counselors were
abused in the workplace; however, they remained silent and accepted the unfair treatment. These
workers met continuous criticism, had their experience disregarded, and were accused of being
unrealistic by their employers. This heavy criticism creates guilt and self-doubt and the targets
end up accepting that they really are incompetent and decide to leave the profession (Bryant,
1992). The flow of events suggests that these counselors suffered from psychological oppression.
Gender
Women have been blamed for human suffering since biblical times, as shown in the
passage of The Living Bible:
I never let women teach men or lord it over them. Let them be silent in your church
meetings. Why? Because God made Adam first, and, afterwards he made Eve. And it was
not Adam who was fooled by Satan, but Eve, and sin was the result” (1 Timothy 2:12 -13
The Living Bible paraphrased).
Almost two thousand years later, this passage still resonates, as women are still expected to
listen to men. Reinharz (1994) asserts that only six percent of males, but 50 percent of female
attorneys have been cut off by judges while they are speaking. In schools, women get interrupted
more frequently than men both by teachers and by their classmates. When speaking with men,
teachers more often use a tone of voice that shows interest, but adopt a dismissive tone when
59
talking to women (Bartkey, 1990). A recent study found that 28 out of 31 women were being
abused and bullied by their bosses, regardless of race and ethnicity (Parker, 2014). Women also
show a tendency toward silencing themselves even if they are not experiencing psychological
oppression. Vickers and Parris (2005) conducted an in-depth interview of five working women
who care for children with chronic diseases and learned that these women were self-censoring
their speaking. They had learned that the way to best meet the needs of others is by denying their
own needs. Yet, they did not feel worthless or devalue themselves like those who are suffering
from psychological oppression. They stayed silent because they believed that other people at
work would not understand their difficulties. However, a more recent research shows that
psychological oppression is not the only reason for women remaining silent. A study of 20
professional women indicated that they constrained themselves from speaking because of the
way they were raised at home, where their parents did not tolerate challenges by their children,
especially daughters. Another reason that women remain silent is to conform to their expected
gender role (Weaver, 2011).
Leadership Style
Leaders can react to subordinates voicing concern in several ways. They can ignore,
denounce, welcome, promote or praise the act of speaking up. Scholars agree that PSY is
influenced by leaders, trust, and respect. (Edmondson, 1999; Kahn, 1990). Research has shown
that support, accessibility and inclusiveness in leaders heightens PSY. Subordinates in
organizational units always observe the behaviour of leaders and know how their superiors react
to bad and good news. Leaders who admit their own vulnerability to subordinates send a signal
that everyone can make mistakes. By admitting their own errors and showing a willingness to
listen to subordinates’ advice, leaders reduce the fear of punishment and promote PSY among
their staff members.

60
Three types of leadership behaviours that promote PSY are accessibility, inviting input
and openness (Edmondson, 2004b). Scholars acknowledge that a transformational leadership
style is more effective for allowing change than either transactional or laissez-faire leadership
styles (Bass, 1997; Daft, 2007; Wilson, 2010). Laissez-faire style leaders avoid accepting
responsibility, are unavailable when needed, and fail to follow up on requests for assistance.
Transactional leaders use the carrot and the stick strategy to achieve their goals.
Transformational leaders motivate employees by raising their consciousness, and moving them
beyond self-interest to work for the good of their groups and organizations. Bass (1997) asserted
that transformational leadership styles that motivate subordinates are: Idealized Influence
(displaying conviction, trust, using their own charisma), Inspirational Motivation (articulating an
appealing future vision), Intellectual Stimulation (challenging old assumptions and appealing to
new ideas), and Individualized Consideration (dealing with subordinates as individuals, and
looking after their needs and aspirations). Transformational leadership is in fact an extension of
transactional leadership. Effective leaders show ambidextrous leadership, using both
transformational and transactional styles to fit the situation (Bass, 1999). Ashford, Sutcliffe, and
Christianson (2009) argue that a transformation leadership style promotes voice in organizations
as employees are not afraid to voice their concerns, employees feel competent and performance
is improved. Transformational leaders are capable of communicating the values and goals of
organizations to subordinates.
A qualitative study pointed to the abilities of ambidextrous leaders to promote team
learning through discussion, reflection, sharing information, and making changes towards
improving the organizations (Bucic, Robinson, & Ramburuth, 2010). In a study on the
relationship between psychological safety, leadership style and team learning, Raes et al. (2013)

61
sampled 605 nurses from 28 divisions of a large university hospital and found that PSY mediated
between transformational leadership and team learning. PSY also mediated between a laissez-
faire leadership style and team learning.
Whether supervisors react to employees’ voice as being positive or negative depends on
three aspects of communication exchanges – ideas, persons, and demeanors. These aspects can
make managers praise and reward, or scold and punish subordinates who speak up. Researchers
who have tried to understand why some supervisors react negatively to employees’ complaints or
suggestions look into three underlying motives. Epistemic motives are “the expedient desire to
come to a firm belief on a given topic as a means of reducing confusion and uncertainty”
(Chiaburn, Farh, & Van Dyne, 2013, p. 228). Managers with epistemic motives believe that
employees’ ideas are inappropriate and react to their comments by devaluing suggestions.
Managers with ideological motives want to maintain the hierarchical order and inequality among
the rank and file in organizations. These managers are resistant to suggestions that try to equalize
the systemic differences between the leaders and subordinates. Managers with existential
motives are concerned with self-esteem and saving face. When employees make suggestions in
front of a large gathering in public without consulting prior to the meeting, existential managers
get angry and believe that employees’ behaviours are inappropriate.
In their literature review, Morrison and Rothman (1999) argue that power makes
individuals overestimate their performance abilities and it also leads managers to have skeptical
views of subordinates’ performance. As the power level increases, managers’ performance
ratings of others become more negative and they are less likely to monitor their own social
behaviours. This tendency makes managers express their behaviours in accordance with their
impulses, leading them to appear rude and intimidating to subordinates. These types of

62
behaviours discourage subordinates from sharing opinions and concerns. Moreover, low power
individuals tend to perceive more risk, which when confronted with managers’ aggressive
behaviours usually leads them to anxiety, making them feel uncomfortable and likely to flee
from the offending individuals. Research also suggests that those with low power use politeness
when dealing with high power managers, and rather than making direct requests, they use
indirect requests such as hints or clues or do not make a request at all.
Unions
Unions are recognized and legitimized bodies “representing a group of employees who
have joined together to represent a collective voice in dealing with management” (Dessler,
Chhinzer, & Cole, 2014, p. 440). Although membership has been declining since 1997 from 33.7
percent to 31.5 percent of employees in 2012 due to a loss of manufacturing jobs to developing
countries, union organizations have shifted their focus to white-collar (service sector) workers
(Employment and Social Development Canada, 2016). Some professions such as nurses and
teachers have dedicated bodies to represent them at the bargaining table with their employers.
Medical laboratory technologists and primary care paramedics join unions that represent multiple
types of workers; for example Ontario Public Service Employees represent more than 130,000
Ontario government employees in various sectors (Ontario Public Service Employee Union,
n.d.). There are many incentives for employees to join or form unions in their workplaces.
Unions represent members at the bargaining table, support them at grievance hearings, and
express members’ concerns about safety and unfair treatment. Unions increase members’ voice,
make them feel less intimidated and reduce the fear of retaliation from employers (Jackson,
1982; Woodland, 2010). Employers are fully aware of unions’ ability to exert voice that is
contrary to the interests of the corporations. Managements often put great efforts into keeping
63
employees from bringing unions into their organizations. Among the tactics that organizations
use to repel the unionization of workplaces are tightening work rules, monitoring employees,
communicating their objections, and making it difficult for union representatives to access
employees (Bentham, 1999). Yet, those who are protected by a union may still fear retaliation,
and thus remain silent when they observe wrongdoings. A survey of 6,618 registered nurses and
managers in the US about silence in the workplace found that while 85 percent of people were
aware of protocol breaches, only 27% were willing to confront their coworkers (Maxfield,
Grenny, Lavandero, & Groah, 2011). As the authors suggest, the culture of silence in the health
care profession is pervasive. Even the unions recognize that they cannot provide psychological
safety for their members (Anonymous, 2005). Two nurses’ unions in Ireland have called for the
health authority to come up with a protocol that would allow people to report when they believe
there is serious misconduct in hospitals. The call for change was the result of midwives’ fears of
retaliation from reporting, even though they knew that an obstetrician unnecessarily performed
many hysterectomies (Anonymous, 2006). Another nurse union in Iowa also sought protection
for its employees for disclosing poor working conditions. Only 87 of the 300 nurses who spoke
up at the hearing held by the state department of Public Health were willing to let the committee
reveal their names to the public (Anonymous, 2005).
Diversity
There are multiple reasons why management should strive for diversity in their
organizations. Canada’s birthrate is declining from 3.85 births per woman in 1960 to 1.61 in
2013. The current labor force cannot keep up with the growing economy. The aging population
is living longer and requires more expensive health care (Roser, 2015). The Canadian
government requires younger people to contribute to its revenue through the tax system in order

64
to maintain the population’s current standard of living. Canada needs immigrants to bring in new
ideas, and to help develop technology and manufacturing. As consumers, immigrants provide
markets for Canadian goods, and they pay more taxes than they accept in social services (Fleras,
2010). Between 2000 and 2007, nearly 80% of immigrants had a university degree, whereas only
25% of the Canadian-born population had the same educational level (McMahon, 2013). The
discrepancy is due to the “point system” that gives more weight to people with transferable skills
to ensure long term economic success.
While immigrants bring their beliefs, religions, arts, and their ways of life into the new
countries, they also absorb the ideas, beliefs, and practices of their host countries. The absorption
of other cultural beliefs and practices (materials and nonmaterial) is known as acculturation.
There are four types of acculturation: integration, assimilation, separation, and marginality
(Phalet & Swyngedouw, 2004). Integration encourages new immigrants to maintain their own
cultures while learning and adding new cultural skills to their repertoire. Assimilation is a
melting pot where everyone blends into one cultural system, and stops maintaining their own
cultures. Separation occurs when groups maintain their cultures, and stop having contacts with
other cultures. Marginalization occurs when people do not maintain their own cultures and
refrain from contact with other cultures (H.C Triandis, 1995).
Diversity in the workplace refers to organizations that are made up of people with
different ethnicities, genders, languages, disabilities, races, religions, sexual orientations, and
more (Public Service Commission, 2014). Research on the impact of diversity on organizational
performance has shown mixed results (Prieto, Phipps, & Osiri, 2009; Van Alstine, Cox, &
Roden, 2013). On the positive side, diversity provides more sources for creative ideas and
complex problem solving, while on the negative side, group members who differ from the

65
majority may have lower levels of psychological commitment and lower team cohesion (Prieto et
al., 2009).
As organizations’ members become more heterogeneous, employers must learn to
effectively manage diverse groups of employees. Europeans and North Americans are becoming
more heterogeneous in age, race, and ethnicity (Ilmakunnas & Ilmakunnas, 2009; Royal Bank of
Canada, 2013). Statistics Canada (2011) predicts that by 2021, one quarter of Canadians will be
55 years or over. By the time all baby-boomers have reached the age of 65 in 2031, one person in
three in the labour force is projected to be foreign-born. In the US, minorities will outnumber
Whites by the year 2042, and by 2050, 55% of the working population will be minorities (Royal
Bank of Canada, 2013). Businesses are aware of the change in population demographics, and
some have developed strategies to recruit minorities as employees (Royal Bank of Canada,
2012). Although it is important for organizations to understand individual behaviours in a
culturally diverse climate, it is also important to understand the underlying psychological
processes influencing all employees’ behaviours. In her dissertation, Hannan (2013) discussed
four plane crashes where national cultures have been implicated in organizational failures. One
of these crashes, Korean Airlines flights 801, happened because of the failure of the copilot to
provide information about the worsening of the plane’s situation to his captain (Ragan, 2004).
The underlying reasons for these disasters appeared to be related to Hofstede’s power distance
index and to the avoidance of uncertainty. Whether Korean culture contributed to the plane crash
is still a subject of debate, but scholars agree that organizations can benefit from an
understanding of Hofstede’s cultural dimensions (Bing, 2004; Jagerer & Gandarilla, 2011; M.
Wu, 2006).

66
Summary of Literature Review
Hofstede’s (2001) research identified five cultural value constructs: power distance,
uncertainty avoidance, collectivism, competition, and long-term orientation. People internalize
the cultural values of their parents and other family members. They have a high power distance if
they accept the unequal power distribution in their society. Uncertainty avoidance motivates
individuals to avoid the risk of making mistakes. Assertiveness, aggressiveness, and wanting to
win are the characteristics of competitors. Collectivists are willing to sacrifice themselves for
others. A preference for stability and the willingness to work hard for future benefits are
characteristics of long-term oriented individuals. Although the application of Hofstede’s
dimensions to national cultures has been discredited, they appear to work at the individual level,
and recent research has used them in this way.
Silence is not unidimensional, and is composed of four constructs (Knoll & van Dick,
2013b). Acquiescent silence (ACS) refers to “submissive acceptance of organizational
circumstances and a reduced awareness that alternatives to silence exist” (Brinsfield et al., 2009,
p. 20). Employees are afraid to speak up and exhibit withdrawal and resignation. While
acquiescent silence is passive, quiescent silence (QUS) is “the active withholding of relevant
ideas and opinions in order to protect oneself” (Knoll & van Dick, 2013b, p. 351). Employees
using prosocial silence (PRS) keep their opinions to themselves because they do not want to
embarrass coworkers or get them into trouble. An employee using opportunistic silence (OPS)
wants others to experience negative outcomes. All types of silence can prevent employees and
organizational leaders from detecting errors. The various types of silence are also associated with
individual cultural values (Endrass, Rehm, Andre, & Nakano, 2008; Jones, 2011; St. Clair,
2003).

67
Despite its benefits, psychological safety is not easy to foster, especially in healthcare
settings, where the hierarchical nature of the professions (e.g., physicians, nurses, pharmacists,
respiratory therapists) inhibits open discussion (Edmondson, 2004a; Nembhard & Edmondson,
2012, para. 6). Organizational leaders have important roles to play in promoting speaking up;
they can reduce the fear of retaliation, humiliation, and punishment by developing policies such
as retaliation protection (University of Minnesota, 2014) and no fault reporting (Guffey, 2009).
Researchers have found that power distance and uncertainty avoidance may be associated
with accidents that occurred because employees were reluctant to speak up about their concerns
(Greenberg & Edwards, 2009; Helmreich, 2009). Psychological safety, which appears to benefit
organizational communication, may increase conflicts by encouraging employees to speak up.
However, there is no empirical research published on the relationships among cultural values,
psychological safety, and employee silence, even though scholars suggest that value priorities
influence individuals’ attitudes and behaviours (Rohan, 2000). This study adds to the literature
by investigating the relationships between the four types of silence and individual cultural value
dimensions.
Conceptual Framework
Silence dimensions can be classified into fear based silence (quiescent and acquiescent)
and non-fear based silence (prosocial and opportunistic). The investigation of the three research
questions (introduced in Chapter 1) was broken into four parts. The first part studied the
relationship between the two types of individual cultural values (POD and UNA), and two
dimensions of silence: acquiescent silence (ACS) and quiescent silence (QUS). It also analyzed
the mediating role of psychological safety (PSY) between cultural dimensions and types of
silence (Figure 1). Here, UNA and/or POD are independent variables that influence the
dependent variables: ACS and QUS. Psychological safety (PSY) acts as a mediator between the

68
cultural values and silence constructs. The small rectangles (x1 to x15) are the items in the
questionnaire, and small round circles (e1 to e15) are errors.
Figure 1. PSY mediates the effects of POD and UNA on ACS and QUS.
The second part of the investigation studied the relationship between the three individual
cultural values: collectivism (COL), competition (COM) and long-term orientation (LTO), and
two types of silence: prosocial silence (PRS) and opportunistic silence (OPS) (Figure 2). This
figure simultaneously tests the relationships among the independent variables (COL, COM and
LTO) and the dependent variables (PRS and OPS). Structural equation modeling is the method
of choice for parts 1 and 2.
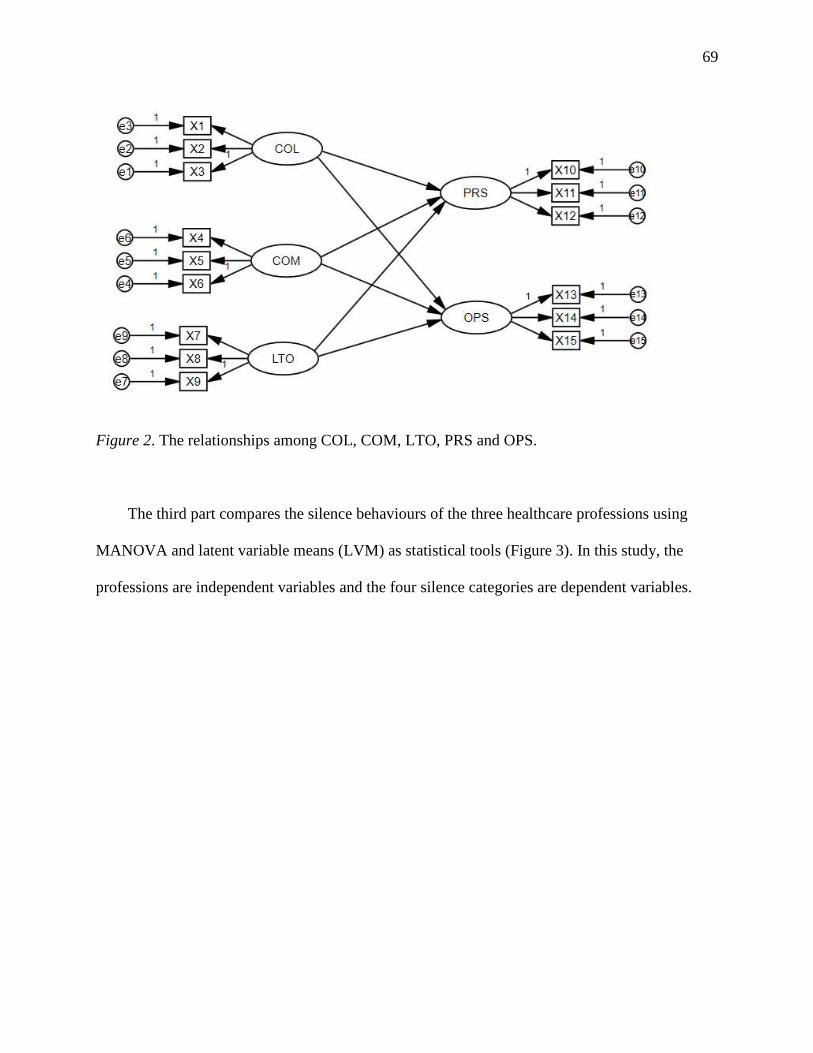
69
Figure 2. The relationships among COL, COM, LTO, PRS and OPS.
The third part compares the silence behaviours of the three healthcare professions using
MANOVA and latent variable means (LVM) as statistical tools (Figure 3). In this study, the
professions are independent variables and the four silence categories are dependent variables.

70
Figure 3. A graphic representation of MANOVA for a set of three independent variables and
four silence dimensions.
The fourth part (Figure 4) investigated the similarity and differences of the three groups
of employees on their perceptions of individual cultural values. This study was similar to the
third part, but the dependent variables are POD, UNA and COM. It also applied both LVM and
MANOVA in the investigation. The other two cultural values, COL and LTO, are intentionally
excluded in order to narrow the scope of this study. In addition past research showed no
relationship between these variables and occupation (Chan, Lee, Li, & Raymond, 2014;
Hofstede, 2001).

71
Figure 4. A graphic representation of MANOVA for three independent variables and three
Individual Cultural Value dimensions.

72
Hypothesis Development
The literature review has shown that employees with a high power distance index are
reluctant to express disagreement with their superiors, and prefer to stay silent rather than voice
their concerns. Blase and Blase (2002) conducted interviews of 50 school teachers about
principal mistreatment and learned they had to suffer from psychological and physical abuses
such as threats, sexual harassment, and racial discrimination. A subsequent research study of 172
school teachers of whom 64 percent maintained their silence, identified power distance as one of
the contributing factors (Blase et al., 2008). Hofstede (2001) found that individuals with high
power distance believe that supervisors should hold relative authority over subordinates. They
are afraid to voice their concerns for fear of reprisal, humiliation or being put down, which are
the characteristics of acquiescent silence. Moreover, they appear defensive and do not want to
embarrass their friends and bosses. Because of these reasons, I propose the following hypotheses.
Hypothesis 1A: Power distance positively correlates with acquiescent silence.
Hypothesis 1B: Power distance positively correlates with quiescent silence.
D. S. Baker and Carson (2011) studied uncertainty avoidance in sales personnel from the
US, Canada, UK, Australia, and New Zealand, and learned that individuals with high uncertainty
avoidance used group attachment and adaptation to maintain relationships and to deal with risk.
These individuals were afraid of failure, and preferred to follow established rules and
regulations. D. Lee (2013) described how individuals with high uncertainty avoidance scores
express their feelings: “….I don’t go with programs that I am not sure of, I don’t do things that I
am not sure of, I still want to check, double-check and make sure” (p. 28). Abraha (2002)
described how people feel when they are uncertain: “people prefer to be silent in order to avoid
the consequences of being active and to take a stand whenever crucial issues are taken up for

73
discussion” (p. 98). It is safer to stay silent than to take a stand. Based on these rationales, I have
developed Hypothesis 2:
Hypothesis 2A: Uncertainty avoidance positively correlates with acquiescent silence.
Hypothesis 2B: Uncertainty avoidance positively correlates with quiescent silence.
Individuals with high collectivism scores are concerned with the well-being of their
groups, with maintaining harmony and with avoiding confrontation. They look after each other.
Conflicts among group members are resolved in order to maintain the relationship, not to seek
justice. Collectivists help other individuals get jobs based on friendship rather than competency
(Hofstede et al., 2010). de Leon and Finkelstein (2011) suggested that collectivism was
positively associated with prosocial behaviours, and (Batson, Ahmad, & Lishner, 2012) indicated
that the motivation of those in collectivist societies is to benefit the group as a whole.
Because collectivists want to help their group members, they are willing to share their
ideas and knowledge with other coworkers. They want friends, coworkers and organizations to
avoid making mistakes. These rationales are the basis of the next hypotheses.
Hypothesis 3A: Collectivism positively correlates with prosocial silence.
Hypothesis 3B: Collectivism negatively correlates with opportunistic silence.
In societies based on competition, men are supposed to be aggressive, assertive,
ambitious, and successful in their careers, with high earnings. They are result-oriented, they
resolve conflicts by denying competitors opportunities, and they fight until one side wins
(Hofstede, 2001).
A research study performed in Canada suggested that teachers observed prosocial
behaviours in primary school boys who displayed cooperative characteristics. In contrast, boys
who exhibited competitiveness were aggressive and disobedient (Piche & Plante, 1991). People

74
who believe in competitiveness tend to have career ambitions, and are achievement-oriented.
They have high aspirations, are concerned about career success, and are sensitive to personal
costs and benefits. They evaluate whether specific behaviours will help them advance or are too
risky (Tangirala, Kamdar, Venkataramani, & Parke, 2013). Therefore, it is likely that individuals
who are more concerned with their personal advancement will stay silent when they see
competitors committing errors. In a cooperative society, members focus more on daily living,
and are concerned with the quality of life more than compensation. They prefer fewer work
hours, spending more time with the family, and resolving conflicts through compromise and
negotiation (Hofstede, 2001). These rationales lead to the next hypotheses.
Hypothesis 4A: Competitiveness negatively correlates with prosocial silence.
Hypothesis 4B: Competitiveness positively correlates with opportunistic silence.
Yu and Cable (2011) studied the effect of team members’ information diversity (i.e., team
members with different educational and functional backgrounds) on cooperation and found that
long-term orientation was positively related to cooperation and prosocial behaviours. Individuals
with high levels of long-term orientation regard the organization as the surrogate of the family,
and members of the organization as members of the family (Bond, 1988; Chinese Culture
Connection, 1987). Harmony and stability are desirable, and taking advantage of coworkers
could lead to undesirable future conflict. These characteristics are an indication of Hypothesis 5.
Hypothesis 5A: Long-term orientation positively correlates with prosocial silence.
Hypothesis 5B: Long-term orientation negatively correlates with opportunistic silence.
One of the methods scholars recommend to leaders regarding employee silence is to
make the organization conducive to voice (Edmondson, 2004b). Psychological safety is one of
the antecedents to voice and has been shown to be a mediator between trust, support, diversity

75
and organizational learning. Because fear and distrust are the main issues that lead to silence, I
propose Hypotheses 6 and 7.
Hypothesis 6A: Psychological safety mediates the relationship between power distance
and acquiescent silence.
Hypothesis 6B: Psychological safety mediates the relationship between uncertainty
avoidance and acquiescent silence.
Hypothesis 7A: Psychological safety mediates the relationship between power distance
and quiescent silence.
Hypothesis 7B: Psychological safety mediates the relationship between uncertainty
avoidance and quiescent silence.
There has not been a study comparing silence among various professions. Soldiers and
police officers are known to have a code of silence to protect themselves as a group. Knoll and
van Dick (2013b) suggested that high prosocial silence and high opportunistic silence might be
“an indicator for volitional contribution to keep a particular image of the social group” (p. 359).
On the contrary, the combination of high prosocial and high quiescent silence points to silence
behaviour that is caused by group pressure. Since the three professions (nurses, primary care
paramedics and medical laboratory technologists) in this study are all healthcare professions
where medical decisions are under the control of physicians, they should demonstrate a similar
silence behavior in hospitals. This leads to the next hypothesis.
Hypothesis 8: There are no differences in silence behaviors among nurses, primary care
paramedics and medical laboratory technologists.
Hofstede (2001) asserted that among the five transnational dimensions, only POD and
COM affect the occupational values. Fonne and Myhre (1996) also learned that pilots, primary

76
care paramedics and physicians have different points of view on the competition dimension.
Therefore it indicated that people with different professions have different cultural values.
Nurses, medical laboratory technologists, and primary care paramedics are trained to
ensure certainty prior to taking action related to patient intervention. Their responsibilities are to
carry out orders from physicians in relation to patients’ treatment. Therefore, I propose the last
hypothesis.
Hypothesis 9: There are no differences in power distance, competition, and uncertainty
avoidance scores among nurses, primary care paramedics, and medical
laboratory technologists.
The above nine hypotheses are broken down into four parts. Part A investigates the
relationship among power distance, uncertainty avoidance and the fear based silences,
acquiescent and quiescent. It also includes the investigation of psychological safety for its
mediating role. Part B investigates the relationship among collectivism, competition, long-term
orientation, prosocial silence and opportunistic silence. Part C studies how nurses, medical
laboratory technologists and primary care paramedics use their silence at work. The last part
examines the perceptions of the three professions on power distance, uncertainty avoidance and
competition.

77
CHAPTER THREE: METHODOLOGY AND PROCEDURES
Chapter 1 introduced the issues related to cultural values and employee silence and
proposed four empirical questions which form the basis for my hypotheses. In Chapter 2, the
literature provided an overview of cultural value dimensions, the motives for employee silence,
the mediating roles of psychological safety, and the conceptual framework and hypotheses for
this study. This chapter describes the study methodology, including ethical considerations, the
target population, the data preparation, the type of measurement, and the statistical methods
used.
Ethical Considerations
The research project received clearance from the University of Toronto on January 25,
2015. This study was an anonymous online survey that began in early February, using Survey
Wizard 2, through a computer server at the Ontario Institute for Studies in Education, University
of Toronto. The survey began with an introduction about the research project, and asked
prospective participants to click “continue” if they decided to do the survey. It also informed the
participants that by clicking “continue,” they had given consent for the researcher to use their
responses for analysis and publication.
The participants were volunteers who did not receive any compensation. Their responses
were anonymous, and they were not required to give organizations’ names. Survey Wizard 2 did
not record Internet Protocol address, and the researcher had no way of tracing the sources of data
entries. Subjects were informed of the possibility of publications and presentation of the study
results in the literature or at annual scientific meetings. They could discontinue participating in
the study at any time without penalty.
Participants might have been reluctant to answer the survey at work. However, most
would have a computer or tablet at home through which they could access the survey. The

78
survey is also available 24 hours, and seven days a week. Although participants did not get any
compensation for the survey, the research is valuable for their understanding of the relationship
between individual cultural values and employee silence, specifically in the healthcare
organizations. The final report will be made available upon request.
Participants
The participants in this study are healthcare employees who work in organizations across
Canada. The subjects represent three healthcare professions – nurses, primary care paramedics
and medical laboratory technologists. These professions help patients with life-threatening
injuries and illnesses. Nurses provide hands-on care, administer medication, interpret patient
information and make critical decisions about needed actions, and communicate with physicians
about patients’ symptoms and progression. Primary care paramedics require timely decision
making, and a delay in transportation can lead to serious injuries or loss of life. They also have to
communicate with hospital emergency departments and the misinterpretation of signs and
symptoms during these communications can lead to a wrong diagnosis and treatment. The
laboratory personnel provide information to clinicians for diagnostic decision making. Giving
out a wrong report could result in an adverse effect that could harm patients.
This study used a nonprobability, convenience sampling. Participants were made aware
of the research project through classified advertisements in professional journals, local
newspapers, organizational e-letters, snowball recruitment, and personal invitations. The above
modes of communication informed participants of the research survey. Data were collected for a
period of six months between February 7, 2015 and July 31, 2015.
Instrumentation
The survey questionnaire (Appendix A) has four sections: demographics, employee
silence (Knoll & van Dick, 2013b; Van Dyne et al., 2003), individual cultural values (Yoo &

79
Donthu, 2002), and psychological safety (Edmondson, 1999). Existing instruments measuring
individual cultural values, employee silence, and psychological safety required only minor
modifications for this study. For example, in the employee silence section (Table A2 ), the item
stem was changed from “I remained silent at work” to “when you remain silent at work, it is”,
and Item 3 from “to make me vulnerable in the face of colleagues or superiors” to “because I do
not want to be criticized by colleagues or superiors,” and “to avoid conflict” to “to avoid conflict
with coworkers or supervisors.” All three instruments asked participants to rank their opinions on
a Likert scale of 1 (strongly disagree) to 7 (strongly agree).
Demographics
This section asked for each participant’s gender, age, profession, religion, tenure (years)
in the organization and country of birth. This information was used in descriptive statistics and as
controls when predicting the relationship between individual cultural values and employee
silence (Table A1).
Employee Silence
Van Dyne et al. (2003) developed their instrument to measure employee silence, and more
than 70 articles have referred to and/or deployed their instrument either in whole or in part in
research studies. The instrument has six constructs: three types of silence (acquiescent, quiescent
and prosocial), and their voice counterparts. Knoll and van Dick (2013b) adapted the employee
silence construct for their research and added another construct called opportunistic silence
(Table A2). I will apply Knoll and van Dick’s (2013b) instrument in my research.
The following labels are used to represent the items in Table A2 in this report:
Label Items Construct
QS1 to QS6 Question 1 to question 6 Quiescent Silence (QUS)

80
PR1 to PR4 Question 7 to question 10 Prosocial Silence (PRS)
OS1 to OS5 Question 11 to question 15 Opportunistic Silence (OPS)
AS1 to AS5 Question 16 to question 20 Acquiescent Silence (ACS)
Individual Cultural Values (ICV)
The questionnaire related to ICV (Table A3) has 26 items, covering five constructs
(power distance, uncertainty avoidance, collectivism, competition and long-term orientation).
Yoo and Donthu (2002) developed and used this questionnaire to survey business students on the
relationship between ethics and individual cultural values. Since then, several investigators have
employed this instrument for studies in educational research (B. O. Anderson, 2012; Tankari,
2012), economics (Vajjhala & Stang, 2014), and marketing (Kwok & Uncles, 2005).
Items in Table A3 are represented by the following labels in this report:
Label Items Construct
PO1 to PO5 Question 1 to question 5 Power Distance (POD)
UN1 to UN5 Question 6 to question 10 Uncertainty Avoidance (UNA)
CO1 to CO6 Question 11 to question 16 Collectivism (COL)
LT1 to LT6 Question 17 to question 22 Long-Term Orientation (LTO)
MA1 to MA4 Question 23 to question 26 Competition (COM)
Psychological Safety
Edmondson (1999) developed a questionnaire about psychological safety for her
dissertation to study team learning in furniture manufacturing. The instrument (Table A4) is a

81
part of several surveys that investigated the relationship among a multitude of antecedents (e.g.,
leadership styles, trust, diversity) and organizational performances and outcomes (Carmeli &
Gittel, 2009; J. Y. Lee, Swink, & Pandejpong, 2011; Wong & Tjosvold, 2010). Item1 to Item 7
in Table A4 are labelled as PS1 to PS7.
Managing Data
Sample Size
This study applies exploratory factor analysis (EFA), confirmation factor analysis (CFA),
structural equation modeling (SEM), and MANOVA for data analyses, using SPSS, and AMOS
as well as some features of EQS programs. There is no definitive agreement on how to calculate
a target sample size for SEM, but scholars recommend a range of 10:1 to 50:1 for the ratio of
sample size to parameters (Mueller, 1996; Schumacker & Lomax, 2010). SEM uses maximum
likelihood estimation (MLE) chi-square (χ2), but χ
2 is sensitive to sample size and tends to
decrease statistical probability as the sample size increases (Schumacker & Lomax, 2010). The
target sample size for this study was about 350 participants with the goal of obtaining equal
numbers from each profession.
Missing Values
Researchers need to decide whether missing values are ignorable. Missing values were
investigated with the MVA (missing value analysis) module in SPSS. Hair et al. (2010) asserted
that five percent or less randomly missing values does not have much impact on the analysis.
When missing values are greater than five percent, the researcher will have to evaluate the
missing pattern. Hair et al. (2010) described the extent of three types of missing values: missing
at random (MAR), missing completely at random (MCAR) and missing not at random (MNAR).

82
The MAR type of missing value happens when the value of Y is dependent on the value of X.
For instance, in a survey that asks respondents for gender (X) and weight (Y), MAR might have
more missing values from females than from males. On the contrary, MCAR missing values will
show up with approximately the same frequency for both males and females. MNAR occurs
when participants at the extreme end of the distribution are missing from the survey; for
example, a survey of family income that does not include poor families in the study. MNAR is
non-ignorable (Hair et al., 2010). Missing value analysis is conducted with a missing value
module that is available in the SPSS software. A variable that has missing values less than 5% is
replaced with its median values if it uses a Likert scale. For a ratio scale such as years of
experience, the missing values are substituted with the mean values of the variable. Some cases
are dropped from the analysis if participants do not complete more than 50% of the sections
related to silence, cultural values or psychological safety constructs. For example, if a participant
answers only 3 of the 7 items on the psychological safety constructs, his PSY section will be
eliminated, leaving only silence and cultural values for the analysis. In addition, I also
scrutinized for non-engaged participants (giving the same answer for items that have a positive
and negative wording, but are asking the same question). For example, Items 1 and 4 in the
psychological safety section (Table A4) ask the same question, but Item 1 uses negative wording
(“if you make a mistake on this team, it is likely held against you”) and Item 4 uses positive
wording (“it is safe to take a risk on this team”); participants should answer these items in the
opposite direction.
Outliers
An outlier is “an observation (or subset of observations) which appears to be inconsistent
with the remainder of that set of data” (Hodge & Austin, 2004, p. 86). It is not easy to determine

83
outliers when participants are constrained to selecting an option in the specified range. As Hair et
al. (2010) suggested, outliers can be of benefit to researchers when they are indicative of
characteristics of a population not represented by the majority of the population in the sample.
Outliers can be univariate, multivariate or both.
Univariate outliers. There are many different ways to handle outliers, and statistical
packages usually provide users with a graphical display called a boxplot. The boxplot in SPSS
comprises the box and whiskers – a vertical line extends up and down from each end of the box.
The box itself has values in the range of 25th to 75th percentiles, with a cross section line at the
50th percentile. The top and the bottom whiskers show the range of values that fall within 1.5
box-lengths from both hinges (ends of the box). Any values outside these whisker ranges are
outliers. SPSS uses “0” and “*” to represent minor and major outliers (3 box lengths from 25th
or 75th percentiles) (Cohen, 1996). However, Hubert and Vandervieren (2008) pointed out that
extreme values in skewed data are often erroneously declared as outliers by the boxplot method.
Therefore, the boxplots will be interpreted with caution.
Multivariate outliers. A common criterion used to evaluate multivariate outliers is
Mahalanobis distance (D2) which measures the position of each observation compared with the
centre of all observations. The ratio of D2/degrees of freedom follows the t distribution, and Hair
et al. (2010) recommend a value between 3.5 to 4 for sample sizes greater than 100. Tabachnick
and Fidell (2007), on the other hand, asserted that D2 follows a chi-square distribution and
researchers should judge this parameter conservatively with p < .001. For my research I followed
Tabachnick and Fidell’s (2007) recommendation.
Normality

84
Researchers need to consider univariate and multivariate normality when deploying
structural equation modeling in their studies. There is no guarantee that univariate normality will
lead to meeting multivariate normality assumptions. They are not dependent on each other.
Univariate Normality. SPSS offers two well-known methods, Kolmogorov-Smirnov and
Shapiro-Wilk, to test data normality. A normal distribution is a symmetric, bell-shaped curve and
is dependent on two parameters: skewness (symmetric distribution of values around the mean),
and kurtosis (peakedness or flatness of the distribution). Based on these two values, researchers
judge data distributions with Zskewness and Zkurtosis, which are the ratios of skewness and kurtosis
to their corresponding standard errors. A calculated value exceeding ±2.58 violates the normality
assumption at a .01 probability level (Hair et al., 2010). George and Mullery (2007) suggest that
“as with kurtosis, a skewness value between ±1.0 is considered excellent for most psychometric
purposes” (p. 99).
One issue that continues to appear in the literature is how normality affects SEM analysis
that uses MLE as a method of statistical calculation. MLE is sensitive to non-normality, but
scholars agree that as long as data do not extremely deviate from normality, this should not
interfere with the analysis. For example, Kline (1998) suggests to researchers to use 3.0 and 10.0
as compromised cutoff points for univariate skewness and kurtosis. Other methods that
researchers can apply to non-normal data in SEM are asymptotic distribution free (ADF),
generalized least square (GLS), weighted least square (WLS) and Satorra and Bentler’s adjusted
χ2( S-Bχ
2 ), and Bayesian estimation. The application of ADF to SEM is reliable only when the
sample size is large (1000 to 5000 cases) (Byrne, 2010; Handcock & Liu, 2012). It is a method
of choice for LISREL, where the PRELIS computer program can be used to convert data into an
asymptotic matrix form prior to analysis. The S-Bχ2 performs well under a variety of conditions

85
when the sample size is above 200 cases. Below this number, results are distorted due to inflated
χ2 (Lei & Wu, 2012). S-Bχ
2 corrects the inflated χ
2 of the MLE method and increases the value of
standard errors, thus reducing the false rejection of the model. S-Bχ2 is available in EQS and
MPlus, two of the four most popular SEM programs. AMOS does not provide S-Bχ2 but offers a
bootstrapping technique and Bayesian estimation as a way to validate non-normal data.
Multivariate Normality. Quite often the appearance of a normal distribution at the
univariate level does not reflect the true distribution of data with more than two variables.
Viewing a mountain from a distance, an investigator may see a bell shape, but does not know
what lies behind the ridge. The investigator has to stand on top of the peak to learn whether the
mountain is symmetrical. This area has not been well addressed in the social sciences research
literature. Research textbooks such as Social Research Methods (Neuman, 2006b) and
Educational Research (Creswell, 2012) do not mention multivariate normality. Mecklin and
Mundfrom (2003) studied multivariate normality, and stated that at least 50 procedures were in
existence. They compared 13 multivariate normality tests by using a Monte Carlo approach to
generate 10,000 data sets for many types of multivariate distribution. The authors recommended
the Hense-Zirkler procedure as a formal test of the null hypothesis of multivariate normality.
Teo, Tsai, and Yang (2013) suggested a more liberal method and made the following
recommendation:
In applied research, multivariate normality is examined using Mardia’s normalized
multivariate kurtosis value. This is done by comparing the Mardia’s coefficient for the
data under study to a value computed based on the formula p(p +2) where p equals the
number of observed variables in the model (Raykov & Marcoulides, 2008). If Mardia’s
coefficient is lower than the value obtained from the above formula, then data is deemed

86
as multivariate normal. As with the Hoelter’s critical N, the Mardia’s coefficient is found
in most SEM software (e.g. AMOS). (p 11)
My study followed the above recommendation, since the main software used in this study
was AMOS. Distributions were carefully investigated for values or cases that depart from
univariate or multivariate normality.
Bootstrapping
Bootstrapping is a simulation technique in which samples are redrawn with replacement a
specific number of times. This technique became popular after Efron and Tibshirani (1993)
introduced it in the late 1980s. Several works have been published in the literature comparing
statistical results between bootstraps and normal distributions (Leger, Politis, & Romano, 1992;
Taylor, 2005).
In linear regression, B. Thompson (1994) illustrated the usefulness of the bootstrap
technique by comparing three validation methods (cross validation, jackknife, and bootstrap).
Thompson showed that a 95% confidence interval of the bootstrap results were similar to cross-
validation analysis. SEM is an extension of linear and multiple linear regressions. The main
application of bootstrap in SEM is to find an approximation of standard errors when data violate
the multivariate normality assumption (Arbuckle, 2011; Nevitt & Hancock, 2001). It is a better
choice than Sobel’s formula in the investigation of mediation and suppression effects, as the
bootstrap is not based on normal distribution assumptions (Cheung, 2008). Since then, many
investigators have used bootstrapping as a method of choice for studying the effects of mediation
(Bodla, Afza, & Danish, 2014; Koehn, Pearce, & Morris, 2013; York, 2013). However,
bootstrapping is not a panacea for every violation, as it is dependent on its original sample
distribution. Nevitt and Hancock’s (2001) study showed that when sample size n ≤ 100, the
87
bootstrap inflated the values of standard error, and MLE performed better. At sample N ≥ 200,
bootstrap results are more reliable than the MLE estimation under the violation of multivariate
normality.
Homoscedasticity
Homoscedasticity is also known as homogeneity of variances, which implies that
variables have relatively equal variances. This concept is applied to both dependent and
independent variables. In linear regression, the dependent and independent variables should have
similar variances. In analysis of the variance (ANOVA) and multivariate analysis of the variance
(MANOVA), homoscedasticity only applies to dependent variables. SPSS provides two common
methods, Box’s M and Levene’s test, to detect deviant variables. Hair et al. (2010) suggest that
most of the heteroscedasticity comes from skewed data distributions, and can be corrected by
data transformation. However, Tabachnick and Fidell (2007) warn the reader that Box’s M test is
notoriously sensitive, and researchers should use a cutoff p-value of .001 rather than the usual
.05.
Multicollinearity
In a study that utilized multiple independent variables, researchers have to be concerned
about mutual interference among the predictors: “Multicollinearity represents the degree to
which any variable’s effect can be predicted or accounted for by the other variable in the
analysis” (Hair et al., 2010, p. 24). Multicollinearity should be of real concern to investigators
when the independent variables are highly correlated (> .9) (Tabachnick & Fidell, 2007). This
suggests that the system of measurement has redundant items, which inflate the size of the error
terms and weaken the analysis. Multicollinearity can be assessed with the variance inflation

88
factor (VIF) and the tolerance statistic in SPSS. The recommended cutoff value is 10 (Hair et al.,
2010).
Statistical Power
Statistical power has been a neglected issue in SEM. It is possible to get papers published
with an unacceptable level of power (Hermida, Luchman, VNicolaides, & Wilcox, 2015).
Statistical power is the probability that leads to a rejection of the null hypothesis when it is false
(Hair et al., 2010). In statistical testing, researchers will conclude that they will reject or fail to
reject the null hypothesis (H0), and can make two types of errors. Type I error happens when a
hypothesis is true, but a researcher rejects it because the result does not support his or her
proposal. Normally, researchers use a probability of .05 as a criterion, meaning the prediction is
expected to be 95% right and 5% wrong. In healthcare, a type I error happens when a pregnancy
test gives a false positive result, when the woman is not pregnant. With a type II error, the
hypothesis is incorrect, but the researchers fail to reject the null hypothesis and accept the results
as true because statistical results support their proposition. For example, if researchers propose
that males and females have the same height, and the results of the analysis support the
hypothesis (p < .05), they make a type II error. There is balance between type I and type II
errors; thus, when researchers tighten the type I error (e.g., from .05 to .01), they increase the
probability of type II error. Scholars accept a probability of 20% as a good cutoff point for type
II error.
In this study, the statistical power is calculated with the computer program G*Power,
which is freely available through the internet at http://www.gpower.hhu.de/en.html. G*Power
calculates statistical power using a non-centrality parameter index (NCP), a fit index that is
available in all commercial SEM software (Faul, Erdfelder, Lang, & Buchner, 2007).

89
An alternative to G*Power is another free software program that utilizes root mean
square error of approximation’s (RMSEA) confident interval (CI) to check statistical power.
MacCallum, Browne and Sugawara (1996) propose that χ2 is too sensitive to sample size, and
RMSEA should be an alternative to the power calculation. However, users need to review the CI
of RMSEA and decide to apply one of the three types of power calculation. The first type,
known as “exact fit” happens when the lower bound of the CI range has a zero value. The second
type “close fit” has a CI below .05 (an arbitrarily chosen number). The “not-close fit” has a CI
range above RMSEA of .05. If the CI straddles .05, then the researchers have to conduct power
analysis for both “close fit” and “not-close fit.” Researchers can use this information to calculate
statistical power through a program that is provided by Preacher and Coffman (2006) at
http://quantpsy.org/rmsea/rmsea.htm. In this thesis, I applied both RMSEA and NCP for power
analysis.
Statistical Analysis
Multiple statistical procedures will be required in this study, starting with descriptive
analysis, followed by MANOVA, bivariate correlation, exploratory factor analysis (EFA),
confirmatory factor analysis (CFA), and ending with structural equation modeling (SEM).
Descriptive Statistics
This study reported the descriptive statistics, such as the mean, standard deviation,
frequencies, maximum, minimum, skewness, and kurtosis of each variable. Histograms not only
enable researchers to peruse the frequency distribution, but also investigate the bimodal
distribution, which indicates a dual population in the sample (Cohen, 1996). The descriptive
statistics also display the age distributions among the three healthcare professions that enable

90
decision makers to see the trend of employment. The mean silence scores and mean individual
cultural values of each professional group will be used for comparison in MANOVA.
MANOVA
While ANOVA only applies to one dependent variable, MANOVA analyzes multiple
criterion variables. In this study, profession (nurses, medical laboratory technologists or
paramedics) is the categorical independent variable, while acquiescent, quiescent, prosocial, and
opportunistic silences are dependent variables.
There are five criteria that analysts have to know prior to the interpretation of their
results. First, participants have to be independent in answering the survey. They cannot consult
each other and come to a consensus in responding to the survey, and they cannot participate
more than once. Second, univariate and multivariate normality are desirable for the analysis.
Third, homoscedasticity is also required prior to interpretation, thus heteroscedastic variables
must be remedied through data transformations similar to those used to achieve normality.
Fourth, there is a requirement for adequate correlation among variables, which can be checked
by Bartlett’s test of sphericity. Last, the sample size of each group must be greater than the
number of variables. These rules are not easy to comply with, but researchers usually try to
minimize the extent to which they stray from these criteria (Hair et al., 2010).
Prior to MANOVA analysis, items from each latent construct are combined to create
indices of 4 and 3 variables for silent and individual cultural value constructs, respectively. All
of these composite variables have to go through vigorous checking for normality and outliers at
the univariate and multivariate levels. Some composite items that depart from normality are
transformed through a two-step transformation process prior to the analysis (Templeton, 2011).
Latent Variable Means

91
Although a number of scholars advise researchers to consider latent variable means
(LVM) as a method of comparison, MANOVA is still the method of choice. Advocates of LVM
suggest that MANOVA is only fit for measuring manifest means, which allow direct
observations such as performance that is based on speed, and frequency (Byrne, 2010; Cole,
Maxwell, Arvey, & Salas, 1993; M. S. Thompson & S. E. Green, 2013). MANOVA statistics is a
formative system, but LVM is reflective (M. S. Thompson & S. E. Green, 2013). For example,
pollen, dust, and chemical can cause an allergic reaction (formative), but an allergic reaction
causes fever, rash, and fever (reflective). Another example, a triathlon comprises running,
swimming, bicycling, and can be measured with speeds; therefore, MANOVA is the suitable
method. In this instance the three sports define the construct triathlon, and SEM (a reflective
system) is not a good solution. On the contrary, opportunistic, acquiescent, quiescent, and
prosocial silences are not observable and thus LVM is more appropriate for the task.
Bivariate Correlation
A common practice in multivariate statistics is to present a correlation matrix in the
report that allows readers to see the strength of the relationship between variables. The problem
with reporting a correlation matrix is the impression of significance of the correlation. For
example, Knoll and van Dick (2013b) reported a 10 x 10 matrix and noted which values were
significant at .05 and .01, as printed out in the computer outputs. This may be true, but the 10 x
10 matrix creates (10 x 9)/2 = 45 correlations, and the chance that it could be wrong is 45 x .05 =
2.25, which means that 2 or 3 correlations are expected to be significant just by chance (Bobko,
2001). If 20 of the correlations are significant which two are not? This is a type I error (reject the
null hypothesis when it is true). To reduce the chance of committing a type I error, researchers

92
can adjust their results by applying the Bonferroni correction to decrease the required p value by
dividing by the number of correlation pairs (Tabachnick & Fidell, 2007).
Exploratory Factor Analysis
When scholars want to measure characteristics that cannot be directly observed, they
have to develop methods that can quantify the latent variables. For example, researchers can
measure students’ verbal skills, reading comprehension and mathematics skills as indicators of
intelligence. Social scientists measure employee complaints, absenteeism, tardiness, error rate,
and productivities as indicators of their satisfaction. At the analytical phase, an investigator will
look for the best linear combination of the items in such a way that he or she obtains accounts for
most of the variance from these variables. This is an extraction process that utilizes linear algebra
to solve the problem. The end product of exploratory factor analysis (EFA) is a set of constructs
that comprises some or all of the items in the questionnaire. The most common criterion for the
inclusion of items in the construct is to select variables that have high loadings.
In the analysis, all items of each construct I use will be analyzed with EFA. Although
previous researchers have already analyzed responses using EFA, the change in participants
could alter the composition of the items in the construct. In this study, I used EFA with
maximum likelihood estimation and oblique rotation on normally distributed data. Since data in
this analysis were ordinal data, I avoided transforming them into a different format as
transformation changes the equidistance assumption of the Likert scale, causing difficulty in data
interpretation. Therefore, for data sets that did not comply with normality criteria, I extracted the
information with principal axis factoring, a distribution-free data reduction method. In terms of
factor loading in EFA, Hair et al. (2010) recommended .3 as a minimum for the cutoff point for a
sample size greater than 300. The employee silence questionnaire (Knoll & van Dick, 2013b)

93
was developed and tested online in Germany, and the CVSCALE (Yoo et al., 2011) in Korea and
the US. All of their participants had different backgrounds from healthcare professions in
Canada.
Reliability and Validity
According to Creswell’s (2012) definition, “reliability means that scores from an
instrument are stable and consistent” (p. 159). It can be described as similar to bullet marks that
are close together on a target but not necessarily in the centre (they can be outside the ring
altogether). In measuring the constructs, researchers cannot visualize the closeness of these
marks, but they are able to judge them with a statistical procedure (Cronbach’s alpha), which is
designed to measure the internal consistency of items in the construct. Experts recommend a
minimum of .70 (George & Mallery, 2007). Cronbach’s alpha (α) has values in the range of 0 to
1.0, and according to George and Mallery (2007) α > .70 is acceptable, > .80 good, and > .90
excellent. In addition to the alpha value, the item-to-total correlation should exceed .50 and inter-
item correlation has a minimum of .30.
Creswell (2012) states that “validity is the development of sound evidence to demonstrate
that the test interpretation (of scores about the concept or construct that the test is assumed to
measure) matches its proposed use” (p. 159). Hair et al. (2010) refer to it as the accuracy with
which the instrument measures the concept of interest. There are four types of validity that have
been commonly recognized in the literature (Neuman, 2006b). Face validity is based on the
judgment of experts in the scientific community. Content validity addresses the issue of scope of
measurement: whether all aspects of the construct are captured in the instrument. For example, if
the researchers’ definition of culture includes values, beliefs, music and dress, but they only
develop a questionnaire that asks participants about dress and music. The use of the results will

94
have low content validity. Criterion validity covers two subtypes: concurrent and predictive.
Concurrent validity evidence is collected when scholars develop new instruments to measure an
existing construct by comparing them with the existing “gold standard.” Predictive validity
evidence tells researchers how well the construct will predict the future event. Is a student’s GPA
a good indicator of his or her performance in college? The last type, construct validity, is the
most important in social science research. Construct validity means “the validity of inferences
about the constructs (or variables) in the study” (Creswell, 2012, p. 303). Investigators have to
ensure the survey instrument exhibits the two subtypes of construct validity: convergent and
discriminant validity. Convergent validity indicates “that multiple measures of the same
construct hang together or operate in a similar way” (Neuman, 2006a, p. 194). Discriminant
validity is the opposite of convergent validity. For example, if a set of 10 items consists of 5
items that measure conservatism and 5 items that measure liberalism, the 5 items for
conservatism should stay together and the 5 items that measure liberalism should be negatively
related with conservatism. One more comment suggests that, “Construct validity is never
‘proved’; it is merely accepted as long as supporting evidence strongly outweighs contrary
evidence” (Jaeger, 1993, p. 80).
Construct Validity
Before SEM became available, multitrait multimethods (MTMM) was the only approach
researchers used to assess the construct validity of a measurement. The method, developed by
Campbell and Fiske (1959), uses multiple methods to measure the same traits; for example, the
assessment of manager performance in administration, communication and feedback by
superiors, peers, and subordinates. The method is complex, time consuming and involves
personnel at multiple levels. When researchers realized the advantage of SEM, they started to

95
apply it to their investigations of unobserved constructs. Liozu and Hinterhuber (2014), for
example, suggest that when all variables load at levels greater than .40 on expected factors, the
construct exhibits convergent validity. Fornell and Larcker (1981) advised researchers to use
factor loadings and covariances of the constructs in confirmatory factor analysis (CFA) to
measure composite reliability (CR), and average variance extracted (AVE). AVE is a more
conservative measure than CR, and on this basis, researchers can use the CR value to assess
convergent validity. Although the recommended value for AVE is .50, there is no real
recommendation for CR. Hair et al. (2010) advised their followers to use .70 as an ideal value
for CR, but between .60 and .70 is also acceptable, provided other indicators are good. They
recommend .50 for the value of AVE, because lower than this indicates that error variance is
greater than variance extracted by the construct.
Malhotra and Dash (2011) suggest that “AVE is more conservative, and on the basis of
CR alone, researchers can reach the conclusion of convergent validity, even though more than 50
percent of the variance is due to error” (p. 702). Furthermore, Seker (2013) notes that any factor
loading greater than .30 is good and values should be kept in the analysis. In his study on
students’ attitudes toward school, the author reported six factors: teaching, images, loneliness,
testing, reluctance and belongingness. None of his factors had a CR greater than .34, and one of
them is only .19.
Confirmatory Factor Analysis
In CFA, researchers already know how many and which items are present in the factor as
well as the number of dimensions in the construct. CFA will confirm how well our specification
of the factor matches reality. One of the problems of structural equation modeling programs such
as AMOS is that they analyze data with maximum likelihood estimation, and require normally

96
distributed data. In the case of non-normally distributed data, the software offers the
bootstrapping technique and Bayesian estimation as alternatives. Yet, these two methods have
not been widely used in the literature, and comparison with other researchers’ use of these
methods is not possible. EQS is a structural equation modeling program that is gaining
popularity but is more difficult to learn and lacks several features that are in AMOS. Yet, it has
one feature called robust MLE that applies the Satorra-Bentler scaled chi-square test to non-
normally distributed data. Because of the oversensitivity issue of MLE, researchers use other
model fit indices as criteria to judge whether the model [S] is considered a significant departure
from the theoretical model [∑].
Multigroup CFA
In the analysis of data that come from various occupations, it is incumbent on the
researchers to ensure that the structure model is invariant across groups. There are 2 steps that
researchers have to follow after analyzing the model fit of the pooled dataset.
Configural Invariance. The focus of configural invariance is to ascertain that the number
of factors and the pattern structures are similar across nurses, paramedics and medical laboratory
technologists. Researchers do not put any constraints on the loading parameters, allowing them
to freely take the values that fit the model. Items that load on the constructs for one profession
will load on the same construct for the other professions. The violation of this rule indicates that
the CFA structure is at variance, implying that groups do not have the same number of factors
and/or same factors of fixed and free loadings. In this case group comparison is invalid, and
researchers have to investigate each item as the possible cause of the violation, and remove these
items from the analysis.

97
Measurement invariance. Researchers put effort into this step to learn whether the
parameters are equivalent across groups. All factor loadings are fixed to the same values across
all groups (constrained model), and this model is compared to the base configural
(unconstrained) model. Two methods can be used to assess measurement invariance: significant
changes in the p-value of χ2 and change in comparative fit index (CFI) values. Cheung and
Rensvold (2002) conducted a Monte Carlo simulation and suggested that researchers accept the
hypothesis of measurement invariance when a change in CFI value is less than .01. Items that do
not load in all three groups would be candidates for removal prior to MANOVA or SEM
analysis.
In addition to the structural invariance test, researchers still need to study common
method bias. There is a lack of research on common method bias, but one problem that scholars
agree upon is answering in socially desirable ways. Three methods that have been commonly
cited in the literature are Harman Single Factor, the common latent factor and marker variable
methods (Podsakoff, MacKenzie, & Podsakoff, 2012). Harman Single Factor test is conducted
under EFA by making the computer program load just one factor. A value that explains more
than 50 percent of the variance indicates confounding variables that are not related to the
constructs of interests. The common latent factor (CLF) method is conducted using SEM
software, where a common variable is added, allowing it to link to all items in the model. This
method tells researchers about the confounding value of each item in the model. The marker
variable is the best method, but researchers have to prepare items unrelated to the investigating
constructs. One disadvantage of the marker variable technique is that it increases the number of
items participants have to answer.

98
This study applied CFA to confirm whether the four forms of employee silence (Knoll &
van Dick, 2013b) were empirically distinct constructs. CFA was also applied to individual
cultural values (Yoo et al., 2011) and psychological safety (Edmondson, 1999). It utilized the
common latent factor method and Harman Single Factor test for the investigation of common
method bias, plus configural and measurement invariance to investigate the CFA equivalency of
group structures.
Structural Equation Modeling
SEM has five building blocks: model specification, model identification, model
estimation, model testing, and model modification (Schumacker & Lomax, 2010).
Model specification. At the first stage, researchers decide how the constructs are related
based on relevant theory, research, and information. Which variables are dependent (Y) or
independent (X)? Are there any variables that influence both X and Y? The goal of this step is to
find the model that fits the covariance structure of the sample of respondents. Covariance
structure is the variance and covariance values that are arranged in a tabular format.
Model identification. Schumacker and Lomax (2010) advise researchers to solve the
model identification problem before moving to the next stages. The most difficult stage for SEM
researchers is learning how to identify free parameters. A model is under-identified if one or
more parameters of the theoretical model matrix [∑] cannot be determined because of inadequate
information from the sample matrix [S]. In mathematical terms, [S] < [∑]. When [S] = [∑], the
model is just-identified. A model is over-identified when [S] > [∑]. For example, Figure 5 has
19 factor loadings (arrows from the constructs to the rectangles), and 19 error variances (small
circles), and 10 correlations among the constructs. These total to 48 (19 +19 + 10) free
parameters in the theoretical matrix [∑]. There are 19 items in the questionnaire, and following

99
the formula p(p + 1)/2, matrix (S) will have 190 (19 x 20/2) degrees of freedom. Therefore, [S] >
[∑]. The model is over-identified, and the degrees of freedom is 142 (190 – 48).
Figure 5. Model identification of cultural dimensions.
Model estimation. Computer programs normally provide multiple methods to determine
parameter values. Researchers have to decide whether ordinary linear regression, or maximum
likelihood estimation (MLE), or weighted least squares (WLS), or generalized least squares
(GLS) is appropriate for their data characteristics. MLE is the most popular approach because it
yields the best possibility of finding the desirable model. However, MLE is sensitive to
multivariate non-normality. In addition, χ2, which is an index MLE uses to compare the
difference between the data and theoretical models is also sensitive to a large sample size (n >
200) (Hair et al., 2010).
Model testing. There are numerous parameters to use for model testing. There are two
major concerns – the global fit, and the parameters of the model. The first step is to review the

100
global fit of the theoretical matrix [∑] and the data matrix [S] through chi-square χ2, comparative
fit index (CFI), root mean square error of approximation (RMSE), and many others. The second
step is to review each individual parameter to test whether it is significantly different from zero,
whether the sign (+/-) agrees with the theory, and whether the parameter values fall in the
acceptable range (Schumacker & Lomax, 2010).
Model modification. The final step is to decide how well [S] fits [∑], and to revise the
model if needed. Modification is achievable with forward searching (adding more paths) or
backward searching (dropping paths). Computer programs such as LISREL, AMOS, MPlus, and
EQS provide a modification index that tells the researchers whether to add a path (forward
search) to make the model pass the x2 test. Of course, the path recommended by the computer
program has to make sense to the researchers. Once the recommended path has been added,
analysts will have to reinterpret parameter estimates and the statistical significance again.
However, if the initial model differs from the true model, it is less likely that the researchers will
find the correct modification.
Model Fit Indices
There are four popular software programs (LISREL, AMOS, EQS, and MPlus) that offer
several model fit indices for analysts to compare their results with the acceptable criteria. In this
study I used 5 common indices that AMOS software make available in the program and were
recommended by Hair et al. (2010). They were χ2/df, CFI, RMSEA, SRMR, and p of Close Fit
(PCLOSE).
Chi-Square (χ2). χ
2 is too sensitive to sample size and to multivariate non-normality; for
example, χ2 usually yields a significant probability level (p < .05), when the sample size > 200,
and non-significance (p > .05) when n < 100 (Schumacker & Lomax, 2010). Because of its

101
weakness, scholars have advised researchers to adjust χ2 by dividing it by the degrees of
freedom, and accept the value ≤ 3 (Arbuckle, 2011). This is the index I used in the analysis.
Understanding the sensitivity of χ2, EQS and MPlus offer Satorra-Bentler scaled statistics
(S-Bχ2) as well as a robust standard error for researchers to correct for non-multivariate
normality. According to Byrne (2006), S-Bχ2 is “the most reliable test statistic for evaluating
mean and covariance structure models under various distributions and sample sizes” (p. 138).
Comparative fit index (CFI). This is one of the most popular indices as it is insensitive to
model complexity. All software use the same formula for CFI, which has a value between 0 and
1. Values above .90 are associated with good fit. CFI is a derived value from χ2 values of the
proposed model and the null model.
Root mean square error of approximation (RMSEA). RMSEA also derives its value from
χ2, by taking the sample size and degrees of freedom into consideration. RMSEA is one of the
most widely reported indices in CFA analysis, as it tells researchers how well a model fits the
population. A good model fit is indicated by a value below .08.
Standardized root mean square residual (SRMR). SRMR is measured as a difference
between the observed correlation and predicted correlation. A value of 0 indicates perfect fit, but
.08 and below are acceptable (Hair et al., 2010).
p of Close Fit (PCLOSE). This is a p-value for testing the null hypothesis that the
population of RMSEA is not greater than .05. If p ≤ .05, the model is a close fit (Arbuckle,
2011).
The above criteria for the five fit indices are only rules of thumb. Hair et al. (2010) advise
researchers to take sample size (n) and number of variables (m) into consideration when deciding

102
their cutoff points. For example, use a CFI cutoff point of .95 or greater when n > 250 and m
<12. However, when n > 250 and m > 30, the cutoff point can be reduced to .92.
Mediation
Since Barron and Kenny (1986) published their advice on the issue of moderator-
mediator variables, researchers have had a clear guideline on the differences between the two
types of variables. According to the authors, investigators should review the mediation effect of
the intervening variable when there is a significant coefficient (Path C’) of the regression
between X and Y (Figure 6A).
X YC’
X
M
Y
a b
C
Figure 6A
Figure 6B
Figure 6. Conceptualized model of mediation adapted from Barron and Kenny (1986).
The variable functions as a mediator (Figure 6B) when three conditions occur: (1) there is
a significant association between X and M (Path a), (2) there is also a significant association
between M and Y (Path b), and (3) when Path a and Path b are controlled, and Path C’ is reduced
to zero. To find out whether Path a*b is significant; researchers apply the Sobel formula, which
uses unstandardized coefficient βs and their standardized errors. Figures 6A and 6B are
represented by the following two equations:

103
Figure 6A Y = k1 + C’X +e1 ……………………………… (1)
Figure 6B M = k2 + aX + e2 ……………………………… (2)
Y = k3 + CX +bM +e3 ………………..……….. (3)
Since the publication of their article, the paper has been cited 14,209 times (February
2013) in PsycINFO (Jose, 2013). Their theory, however, is being challenged as Zhao, Lynch, and
Chen (2010) have shown that even if Path C’ in Figure 6A is non-significant, the mediator can
also occur. According to Zhao et al. (2010), “There need not be a significant zero-order effect of
X on Y, rxy, to establish mediation” (p. 199). This could happen as a result of two mediators
(complementary and competitive) cancelling each other. To Zhao et al. (2010), what really
matter are equations (2) and (3), which can evolve into five situations as illustrated in Table 2.
Table 2
Decision for Establishing Types of Mediation and Non-mediation, adapted from Zhao et al.
(2010)
Mediation a × b C a × b × c
Complementary * * (+)
Competitive * * ( - )
Indirect-only * NS NA
Direct-only NS * NA
No-effect NS NS NA
* p <.05, NS non-significance, NA not applicable, (+) positive sign, (-) negative sign.

104
This argument appears to be gaining ground as other scholars support Zhao et al.’s
opinions. For example, Rucker, Preacher, Tormala, and Petty (2011) state that “we question the
requirement that a total X Y effect be present before assessing mediation” (p. 361). In
addition, the authors also asserted that the Sobel formula can lead to misleading conclusions as it
relies on the normal distribution of the a × b product, which does not happen. The bootstrapping
technique yields more reliable results as it does not assume the product (a × b) to be
symmetrically and normally distributed. The proposal is gaining ground as the bootstrapping
feature becomes available in commercial software (Koehn et al., 2013; Little, Card, Bovaird,
Preacher, & Crandall; Nevitt & Hancock, 2001; Rucker et al., 2011).
In my investigation of the mediating effect of psychological safety between individual
cultural values and employee silence, I used Zhao et al.’s (2010) typology. However, I also used
the Sobel formula to compare the results.
Moderation
Psychological safety can play a mediating role in one circumstance (Edmondson, 1999;
Liang, 2014) and act as a moderator (Martins, Schilpzand, Kirkman, Ivanaj, & Ivanaj, 2013) in
another. Therefore, although moderation was not the focus of this study, I included a test for
moderation.
Moderation is an interaction process by which the third variable, moderator (Z), affects
the direction or the strength of the relationship between the independent (X) and the dependent
(Y) variable. Both X and Z may have a significant relationship with Y, but the moderation
hypothesis is supported if the product (XZ) is significantly correlated with Y. Because the
moderation effect is represented by the multiplication product, XZ can correlate with the
independent X. In response to this problem, Kleinbaum, Kupper, Muller, and Nizam (1988)
105
recommended mean-centering the variables X and Z. More recent research suggests that mean-
centering does not have an influence on the moderation result (Jose, 2013).
Validation of the Results
SEM enables researchers to learn about the relationship between multiple independent and
multiple dependent variables. Yet, it is difficult to know whether the results will hold true for
general populations. Hair et al. (2010) recommend three methods for validating the results:
1. If the sample size is large enough, split the sample into two sets and analyze them
separately, then compare the results.
2. Collect another sample to see whether one can duplicate the result.
3. Employ bootstrapping to draw random subsamples from the same dataset.
SEM requires a large sample size and collecting another sample is time consuming and quite
expensive. This study collected 378 responses, which is not enough to split the sample because
each panel of analysis has a minimum of 25 variables, implying that it needs 250 samples to
maintain a 10:1 ratio. This leaves bootstrapping as an option for validating the results. However,
alternative methods in addition to the conventional ones are also added in this study. The
following are the validation methods used in this study.
Model fit. AMOS, the major software I used for the CFA analysis, gave inflated χ2 when
the data departed from normality. For this reason, several other fit indices were utilized to ensure
that the sample matrix [S] did not depart significantly from the implied theoretical matrix [∑].
Factor loadings. As mentioned earlier, scholars have different opinions as to how much
departure from normality there can be before it affects the analysis. When data severely depart
from normality, the high kurtosis can affect factor loadings. To overcome this issue, I employed
bootstrapping to confirm standardized factor loadings.

106
Common method bias (CMB). This study was able to apply two of the three procedures to
check for common method bias: Harman Single Factor test and the common latent factor
method. The common latent factor method is more sophisticated and better defined than the
Harman Single Factor test.
In addition to comparing the professions, this study also explores the common method
bias that can happen when participants respond to the questions with socially desirable answers
(Podsakoff et al., 2012). CMB is a real concern when the questionnaire contains both dependent
and independent variables; for example, a survey that asks employees to rank their job
satisfaction and organizational performance. Chang, van Witteloostuijin, and Eden (2010)
suggest that this type of survey can create false correlations between independent variables and
dependent variables. Two methods the authors recommend for the assurance of the integrity of
the survey results are to collect independent and dependent variables from different data sources.
Another method is to use statistical remedies prior to correlation studies. Harman’s Single Factor
test is one of the methods that many researchers apply to their data.
After common latent factor (CLF) has been applied to the data, the composite values are
generated with AMOS to be used as inputs for SEM and MANOVA.
Mediation. The Sobel formula as well as bootstrapping technique was applied to
investigate the effect of psychological safety as a mediator between individual cultural values
and employee silence.
MANOVA. In addition to the conventional method, I also applied the bootstrapping
technique to validate the parameter estimates in the MANOVA. In addition, latent variable
means were used to investigate the group differences for both individual cultural values and
107
employee silence. This is a relatively new method that takes advantage of new features in the
AMOS software.
Outlines of the Investigation
Figure 7 illustrates the schematic diagram of the investigation, which starts with data
screening for normality, outliers, heteroscedasticity, and missing values. The data that do not
conform to the guidelines will be transformed as discussed in the previous section. The
transformation of non-normal distributed data is not always ideal, as it can change the structure
of the Likert scale, which is intended to have equal distances between response options.
Therefore, the transformation of data will be applied only when group comparisons are
conducted under MANOVA since that method is very sensitive to skewness and kurtosis.
EFA extraction is dependent on the distribution of the data. MLE is used for the
extraction factors from normally distributed data, and principle axis factor analysis (PAF) is
applied to data with significant skewness and kurtosis. Items in EFA that meet a loading level of
.40 have to go through another rigorous selection process in the CFA to ensure they really belong
to their expected constructs. One additional investigation at this step also includes Harman
Single Factor test to test for common method bias.

108
Figure 7. Schematic diagram of the investigation.
The CFA process also includes two types of invariance tests plus a common method bias
investigation. The configural invariance test is applied to ensure the structure represented in the
CFA fits across the three professions. This means indicators must load on the same factors across
the three professions. The measurement invariance is achievable by constraining all of the item
parameters to the same values. The chi-square results of the configural and measurement
invariance are compared with the overall chi-square test. If there is a significant difference, each
item will be individually investigated for the cause of the discrepancy (Nayena Blankson &
McArdle, 2013). AMOS assists researchers who investigate this concept with critical ratio and
unstandardized loadings.

109
Conclusion
There are a few other statistical tests associated with SEM and MANOVA such as t-test,
linear regression and exploratory factor analysis. The t-test checks whether factor loadings are
different from zero. The linear regression assumes a linear relationship between variables in the
path analysis. EFA screens out items that do not sufficiently load on the factor.
The basic principles of SEM is the comparison of the sample covariance [S] with the
implied theoretical model [∑], using χ2 as a test of significance(Schumacker & Lomax, 2010).
Since χ2
is overly sensitive to multivariate normality and sample size, social scientists adopt other
types of indicators as guides for the assessment of model fits. The five indices I used in this
study were χ2/df, CFI, RMSEA, SRMR, and PCLOSE. The cutoff values of these indices are
provided to researchers by Hair et al. (2010). In addition, the standardized regression weights of
each item in the CFA have to be statistically significant. This study validated item loadings with
the bootstrapping technique.
In a study of SEM that includes participants from various professions, researchers have to
ensure that participants across professions interpret the items in a similar way. This study
employs configural and measurement invariance tests to check that items are wording in the
same way across professions.
For multivariate normality and multivariate outliers, this study followed Teo et al.’s
(2013) recommendation of testing the assumptions with the critical value of Mardia’s coefficient
for kurtosis and Mahalanobis distance. Both values are provided to researchers in the AMOS
program. The authors also advise researchers to compute the critical value of Mardia’s
coefficient based on the formula p(p +2) where p equals the number of observed variables in the
model.

110
In addition to normality, this study also checked for statistical power with non-centrality
parameters (NCP) and the RMSEA confidence interval. AMOS does not provide a RMSEA
confidence interval, but reports an NCP value. Hence, I used RMSEA CI from the EQS program.
Two types of public domain software were used to calculate statistical power. The first is
G*Power to calculate statistical power based on NCP, and the second is an online utility for
power calculation (based on RMSEA) available at http://quantpsy.org/rmsea/rmsea.htm.
Another statistical procedure used in this study was MANOVA, which enables
researchers to compare means of different groups. MANOVA is based on an assumption of
multivariate normality. It also requires the assumption of equality of covariance matrixes among
groups, and equality of error variances. Because some of the variables violate these assumptions,
I applied a two-step transformation to my data before analyzing them with MANOVA
(Templeton, 2011).
SEM distinguishes two types of measurement models: reflective and formative. The
reflective model assumes that the constructs influence the measured variables. The formative
model assumes that the measured variables influence the construct. The construct of the former
model is referred to as a latent construct and the latter as a manifest construct (J. R. Edwards &
Bagozzi, 2000). MANOVA, as scholars argue, is a statistical analysis used to analyze manifest
mean, and should not be used to analyze latent means such as for acquiescent silence, quiescent
silence, prosocial silence, and opportunistic silence. Because of this controversy, this study also
employed latent variable means for comparison of the mentioned constructs.
Although social science data usually deviate from normality assumptions, this study tried
to check the assumptions, and ensured integrity and reliability with convergent and discriminant

111
validity tests. It also checked the impact of common method biases by Harman Single Factor test
and minimized the impact of socially desirable answers with a common latent factor.

112
CHAPTER FOUR: RESULTS
This chapter presents the findings with descriptive statistics, encompassing sample size,
participants’ demographics, missing values, normality, outliers, and methods of correcting the
problems. It follows with the hypotheses outlined in the conceptual model of Figure 1, beginning
with H1A, H1B, H2A, and H2B investigating the relationship among power distance (POD),
uncertainty avoidance (UNA), quiescent silence (QUS), and acquiescent silence (ACS). The
mediating effects of psychological safety (PSY) are under hypotheses 6A, 6B, 7A, and 7B.
Figure 2 illustrates hypotheses 3A, 3B, 4A, 4B, 5A, and 5B on the relationship between
collectivism (COL), competition (COM), long-term orientation (LTO), prosocial silence (PRS),
and opportunistic silence (OPS). Learning how members of the three professions use silence in
their workplaces is the basis for hypothesis 8 (Figure 3). Finally, hypothesis 9 probes the
differences in the perceptions of the three professions related to POD, UNA, and COM (Figure
4).
Participants’ Profiles
The study used an online survey through OISE’s Survey Wizard 2 which collected data
from the beginning of February, 2015 to July 31, 2015. The computer registered 393 entries from
nurses (RNs), medical laboratory technologists (MLTs) and primary care paramedics (PCPs)
across Canada, but many of these did not fully answer the questions. Five of these entries did not
show any answer except the type of computer device that was used. Ten participants answered
only one or two of the four sections of the questionnaire, and were also removed from the
analysis. Overall, there were 378 data entries that provided information for the analysis. Many of
them missed one, two, or three questions. These missing Likert scale values were replaced with

113
median values of their corresponding variables. For the questions about years of employment,
the missing values are replaced with the means of the corresponding variables,
The 378 participants comprise 156 RNs (10 males, 146 females), 115 MLTs (17 males,
98 females), and 107 PCPs (72 males, 35 females), with the majority being employed in Ontario.
The ratio of male/female (1/14.6) of this study is the same as the national average for RNs
(Canadian Nurses Association, 2010). The Canadian Institute of Health Information (2010)
reported that MLTs have a male/female ratio of 1/5.8, which is quite similar to this study of
1/5.76. Government of Canada (2015) suggests a ratio of 3.1/1 for male/female paramedics,
which is higher than this study of 2.1/1. A large majority of the participants are Canadian-born:
RNs (74%), MLTs (66%), and PCPs (88%). Just over 31% of RNs began their careers in the last
5 years, as opposed to 24% of MLTs and 17% of PCPs. About 11% of RNs and MLTs have
more than 30 years’ experience; as opposed to 2% of PCPs. Participants from the PCP group
indicate that 89% of them are union members, while fewer RNs (83%) and MLTs (54%) say that
they belong to the union organizations. In terms of religious affiliation, 22 percent of the
respondents did not answer the questions, and 37 percent are Christian (16% Catholic and 21%
Protestants). A majority of people (39%) do not have any affiliation with any religion. Table 3
presents the results of the participants’ profile.
Table 3
Participants’ Demographics
RN MLT PCP Total
Religion Affiliation
Missing 19 21 24 64
None 35 12 42 89
Buddhism 3 0 0 3
Catholics 46 33 17 96
Protestants 48 41 22 111

114
RN MLT PCP Total
Muslim 2 5 1 8
Jewish 0 1 1 2
Sikh/Hindu 3 2 0 5
Total 156 115 107 378
Birth Place
Canada 116 76 94 286
Others 40 39 13 92
Total 156 115 107 378
Province of Employment
Missing 5 0 0 5
Atlantic 3 5 8 16
QE 2 0 1 3
ON 147 97 63 307
MB 0 2 1 3
AB/SK 1 2 28 31
BC 1 7 3 11
Others 0 1 1 2
Total 159 114 105 378
Union membership No 26 53 12 91
Yes 130 62 95 287
Total 156 115 107 378
Tenure(Years)
Missing - - - 16
< 1 - 5 45 26 20 91
5.1 - 10 32 22 32 86
10.1 - 20 25 24 36 85
20.1 - 30 28 24 17 69
> 30 16 13 2 31
Total 146 109 107 378
Age
20 - 30 42 12 24 78
31 - 40 26 24 42 92
41 - 50 40 34 26 100
>50 48 45 15 108
Total 158 115 107 378
Age Distribution
Figure 8 represents the distribution of age among the three groups of participants.

115
The paramedic profession has a peak age of employment between 31 to 40 years old, and
then it precipitously drops. RN has a greater percentage of younger people in the profession than
MLT and PCP. MLT appears to be a profession that requires more replenishment by a younger
generation. As the data shows only 10% of MLT employees are in the 20-30 years age group.
The low number of younger technologists may come from the fact that older MLT employees
remain in the workforce longer, reducing the number of new graduates required. This may
become an issue when this age cohort retires in the future. The Canadian Society of Laboratory
Science expressed its concerns regarding this issue on Parliament Hill earlier in 2015 (Munson,
2015).
Figure 8. Age distributions of RN, MLT, and PCP groups.
Comparisons of the age group categories of this study to the national records suggest
similar trends in age distribution. This study asked participants to identify their age group which
found that more than 68.7% of MLTs were older than 40 years. The report from the Canadian
Institute of Health Information suggested 60% of MLTs were in the same categories. The
27%
17%
26%
31%
10%
21%
30%
39%
22%
39%
24%
14%
0%
5%
10%
15%
20%
25%
30%
35%
40%
45%
20-30 31-40 41-50 >50
RN
MLT
PCP

116
Canadian Nurses Association reported that 66% of full time RNs were older than 40 years old in
2010. This study found only 56% in the same age groups. The discrepancy may be the result of
increasing numbers of younger RNs in the workforce over the last five years (Canadian Institute
for Health Information, 2015). Government of Canada (2015) indicated that 36.4% of PCPs
were older than 45 years old. This study found 38% of PCPs were older than 40 years of age.
Data Assessment
All questions related to individual cultural values (ICV), employee silence, and
psychological safety (PSY) are on a Likert scale of 1 (strongly disagree) to 7 (strongly agree).
The survey software asks participants to check the values 1 to 7 or skip the answer. It is
debatable whether it would be accurate to call people who have different opinions outliers since
they are constrained to respond to a range of values. The questionnaire was designed to
investigate 10 constructs (53 items) as shown in Appendix B.
All items involving power distance (POD) appear to draw responses on the lower end of
the scale, with mean values ranging from 1.69 to 2.06 (𝑀 =1.83). COM is another construct that
received more responses on the negative (disagree) side, with 𝑀 = 2.47. On the contrary,
uncertainty avoidance (UNA), and long-term orientation (LTO) received more positive responses
with average mean values of 5.90 and 5.82, respectively. Collectivism (COL) is the only
construct that has an average score in the middle (𝑀 = 4.38).
For the silence construct, quiescent, acquiescent, and prosocial silences’ mean scores are
close to the middle, 4.32, 3.56, and 4.26, respectively. Opportunistic silence received a score
with an average mean of 2.34.
Psychological safety has an average mean score of 4.14 with 4 items that have values
above 4 and 3 items below 4; however, these three items came from negatively worded items,

117
indicating that the participants agree with the questionnaire. The scores from these items were
reversed prior to use as inputs for factor analysis.
All items in the 10 constructs are not normally distributed based on Kolmogorov-
Smirnov and Shapiro-Wilk tests. However, only UNA, LTO, and ACS scales have skewness
greater than the cutoff value of 2 (George & Mallery, 2007). The violation of the kurtosis is
much greater than the acceptable value in this set of data. POD, UNA, LTO, and COM scales
have kurtosis values greater than 2, with some of these even going as high as 8.8. This is a real
concern in this study as the violation of kurtosis affects SEM which uses maximum likelihood as
a method of estimation (Byrne, 2010). However, not all scholars agree on the issue. Kline (1998)
is more lenient as he asserts that “A conservative compromise, then, seems to be that absolute
values of the kurtosis index greater than 10.0 may suggest a problem” (p. 82).
The multivariate normality and multivariate outliers will be assessed together in each
panel of the investigation and will be discussed in the next section.
Investigations of Hypotheses
The investigation grouped the nine hypotheses into four parts. Part A studied the
relationship among power distance (POD), uncertainty avoidance (UNA), acquiescent silence
(ACS), quiescent silence (QUS), and psychological safety (PSY), which covered hypotheses 1A,
1B, 2A, 2B, 6A, 6B, 7A, and 7B (Figure 1). The analysis was conducted at two levels: the
individual profession and all professions combined. This was achievable through the application
of multigroup analysis using configural and measurement invariances.
Part B studied the relationship among collectivism (COL), competition (COM), long-
term orientation (LTO), prosocial silence (PRS), and opportunistic silence (OPS). Again, it was
conducted at two levels. This part represents the study of hypotheses 3A, 3B, 4A, 4B, 5A, and
5B (Figure 2).

118
Part C attempted to compare the three professions as to how members used their silence
at work. The traditional method, multivariate analysis of variances (MANOVA) was applied to
test hypothesis 8. Nevertheless, MANOVA is now being challenged by the newer method latent
variable means (LVM), which bases its analysis on SEM (Figure 3).
Part D investigated three of the individual cultural value constructs because the literature
suggested that people in different professions appeared to have their own organizational cultural
beliefs. This part, represented in Figure 4, studied hypothesis 9, and it also utilized both
MANOVA and LVM.
Part A
The Relationship among Power Distance, Uncertainty Avoidance, Quiescent Silence,
Acquiescent Silence and Psychological Safety
The first decision in conducting a factor analysis is to review the correlation matrix,
which should have a substantial number of correlations greater than 0.3 (Hair et al., 2010). The
correlation matrix indicates that 120 out of 189 correlations are significant at p < .01. This is
equivalent to 63% of the elements in the correlation matrix (Appendix C). The bivariate
correlation table also shows that items measuring POD group together with correlation in the
range of .24 to .51. UNA, QUS, and ACS items also exhibit correlations in the range of .28 to
.70. All of these are significant at p < .01. PO5 is the exception as it has difficulty in converging
into the POD variable. PO5 only significantly correlates with PO4 at p < .01. The correlations of
items from different constructs are pronounced between QUS and ACS, with 22 of 60 items
having r > .20. This might indicate a discrimination issue between the two constructs. However,
items that belong to QUS have 13 of 15 correlations greater than .40. All ACS items also
correlate among themselves at r > .40. PSY correlations have a range of -.48 to .49. The negative
correlations were the results of negative wordings in the questionnaire.

119
Exploratory Factor Analysis (EFA)
The next step of the investigation is to apply EFA. There are several EFA extraction
methods, but this study selected principal axis factoring (PAF) and maximum likelihood (ML)
with Promax rotation.
Items in the study were deleted one at a time. Item PO5 did not load into the structure in
the first iterative process, and PO3 had a communality of .22. PS1, PS3, and PS5 items showed
poor loading and were eliminated. AS4, AS5, and UN1 loaded below .50. The final EFA
structure has KMO of .82, a significant Bartlett’s Test of Sphericity, and 54.96% total variance
explained. There are 2 percent non-redundant residuals with absolute values greater than .05.
PS7 is the only item that cross-loads onto factor 3 and 4 with opposite signs. I decided to keep
this item to ensure the stability of the PSY construct, knowing that the item would have to go
through another rigorous assessment during the CFA analysis. The final result of the EFA is
presented in Appendix D. As shown in the appendix, not all items from the pre-analysis are
satisfactorily loaded into the final result due to cross-loading or loading below the cutoff value.
Confirmatory Factor Analysis (CFA)
The values of the EFA structure (Appendix D) are used as inputs into the AMOS CFA
analysis, with add-in software provided by James Gaskin, Brigham Young University. The CFA
structure showed a good model fit with all significant standardized regression weights, and
required no model modification (Figure 9).

120
Figure 9. CFA model of the constructs comprising POD, UNA, ACS, QUS, and PSY. The
figure shows standardized regression weights and the correlations among the constructs.
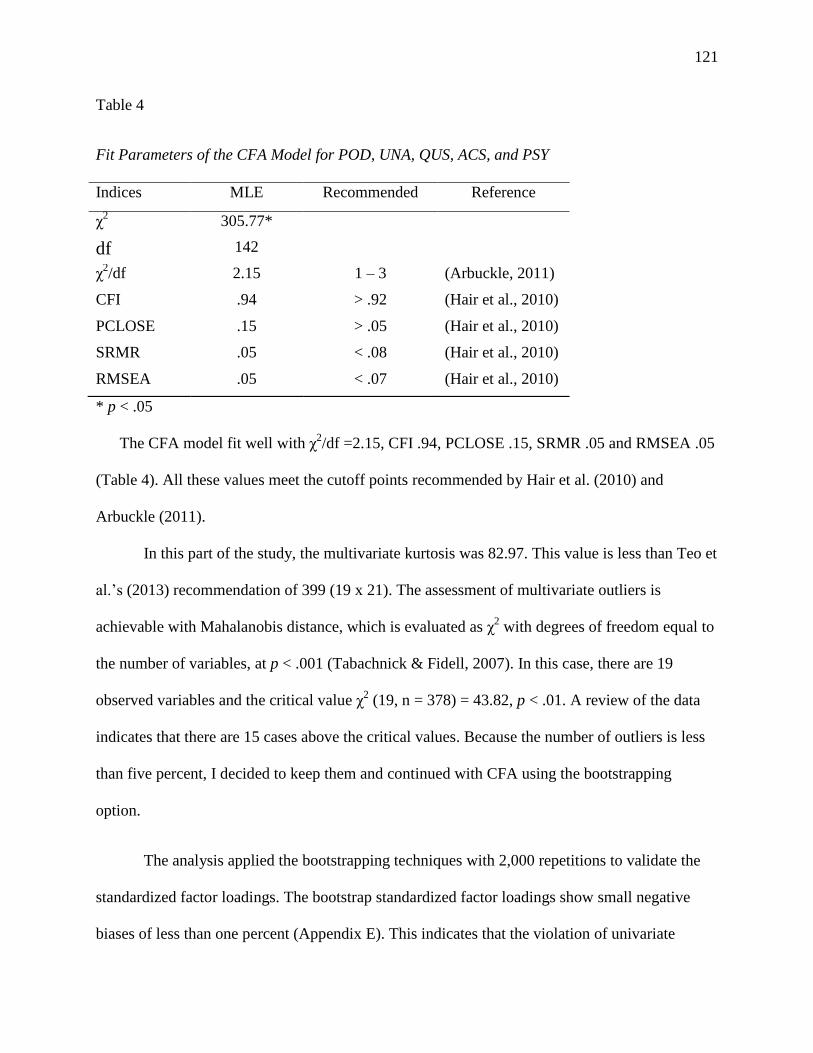
121
Table 4
Fit Parameters of the CFA Model for POD, UNA, QUS, ACS, and PSY
* p < .05
The CFA model fit well with χ2/df =2.15, CFI .94, PCLOSE .15, SRMR .05 and RMSEA .05
(Table 4). All these values meet the cutoff points recommended by Hair et al. (2010) and
Arbuckle (2011).
In this part of the study, the multivariate kurtosis was 82.97. This value is less than Teo et
al.’s (2013) recommendation of 399 (19 x 21). The assessment of multivariate outliers is
achievable with Mahalanobis distance, which is evaluated as χ2 with degrees of freedom equal to
the number of variables, at p < .001 (Tabachnick & Fidell, 2007). In this case, there are 19
observed variables and the critical value χ2 (19, n = 378) = 43.82, p < .01. A review of the data
indicates that there are 15 cases above the critical values. Because the number of outliers is less
than five percent, I decided to keep them and continued with CFA using the bootstrapping
option.
The analysis applied the bootstrapping techniques with 2,000 repetitions to validate the
standardized factor loadings. The bootstrap standardized factor loadings show small negative
biases of less than one percent (Appendix E). This indicates that the violation of univariate
Indices MLE Recommended Reference
χ2
305.77*
df 142
χ2/df 2.15 1 – 3 (Arbuckle, 2011)
CFI .94 > .92 (Hair et al., 2010)
PCLOSE .15 > .05 (Hair et al., 2010)
SRMR .05 < .08 (Hair et al., 2010)
RMSEA .05 < .07 (Hair et al., 2010)

122
normality does not significantly affect loading parameters, and thus the analysis moves on to
check the convergent and divergent validity of the above CFA model.
Reliability and Construct Validity
Reliability. The reliability investigation of each construct indicates that QUS, UNA, and
ACS have a Cronbach’s alpha > .80, PSY .72 and POD is .66. Although POD is less than the
recommended value of .70, there is no room for POD improvement regardless of any item
deletion. Moreover, constructs with two items are unstable and could be nonreplicable (Table 5).
Table 5
Reliability, Construct Validity and the Unstandardized Correlation among PSY, QUS, UNA, ACS
and POD
Cronbach’α CR AVE MSV ASV PSY QUS UNA ACS POD
PSY .72 .72 .46 .40 .14 .68
QUS .86 .52 .51 .13 -.07 -.36 .72
UNA .84 .86 .62 .05 .02 .22 .04 .78
ACS .85 .85 .66 .40 .14 -.63 .36 -.19 .81
POD .66 .67 .41 .01 .01 -.01 .12 .02 .10 .64
Note. CR composite reliability, AVE average variance extracted, MSV maximum shared variance, ASV average
shared variance.
Construct validity. Fornell and Larcker (1981) advise researchers to use composite
reliability (CR) and average variance extracted (AVE) to assess the convergent validity. They
state that “To satisfy the requirements for discriminant validity, ρνc(η) > γ2 and ρνc(ξ) > γ
2” (p. 46).
This statement implies that for any two constructs, A and B, the AVE for A and AVE for B must
be greater than the squared correlation between A and B, which is in full compliance in this case.
Gaskin (2015) suggests that AVE must be greater than maximum shared variance (MSV) and

123
average shared variance (ASV) to satisfy divergent validity. The calculation of the four indices
is achievable with Gaskin’s (2015) STATTOOL©
The validation result indicates that all
constructs except POD pass the CR cutoff criteria of .70. Although PSY has AVE lower than the
cutoff point, it still shows discriminant validity as its value is greater than the corresponding
MSV and ASV. The CR value alone is adequate for the assessment of convergent validity. In
addition Liozu and Hinterhuber (2014) state that when “all of the variables load at levels greater
than .40 on expected factors [that] also indicates convergent validity” (p. 150). The weaker AVE
may be the result of Item PS7, which is cross-loaded with the ACS construct. The POD construct
only yields a suboptimum value for both CR and AVE, yet these results are compatible with the
results of Yoo et al. (2011) who developed the instrument for their cross cultural study. In their
study of a pooled sample (n = 1,530) from participants in the US and Korea, the authors obtained
an average factor loading of .49 for the five items of the POD construct, as opposed to the
current study, which has an average of .63. The CR value from this study (.67) is also higher than
their report (.62).
Power Analysis
I obtained a statistical power of 100% using NCP value of 172.38 from the EQS program.
The RMSEA confident interval .05 - .07 suggests that neither “close fit” nor “not-close fit” can
be rejected, and the calculation of both methods gives statistical power of 99.99%.
Tests of Configural and Measurement Invariance
In conducting the SEM analysis, researchers have to be aware of the potential interfering
effects among groups. The test that can help researchers identify the problem is a structural
invariance test. The first step is configural invariance, which is evaluated by estimating the
unconstrained overall structure. Basically it tests whether each individual group has the same

124
number of factors and the same loading pattern. Parameters are allowed to take values that fit the
groups. The configural invariance shows a well fitted model with χ2/df 1.66, CFI .93, RMSEA
.03, SRMR .06, and PCLOSE 1.00.
As the model fit of the configural invariance meets the cutoff criteria, the next step is to
test measurement invariance by constraining factor loadings of all groups to the same fixed
values as illustrated in Figure 10.
Figure 10. Measurement invariant model with regression weights constrained to be equivalent
across groups.

125
Multigroup Structural Equation Modeling
Results of the configural invariance and measurement invariance tests are compared to
see whether there is a significant change in χ2 or CFI. The change in χ
2 is judged with the p-
value, while Cheung and Rensvold (1998) proposed .01as a cutoff point for CFI. There is no
significant difference between the two invariance tests (Table 6).
Table 6
χ2
and CFI Values of Configural and Measurement Invariances
χ2 DF Δχ2 ΔDF p CFI ΔCFI
Configural 943.16 568 - - .00 .93
Measurement 986.92 610 43.76 42 .40 .93 .00
Common Method Biases
One of the potential problems in behavioural research is social desirability bias, which
can influence empirical results. In this study, I used Harman Single Factor test to check common
method bias. Podsakoff, MacKenzie, Lee, and Podsakoff (2003) advise researchers to use a
common latent factor or marker variable to control the biases. This study only applied a common
latent factor (CLF) to the CFA model (Figure 11).
Harman Single Factor test and common latent factor method. The Harman’s single factor
extracted 21.08 percent of the variance. This is below the acceptable cutoff point of 50%. The
CFA structures with and without CLF showed only minor differences in factor loadings
(Appendix F). There were fifteen items that reduced their values, three items gained and one had
no change. To reduce the effect of interference, values from the items of each construct were

126
combined to create 5 indices, POD, UNA, QUS, ACS, and PSY prior to using SEM to study the
hypotheses.
Figure 11. The common latent factor model with standardized regression weights and
correlations.

127
Testing for Hypotheses 1A, 1B, 2A, and 2 B
This study tests four hypotheses, 1A, 1B, 2A, and 2 B, simultaneously with structural
equation modeling (SEM). As mentioned, items that passed the strict scrutiny of the CFA step
were created into composite indices comprising POD, UNA, ACS, and QUS. Three variables
(union, tenure and gender) were used as controls as research shows that UNA individuals seek
union membership when they encounter problems with employers and administrators, so they
can have representatives to speak on their behalf (Posthuma, 2009; Yildiz, 2013). On the
contrary, high POD individuals display stronger loyalty to their leaders, and do not seek union
membership. In General, males are more assertive than females, and less afraid to speak up.
Hofstede (2001) also reported that females tend to have higher power distance scores than male
employees. Experienced employees are more aware of the work environment and have more
political acumen than inexperienced coworkers. Loyens (2013) found a hierarchical silence
among labour inspectors with low seniority. Individuals can shift back and forth between QUS
and ACS states. QUS individuals can go through a phase where they become disengaged and
move into the ACS state. ACS individuals who are ready to voice their concerns will move back
to the QUS state (Pinder & Harlos, 2001). This suggests that there is a correlation between the
two constructs. The above information related to controls and hypotheses can be summarized in
the following analysis model (Figure 12).

128
Figure 12. The SEM model of the relationships among POD, UNA, ACS and QUS of the pooled
sample. The numbers represent standardized regression weights, correlations and R2. (Note:
Union had a value of 1 for members and 0 for nonmember; Gender was 1 for males, 0 for
females).
The proposed model fits very well with χ2/df 1.96, CFI .97, RMSEA .05, SRMR .04, and
PCLOSE .43. The coefficients of determination (R2) for QUS and ACS are weak at .02 and .10,
respectively. The moderate correlation (r = .54) between error e1 and e2 suggests that there is
one common unmeasured cause between ACS and QUS (Kline, 2012). The fit parameter could
be improved by removing the correlation path between UNA and POD, but the path was kept in
the analysis for comparison with the multigroup analysis.
Hypothesis 1A proposes a positive relationship between POD and ACS, and the model
reported a significant standardized regression weight of .17 (p < .01). Therefore, Hypothesis 1A
is not rejected. Hypothesis 1B is rejected as the regression weight between POD and QUS is very
weak (r = .07) and is not significant (p = .18).

129
Hypothesis 2A expected a positive relationship between UNA and ACS but had to be
rejected as the standardized regression weight (β) was significant (p = .01), but showed a
negative sign (β = - .12, p = .01). Hypothesis 2B was also rejected as β was not significant (β =
.01, p = .79) between UNA and QUS.
There are surprising findings with the relationship between Union and UNA as the
negative result (r = - .19) contradicts earlier studies that found that individuals with high UNA
have positive views of the union (Bender & Sloane, 1999). However, this result came from a
pooled sample, combining the three professions.
Among the three controls, Union is the only variable that has a significant correlation
with QUS (β =.12, p =.02) and ACS (β = .195, p < .01), suggesting union members were more
silent than non-union members.
Testing for Hypothesis 6A, 6B, 7A, and 7B
This set of hypotheses is testing the effect of psychological safety (PSY) on silence in the
workplace. I used the Sobel formula as well as bootstrapping to study the indirect path of the
mediation.
Again, the model fit summary shows χ2 = 28.81 (p < .001, df = 9), χ
2/df = 3.21, CFI =.96,
RMSEA .07, PCLOSE .07 and SRMR .06. The χ2/df was slightly above the expected range, but
four other parameters are in acceptable ranges. The parameters can be further improved by
removing the covariance line between POD and UNA, but it was also kept for the multigroup
analysis.
The model shows strong effects of PSY on ACS and QUS and significant improvements
in the coefficients of determination (R2
= .53 and .40) for both dependent variables. PSY has a
negative effect on QUS and ACS, as evidenced from the standardized regression weight of -.64

130
(p < .01) and -.67 (p = .00). UNA has a positive relationship with PSY (β =.16, p = .00) but has
no significant relationship with ACS (β =-.04, p =.25). These results indicate that PSY more
likely plays a mediating role between UNA and ACS. The relationship between UNA and QUS
gains strength, changing from non-significant (β = .01, p =.79) to significant (β = .09, p =.03)
post-mediation; however, we still cannot rule out whether PSY plays a mediating role until a
Sobel test is conducted (Figure 13).
PSY also intervenes in the relationship between POD and QUS and between POD and
ACS. Prior to the mediation, POD has a positive relationship with ACS (β =.17, p < .01), but
post-mediation shows a lower value (β = .11, p < .01). This also indicates that PSY plays a
mediating role between POD and ACS.

131
Figure 13. The mediation model of the pooled sample with numbers represents standardized
regression weights, correlations and R2. (Note: Union had a value of 1 for members and 0 for
nonmember; Gender was 1 for males, 0 for females)
.
Both pre (β =.07) and post (β =.01) mediation regression weights of POD to QUS are
insignificant. PSY affects the relationship between union memberships on ACS and QUS, as the
β value between union and ACS decreases from .20 to .08, although it is still significant. On the
other hand, β values between union membership and QUS change from significant (p < .05) to
insignificant (p = .68).
The mediating role of PSY on the two silence constructs requires the investigation of
indirect effects with the Sobel formula, using an unstandardized regression coefficient and its
standard error. Based on Barron and Kenny’s (1986) interpretations, there is a full mediation

132
effect between UNA and ACS, and partial mediation between POD and ACS. There is no need
to conduct mediation tests as there are no significant relationships between UNA and QUS and
between POD and QUS (Table 7).
Table 7
Pre- and Post-Mediation and Sobel Indirect Effects
Path Pre-Mediation
C’
Post-Mediation
C
Sobel Mediation
UNA PSYACS -.12 (p = .01) .08 (p = .25) -3.14 (p.= 00) Full
UNA PSYQUS .01 (p = .79) NA NA None
POD PSYACS .17 (p = .00) .11 (p < .01) -3.17 (p =.00) Partial
POD PSYQUS .07 (p = .18) NA NA None
The Sobel formula (Table 7) suggests that the indirect (a × b) paths are significant for
UNAPSYACS, but not significant for UNAPSYQUS. These results suggest that PSY
has a full mediation effect on the former, but not on the latter. Because UNA ACS (Path C)
becomes insignificant, PSY has a full mediating effect between UNA and ACS. PSY, however,
plays no mediating role between UNA and QUS.
In the same table, the Sobel formula gives a significant value (-3.17, p =.00) between
PODPSYACS. Because Path C is weaker but still significant post-mediation, PSY only has
a partial mediating effect on the regression path. PSY plays no role between POD and QUS.

133
Table 8
Bootstrapping Indirect Effects
Path a x b
(bootstrap)
C a x b x C
(sign)
Mediation
1 UNAPSYACS p = .00 ( - ) -.04 (p = .25) NA Indirect-only
2 UNAPSYQUS p =.00 ( - ) .09 (p = .029) ( - ) Competitive
3 PODPSYACS p =.07 .11 (p = .00) NA Direct-only
4 PODPSYQUS p =.07 .01 (p =.72) NA No-effect
Bootstrapping results (Table 8) showed insignificant results in the indirect paths between
POD and ACS (p = .07) and between POD and QUS (p = .07), and significant results between
UNA and ACS (p =.00) and between UNA and QUS (p =.00). These results led to different
interpretations from Table 7 for two of the four mediation paths. Path (1) UNA PSY ACS
yielded the same result as in Table 7 (indirect-only = full mediation). Path (4)
PODPSYQUS also yielded the same result (no mediation = no effect). Path (2)
UNAPSYQUS is not significant in the pre-mediation test as seen in Table 7 (β =.01, p
=.79), but it becomes positively significant in Table 8 (β =.09, p = .03) after PSY intervention.
Because the indirect path (a × b) is negative and shows significance with the bootstrapping
method, the sign of the product is negative (a × b × C). This fits with Zhao et al.’s (2010)
competitive mediation, but was deemed as no mediation by Barron and Kenny (1986). Path (3)
also presents a controversy, as the direct path (Table 7) PODPSYACS is significant (β .17 p
<.01) before and after (β=.11 p< =.01) placing PSY into the equation. However, the bootstrap
shows a non-significant indirect path, and it falls into the category of Direct-only (Zhao et al.,
2010). Direct-only implies non-mediation, but using Barron and Kenny‘s (1986) approach, it was
interpreted as partial mediation.

134
When faced with conflicting results, it is dependent on the interpretation of the
investigators. As mentioned in Chapter 3, I used Zhao et al.’s (2010) typology. I conclude that
PSY mediates the relationship between UNA and ACS, UNA and QUS, and POD and ACS, but
not between POD and QUS. Therefore, Hypotheses 6A and 6B are not rejected. Because there is
not enough evidence, Hypotheses 7A and 7B are rejected.
Relationships between POD, UNA, ACS, and QUS at the Professional Level
The above relationships were only applicable to the pooled sample and might not be true
at the profession level. To understand the relationship at the profession level, the SEM analyses
were also performed for the RNs, MLTs, and PCPs separately. The process began with the
investigation of fit parameters to ensure the measurement model is not significantly different
from the theoretical model.
The SEM fit parameters of the three-group model has χ2/df =1.62, CFI = .94, RMSEA =
.04, SRMR =.05, PCLOSE =.69. These values suggest a good fit of the sample to the theoretical
model.
Without Mediation Effect
Registered Nurses (RNs). No significant regression weights between UNA ACS (β -
.11, p =.14) and UNA QUS (β = .07, p = .38), and POD QUS (β = .06, p = .43). However,
POD ACS is significant with β =.27 (p <.01). Gender, tenure and union membership have no
influence on ACS or QUS, suggesting there are no differences between males and females, union
and non-union members, and employees with different years of employment (Figure 14). Union
membership has negative correlations with POD (r = -.17), and with UNA (r = -.14); therefore, it
reduces power distance and uncertainty avoidance. UNA and POD have a positive correlation (r
= .14), and there is a moderate correlation between e1 and e2 (r = .50).

135
Figure 14. Relationships among POD, UNA, ACS and QUS of the RN group, with
standardized regression weights, correlations and R2.
Medical Laboratory Technologists (MLTs). There are no significant β values between
UNA ACS (β = -.14, p = .10) and UNA QUS (β =-.03, p = .74), but there is moderate
significance between POD ACS (β = .23, p < .05), and POD QUS (β = .22, p < .05). The
positive slope values between Union ACS (β = .21, p = .01) and Union QUS (β = .18, p =
.05) indicate that Union positively correlates with ACS and QUS (Figure 15). This seems to
contradict the literature that states union membership increases employee voice. Union has no
relationship with UNA (r = -.03) or POD (r = -.01). POD and UNA are not correlated in this
group (r = -.02). Among the three professions, MLT has the strongest positive correlation
between QUS and ACS (r = .65).
RN group

136
Figure 15. Relationships among POD, UNA, ACS, and QUS for the MLT group.
Primary Care Paramedics (PCPs). This group of professionals does not show any
significant relationships among the variables of the investigation, except between POD QUS
(β = -.18, p =.06). Union has the strongest influence in this group, but it appears to increase ACS
(β = .34, p < .01) and QUS (β =.28, p < .01). These results indicate that union members are more
silent than non-members. Union negatively correlates with UNA, meaning union and uncertainty
avoidance move in opposite directions among the paramedic group (Figure 16). Hence, union
reduces uncertainty in male paramedics. Tenure and Gender exert no influence on ACS and
QUS. The correlation between e1 and e2 are moderately strong (r = .42), supporting previous
research suggesting an individual can shift between ACS and QUS states.
MLT group

137
Figure 16. Relationships among POD, UNA, ACS, and QUS for the PCP group.
Results of the relationships among POD, UNA, ACS, and QUS, for the analyses of the
professions separately as well as the pooled sample are summarized in Table 9.
Table 9
Standardized Regression Weights of Path Analysis for POD, UNA, ACS, and QUS
RN MLT PCP POOLED
UNA QUS .07 -.03 -.02 .01
UNA ACS -.11 -.14 -.09 -.12*
POD QUS .06 .22* -.18 .07
POD ACS .27** .23** -.09 .17**
Note. * p < .05, ** p <.01
PCP group

138
With Mediation
The fit parameters of the model with PSY as a mediator showed χ2/df = 1.84, CFI = .96,
RMSEA =.05, SRMR = .05, and PCLOSE =.56. All of these parameters suggest the sample
model fits with the implied theoretical model. This study only applied the bootstrapping
technique to examine the mediating effects of PSY between the ICV and the silence constructs at
the profession level. Using the Sobel formula for the indirect path could yield different results.
Table 10 compares the results of the mediation effects by professions and the pooled sample. For
simplicity I labeled the models 1 to 16.

139
Table 10
The Effects of Mediation on the Path Analysis
Model Path a × b
bootstrap
C a × b × C
(sign)
Mediation
RN
1 UNAPSYACS p = .10 -.02(p = .67) NA No effect
2 UNAPSYQUS p = .10 .15 (p = .02) NA Direct-only
3 PODPSYACS p = .01 .15 (p = .01) (+) Complement
4 PODPSYQUS p = .01 -.05 (p =.47) NA Indirect-only
MLT
5 UNAPSYACS p = .01 -.01 (p =.89)
.008)
NA Indirect-only
6 UNAPSYQUS p = .01 .11 (p = .12) NA Indirect-only
7 PODPSYACS p = .03 .09 (p = .14) NA Indirect-only
8 PODPSYQUS p = .03 .07(p = .28) NA Indirect-only
PCP
9 UNAPSYACS p = .27 -.04(p = .57) NA No effect
10 UNAPSYQUS p = .29 .02 (p = .81) NA No effect
11 PODPSYACS p = .15 .05 (p = .54) NA No effect
12 PODPSYQUS p = .14 -.06 (p =.45) NA No-effect
Pooled
13 UNAPSYACS p =.00( - ) -.04(p = .25) NA Indirect-only
14 UNAPSYQUS p =.00( - ) .09 (p = .03) ( - ) Competitive
15 PODPSYACS p =.07 .11 (p = .00) NA Direct-only
16 PODPSYQUS p =.07 .01 (p =.72) NA No-effect
Registered Nurses. In Table 10 and Figure 17, PSY has no mediation effect between
UNA ACS. This interpretation comes from the fact that paths (a × b) and C are both
insignificant (model 1). In Model 2, path (a × b) is insignificant (p = .10) but C is significant (β
=.15, p < .01). This is what Zhao et al. (2010) call “direct-only,” suggesting a second mediator
might be omitted from the analysis. PSY has a mediation effect between POD and ACS as paths

140
a × b (p = .01) and C (p < .01) are significant. Because (a × b × C) has a positive sign, the
mediation is complementary (model 3). Model 4 is known as indirect-only because path (a × b)
is significant but Path C is not. According to Zhao et al. (2010), model 3 is equivalent to Barron
and Kenny’s (1986) partial mediation, and model 4 is full mediation.
Figure 17. The mediation effect of PSY between the dependent and independent variables for the
RN group.
Medical Laboratory Technologists. Models 5, 6, 7, and 8 in Table 10 indicate that all (a ×
b) are significant; therefore, PSY has a mediation effect in all these relationships. None of the
path C are significant between UNAQUS (β = .11, p = .12), UNA ACS (β = -.09, p = .89),
PODQUS (β = .07, p = .28) and POD ACS (β = .09, p = .14). This means that PSY has
indirect-only effects (full mediation) on all the paths. It is noted here that UNA ACS (p =
RN group

141
0.11) and UNA QUS (p = .74) were not significant prior to the intervention of PSY (Table 9),
and these need not be investigated for mediation according to Barron and Kenny’s (1986)
guidelines. The R2
of ACS and QUS are .58 and .51, respectively (Figure 18).
Figure 18. The mediation effect of PSY between the dependent and independent variables for the
MLT group.
Primary Care Paramedics. PSY plays no mediating role between the independent and
dependent variables in this group (Figure 19). As shown in models 9 to 12 of Table 10, all the
values of this group in the column (a × b) and in column (C) are insignificant.
MLT group
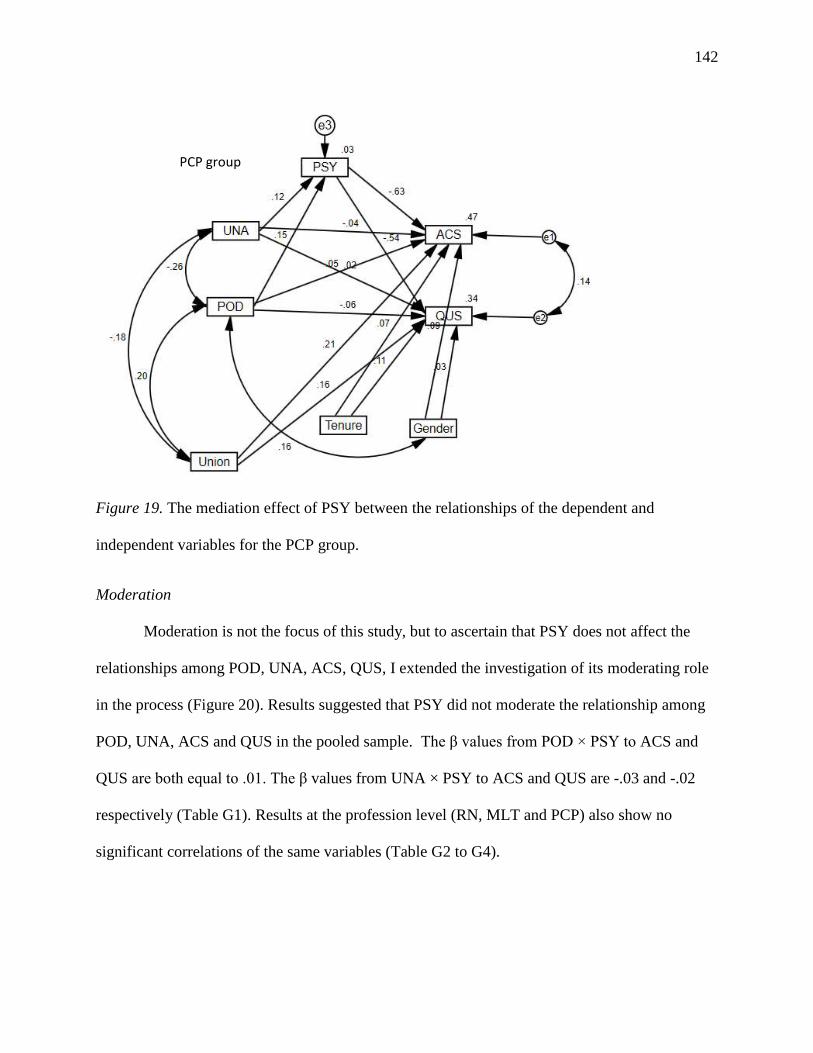
142
Figure 19. The mediation effect of PSY between the relationships of the dependent and
independent variables for the PCP group.
Moderation
Moderation is not the focus of this study, but to ascertain that PSY does not affect the
relationships among POD, UNA, ACS, QUS, I extended the investigation of its moderating role
in the process (Figure 20). Results suggested that PSY did not moderate the relationship among
POD, UNA, ACS and QUS in the pooled sample. The β values from POD × PSY to ACS and
QUS are both equal to .01. The β values from UNA × PSY to ACS and QUS are -.03 and -.02
respectively (Table G1). Results at the profession level (RN, MLT and PCP) also show no
significant correlations of the same variables (Table G2 to G4).
PCP group

143
Figure 20. The moderation effect of PSY between the relationship of the dependent and
independent variables of the pooled sample.
Summary of the Results
The study of the pre-mediation relationships among POD, UNA, ACS, and QUS at the
profession level shows that RN, MLT, and PCP have their own unique patterns of relationships.
The only significant relationship for the RN group is between POD and ACS. MLT has two
positive relationships, between POD and QUS and between POD and ACS. PCP does not have
any significant relationship among POD, UNA, ACS, and QUS. The relationships of these
variables within these professions appear to cancel or enhance the effect within the pooled
sample. For example, the relationships between UNA and ACS are not significant at the
profession level, but the combined effect makes it appear significant in the pooled sample (Table
9). The relationship of POD and QUS is significant for the MLT group, but its effect was
cancelled out by the PCP and RN groups, making it appear insignificant in the pooled sample.

144
The study of the mediation effect within the three professions shows that PSY reduces
QUS and ACS in the workplace for the RN and MLT groups, but has no effect on the PCP
group. This suggests that people from different professions have their own perception of these
relationships, and investigators have to be careful about the interpretation of the pooled sample.
This study indicates that there are no moderation effects of PSY on the relationships
between the two independent variables (POD and UNA) and dependent variables (ACS and
QUS) at the collective and at the professional levels.
145
Part B
The Relationship among Competition, Long-term Orientation,
Collectivism, Prosocial, and Opportunistic Silence
Part B of this study takes the same protocol as Part A but is not concerned with
mediation. Because the figures and the tables are in the same format as in Part A, they are placed
in the Appendices.
Inspection of the correlation matrix indicates that 78 of the 150 correlations are
significant at .01. This represents 52 percent of the total bivariate correlations, which warrants
further exploratory factor analysis (Appendix H). The items in the prosocial silence (PRS) scale
have correlations in the range of.42 to.75, opportunistic silence (OPS) .31 to .58, and
collectivism (COL) .23 to .75. Competition (COM) and long-term orientation (LTO) have
weaker correlations, .22 to .37 for the former and .10 to .54 for the latter. All of these have
significant correlations at p < .01, except the correlation between LT2 and LT5 (r = .10) which is
significant at p < .05. The correlation matrix also suggests that OS5 correlates with items outside
its construct. These are OS5 and CO2 (r = .18), OS5 and CO4 (r = -.18), OS5 and LT4 (r = -.16)
and OS5 and LT6 (r = -.14). This indicates that Item OS5, which belongs to OPS, can cross-load
with COL and LTO.
The EFA analysis selects PAF and Promax rotation as the methods of choice. Five items
were removed in sequence because of communality < .30 or loading < .40. These were LT2,
MA3, LT5, OS4, and OS5. The final pattern matrix has no item loadings less than .5, a
preference value for CFA analysis. The final pattern comprises five constructs with no cross

146
loadings, with KMO .71, Bartlett’s Test of Sphericity .00, and 51% total variance explained. The
five factors became inputs for the CFA as shown in Appendix I.
Normality and Outliers
The questionnaire for analysis in Part B has a total of 25 items, and five of them showed
high kurtosis, but they were still below the cutoff value of 10. Because this study applied the
bootstrapping technique, it did not attempt to transform the data into a different format.
The multivariate kurtosis is 84.04, which is below the critical value of 323 (17 x 19) for
17 observed variables (Teo et al., 2013). Mahalanobis distance values were in the range of 3.194
to 66.055. There were 18 cases with Mahalanobis values greater than the critical χ2 (17, 378) =
40.79, p =.001.
CFA Model
CFA model fit indicates a well-fit structure with χ2/df = 1.42, CFI = .97, RMSEA = .03,
SRMR = .04, and PCLOSE = .99. The CFA model does not require any modification from the
EFA structure (Appendix J).
The bootstrapping technique was applied to ensure that regression weights are
significantly different from zero. The 2,000 repetition of bootstrapping results did not show any
significant deviation from MLE estimations (Appendix K).
Reliability and Construct Validity
COM is the only variable that struggles to pass the reliability test with a Cronbach’s alpha
of only .59. Removing any of these three items does not improve the overall value of the
construct, and as noted earlier, a scale requires at least three items. PRS shows a good alpha
value (.84), while COL, OPS, and LTO are in a range of .72 to .79 (Table 11).

147
The construct validity shown in Table 11 suggests that PRS, COL, LTO, and OPS all
yield an optimum CR value of .70. COM was the only variable that fell below the optimum, but
Yoo et al. (2011) assert that this value is acceptable. Moreover, Malhotra and Dash (2011) also
assert that some studies used CR .60. All AVEs are greater than their corresponding MSV and
ASV, indicating discriminant and convergent validities of these constructs. In the current study
COM is the only questionable construct.
Table 11
Reliability, Construct Validity and Unstandardized Correlations among COM, PRS, COL, LTO,
and OPS
Cronbach’α CR AVE MSV ASV COM PRS COL LTO OPS
COM .59 .61 .35 .02 .01 .59
PRS .84 .85 .59 .03 .02 .13 .77
COL .80 .81 .60 .03 .01 .02 .18 .77
LTO .79 .77 .53 .01 .00 .01 .05 .11 .73
OPS .72 .73 .48 .02 .01 .12 .12 -.05 -.03 .69
Power Analysis
Power analysis by both G*Power (NCP 40.42) and RMSEA (CI .04 to .06) indicate that
the CFA model has statistical power greater than 99%.
Configural and Measurement Invariance
A CFA invariance test is required prior to conducting the path analysis at the profession
level. This is to ascertain that all items operate in the same fashion across groups. Investigators
usually apply configural and measurement invariance tests to ensure that their CFA model is
equivalent among the various groups.

148
Configural Invariance. The model fit indices from the configural invariance test showed
that χ2/df = 1.28, CFI = .96, RMSEA = .03, SRMR = .07, PCLOSE = .96, which suggest good
fit. As there is no justification for model modification, the analysis proceeded to test
measurement invariance.
Measurement Invariance. The protocol for conducting the analysis is to fix the regression
weights of all items to be equal across all three groups as in Figure 9, followed by the
comparison of the χ2 or CFI results with the above configural invariant values. If the change in χ
2
(Δχ2)
is statistically insignificant, then the researchers reach the measurement invariance
conclusion (Byrne, 2010). Alternatively, the researchers can look at the change in CFI (ΔCFI)
value, which Cheung and Rensvold (2002) recommend as ≤ .01. Table 12 shows the conflicting
results of the two measurement indices. The χ2 indicates that their difference is statistically
significant (p = .04), but the change in CFI (.01) complies with the cutoff point of .01 (step 2,
Table 11). Faced with these contradictions, it is up to the researcher to decide what action to take
in the next step (Byrne, 2010). This study, however, tried to identify parameters in the CFA that
contributed to the discrepancy between configural and measurement invariance.
Table 12
Comparison of Fit Parameters among the Four CFA Models
Step Invariance χ2
df Δχ2 Δdf p CFI ΔCFI
1 Configural 418.66 327 .955
2 Measurement (all constr.) 456.68 351 38.02 24 .04 .948 .007
3 All constr., Item MA4
free
455.29 349 36.63 22 .03 .947 .008
4 All constr., Item MA2
free
449.69 349 31.03 22 .10 .950 .005

149
The investigation began with COM as it has the lowest CR (.613) among the five
constructs. Factor loading for Item MA4 was allowed to obtain any values that fit into the
multigroup structures (step 3). The changes in χ2 and df still showed a significant difference (p =
.03) between the configural and measurement structures, suggesting MA4 was not an issue. The
identification continues by fixing the MA4 parameter and setting the MA2 parameter free. This
step yields a non-significant p-value of .10 (step 4). This indicates that MA2 does not operate
across groups and could be removed from the next step in the analysis. However, during this
process CFI remained below the cutoff point of .01, which complies with the guideline
recommended by Cheung and Rensvold (1998). In addition, Byrne, Shavelson, and Muthens
(1989) and Steenkamp and Baumgartner (1998) assert that partial invariance is acceptable as
long as one of the items in the construct operates across groups. Because removing an item from
the COM could make the structure unstable, I decided to keep Item MA4 in the analysis.
Common Method Bias
Two methods were employed to test for common method bias. The Harman Single Factor
has a value of 14.76 percent, which is below the acceptable value of 50 percent. The common
latent factor only shows slight changes in values of standardized regression weights (-.01 to .09)
from the pre-CLF values (Appendix L). Appendix M compares item-by-item the regression
weights pre- and post-CLF. The values of constructs are combined into five single indices.
SEM Analysis of the Pooled Sample
The cross culture literature suggests that women around the world are more cooperative
than their male counterparts (Inglehart & Weizel, 2005). Because of this, Gender is included as a
control for this part of the investigation, and is allowed to co-vary with COM.

150
The SEM result shows an excellent model fit with χ2/df = 0.92, CFI = 1.00, MSEA = .00,
SRMR = .03, and PCLOSE = .19. The χ2/df is slightly below the cutoff value of 1; nevertheless,
χ2
(3, n = 378) = 2.75, p = 0.43, which indicates that the sample model fits well with the
theoretical model. There is a positive correlation between COM and Gender (male 1, female 0),
and it supports the assumption that males have a stronger belief in competition than females
(Figure 21). The significant standardized regression weight (β = -.14, p = .01) between Gender
and PRS indicates that males practice prosocial silence less than females. Gender has no effect
on opportunistic silence.
Hypothesis 3A states that collectivism (COL) positively correlates with prosocial silence
(PRS). The SEM obtained a standardized regression weight (β) of .23 (p <. 00). Thus, the
hypothesis correctly predicted the relationship. Hypothesis 3B predicts that COL had a negative
relationship with OPS, but the result showed a non-significant relationship (β = -.04, p = .39).
This hypothesis was rejected.

151
Figure 21. SEM model of Hypotheses 3A, 3B, 4A, 4B, 5A, and 5B, showing standardized
regression weights, correlations, and R2.
Hypothesis 4A expects a negative relationship between competition (COM) and prosocial
silence (PRS), but the result shows a significant positive result (β = .17, p < .00). Hypothesis
4B’s prediction is not rejected as the result indicates a significant positive correlation (β = .17, p
< .01) between COM and OPS.
Hypotheses 5A and 5B state that LTO positively correlates with PRS, but negatively
correlates with OPS. Long-Term Orientation does not significantly correlate with OPS (β =-.06,
p = .21) or PRS (β =.03, p = .51); therefore, these two hypotheses were rejected.
The above results came from the pooled data that combined the three healthcare
professions. To better understand the relationships among variables at the group level, the
investigation continued for the individual professions.

152
Multigroup SEM
The fit indices of the multigroup SEM show χ2/df = 1.01, CFI = .99, RMSEA = .01,
SRMR = .03, PCLOSE = .90. These indicate good fit and give no reason for model modification.
Registered Nurses (RNs). The regression weight between COL PRS (Figure 22) has β
= .29 (p < .01). Similarly, the regression weight between COM PRS is also significant and
positive (β = .26, p < .01). Gender (male 1, female 0) is positively correlated (r = .15) with
COM, but exerts no effect on PRS (β = -.01, p = .942) and OPS (β = .04, p = .61). LTO has a
negative correlation (r = -.18) with COM, but positively correlates (r = .16) with COL. COM and
COL have a very weak correlation (r = .06).
Figure 22. SEM model for the relationships among COL, COM, LTO, PRS, and OPS for the RN
group.
Medical Laboratory Technologists (MLTs). There are only two significant paths in this
group of professionals: LTO OPS (β = -.19, p = .04) and COM OPS. Gender shows a very
weak correlation (r = .02) with COM, and has no influence on PRS (β = -.07, p = .46) and OPS
RN group

153
(β = -0.03, p = .75). LTO is positively but weakly correlated with COM (r = .17) and COL (r =
.17), and COM and COL have no relationship (r = - .01) (Figure 23).
Figure 23. SEM model for the relationship among COL, COM, LTO, PRS, and OPS for the
MLT group.
Primary Care Paramedics (PCPs). There were two positive paths between COL PRS
(β = .22, p = .02) and COM OPS (β = .26, p = .01). No other significant relationships were
found. Gender had no effects on OPS or PRS. COM positively correlated (r = .12) with LTO,
and positively correlated (r = .15) with Gender. Gender did not influence OPS and PRS (Figure
24).
MLT group

154
Figure 24. SEM model for the relationship among COL, COM, LTO, PRS, and OPS for the PCP
group.
Table 13 summarizes the results of the four studies based on professional as well as
collective levels. COM had a positive relationship with OPS on the MLT and PCP groups. COM
also had a positive relationship with PRS in RN, but not the other two groups. COL only had a
significant relationship with PRS among RN and PCP groups. LTO only had a negative
relationship with OPS on the MLT group.
PCP group

155
Table 13
Relationships among COM, COL, LTO, OPS, and PRS for the Three Professions
RN MLT PCP POOLED
COMOPS .05 .19* .26** 0.17**
COMPRS .27** .06 .14 .17**
COL OPS .04 -.07 .04 -.04
COLPRS .29** .15 .22* .23**
LTOOPS -.10 -.19* -.01 -.06
LTOPRS .09 .13 -.06 .03
* p < .05, ** p < .01
Summary of the Results
This part of the study follows the same pattern as Part A. The pooled sample shows that
two (COL PRS, COM OPS) of the six hypotheses are not rejected, and one (COM PRS)
is rejected because it proved to be in a different direction from the hypothesis. LTO has no
relationship with PRS or OPS. At the profession level, both COM and COL have a positive
relationship with PRS among the RN group. For MLTs, both COM and LTO influence OPS.
COM has a positive relationship with OPS, and COL with PRS among PCPs.
In the next two parts, I examine the perceptions of three professional groups regarding
their differences in individual cultural values, and how they use their silence at work.

156
Part C
The Usage of Silence within Professions
Like the previous two parts, Part C starts with the investigation of the structure of the five
latent variables with EFA and CFA to select the items for inclusion in the study. It is then
followed by configural and measurement invariance tests. From this point on, the investigation is
split into two procedures that freely estimate the multiple dependent variables. Figure 25
illustrates the flow of the two investigations.
Figure 25. Outline of the investigation for group differences using MANOVA and latent variable
means.

157
The testing of equivalent mean structures is relatively new in comparison to the
traditional MANOVA that is used for the comparison of means among multiple dependent
variables. The method is an extension of the invariance tests where intercepts as well as
regression parameters are constrained across groups.
The correlation matrix of the silence constructs shows a moderate to strong relationship
(r = .31 to .75) among the variables. The bivariate correlations have 76% percent (145 out 190)
correlations with a significant value at p < .01 (Appendix N). This large number of significant
correlations warrants a further EFA investigation.
The four constructs in the questionnaire items related to employee silence show a slight
departure from normality with skewness ranging from -.86 to 1.35 and kurtosis -1.37 to .89. The
multivariate kurtosis has a value of 34.94, which is below the cutoff value of 224 (14 x 16).
Because both univariate and multivariate normality fell within the acceptable practical range, the
bootstrapping method was deemed redundant, and was not part of the analysis.
The EFA analysis selected maximum likelihood (ML) and Promax rotation as methods of
choice, as ML is compatible with AMOS’s method of estimation (Appendix O). The final matrix
comprised four factors, with KMO .83, Bartlett’s Test of Sphericity < .01, and the total variance
explained by the four factors is 53.4%. Five items were removed sequentially as a result of cross-
loading (OS4, OS5), low communality (AS4), and poor loading (QS6, AS5).
The CFA results from the same EFA input yields fit parameters outside the optimum
ranges (Model 1). To obtain the optimum values the correlation between e1 and e3 is added,
resulting in Model 2 as shown in Table 14. The correlation was strong at r = .44, suggesting the
two items related to the same underlying issue (Appendix P). The final CFA model had χ2/df =

158
2.68, CFI = .95, RMSEA = .07, SRMR =.06, and PCLOSE = .01 (Model 2). PCLOSE was the
only problematic index as its value < .05. However PCLOSE tests the null hypothesis that
RMSEA is < .05, which in this case had a value of .07. Hair et al. (2010) suggest that RMSEA <
.07 is acceptable when the sample size > 250 and the numbers of variables fall between 12 and
30.
Table 14
Comparison of Fit Indices between CFA Model 1 and Model 2 for the Silence Dimensions
χ2/df CFI RMSEA SRMR PCLOSE
Model 1 3.77 .91 .09 .70 .00
Model 2 2.68 .95 .07 .06 .01
Reliability and Construct Validity
QUS, PRS and ACS display a good Cronbach’s Alpha above .80 and OPS at .761 (Table
15). An alpha value > .80 is considered good and > .70 acceptable ((George & Mallery, 2007).
The correlation and the standardized regression weight of the model were checked for
convergent and divergent validities with Gaskin’s (2015) STATTOOL©
. All four factors had CR
> .70 and AVE > .50, with one exception, OPS has AVE .48. There was no real concern about
the construct validity of the CFA model.

159
Table 15
Reliability, Construct Validity and Unstandardized Correlations among Silence Dimensions
Cronbach’α CR AVE MSV ASV ACS QUS PRS OPS
ACS .85 .85 .70 .11 .08 .81
QUS .86 .86 .54 .29 .16 .32 .74
PRS .85 .86 .67 .29 .10 .11 .54 .82
OPS .76 .73 .48 .11 .06 .34 .27 .08 .69
Statistical Power
G*Power reported a statistical power of 100% based on NCP 107.76, and the Rweb
(http://www.quantpsy.org/rmsea/rmsea.htm), which used the RMSEA (CI .06 – .08) yielded the
power of 99.05%.
Common Method Bias
The SPSS reports a Harman Single Factor of 28.96, which was below the maximum
acceptable level of .50. The common latent factor suggests that it had corrected several items,
specifically QS3, QS4, QS5, PR1, and PR3 (Appendix Q). These items’ regression weights had
been reduced by at least .20 (Appendix R). All items’ regression weights were incorporated into
the constructs during imputation. This step created four constructs for the MANOVA analysis.
Latent Variable Means
Latent variable means enable the investigators to compare the mean values of the
multiple groups. Prior to applying LVM, one has to ensure that items in the CFA model operate
across groups, which is commonly tested with configural and measurement invariance.

160
Configural Invariance. This is the same procedure that was applied in Part A and Part B.
All items in the CFA model are free to obtain any values among the three groups. The configural
invariance is acceptable if the fit parameters meet the acceptable criteria. In this case, χ2/df =
1.67, CFI =.94, RMSEA =.04, SRMR =.07, and PCLOSE =.96, so all parameters passed the
cutoff points.
Measurement Invariance. After all the regression weights had been fixed across groups,
χ2 = 365.49, df = 230, and CFI = .95. These results were compared with the same parameters in
the configural invariance test. There was no significant difference between the two types of
measurement based on χ2 and CFI analyses (Table 16). The result shows both parameters fall in
the acceptable ranges
Table 16
Tests for Configural and Measurement Invariance
χ2
df Δχ2
Δdf p CFI ΔCFI
Configural 349.64 210 - - - .94 -
Measurement 365.49 230 15.85 20 .73 .95 .002
The comparison of construct mean values using CFA can let the researchers know
whether there is any difference. The mean comparison only allows researchers to compare two
groups at a time; e.g. A vs. B, A vs. C, and B vs. C. The procedure begins by fixing the
intercepts and regression weights of all groups to the same values. This is followed by the
decision to use one of the groups as the baseline (RN in this study) by fixing its mean to 0
(Figure 26). The mean values for MLT and PCP are allowed to be freely estimated.

161
Figure 26. CFA structure of the RN group with fixed mean values.
Running the analysis with the intercepts and regression weights constrained yielded the
following fit values: CMIN/DF = 1.64, CFI = .94, RMSEA = .04, SRMR = .07, and PCLOSE =
.98. The mean comparisons showed the results in columns 2 and 3 of Table 17, when RN was
used as a baseline. The signs (+/-) indicated whether the comparison groups had higher or lower

162
means than the baseline. For example, MLT had lower mean values than RN on QUS, PRS, and
ACS, but higher on OPS. The PCP means were also interpreted in a similar fashion.
Table 17
Comparison of Mean Values for QUS, PRS, ACS, and OPS among the Three Professions
RNa vs. MLT
RN
a vs. PCP
MLT
b vs. PCP
QUS -.44* -.28 .16
PRS -.15 -.37* -.23
ACS -.59* .73** 1.32**
OPS .08 .15 .08
Note: * p < .05, ** p <.01. (+) sign greater and (–) sign smaller. a RN baseline,
b MLT baseline.
MANOVA
The investigations in Part A and Part B indicated that Union had positive effects on ACS
and QUS, and Gender also affected OPS. These results suggested that Union and Gender could
be used as independent variables in the MANOVA analysis. However, the number of males in
the nursing group was only 10, and the non-union members of the PCP group were 12.
According to Hair et al. (2010), the minimum cell size for 3 groups and 4 variables is 16. This
restriction prevented Union and Gender from being used in the two-way MANOVA. This was
the reason this study only conducted one-way MANOVA in group comparisons.

163
Table 18
Means, Standard Deviations and Correlation Matrix of OPS, ACS, PRS, and QUS for the Three
Professions
Variable Mean SD OPS ACS PRS QUS
RN
n = 156
OPS 1.83 0.99 1
ACS 3.48 1.65 .37** 1
PRS 2.32 1.16 .03 .09 1
QUS 2.52 1.15 .32** .43** .03 1
MLT
n = 115
OPS 1.87 1.14 1
ACS 2.97 1.74 .50** 1
PRS 2.31 1.11 .02 .06 1
QUS 2.14 1.26 .46** .63** .05 1
PCP
n =107
OPS 2.02 1.11 1
ACS 4.16 1.84 .30** 1
PRS 2.21 1.25 .13 .18 1
QUS 2.74 1.17 .35** .56** .15 1
Pooled
n = 378
OPS 1.89 1.07 1
ACS 3.52 1.79 .39 1
PRS 2.29 1.17 .05 .09 1
QUS 2.47 1.21 .38** .55** .07 1
** Correlation is significant at p < .01 level (2-tailed). n = 378
Table 18 shows the mean, standard deviation and the correlations of the dependent
variables of the pooled sample as well as for the individual professions. All mean values are
lower than the mid-point of the response scale (4), which indicates that on average the
participants do not agree with the survey statements.

164
For the analyses by profession, PCP had the highest mean values on OPS, ACS, and
QUS. RN had the highest PRS, but the variable means were quite close among the three
professions. The table also shows the bivariate correlations among the four variables for the RN,
MLT and PCP groups. The three professions had similar mean values which were below the
midpoint of 4, with the exception of the PCP group whose mean for ACS = 4.16
MANOVA has three important assumptions: first, the observations are independent;
second, the variance-covariance matrices of the groups must be relatively equal; and, third, the
set of dependent variables must follow multivariate normality (Hair et al., 2010). This study was
an online survey, so it was not possible to determine whether the observations were independent.
Judging from the timing of the participants’ responses, there was no reason to doubt that they
were independent. The skewness and kurtosis (Table 19) of each profession were below 1.2, and
are within the acceptable range of ±2 (George & Mallery, 2007).
Table 19
Skewness and Kurtosis of OPS, ACS, PRS, and QUS for the Three Professions
RN MLT PCP
(n = 156) (n =115) (n = 107)
Skewness Kurtosis Skewness Kurtosis Skewness Kurtosis
OPS .81 .18 .92 -.03 .85 .09
ACS .23 -.94 .33 -1.15 -.38 -1.00
PRS -.35 -.23 -.68 .09 -.50 -.41
QUS -.39 .-62 -.03 -.79 -.30 -.22

165
The univariate outliners are presented in boxplots (Figure 27), which show some outliers,
notably on PRS and OPS. These outliers were kept in the analysis because the Box’s and
Levene’s tests were in the acceptable ranges.
Figure 27. Boxplots of OPS, ACS, PRS, and QUS by profession.
Box’s M is equal to 15.90 and is not significant [F (20, 420592.88) = .78, p = .74],
supporting the assumption of equality of covariance matrices. Levene’s test also indicated the
equality of variances for OPS [F (2, 375) = 1.32, p = .27], ACS [F (2, 375) = 1.45, p = .24], PRS
[F (2, 375) = 1.66, p =.19], and QUS [F (2, 375) = 1.63, p = .20]. These results suggest that the
data do not violate MANOVA assumptions.

166
The multivariate test shows that there is a significant difference among the three
professions in their perceptions of silence at work, F (8, 744) = 4.13, p < .00; Wilk’s Λ = .92,
partial η2 = .04.
The univariate ANOVA results suggest a statistically significant effect on ACS and QUS.
For the ACS, the result shows F (2, 375) = 13.25, p < .01, and partial η2 = .07. QUS has F (2,
375) = 7.13, p < .01 and partial η2 = .04. There were no statistically significant differences in
OPS (p = .36) and PRS (p = .74) among the three professions.
Post Hoc Comparison
Tukey’s post hoc tests indicated that RN and MLT were significantly different on ACS (p
= .05) and QUS (p =.03). RN and PCP were significantly different on ACS (p = .01), and MLT
and PCP were significantly different on both ACS (p < .01) and QUS (p < .01).
There were conflicting results between the latent variable means (LVM) and Tukey’s
honestly significant difference HSD post hoc tests (Table 20). The discrepancy was on the PRS
construct which showed a significant difference between RN and PCP under LVM but not the
post hoc tests. There was also disagreement between MLT and PCP on QUS, where it was
significant for post hoc, but not on the latent variable means. The literature has not provided
advice as to which is a preferable method, but scholars suggest the CFA latent mean method is a
better choice as it measures unobservable constructs (Innstrand, Langballe, Falkum, & Assland,
2011; Michon & Chebat, 2008; M. S. Thompson & Green, 2013). Nevertheless, both methods
rejected Hypothesis 8, which stated that there was no significant difference among the three
professions on the use of silence in the workplace.

167
Table 20
Pair-wise Comparisons between Latent Variable Means and Post Hoc Tests for the Silence
Dimensions
RN vs MLT RN vs PCP MLT vs PCP
LVM Post Hoc LVM Post Hoc LVM Post Hoc
QUS p = .01 p = .03 p = .11 p = .32 p = .41 p = .00
PRS p = .41 p = .99 p = .04 p = .74 p = .27 p = .81
ACS p = .01 p = .05 p = .00 p = .01 p < .00 p = .00
OPS p = .66 p = .95 p = .39 p = .34 p = .70 p = .55
Note: LVM - latent variable means , post hoc = ANOVA with Tukey’s HSD post hoc test

168
Part D
The Relationship between Occupations and Individual Cultural Values
This investigation evaluated how the three professions perceived the individual cultural
values (ICV) at their workplaces. As demonstrated in Part C, the three occupations applied
silence differently in their organizations. Do they also have different perceptions of power
distance (POD), competition (COM) and uncertainty avoidance (UNA)? Hypothesis 9 states that
there are no differences in POD, COM and UNA scores among the three professions.
The investigation uses the same steps as in Figure 7, and starts with bivariate correlations
(Appendix S). A visual inspection of the correlation matrix identifies 32 out of 92 correlations
that are significant at p < .01, providing adequate evidence for EFA investigation.
The method of EFA extraction with PAF, Promax rotation with .20 suppression, and
eigenvalues greater than 1 was selected for this analysis. The final model had three factors with
KMO 0.767 and 45% variance extracted (Appendix T). Item PO5 did not load in the pattern
matrix. Items MA3 and PO3 had communality < .20; therefore, they were excluded from the
pattern matrix. Items UN1 and PO4 had lower loadings, but were kept in the analysis because
Hair et al. (2010) recommended loadings of at least .30 for a sample size of 350 and greater. In
addition, removing either of these two items will leave the constructs with only 2 items,
rendering them unstable in the CFA analysis.
Items from the three factors, POD (PO1, PO2, and PO4), COM (MA1, MA2, MA4), and
UNA (UN1, UN2, UN3, UN4, and UN5), are the data for CFA analysis. Appendix U presents
the CFA model of the study and shows that Item PO4 still has a low standardized regression
weight (.46), but was kept in the analysis to make the construct stable. In contrast, Item UN1,
which also had low regression weight (0.41), was removed because doing so strengthened the

169
UNA without sacrificing its stability. The final model has a good fit with χ2/df = 1.38, CFI = .99,
RMSEA = .03, SRMR = .04, and PCLOSE = 0.92.
Multivariate Normality and Outliers
The multivariate kurtosis value was 86.16, which is still below Teo et al.’s (2013)
recommendation of 120 (10 x 12). Using χ2(10, 378) = 29.59, p < .001 as a critical value, the
Mahalanobis distance values (0.04 to 25.26) are all at the acceptable level (Tabachnick & Fidell,
2007).
Bootstrapping
The standardized regression weights from CFA results showed very small biases from the
bootstrapping technique (Appendix V). The analysis continued to tests of configural invariance,
measurement invariance and latent variable means to study the perceptions of RN, MLT, and
PCP on the individual cultural values.
Configural and Measurement Invariances
The configural invariance test showed a good model fit with χ2/df = 1.15, CFI = .99,
RMSEA = .02, SRMR = .05, and PCLOSE = 1.00. The measurement invariance test showed a
significant difference from the configural model, suggesting there are items that do not operate
consistently across groups. As shown in Table 21, when Item UN2 was free, the measurement
model yielded Δχ2 = 23.35, Δdf = 12 (p = .03). Item UN2 was the only item that was invariant
across groups in the UNA construct. The next step was to follow the same procedure for COM
and POD constructs. The result showed that only Item MA2 was not invariant across groups.
Whether to remove these two items (UN2 and MA2) from the analysis is unclear (Byrne, 2010;
Millsap & Kwok, 2004). Since Byrne et al. (1989) and Steenkamp and Baumgartner (1998)
suggested that partial invariance were acceptable, this study retained Items UN2 and MA2 in the
analysis.

170
Table 21
Goodness-of-Fit Statistics for Tests of Multigroup Invariance
Model χ2
df Δχ2
Δdf p CFI ΔCFI
Configural 110.63 96 - - - .99 -
All constrained 148.13 110 37.50 14 .00 .96 .025
Only UN2 free 133.98 108 23.35 12 .03 .97 .012
UN2 and MA2 free 127.96 106 17.35 10 .07 .98 .008
The composite reliabilities and the average variance extracts (AVE) of the two constructs
in Table 22 suggest that COM has marginal reliability, but the composite reliability (CR) is
acceptable.
Table 22
Reliability, Construct Validity and Unstandardized Correlations among COM, UNA, and POD
Cronbach’s α CR AVE MSV ASV COM UNA POD
COM .59 .61 .35 .16 .08 .59
UNA .86 .86 .61 .01 .00 -.07 .78
POD .66 .68 .52 .16 .08 .40 .01 .72
Power Analysis
The G*Power gives the power of 93.81% from the derived NCP = 12.25, and RMSEA
(CI .00 to .05) reports 88.72%. These values are above the acceptable 80%.

171
Common Method Bias
When EFA was constrained to extract one factor with no rotation, it reported a Harman
Single Factor test value of 28.63. The common latent factor (Appendix W) suggested only small
corrections (0.20% to 4.60%) among the items in each of the three constructs (Appendix X).
These corrections were incorporated in the composite indices for MANOVA analysis.
Latent Variable Means
The analysis follows the same procedure as stated in Part C, i.e., fixing the intercepts and
factor loadings of all groups. One group (RN) was selected as a baseline for mean comparisons,
and the other group means (MLT and PCP) were freely estimated (Figure 28).
Figure 28. Structured mean model of the RN group.

172
Group comparisons using latent variable means suggest there were significant differences
between RN and MLT on UNA and POD, but no difference between RN and PCP on the same
constructs (Table 23). MLT and PCP were only different in UNA.
Table 23
Comparison of Mean Values for UNA, POD, and COM among the Three Professions
RNa vs. MLT RN
a vs. PCP
MLTb vs. PCP
UNA .59** -.29 -.87**
POD .42** .25 -.17
COM -.14 .06 .19
Note: ** p < .01, (-) sign smaller: a RN baseline,
b MLT baseline
MANOVA
The composite data of POD, COM, and UNA were not normally distributed and a two-
step transformation was applied to data (Templeton, 2011). As shown in Table 24, the means and
standard deviations of the data pre (POD, COM, UNA) and post (TPOD, TCOM, TUNA)
transformation are quite similar, with minor mean changes in the fourth decimal points for UNA,
third for POD and second for COM. During the transformation process one data point of each
variable was out of the range, reducing the sample size to 377. There is a positive correlation
between POD and COM, but both are negatively correlated with UNA.

173
Table 24
Means, Standard Deviations, and Correlations among POD, TPOD, COM, TCOM, UNA, and
TUNA
Variable Mean N SD POD TPOD COM TCOM UNA TUNA
POD 1.71 378 .94 1
TPOD 1.72 377 .92 .92** 1
COM 1.19 378 .66 .51** .54** 1
TCOM 1.19 377 .65 .53** .63** .94** 1
UNA 5.62 378 .98 -.02 -.07 -.08 -.12* 1
TUNA 5.62 377 .96 -.50 -.12 -.17 -.17** .87** 1
Note. *p < .05. **p <.05.

174
As shown in Figure 29 and Figure 30, the boxplots of each variable, categorized by
profession, show significant improvements after the transformation.
Figure 29. Boxplot of the pre-transformation of COM, POD, and UNA by profession.

175
Figure 30. Boxplot of post-transformation of COM, POD, and UNA by profession.
The RN group had only one outlier each for TUNA and TPOD. Among the MLT, the
transformation completely removed 4 outliers from TPOD and 10 from TCOM, but left 6
outliers in TUNA. PCP had the least benefit from the transformation process with only one
reduction of outlier from TPOD and 2 from TUNA.

176
Table 25
Means and Standard Deviations of the Dependent Variables Pre- and Post-Transformation of
the Three Professions
Profession POD TPOD COM TCOM UNA TUNA
RN
N 156 155 156 156 156 156
M 1.58 1.57 1.18 1.21 5.54 5.52
SD .83 .87 .62 .62 1.03 .93
MLT
N 115 115 115 115 115 114
M 1.82 1.79 1.14 1.13 6.02 6.08
SD 1.07 1.03 .64 .68 .70 .82
PCP
N 107 107 107 106 107 107
M 1.79 1.85 1.24 1.24 5.30 5.27
SD .90 .84 .75 .64 1.01 .98
Table 25 compares uncertainty avoidance, power distance and competition among the
three professions, based on pre- and post-transformation. There are slight differences in the mean
values of each profession on the dependent variables. The results also indicate that RN, MLT and
PCP agree with the questionnaire statement related to uncertainty avoidance, but disagree on
power distance and competition. MLT has the highest scores on uncertainty avoidance, and PCP
on power distance and competition.
The transformation process changes the values of Box’s test from 50.86 [F (12,
556435.82) = 4.12, p < .01] to 17.11 [F(12, 5460035.67) = 1.41, p = .15], indicating that there
are no significant differences between covariance matrices in post-transformation data. The pre-
and post-transformation of Levene’s tests are summarized in Table 26. Results also show that
transformation has changed the values of POD (p = .05) to TPOD (p = .22) and UNA (p < .01) to
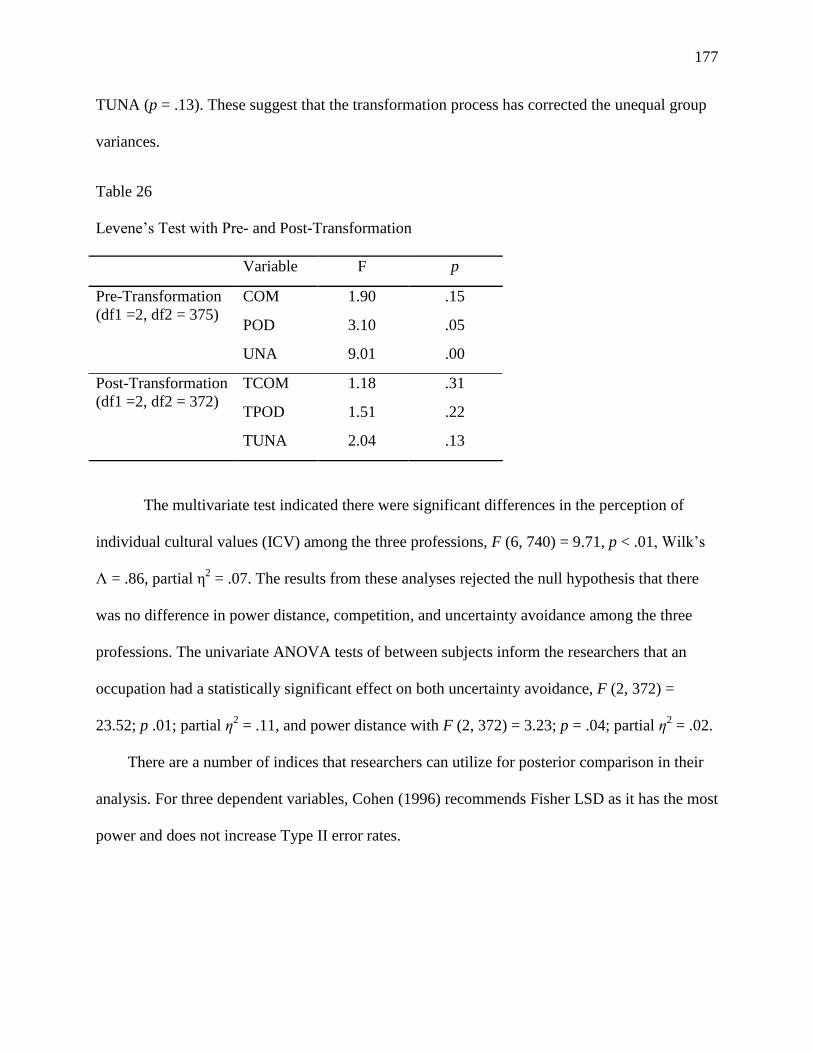
177
TUNA (p = .13). These suggest that the transformation process has corrected the unequal group
variances.
Table 26
Levene’s Test with Pre- and Post-Transformation
Variable F p
Pre-Transformation
(df1 =2, df2 = 375)
COM 1.90 .15
POD 3.10 .05
UNA 9.01 .00
Post-Transformation
(df1 =2, df2 = 372)
TCOM 1.18 .31
TPOD 1.51 .22
TUNA 2.04 .13
The multivariate test indicated there were significant differences in the perception of
individual cultural values (ICV) among the three professions, F (6, 740) = 9.71, p < .01, Wilk’s
Λ = .86, partial η2 = .07. The results from these analyses rejected the null hypothesis that there
was no difference in power distance, competition, and uncertainty avoidance among the three
professions. The univariate ANOVA tests of between subjects inform the researchers that an
occupation had a statistically significant effect on both uncertainty avoidance, F (2, 372) =
23.52; p .01; partial η2 = .11, and power distance with F (2, 372) = 3.23; p = .04; partial η
2 = .02.
There are a number of indices that researchers can utilize for posterior comparison in their
analysis. For three dependent variables, Cohen (1996) recommends Fisher LSD as it has the most
power and does not increase Type II error rates.

178
Multiple comparisons for RN and MLT were significantly different in TUNA (p <
.0005). RN and PCP were also significantly different in TUNA (p = .031) and TPOD (p = .016),
and MLT and PCP were different in TUNA (p < .001).
Comparison of Latent Variable Means and MANOVA
In these posteriori comparisons of three variables’ means, I applied Fisher’s LSD because
it has more power than the Tukey’s HSD test (Cohen, 1996). Two discrepancies between LVM
and Fisher’s LSD post hoc results were observed in this study. First is the disagreement of TPOD
mean values between RN and MLT, where MANOVA reported p = .08, LVM = .01. Second is
the disagreement between RN and PCP, where post hoc tests yielded statistically significant
values for both TPOD (p = .016) and TUNA (p = .031), but LVM reported both values at p =
.061 and p =.051, respectively (Table 27). Regardless of these disagreements, both methods
reject Hypothesis 9 in that there are no differences in POD, UNA, and COM among the three
professions.
Table 27
Pair-wise Comparison between Post Hoc and Latent Variable Means of ICV Dimensions, Post-
Transformation
RN vs MLT RN vs PCP MLT vs PCP
Post Hoc LVM Post Hoc LVM Post Hoc LVM
TCOM p =.34 p =.28 p = .64 p = .73 p =.19 p =.23
TPOD p =.08 p =.01 p = .02 p = .06 p =.50 p = .29
TUNA p =.00 p =.00 p =.03 p = .05 p =.00 p =.00
LVM: Latent Variable Means; post hoc is ANOVA with Fisher’s LSD post hoc tests.

179
Summary of the Chapter
This study has a total of ten constructs, three of which violate the normality assumptions.
Because MLE is sensitive to departure from normality, the bootstrapping technique was applied
for comparison. Convergent and divergent validities were also applied to validate the integrity of
the factors. Two types of structural invariance tests were applied to all factor investigations. A
configural invariance test ascertained the model structure was maintained across groups, while a
measurement invariance test indicated that the participants from the three professions understood
the questionnaire in a similar fashion. In addition, the investigation also included power analysis
to study Type II errors, an important topic that has been neglected in the research literature. In
order to follow this rigorous process, the investigation required multiple types of computer
software to access their available features. AMOS was the main SEM program as it had a user-
friendly interface, allowing easy modification for different models. EQS provided a confidence
interval of RMSEA for statistical power analysis.
Part A’s investigation confirmed one of the four hypotheses: that uncertainty avoidance
was positively correlated with acquiescent silence. The investigation also confirmed hypotheses
6A, 6B, 7A and 7B in that psychological safety mediated the four relationships among power
distance, uncertainty avoidance, and acquiescent and quiescent silence.
Part B investigated the relationship among three individual cultural values constructs
(COM, COL, and LTO) and two silence constructs (PRS and OPS). One of the four items from
the COM construct had to be removed from the correlation study because it failed the invariance
test. Somehow this item did not operate in the same way across groups. Only two of the six
hypotheses were supported by the results from the analyses. They showed a positive correlation
between COL and PRS and between COM and OPS. The hypothesis expected COM to be
180
negatively related to PRS, but the results showed the reverse. The results did not support
hypotheses 3B, 4A, 5A, and 5B.
Part C applied two types of analysis to investigate the silence perceptions among the
three professions. As mentioned, scholars have argued that MANOVA is not a proper statistical
tool for analyzing latent constructs. The four silence constructs did not departure from the
acceptable skewness (±2) and kurtosis (±2), and all the extracted variables from the EFA passed
all of the rigorous CFA analysis. The mean value for acquiescent silence was significantly
different among the three occupations (RN vs. MLT, RN vs. PCP, and MLT vs. PCP). Quiescent
silence was only significantly different between RN and MLT. MLT and PCP were different in
acquiescent silence.
In Part D, MANOVA results indicated the overall difference among the means of the
three groups, and the post hoc tests pointed to the difference between RN and MLT in power
distance and uncertainty avoidance. MLT and PCP were not significantly different in perception
of power distance, but were different in uncertainty avoidance. RN and PCP did not have any
difference in perceptions of uncertainty avoidance and power distance.

181
CHAPTER 5: DISCUSSION
Employee silence can hurt organizations in many ways. When employees know things
have gone wrong but do not inform their superiors it can lead to the loss of revenue, wastage of
supplies, less effective organizational decision making, and even harm patients in many cases.
Organizational silence can occur due to a multitude of factors such as organizational
environments, business strategy, and cultural background (Morrison & Milliken, 2000).
Assessment of CVSCALE, Silence, and Psychological Safety Scales
The developers of the CVSCALE report that they tested their instrument on 213
American and 220 Korean participants, using a Likert scale of 1 to 5. The American undergrad
participants have the following scores: Power distance (POD) 2.1, Uncertainty avoidance (UNA)
3.71, Collectivism (COL) 3.05, Long-Term Orientation (LTO) 3.97, and Competition (COM)
2.25. These values when converted from a 5-point to a 7-point Likert scale are compared to the
current study ("Transforming different", 2010) , and as shown in Table 28, this study obtains
lower values for POD and COM, but higher values for UNA, COL, and, LTO.

182
Table 28
Comparison between Yoo et al.’s Results and the Current Study on the Mean Values of the ICV
Dimensions
Note. Data from (Yoo et al., 2011) were transformed from a 5-point to 7-point Likert scale. Their
data presented in this table are from respondents from the US (n = 213).
The CFA factor loadings from Yoo et al.’s (2011) study are lower in comparison to the
current study, with an average POD of .49 vs. .62 and UNA .57 vs. .78. Yet their Cronbach’s
alpha values are higher with POD .91 vs. .66, and UNA .88 vs. .84. The low Cronbach’s alpha of
the POD and UNA are consistent with another study that reported values of .63 for POD and .81
for UNA (Prasongsukarn, 2009). Table 29 compares factor loadings of 3 items on POD and 3
items on COM that were used in Part D. These two constructs were identified as problematic in
this study.
(Yoo et al., 2011) Current study
POD 2.65 1.84
UNA 5.44 5.99
COL 4.08 4.39
LTO 5.46 5.82
COM 2.88 2.47

183
Table 29
Factor Loadings of POD and COM Items from the Literature
(Yoo et al., 2011)a
(Prasongsukarn, 2009)b
Current studyc
PO1 .43 .33 .75
PO2 .48 .26 .67
PO4 .58 .57 .46
MA1 .58 .97 .57
MA2 .62 .94 .51
MA4 .43 .14 .58
Note: participants came from:
a pooled sample (American and Korean),
b Thai subjects,
c Canadian
Table 29 is not expected to show identical values of item loadings among the three
investigations, but to show the consistency of low POD items as a construct of the CVSCALE
scale. The current POD construct has a low Cronbach’s α .66 and CR .67, even when only the
three strongest items are kept in the analysis in my study. Of the other two items, Item PO3 had
communality < .30, and Item PO5 loaded < .10. These are too weak to be kept in this analysis.
Items MA1, MA2, and MA4 in the current study were consistent with Yoo et al.’s (2011) results.
Prasongsukarn (2009) used subjects from Thailand and Thais living in Australia, and those
results appeared to contradict Yoo et al. (2011), and the current findings.
There are other scholars who applied the CVSCALE instrument in their research, but
several of them have not conducted their own CFA. Their studies only confirm the integrity of
factor loadings with Cronbach’s reliability test (Al-Nasser, Yusoff, Islam, & AlNasser, 2014; B.
O. Anderson, 2012; Antoine, 2015; Ogden & Cheng, 2011; Tankari, 2012).
Knoll and van Dick (2013b) developed the silence questionnaire to study its relationship
with employee satisfaction, job stress, well-being, and organization identification. The

184
researchers extracted four silence constructs and presented their EFA and CFA in their report.
The authors selected three items from each of the constructs that had factor loadings > .50 in
their report. The Cronbach’s alpha for acquiescent silence (ACS) and quiescent silence (QUS)
were .88 and .89 which were able to be replicated in this study at .85 and .86. The composite
reliability (CR) and average variance extracted (AVE) are both .86, suggesting strong convergent
and divergent validities.
The construct of psychological safety (PSY) was developed two decades ago and since
then several investigators have incorporated the construct into their research. However, they did
not report CFA results; therefore, comparison with this study cannot be made (Baer & Frese,
2003; Roussin & Webber, 2012; Siemsen, Roth, Balasubramanian, & Anand, 2009). The
construct contains seven items, but I only retained three in the final EFA model because the
others have communalities < .30 and factor loadings < .40. Schaubroeck, Lam, and Peng (2011)
applied all seven items of PSY in their analysis and reported a Cronbach’s alpha of .92. Hirak,
Peng, Carmelli, and Schaubroeck (2012) also reported a similarly high value of .90. This study
obtained a lower Cronbach’s alpha of .72, and CFA factor loading average of .68, which is close
to Raes et al.’s (2013) report of alpha .71 and average loading of .58. Interestingly, their subjects
of study were also hospital nurses.
Part A
A majority of employees in this study are represented by unions and the analysis shows
that union membership has a negative correlation with UNA, which in turn has a negative
correlation with ACS. It is understandable as to why the union reduces UNA in the hospital work
environment. For example, work schedules are an important issue that can create conflict
between management and employees. Unionized organizations normally require a work schedule

185
for their employee four weeks in advance (Alberta Union of Provincial Employees, 2010).
Without this rule employers can take less time to post employee work schedules, creating
uncertainty and making it difficult for employees to arrange their personal activities. The
negative correlation between UNA and ACS may be due to the fact that UNA individuals need
certainty before they follow the directions of their leaders. They are more likely to ask questions
to ensure they fully understand the issues.
As expected, acquiescent silence and quiescent silence are strongly positively correlated
in the pooled sample as well as for the individual professions. The two variables may have non-
recursive correlation, but I did not investigate this because it is not within the scope of this study.
Gender and tenure are also used as controls but they have no effect on the pooled sample.
At the individual profession level, tenure positively correlates with acquiescent silence (ACS)
among MLTs. Gender and tenure have no effect on ACS or quiescent silence (QUS) among RNs
or PCPs.
Collectively, union membership has a significant positive effect on both ACS and QUS.
Separately, the positive effects on silence only apply to the MLT and PCP groups, but not to the
RN group. This is rather surprising since the union is a vehicle for voice. If employees are
encouraged to voice their dissatisfaction, why does union membership increase silence in the
workplace? It is likely that employees communicate their dissatisfaction of the work situations to
their union representatives, as health and safety, and occupational standards are functions
handled by union stewards. Bentham (1999) states that union members still fear retaliation.
Donaghey, Cullinane, Dundon, and Wilkinson (2011) suggest that voice mechanisms are defined
according to management’s own interpretation which shapes the organizational climate and the
extent to which employees feel they can influence matters that affect them. As Kostiuk (2012)

186
states in his dissertation, “groups were poor places to explore new ideas and think out loud
because of the lack of responsiveness” (p. 34). X. Huang et al. (2005) identify “two voice
mechanisms that may reduce the level of organizational silence: the extent to which employees
are formally involved in activities of decision-making and feedback (structural), and the degree
to which a participative climate is nurtured by management (social)” (p. 462). This suggests that
management is able to keep certain decisions as its own prerogative, and exclude union and
nonunionized members from participation. This may be the contributing factor that makes union
employees less satisfied with their jobs, with the exception of pay, when compared to
nonunionized employees (Schwochau, 1987). The compensation negotiations usually cause
conflict and job actions that make management believe union members are only self-interested.
This leads to management practices that prevent them from accepting negative feedback and
adopt centralized decision making (Morrison & Milliken, 2000). These factors can make
employees dissatisfied, and cause them to become disengaged and stay silent when they could
suggest improvements in flawed processes in the workplace. X. Huang et al. (2005) found that
formalized employee involvement and a participative climate do not encourage employees to
voice their opinions in high POD cultures.
The hypotheses about UNA and silence were postulated based on research from D. S.
Baker and Carson (2011), D. Lee (2013), and Abraha (2002), who discovered that UNA
individuals prefer to stay silent and do not take action in uncertain circumstances. The hypothesis
is not supported by the current research results which show a non-significant relationship
between UNA and QUS in the MLT and RN groups. The result contradicts the hypothesis that
there is the positive relationship between UNA and ACS among the MLT group. But in hindsight
it is understandable why the reverse relationship is happening among the MLT group. The MLT
187
profession has a work structure similar to pathologists such as reviewing blood films, and
interpreting laboratory tests. Their level of understanding of the diseases may be quite different;
however, their work processes are similar. When technologists come across issues they believe
are beyond their comprehension, they pass the information to the pathologists for a second
review. Basically, the pathologists check the work of laboratory technologists. Their work
process reinforces the uncertainty avoidance, which is a good thing in medical diagnosis. Nurses,
on the other hand, take orders from physicians’ requests such as dispensing medication, checking
physical signs, and alerting physicians of unexpected events. Primary care paramedics respond to
patients’ calls on an emergency basis and are trained to follow the protocol according to their
scope of practice. PCP performance is measured by response time to cardiac arrest calls. They do
not report to medical personnel, and their operation is under the jurisdiction of the regional
municipality (Anonymous, 2014).
The relationship between employees’ individual values and employees’ silence has never
been reported in the literature with the CVSCALE. Rhee, Dedahanov, and Lee (2014) were the
only team that studied the relationships between power distance (POD), collectivism (COL),
acquiescent (ACS), and defensive or prosocial silence (PRS) using Dorfman and Howell’s
(1988) individual cultural value surveys and Van Dyne et al.’s (2003) questionnaire related to
employee silence. The results show a weak correlation between POD and ACS, COL and ACS,
and QUS and punishment. All of the constructs in this study have convergent and discriminant
validities that pass the acceptable criteria. The subjects in their study were employees in heavy
industry in South Korea, but the authors did not disclose the type of industry and participants’
occupations. Yoon (2012) reports that individuals with high POD are inclined not to express
their disagreement with their bosses. My study using Yoo et al.’s (2011) questionnaire indicates

188
that the three professions in the healthcare industry do not have the same perceptions of silence
and individual cultural values.
Among the MLTs, POD has a positive relationship with ACS (β = 0.217, p < .05) and
QUS (β = .18, p < .05), but not with UNA. The RN group only shows a significant positive
relationship between POD and ACS (β = .28, p < .01). The PCP group only has a significant
negative relationship between POD and QUS at p < .10. The reasons for differences among these
professions are unknown, but the laboratory personnel work under the supervision of
pathologists who have the ultimate responsibility for medical diagnoses such as tumours, cancer,
and leukemia. The two professions are organized in a top down hierarchy, highly different in
income, prestige, education, and public recognition. Laboratory personnel do not really come
into contact with the patients. The laboratory locations are usually hidden in the hospitals, not
accessed by the patients or even other hospital workers. There is no medical laboratory
technologist who is at the level of chief executive officer (CEO) in Canadian hospitals. The
nursing profession is different. Over the past several years, nurses have gained public acceptance
as one of the key professions that can improve healthcare. Many CEOs in the hospitals were
front line nurses who gained experience, responsibilities, and further educated themselves for
this leading healthcare position. The paramedic group does not report to medical personnel, but
to their bosses who then work within their own chain of commands, and they work under the
supervision of municipalities. In a pooled sample, POD has a positive relationship with ACS (β =
.17, p < .01), and UNA has a negative relationship with ACS (β = -.12, p < .05). The significant
negative relation between UNA and ACS in the pooled sample may come from the combined
effects of the three professions that individually show a negative but not significant relationship
between the two variables. Both the MLT and PCP show a significant relationship between POD

189
and QUS, but in opposite directions. Their results appear to neutralize each other’s effect and
appear non-significant at the pooled level (RN result is non-significant).
The interpretation of mediation effect in this study is based on Zhao et al.’s (2010)
recommendation in Table 2.
For the combined healthcare professions, PSY does not mediate the relationship between
POD and QUS, but shows direct-only, non-mediation between POD and ACS. It is likely that a
second mediator is not detected in this case, according to Zhao et al. (2010). Among the RN
group, PSY exerts a complementary mediation effect between POD and ACS, and indirect-only
(full) mediation between POD and QUS. This full mediation is surprising, as there is no direct
relationship between POD and QUS prior to the addition of PSY into the equation, and Barron
and Kenny (1986) would consider this not mediation. Since the indirect effect is significant by
the bootstrapping technique, but the direct effect is not, Zhao et al. (2010) call this phenomenon
indirect-only mediation.
PSY has an indirect-only mediation effect on all of the relationships between UNA and
ACS, UNA and QUS, POD and ACS, and POD and QUS among the MLT group. Because PSY
has a negative correlation between the independent and dependent variables, the mediator
reduces employee silence and would likely increase voice activity. When the working
environment is psychologically safe, MLTs have less fear in expressing opinions to colleagues
and superiors.
In the PCP group, PSY exerts no influence on the relationships between independent and
dependent variables. Bootstrapping results show non-significance in all indirect paths (a × b). As
well there is no significant relationship in the direct path (c). According to the decision tree, the

190
relationships have no effect, non-mediation, and a wrong theoretical framework (Zhao et al.,
2010).
The suggestion that a second mediator may be omitted from the analysis is quite
interesting. As discussed in the literature review, there are three psychological antecedents of
voice. This study only looks at PSY, and omits felt obligation for constructive change (FOC) and
organization-based self-esteem (OBSE) from the analysis. Felt obligation may compel
employees to speak up when they learn that something is not right. An example is the case of
“Dr. Death” in Queensland that was mentioned in the introduction; the nurse manager felt an
obligation to notify her supervisor and medical director when she observed the surgeon’s
carelessness (Sandall, 2005). A similar incident also happened in Winnipeg where a pediatric
cardiac surgeon with stellar curriculum vitae had incompetently performed operations that led to
the death of 12 children before he was” encouraged to take a vacation” (McIver, 2001). The
nurse managers in both incidents decided to report not because of psychological safety, as they
were ridiculed, put down, and even advised to seek psychological counseling. They were more
likely to report because of felt obligations for constructive changes.
Part B
Part B investigated the relationship of three individual cultural values (competition, long-
term orientation and collectivism) and two silence constructs (prosocial and opportunistic
silence). There are few reports of CFA factor loadings that this study can use for comparison.
Among the three constructs, COM is the most problematic in this study with all items loaded at
≤ .60. Yoo et al. (2011) had 4 items loaded < .60, and two loaded > .70, but Prasongsukarn
(2009) had two items loaded ≥ .90, and two loaded < .35.

191
There have been no reports in the literature on the relationship between collectivism
(COL) and prosocial silence (PRS). Liu, Chi, Friedman, and Tsai (2009) found that incivility in
the workplace is associated with individual achievement orientation, and self-efficacy.
Achievement orientation is the intent to reach one’s personal goals. When individuals confront
barriers that prevent them from achieving their goals, they experience frustration and become
rude and disregard the needs of others. High COL individuals are able to constrain their
frustration and control their uncivil behaviour. COL also has a moderating effect on social
bonding. In a comparison between India and Canada, a research team reported that cultures high
in COL (e.g., India) put more emphasis on social bonding when they conduct business, while
Canada gives more weight to the structural relationship. People who value collectivism and face-
saving are more likely to make a constructive response to negative workplace situations (Park,
2011). The above three results suggest that COL does not directly express dissent. The positive
correlation between COL and PRS, at collective (pooled sample) and individual profession
levels, indirectly supports the above findings.
There are very few studies on the relationship between COL and OPS. Rhee et al. (2014)
found no support for the relationship between COL and PRS in their survey of participants from
South Korean in heavy-industry companies. Chen, Peng, and Saparito (2002) proposed that
when a conflict happens between groups, individuals who are high on COL will be more
opportunist than the individualists, and vice versa for conflict within groups. In this study, COL
has no relationship with OPS in all three professions and for the professions combined
The non-significant correlation between competition (COM) and OPS among the RN
group may be the result of a higher percentage of female participants (95%). Literature suggests
that a majority of females are more nurturing, compromise more, are less opportunistic, and
192
exhibit more helping behaviors (Hofstede, 2001). There is less corruption in countries that have a
greater number of women in government (Dollar, Fisman, & Gatti, 2001). The RN group has the
highest percentage of female participants, compared to the MLT (84%) and PCP (31%) groups.
This could be the reason why there is no significant relationship between COM and OPS in the
RN group. The MLT and PCP groups show a significant positive relationship between the two
constructs, with stronger results in the latter group. The difference may also reflect a stronger
competition due to lower opportunity for advancement in their professions. In terms of
advancement, RNs have more opportunity to grow in their occupations such as becoming
midwives, nurse practitioners, and perfusionists, while MLTs and PCPs do not have comparable
options. The needs for achievement and getting ahead may cause competitive individuals to be
more aggressive when opportunity arises among the MLTs and PCPs. In terms of gender, males
have higher values for COM than females, among the RNs and PCPs. Gender does not have a
relationship with OPS and PRS in all of these professions.
Among the three professions, the RNs are the only group that shows a positive
relationship between COM and PRS. Prosocial silence is a behavior that employees intend to use
to protect their colleagues or superiors from punishment or embarrassment. This may suggest
that nurses act out of their concerns for the consequences of others, but it could be a professional
solidarity where members are protecting each other and are expecting the same favor in the
future.
Long-term orientation (LTO) is a construct that is based on the Chinese Value Survey
that captures harmony, tolerance, non-competitiveness, conservatism, solidarity, and
trustworthiness (Bond, 1988). The MLTs are the only group with a significant negative
relationship between LTO and OPS, indicating employees voice their concerns when they know

193
their colleagues are committing mistakes. This group has the highest percentage (36%) of
participants born outside Canada, compared to the RNs (25%) and PCPs (12%). Half of the
foreign born MLTs came from Asian countries that value long-term relationships. This may be a
reflection of their cultural values.
The pooled sample does not show significant correlations between LTO and OPS and
between LTO and PRS, which reflects the combined result of the RN and PCP groups. Gender
has no influence on the relationships in this part of the investigations.
Part C
Confronting people is difficult, especially coworkers, as it could lead to
misunderstandings, creating unneeded oppositions, disruption, and incivility in the workplace. A
recent study commissioned by the American Association of Critical-Care Nurses and Vital
Smart™ revealed that 53% of nurses are concerned about a peer’s competence, but only 12%
have spoken with this peer about their concerns. More importantly, 34% of nurses are concerned
about a physician’s incompetence, but less than one percent has spoken with the physician
(Maxfield, Grenny, McMillan, Patterson, & Switzier, 2005). Instead of confronting their
incompetent coworkers, they would double check their work such as retaking blood pressures.
Maxfield et al. (2005) also reported a story about how medical specialists avoid confronting a
peer.
A group of eight anesthesiologists agree a peer is dangerously incompetent, but they
don’t confront him. Instead, they go to great efforts to schedule surgeries for the sickest
babies at times when he is not on duty. This problem has persisted for over five years. (p.
2)

194
In this section, the research is investigating the similarities and differences in how the
three professions use silence at work. The investigation compares the means of four silence
constructs among the RNs, MLTs, and PCPs.
Knoll and van Dick (2013b) developed their instrument to measure organizational
climates of silence and later used it to study the relationship with employee authenticity (Knoll &
Van Dick, 2013a). Their subjects in both studies were university psychology online students with
mean age of 33 years old. The authors were only able to use the three most strongly loaded items
from each of the four silence constructs that did not show cross-loading. In this study, the items
retained in the CFA do not show any cross loading at the EFA level.
Results from this study are comparable to Knoll and van Dick’s (2013) report. On
average, the RN group has higher mean values than the MLT and PCP groups on QUS and PRS,
and the PCP group has higher mean values than the RN and MLT groups on OPS and ACS.
Knoll and van Dick’s (2013b) data show average means below the midpoint 4 in all of the
variables, while this study has QUS and PRS above 4 (Table 30).
Table 30
Comparisons of Means and Standard Deviations between the Current Study and Knoll and van
Dick’s Study (2013)
RN MLT PCP Knoll & van Dick
Mean SD Mean SD Mean SD Mean SD
QUS 4.53 1.79 4.06 1.89 4.28 1.89 3.30 1.90
PRS 4.34 1.62 4.16 1.69 4.10 1.73 3.74 1.86
OPS 2.31 1.54 2.17 1.49 2.58 1.80 2.12 1.42
ACS 3.57 1.97 3.12 1.95 4.03 2.00 3.48 1.99

195
Whether employees will remain silent when they observe workplace violations is
dependent on four factors as identified by Tangirala and Ramanujam (2008). First is the
workgroup identification where employees consider the cost and benefit to the workgroup before
deciding to give information to superiors. Second, professional commitment also comes into
consideration if they observe safety violations committed by their peers or other professions. In
the case of the incident at the Winnipeg Health Science Center where the incompetent pediatric
cardiac surgeon continued to conduct his surgery that caused the death of 12 children, the
multiple complaints of nurses to senior hospital administrators had fallen onto deaf ears. When
the head nurse pleaded to a senior physician to come into the operating room to observe how the
pediatric surgeon works, she got a retort that he did not take orders from a nurse. Not until the
team of anesthetists threatened to withdraw their service did the hospital establish a committee to
investigate the complaints (McIver, 2001). This suggests individuals like to protect their peers
and show professional solidarity until they are proven wrong. Third is the perception of
supervisory status, where individuals are likely to speak more when a person with a high-
perceived status is present. It gives the opportunity for an individual to make the boss aware of
their keen observation or ability at work. The last antecedent of employee silence is procedural
justice.
The silence questionnaire in this study only applied to peers and supervisors, so the third
antecedent does not apply in this study. In the case of the Winnipeg incident, the senior physician
may want to protect the image of his department as well as his profession, but for the head nurse,
it is the safety issue for which she could not tolerate the incompetency of the surgeon. MLTs and

196
RNs sometimes also shift blame among each other when samples were incorrectly labeled, or are
missing.
Part D
Although people from the same nationality are inclined to express similar values in POD
and UNA, there are still variations by profession. The descriptive statistics related to the three
professions show that the MLTs show stronger beliefs in UNA than PCPs by a significant
percentage. The MANOVA results also indicated that the MLTs appear to be the group that has
the highest average mean scores in POD, COM, and UNA.
As discussed in Part A and Part B, POD and UNA are the most problematic constructs of
the CVSCALE due to their nonnormality. Surprisingly, the MLEs’ report of the model fit
appeared not to be statistically significant, with the χ2(32, n = 378) = 44.04, p = .08 for the final
model with four UNA, three COM, and three POD items. COM struggles to pass the
discriminant and convergent validities, while POD shows a CR value < .70. The questionnaire
for both constructs should be revised and may need additional items in future research. However,
the developers of the CVSCALE have been using this set of instruments over the past decade,
and it has started to gain popularity in marketing research.
The tests for measurement invariance suggest that POD, UNA, and COM each have one
item that does not operate across groups. Rather than remove these items, I decided to keep them
as Byrne et al. (1989) and Steenkamp and Baumgartner (1998) suggest that it is not necessary to
compare groups with full measurement invariance, as long as the configural invariance is
identical across groups.
The MLT group shows the highest POD score, and this may reflect the history of the
profession which has been under the supervision of the medical profession. For example, in the

197
US, the certifying board for the MLTs is under the control of the American Society of Clinical
Pathologists (ASCP). To be able to work in the hospital laboratory, employees must have a MLS
(ASCP) registration. Without this qualification, it is unlikely that individuals will be able to work
as a technologist in the US hospital laboratories with the same pay scale and responsibility. In
Ontario, the registered practical nurses (known as registered nursing assistants in the past) have
to be registered with the College of Nurses of Ontario. And the laboratory assistants have to be
registered with the College of Medical Laboratory Technologists of Ontario (CMLTO).
The high UNA scores may also reflect the operation of diagnostic laboratories, where
abnormal laboratory results are repeated to ensure the integrity of personnel and
equipment performance. Abnormal blood films have to be reviewed by senior staff and/or
pathologists prior to notifying the physicians.
Limitations
There are several limitations of this study. First, although this study was able to obtain
378 participants, the convenience sample in the survey may not reflect the opinions of the
population.
Second, AMOS is software that uses maximum likelihood estimation which is dependent
on chi-square to compare the model fit. Chi-square is sensitive to sample size and normality. A
departure from normality, especially kurtosis can affect the results significantly. The question is
how much can it depart from normality before it can affect the results. Experts do not agree on
the issue, but I have addressed the issue with the bootstrapping technique to validate the
regression weight parameters.
Third, the distribution of respondents heavily leans toward Ontario, and although it has
the highest population in Canada, it provides 81% of the total participants. This may result from

198
the advertisement that was posted mainly in Ontario, even though the Canadian Society of
Laboratory Science had sent an e-letter to members across the country.
Fourth, four constructs in the survey have lower than the average variance extracted
recommendation value of .50, suggesting a difficulty with convergent validity. The
psychological safety construct was developed over a decade ago and has been intensively used
by many investigators in various fields of research. Yet the construct does not meet the AVE
cutoff point of .50. This is also true for opportunistic silence, which has a composite reliability
(CR) greater than the cutoff point of .70, but its average variance extracted (AVE) is bordering.
Power distance and competition are the two most problematic constructs as they yield marginal
values for both CR and AVE.
Fifth, the latent variable means of the individual value in Part D is based on the
nonnormality distribution, yet chi-square and other fit parameters appear no different from the
theoretical model. The MANOVA study in Part D is conducted with non-normally distributed
data, and with 11% outliers. I addressed this issue by using the bootstrapping technique for the
estimation.
Sixth, this study does not have a qualitative questionnaire that would allow participants
the opportunity to express their own opinions about their specific circumstances. Qualitative data
can provide a rich detail of people’s feelings and attitudes. When used in combination with
quantitative data, qualitative data can explain why particular responses were given.
Future Research
The intention of this research is to explore the relationship between individual cultural
values and employee silence among healthcare professions. Employee silence can lead to
adverse events in patient treatments as was reported by several examples in this dissertation. As

199
far as I am aware this is the first research that tries to link the two constructs and it still needs an
independent study to replicate the results. Researchers may need to revise the questionnaire with
additional items for the power distance and competition constructs.
According to Hofstede (2001), Canada is a country with lower uncertainty avoidance, in
the lowest quartile among 53 countries. The participants in this study have high scores in
uncertainty avoidance and this may be related to their professions. The healthcare professions are
trained to be confident and avoid uncertainty in their course of actions. Other researchers may try
to select participants from other professions such as teachers, business, engineers, police officers,
and military personnel. It would be interesting to see whether they can replicate the results from
this study.
The study used psychological safety as an intervening variable for the mediation effect on
the relationship between individual cultural values and employee silence. All five types of
mediators have been discovered at the pooled sample and at the profession level. At the
profession level, the study showed that medical laboratory technologists have direct-only
mediations, and registered nurses have direct-only and complementary patterns. At the pooled
level, there exists a competitive mediation. All three types of mediation indicate a missing
second mediator that future research should try to uncover (Zhao et al., 2010). Two potential
candidates for the missing mediator could be the two voice antecedents: felt obligation and
organization-based self-esteem. The question about felt obligation is who the target is. Do
employees feel an obligation to patients, a team, a profession, or an employer?
There are studies that used pooled samples of participants from various professions in the
study of individual cultural values (Rhee et al., 2014; Yoon, 2012). As this study shows,
combining subjects from various occupations into a pooled sample, even from the same industry,

200
does not yield the same results as analyzing data at the profession level. Generalizing the
relationship between the individual cultural values and employee silence based on the pooled
sample could lead to misleading results.
Van Dyne et al. (2003) conceptualize three types of voice in parallel to silence:
acquiescent, defensive, and prosocial voice. No one has yet studied how these three types of
voice are related to individual cultural values, except MacNab (2004) who reports that
individuals with high uncertainty avoidance scores are more likely to report peer misconducts,
and high power distance individuals are less likely to engage in internal reporting.
This study found that union membership has a positive relationship with acquiescent and
quiescent silence, which seems to contradict common beliefs that a union gives voice to the
members. But voice is not the opposite of silence and employees can voice their concerns while
staying silent. As Van Dyne et al. (2003) assert, “withholding important information is not
simply the absence of voice” (p. 1359). The research question can be whether becoming a union
member makes employees exercise the three types of voice, and whether felt obligation and
organization-based self-esteem play any mediating role between individual cultural values and
employee voice in the unionized organizations.
The results from Part A of this study indicate a strong correlation between acquiescent
silence and quiescent silence. This seems to confirm Pinder and Harlos’s (2001) research that
individuals can move back and forth between these two types of silence. However, their proposal
came from a qualitative study that should be confirmed with quantitative analysis. It is
interesting to study this relationship with nonrecursive causal models.

201
The above suggestions only apply to structural equation modeling. Certainly there are
other possibilities with other types of statistical analyses such as partial least square and
hierarchical linear models.
Although participants in the research come from the healthcare sector, results from this
study may be applicable to other sectors of industry as well. Canada is a multicultural country
that welcomes people from all over the world. Each individual brings his or her beliefs and
values that are different and even opposing to one another. Understanding peoples’ values and
beliefs will help managers and leaders harmonize the relationships among employees from
various backgrounds. This could improve employee satisfaction, raise awareness of safety issues,
and increase productivity and organizational commitment.
Management Implications
There are policy implications arising from the results of this research. Nurses, medical
laboratory technologists, and primary care paramedics have different perceptions in relation to
individual cultural values and silence. Hospital leaders need to be aware that fear of punishment,
reprisal and embarrassment can prevent employees from reporting errors. Hospital leaders can
overcome employees’ fears through management policies that embed psychological safety as a
routine practice. This should make organization more conducive to error reporting since
employees may feel less threatened from embarrassment and retaliation. Hospitals can
emphasize these policies to all healthcare professions during employee orientation processes, and
provide leadership that legitimizes employees’ concerns to encourage voice.

202
References
"Transforming different". (2010). Tranforming different Likert scales to a common scale. Retrieved from http://www-01.ibm.com/support/docview.wss?uid=swg21482329
Abraha, D. (2002). Leadership vacuum and its destructive impact on the culltural dimension of nation building: The illustration of the so called " People's Front and Justice (PFDJ)" cenral office in Eritrea. Journal of Management Policy and Practice, 13(1), 91 - 106.
Ailon, G. (2008). Mirror, mirror on the wall: culture's consequences in a value test of its own design. Academy of Management Review, 33(4), 885 - 904.
Akar, N. Y., Anafarta, N., & Sarvan, F. (2011). Causes, dimensions and organizational consequences of mobbing: An empirical study. Ege Academic Review, 11(1), 1467 - 1479.
Akkermans, D., Harzing, A., & van Witteloostuijn, A. (2009). Cultural accommodation and language priming: Competitive versus cooperative behavior in a prisoner's dilemma game. Retrieved from http://www.harzing.com/download/pdg.pdf
Al-Nasser, M., Yusoff, R. Z., Islam, R., & AlNasser, A. (2014). Effects of consumers' trust and attitude toward online shopping. American Journal of Economics and Business Administration, 6(2), 58 - 71.
Alberta Union of Provincial Employees. (2010). Collective agreement between Alberta Health Services and Alberta Union of Provincial Employees. Retrieved from www.aupe.org/documents/6ACW6/
Anderson, B. O. (2012). Pedagogy and Japanese culture in a distance learning environment (Doctoral dissertation). Available from Proquest Dissertations and Theses database. (UMI No. 3509802)
Anderson, M. L., & Taylor, H. F. (2011). Sociology: The essentials. Brlmont, CA: Wadsworth.
Anderson, N. L. (2013). Avoidance and intolerance of uncertainty: Precipitants of ruminantion and depression (Doctoral dissertation). Available from Proquest Dissertation and Theses database. (UMI No. 3618936)
Anonymous. (2005). Nurses seek protection for whistleblowers; Union say many nurses are afraid to speak out. Telegraph-Herald, p. E. 13.
Anonymous. (2006). Nurses seek protection for whistleblowers. BreakinNews.ie. Retrieved from http://www.breakingnews.ie/ireland/nurses-seek-protection-for-whistleblowers-247762.html
Anonymous. (2014). Twenty 14 Niagara Region Budget Summary. Retrieved from Niagara Region: https://www.niagararegion.ca/government/budget/pdf/2014%20Budget%20Summary.pdf
Antoine, G. (2015). A cross-cultural study on consumers' sentiments of the marketing mix variables and consumers' perceptions toward marketing ethics (Doctoral dissertation). Available from. Available from Proquest Dissertation and Theses database. (UMI No. 3582120)

203
Arbuckle, J. L. (2011). IBM SPSS Amos 20 user's guide. Armonk, NY: IBM Corporation.
Argyris, C. (2008). On organizational learning. Malden, MA: Blackwell Publishing.
Ashford, S. J., Sutcliffe, K. M., & Christianson, M. K. (2009). Speaking up and speaking out: The leadership dynamics of voice in organizations. In J. Greenberg & M. S. Edwards (Eds.), Voice and silence in organizations (pp. 175 - 201). Bingley, UK: Emerald Group Publishing Limited.
Au, K. Y. (2000). Intra-cultural variation as another construct of international management: A study based on secondary data of 42 countries. Journal of International Management, 6(3), 217 - 238.
Baer, M., & Frese, M. (2003). Innovation is not enough: Climate for initiative and psychological safety, process innovations, and firm performance. Journal of Organizational Behavior, 24(1), 45 - 68.
Baird, I. S., Lyles, M. A., & Wharton, R. (1990). Attitude differences between American and Chinese managers regarding joint venture management. Management International Review, 30, 53 - 68.
Baker, D. S., & Carson, K. D. (2011). The two faces of uncertainty avoidance: Attachment and adaptation. Journal of Behavior and Applied Management, 12(2), 128 - 141.
Baker, G. R., Norton, P. G., Flintoft, V., Blais, R., Brown, A., Cox, J., . . . Tamblyn, R. (2004). The Canadian adverse events study: The incidence of adverse events among hospital patients in Canada. Canadian Medical Association Journal, 170(11), 1678 -1686.
Ballatine, J. H., & Roberts, K. A. (2012). Our social world: Introduction to sociology (Third ed.). Thousand Oaks, CA: Sage Publications.
Barron, R. M., & Kenny, D. A. (1986). The moderator-mediator variable distinction in social psychological research: Conceptual, strategic, and statistical considerations. Journal of personality and Social Psychology, 51(6), 1173 - 1182.
Bartkey, S. L. (1990). Femininity and Domination: Studies in the phenology of oppression. New York, NY: Routledge.
Bass, B. M. (1997). Does the transformation-transactional leadership paradigm transcend organizational and national boundaries? American Psychologist, 52(2), 130-139.
Bass, B. M. (1999). Two decades of research and development in transformational leadership. European Journal of Work and Organizational Psychology, 8(1), 9-32.
Batson, C. D., Ahmad, N., & Lishner, D. A. (2012). Empathy and altruism. In S. J. Lopez & C. R. Snyder (Eds.), The Oxford handbook of positive psychology [electronic source] (Second ed.). New York, NY: Oxford University Press, Inc. doi:10.1093/oxfordhb/9780195187243.013.0039
Baumeister, R. F., Bratslavsky, E., Maraven, M., & Tice, D. M. (1998). Ego depletion: is the active self a limited resource? Journal of personality and Social Psychology, 74(5), 1252 - 1265.
Beals, G. (1999). The biography of Thomas Edison. Retrieved from http://www.thomasedison.com/biography.html

204
Beehr, T., & Gupta, N. (1978). A note on the structure of employee withdrawal. organizational Behavior and Human Performance, 21, 73 - 79.
Bender, K. A., & Sloane, P. J. (1999). Trade union membership, tenure and the level of job security. Applied Economics, 31, 123 - 135.
Bennett, R. H. (1999). The relative effects of situational practices and culturally influenced values/beliefs on work attitudes. International Journal of Commerce and Management, 9(1/2), 84 - 102.
Bentham, K. (1999). The determinants and impacts of employer resistance to union certification (Doctoral dissertation). Available from Proquest Dissertation and Theses database. (UMI No. 304567306)
Bergin, C. (2007). Remembering the mistakes of Challenger. Retrieved from http://www.nasaspaceflight.com/2007/01/remembering-the-mistakes-of-challenger/
Bies, R. J. (2009). Sounds of silence: Identifying new motives and behaviors. In J. Greenberg & M. S. Edwards (Eds.), Voice and silence in organizations (pp. 157 - 171). Bingley, UK: Emerald Group Publishing Limited.
Bigham, B. L., Bull, E., Morrison, M., Burgess, R., Maher, J., Brooks, S., & Morrison, L. J. (2011). Patient safety in emergency medical services: Executive summary and recommendations from the Niagara summit. Canadian Journal of Emergency Medicine, 13(1), 13 - 18.
Bing, J. W. (2004). Hofstede's consequences: The impact of his work on sonsulting and business practices. Academy of Management Executive, 18(1), 80-87.
Blase, J., & Blase, J. (2002). The dark side of leadership: Teacher perspectives of principal mistreatment. Educational Administration Quarterly, 38(5), 671 - 727.
Blase, J., Blase, J., & Du, F. (2008). The mistreated teacher: A national study. Journal of Educational Administration, 46(3), 263 - 301.
Bobko, P. (2001). Correlation and regression: Applications for industrial organizational psychology and management. Thousand Oaks, CA: Sage Publications, Inc.
Bochner, S., & Hesketh, B. (1994). Power distance, individualism/collectivism, and job related attitudes in a culturally diverse work group. Journal of Cross-Cultural Psychology, 25(2), 233 - 257.
Bodla, M. A., Afza, T., & Danish, R. Q. (2014). Relationship between organizational politics perceptions and employees' performance; mediatiing role of social exchnage perceptions. Pakistann Journal of Commerce and Social Sciences, 8(2), 426 - 444.
Boeree, C. G. (2007). Culture "personalities". Retrieved from http://webspace.ship.edu/cgboer/culturepersonalities.html
Bond, M. H. (1988). Finding universal dimensions of individual variation in multicultural studies of values: The Rokeach and Chinese value surveys. Journal of personality and Social Psychology, 55(6), 1009 - 1015.

205
Boyd, R., & Richerson, P. J. (2005). The evolution of ethnic markers. In R. Boyd & P. J. Richerson (Eds.), The origin and eveolution of cultures (pp. 103 - 117). New York, NY: Oxford University Press.
Brewer, P., & Venaik, S. (2012). On the misuse of national culture dimensions. International Marketing Review, 29(6), 2012.
Brinsfield, C. T. (2009). Employee silence: Investigation of dimensionality, development of measures, and examination of related factors. Available from Dissertation Abstract International: Section A: Humanities and Social Sciences, 70(9), 3529.
Brinsfield, C. T. (2013). Employee silence motives: Investigation of dimensionality and development of measures. Journal of Organizational Behavior, 34, 671 - 697.
Brinsfield, C. T., Edwards, M. S., & Greenberg, J. (2009). Voice and silence in organizations: Historical review and current conceptualization. In J. Greenberg & M. S. Edwards (Eds.), Voice and silence in organizations (pp. One). Bingley, UK: Emerald Group Publishing Limited.
Brown, E. L. (1961). Newer dimensions of patient care, Part 1. New York, NY: Russel Sage Foundation.
Brueller, D., & Carmelli, A. (2011). Linking capacities of high-quality relationships to team learning and performance in service organizations. Human Resource Management, 50(4), 455-477.
Bryant, N. L. (1992). Expereinces of women counselors. (Doctoral dissertation). Available from from Proquest Dissertations and Theses database. (UMI No. 9307171)
Bucic, T., Robinson, L., & Ramburuth, P. (2010). Effects of leadership style on team learning. Journal of Workplace Learning, 22(4), 228-248.
Builtjens, R. P. M., & Noordehaven, N. G. (1996). The influence of national culture on strategic decision making: A case study of the Philippines. Retrieved from Netherlands: http://www.researchgate.net/publication/4763643_The_influence_of_national_culture_on_strategic_decision_making__A_case_study_of_the_Philippines/links/02bfe50dda5a67d5ad000000.
Butler, M. M. (2004). Communication apprehension and its impact on individuals in the workplace. (Doctoral dissertation). Avaliable from Proquest Dissertation and Theses database. (UMI No. 3147526)
Byrne, B. M. (2006). Structural equation modeling with EQS: Basic concepts, applications, and programming. Mahwah, NJ: Lawrence Erlbaum Associates, Publishers.
Byrne, B. M. (2010). Structural equation modeling with AMOS. New York, NY: Routledeg.
Byrne, B. M., Shavelson, R. J., & Muthens, B. (1989). Testing for the equivalence of factor covariance and mean structures: The issue of partial measurement invariance. Psychological Bulletin, 105(3), 456 - 466.
Campbell, D. T., & Fiske, D. W. (1959). Convergent and discriminant validation by the multitrait-multimethod matrix. Psychology Bulletin, 56(2), 81 - 105.

206
Canada Safety Council. (2000). Bullying in the workplace. Retrieved from www.canadasafetycouncil.org/workplace-safety/bullying-workplace
Canadian Institute for Health Information. (2015). Supply of nurses in Canada declines for the first time in 2 decades. Retrieved from https://www.cihi.ca/en/spending-and-health-workforce/health-workforce/supply-of-nurses-in-canada-declines-for-first-time-in
Canadian Institute of Health Information. (2010). Medical laboratory technologists and their work environment. Retrieved from Ottawa:
Canadian Institute of Health Research. (2012). Canadian bullying statistics. Retrieved from http://www.cihr-irsc.gc.ca/e/45838.html
Canadian Nurses Association. (2010). Workforce profile of registered nurses in Canada. Retrieved from Ottawa:
Carl, D., Gupta, V., & Javidan, M. (2004). Power Distance. In R. House, P. J. Hanges, M. Javidan, P. W. Dorfman, & N. Gupta (Eds.), Culture, leadership, and organizations: The GLOBE study of 62 societies. Thousand Oakes, CA: Sage Publications.
Carmeli, A., Bruller, D., & Dutton, J. E. (2009). Learning behaviours in the workplace: The role of high-quality interpersonal relationships and psychological safety. Systems Research and Behavioral Science, 26, 81-98. doi:10.1002/sres.932
Carmeli, A., & Gittel, J. H. (2009). High-quality relationship, psychological safety, and learning from failures in work organization. Journal of Organizational Behavior, 30, 709-729. doi:10.1002/job.565
Carson, K. D., Baker, D. S., & Lanier, P. A. (2014). The role of individual cultural traits and proactivity in an organizational setting. Management Research Review, 37(4), 348 - 366.
Chan, H., Lee, S., Li, R., & Raymond, D. (2014). Cultural effects on choice of occupation and university/college major. Retrieved from seanlyons.ca/wp-content/uploads/2012/01/Chan-et-al-2014.pdf
Chang, S., van Witteloostuijin, A., & Eden, A. (2010). From the Editors: Common method variance in international business research. Journal of International Business Studies, 41(2), 174 - 184.
Chelariu, C., Brashear, T. G., Osmonbekov, T., & Zait, A. (2008). Entrepreneurial propensity in a transition economy: Exploring micro-level and meso-level cultural antecedents. Journal of Business and Industrial Marketing, 23(6), 405 - 415.
Chen, C. C., Peng, M. W., & Saparito, P. A. (2002). Individualism, collectivism, and opportunism: A cultural perspective on transaction cost economics. Journal of Management, 28(4), 567 - 583.
Cheung, G. W. (2008). Testing mediation and suppression effects of latent variables. Organization Research Methods, 11(2), 296 - 325.
207
Cheung, G. W., & Rensvold, R. B. (1998). Cross-cultural comparisons using non-invariant measurement items. Applied Behavioral Science Review, 6(1), 93 - 110.
Cheung, G. W., & Rensvold, R. B. (2002). Evaluating goodness-of-fit indexes for testing measurement invariance. Structural Equation Modeling, 9(2), 233 - 255.
Chiaburn, D. S., Farh, C., & Van Dyne, L. (2013). Supervisory epistemic, ideological, and existential responses to voice: A motivated cognition approah. In C. S. Burke & C. L. Cooper CBE (Eds.), Voice and whistleblowing in organizations: Overcoming fear, fostering courage and unleashing candour (pp. 224 - 253). Glos, UK: Edward Elgar Publishing Limited.
Chiang, H. (2005). Nurses' demographics and perceptions of safety climate, work environment, and barriers to medication administration error reporting in Southern Taiwan. (Doctor of Philosophy), University of Utah, Salt lake City, UT.
Chinese Culture Connection. (1987). Chinese values and the search for culture-free dimensions of culture. Journal of Cross-Cultural Psychology, 18(2), 143 - 164.
Cohen, B. H. (1996). Explaining psychological statistics. Pacific Grove, CA: Brooks/Cole Publishing Company.
Colquitt, J. A., Greenberg, J., & Zapata-Phelan, C. P. (2005). What is organizational justice? A historical overview. In J. Greenberg & J. Colquitt (Eds.), Handbook of Organizational Justice (pp. 3 - 56). Mahwah, NJ: Lawrence Erlbaum Associates.
Conlee, M. C., & Tesser, A. (1973). The effect of recipient desire to hear on news transmission. Sociometry, 36(4), 588 - 599.
Crane, M. (2011). Wrong site surgery occurs 40 times a week. Retrieved from www.medscape.com/viewarticle/745581_print
Creswell, J. W. (2012). Educational Research: Planning, conducting, and evaluating quantitative and qualitative research (Fourth ed.). Boston , MA: Pearson.
D'Amour, D., Dubois, C., Tchouaket, E., Clarke, S., & Blais, R. (2014). The occurrence of adverse events potentially attibutable to nursing care in medical units: Cross sectional record review. International Journal of Nursing Studies, 51(6), 882 - 891.
Daft, R. L. (2007). Innovation and change. In R. L. Daft (Ed.), Organizational theory and design (Ninth ed., pp. 398-440). Mason,OH: Thompson South-Western.
de Guzman, A. B. (2015). A structural equation modelling on the factors affecting intolerance of uncertainty and worry among a select group of Filipino elderly. Educational Gerontology, 41, 106 - 119.
de Leon, M. C. D., & Finkelstein, M. A. (2011). Individualism/collectivism and organizatonal citizenship behavior. Psicothema, 23(3), 401 - 406.

208
Dessler, G., Chhinzer, N., & Cole, N. D. (2014). Human resources managment in Canada. Toronto: Pearson.
Dollar, D., Fisman, R., & Gatti, R. (2001). Are women really the "fairer" sex? Corruption and women in government. Journal of Economic Behavior and Organization, 46, 423 - 429.
Donaghey, J., Cullinane, N., Dundon, T., & Wilkinson, A. (2011). Reconceptualising employee silence: Problems and prognosis. Work, Employment and Society, 25(1), 51 - 67.
Dorfman, P. W., & Howell, J. P. (1988). Dimensions of national culture and effective leadership patterns: Hofstede revisited. In R. N. Farmer & E. G. McGoun (Eds.), Advances in International Comparative Management (Vol. 3, pp. 127 - 150). Greenwich, CT: JAI Press Inc.
Edmondson, A. C. (1999). Psychological safety and learning behavior in work teams. Administrative Science Quarterly, 44(2), 350-383.
Edmondson, A. C. (2004a). Learning from mistakes is easier said than done: Group and organizational influences on the detection and correction of human error. The Journal of Applied behavior Science, 40(1), 66-90.
Edmondson, A. C. (2004b). Psychological safety, trust, and learning in organizations: A group-level lens. In R. M. Kramer & K. S. Cook (Eds.), Trust and distrust in organizations (pp. 239-272). New York, NY: Russel Sage Foundation.
Edmondson, A. C., Bohmer, R. M., & Pisano, G. P. (2001). Disruptive routines: Team learning and new technology implementation in hospitals. Administrative Science Quarterly, 46, 685-716.
Edwards, J. R., & Bagozzi, R. P. (2000). On the nature and direction of relationships between constructs and measures Psychological methods, 5(2), 155 - 174.
Edwards, M. S., Ashkanasy, N. M., & Gardner, J. (2009). Deciding to speak up or to remain silent following observed wrongdoing: The role of discrete emotions and climate of silence. In J. Greenberg & M. S. Edwards (Eds.), Voice and silence in organizations (pp. 83 - 109). Bingley, UK: Emerald Group Publishing Limited.
Efron, B., & Tibshirani, R. J. (1993). An introduction to the bootstrap. New York, NY: Chapman and Hall.
Eggers, J. T. (2011). Pstchological safety influences relationship behavior. Correction Todays, 73(1), 60 - 61.
Einarsen, S. (2000). Harassment and bullying at work: A review of the Scandinavian approach. Aggression and Violent Behavior, 5(4), 379 - 401.
Employment and Social Development Canada. (2016). Work-Unionization rates. Retrieved from http://well-being.esdc.gc.ca/misme-iowb/[email protected]?iid=17
Endrass, B., Rehm, M., Andre, E., & Nakano, Y. I. (2008). Talk is silver, silence is golden: A cross cultural study on the usage of pauses in speech. Paper presented at the 13th International Conference on Intelligence User Interfaces, Canary Island, Spain.
209
Evans, A., & Chun, E. B. (2007). The theoretical framework: psychological oppression and diversity. ASHE Higher Education Report, 33(1), 1 - 139.
Fang, T. (2003). A Critique of Hofstede's fifth national culture dimension. International Journal of Cross Cultural Management, 3(3), 347 - 368.
Farjoun, M., & Starbuck, W. H. (2005). Introduction: Organizational aspects of Columbia disaster. In W. H. Starbuck & M. Farjoun (Eds.), Organization at the limit: Lesson for the Columbia disaster. Malden, MA: Blackwell Publishing Ltd.
Faul, F., Erdfelder, E., Lang, A., & Buchner, A. (2007). G*Power 3: A flexible statistical power analysis program for social, behavioral, and biomedical sciences. Behavioral Research Methods, 39(2), 175 - 191.
Fischer, R., & Poortinga, Y. H. (2012). Are cultural values the same as the values of individuals? An examination of similarities in personal, social and cultural value structures. International Journal of Cross Cultural Management, 12(2), 157 - 170.
Fischer, R., & Schwartz, S. H. (2011). Whence differences in value priorities? individual, cultural, or artifactual sources. Journal of Cross-Cultural Psychology, 42(7), 1127 -1144.
Fischer, R., Vauclair, C. M., Fontaine, J. R. J., & Schwartz, S. H. (2010). Are individual-level value structures different? Testing Hofstede's legacy with Schwartz's legacy with Schwartz Value Survey. Journal of Cross-Cultural Psychology, 41(2), 135 - 151.
FitzPatrick, M., Davey, J., & Dai, J. (2002). Chinese students' complaining behavior: Hearing the silence. Asia Pacific Journal of Marketing and Logistics, 24(5), 738 - 754.
Fleras, A. (2010). Unequal relations (Sixth ed.). Toronto: Pearson Canada.
Fonne, V. M., & Myhre, G. (1996). The effect of occupational cultures on coordination of emergency medical service aircrew. Aviation, Space, and Environmental Medicine, 67(6), 525 - 529.
Fornell, C., & Larcker, D. F. (1981). Evaluating structural equation models with unobserved variables and measurement error. Journal of Marketing Research, 18(1), 39 -50.
Frazier, M. L. (2013). Voice climate in organizations: Creating a context for speaking up at work. In R. J. Burke & C. L. Cooper CBE (Eds.), Voice and whistleblowing in organizations. Cheltenham, UK: Edward Elgar Publishing Inc.
Furnham, A. (2006). Management mumbo-jumbo: A skeptics' dictionary. New York, NY: Palgrave Macmillan.
Garon, M. (2011). Speaking up, being heard: Registered nurses' perceptions of workplace communication. Journal of Nursing Management, 20, 361 - 371.
Gaskin, J. (2015). Validity and Reliability: Testing validity and reliability in a CFA Retrieved from http://statwiki.kolobkreations.com/wiki/Confirmatory_Factor_Analysis

210
Geletkanycz, M. A. (1997). The salience of 'culutre's consequences': The effects of cultural values on top executive commitment to the status quo. Strategic Management Journal, 18(8), 615 - 634.
Gelfand, M., Bhawuk, D. P. S., Nishi, L. H., & Bechtold. (2004). Individualism and collectivism. In R. House, P. J. Hanges, M. Javidan, P. W. Dorfman, & N. Gupta (Eds.), Culture, leadership, and organizations: The GLOBE study of 62 societies (pp. 437 -512). Thousand Oakes, CA: Sage Publications.
George, D., & Mallery, P. (2007). Descriptive statistics. In D. George & P. Mallery (Eds.), SPSS for Windows step by step: A simple guide and reference 14.0 update (Seventh ed., pp. 95 - 104). Boston, MA: Pearson Education, Inc.
Ghosh, R., Shuck, B., & Petrosko, J. (2012). Emotional intelligence and organizational learning in work teams. Journal of Management Development, 31(6), 603-619.
Glavin, R. (2010). Drug errors: Consequences, mechanisms, and avoidance. British Journal of Anaesthesia, 105(1), 76-82.
Government of Canada. (2015). Ambulance attendants and other paramedical occupations. Retrieved from http://www.servicecanada.gc.ca/eng/qc/job_futures/statistics/3234.shtml
Greenberg, J., & Edwards, M. S. (2009). Preface. In J. Greenberg & M. S. Edwards (Eds.), Voice and silence in organizations (pp. 275 - 291). Bingley, UK: Emerald Group Publishing Limited.
Gu, X., & Itoh, K. (2011). A pilot study on safety climate in Chinese hospital. Journal of Patient Safety, 7(4), 204 - 212.
Gu, Y. (1990). Politeness phenomena in modern Chinese. Journal of Pragmatics, 14(2), 237 - 257.
Guffey, P. (2009). No-fault reporting: Exposes potential harm before it happens Anesthesia News (Vol. 7.2). San Franscisco, CA: Unversity of California.
Hair, J. F., Black, W. C., Babin, B. J., & Anderson, R. E. (Eds.). (2010). Multivariate data analysis. Upper Saddle River, NJ: Pearson Prentice Hall.
Handcock, G. R., & Liu, M. (2012). Bootstrapping standard errors and data - model fit statistics in structural equation modeling. In R. H. Hoyle (Ed.), Handbook of structural equation modeling (pp. 296 - 324). New York, NY: The Guildford Press.
Hannan, D. (2013). Reaching information society targets: Do national culture attitudes about ICT acceptance and use matter? (Doctor of Philosophy), Capella University. (3601960)
Harris, M. (1993). Culture, people, nature: An introduction to general anthropology. New York, NY: Harper Collins College Publishers.
Harvey, P., Martinko, M. J., & Douglas, S. C. (2009). Causal perceptions and the decision to speak up or pipe down. In J. Greenberg & M. S. Edwards (Eds.), Voice and silence in organizations (pp. 63 - 82). Bingley, UK: Emerald Group Publishing Limited.

211
Helmreich, R. L. (2009). Anatomy of a system accident: The crash of Avianca flight 052. The International Journal of Aviation Psychology, 4(3), 265-284.
Henriksen, K., & Dayton, E. (2006). Organizational silence and hidden threats to patient safety. Health Services Research, 41(August), 1539 - 1554.
Hermida, R., Luchman, J. N., VNicolaides, V., & Wilcox, C. (2015). The issue of statistical power for overall model fit in evaluating structural equation models. Computation Methods in Social Sciences, 3(1), 29 - 42.
Hirak, R., Peng, A. C., Carmelli, A., & Schaubroeck, J. M. (2012). Linking leader inclusiveness to work unit performance: The importance of psychological safety and learning from failure. The Leadership Quarterly, 23, 107-117.
Hodge, V. J., & Austin, J. (2004). A survey of outlier detection methodologies. Artificial Intelligent Review, 22, 85 - 126.
Hofstede, G. (1984). Cultures' consequences: International differences in work-related values. Newbury Park, CA: Sage Publications, Inc.
Hofstede, G. (2001). Cultures' consequences: Comparing values. behaviors, institutions, and organizations across nations. Thousand Oaks, CA: Sage Publications, Inc.
Hofstede, G., Hofstede, G. J., & Minkov, M. (2010). Cultures and organizations: Software of the mind. New York, NY: McGraw Hill.
House, R. J., & Javidan, M. (2004). Overview of GLOBE. In R. J. House, P. J. Hanges, M. Javidan, P. W. Dorfman, & V. Gupta (Eds.), Culture, Leadership, and Organizations. Thousand Oaks, CA: Sage Publications.
Huang, H. (1997). Testing the spiral of silence theory: From cross-cultural perspective. (Doctor of Philosophy), University of Wisconsin, Madison, WI. (9711804)
Huang, H. (2003). A cross-cultural test of the spiral of silence. International Journal of Public Opinion Research, 17(3), 324 - 345.
Huang, X., van de Vliert, E., & van der Vegt, G. (2005). Breaking the silence culture: Stimulation of participation and employee opinion withholding cross-nationally. Management and Organization Review, 1(3), 459 - 482.
Hubert, M., & Vandervieren, E. (2008). An adjusted boxplot for skewed distributions. Computational Statistics and data analysis, 52, 5186 - 5201.
Ilmakunnas, P., & Ilmakunnas, S. (2009). Diversity at the work place: Whom does it benefit? Paper presented at the Programme EALE conference, Talinn, Estonia.
Inglehart, R. (1997). Modernization, economic, and political change in 43 societies. Princeton, NJ: Princeton University Press.
212
Inglehart, R. (2012). Values change the world: World Values Survey. Retrieved from http://www.iffs.se/wp-content/uploads/2012/12/WVS-brochure-web.pdf
Inglehart, R., & Weizel, C. (2005). Modernization, cultural change, and democracy. New York, NY: Cambridge University Press.
Innstrand, S. T., Langballe, E. M., Falkum, E., & Assland, O. G. (2011). Exploring within- and between-gender differences in burnout: 8 different occupational groups. Intenational Archives of Occupational Health, 84, 813 - 824.
Jackson, B. S. (1982). A correlational analysis of the relationship between the attitude of trust within a communication climate and attitudes toward union among white-collar workers. (Doctoral dissertation). Available from Proquest Dissertations and Thesese database. (UMI No. 820913)
Jaeger, R. M. (1993). Some fundamental of measurements. In R. M. Jaeger (Ed.), Statistics: A spectator sport. London, UK: Sage Publications.
Jagerer, P., & Gandarilla, G. (2011). Current educational and cultural challenges in construction. Professional Safety, 56(9), 17.
Javidan, M., House, R. J., Dorfman, P. W., Hanges, P. J., & de Luque, M. S. (2006). Conceptualizing and measuring cultures and their consequences: A comparative review of GLOBE's and Hofstede's approaches. Journal of International Business Studies, 37(897 - 914).
Jones, S. (2011). Speech is silver, silence is golden: The cultural importance of silence in Japan. ANU Undergraduate Research Journal, 3, 17 - 27.
Jose, P. (2013). Doing statistical mediation and moderation. New York, NY: The Guilford Press.
Kahn, W. (1990). Psychological conditions of personal engagement and disengagement at work. Academy of management Journal, 33(4), 692-724.
Kalra, J., Kalra, N., & Baniak, N. (2013). Medical error, disclosure and patient safety: A gloabl view of quality care. Clinical Biochemistry, 46, 1161 - 1169.
Kapoor, S., Hughes, P. C., Baldwin, J. R., & Blue, J. (2003). The relationship of individualism-collectivism and self-construals to communication styles in India and the United States. International journal of Intercultural Relations, 27, 638 - 700.
Khan, A. K., Quratulain, S., & Crawshaw, J. R. (2013). The mediating role of discrete emotions in the relationship between injustice and counterproductive work behaviors: A study in Pakistan. Journal of Business Psychology, 28, 49 - 61. doi:10. 1007/s10869-012-9269-2
Kim, D. (1993). The link between individual and organizational learning. Sloan Managment Review, 35(1), 37 - 50.
King, G. (2001). Perceptions of intentional wrongdoing and peer reporting behavior among nurses. Journal of Business Ethics, 34(1), 1 - 13.

213
King, J. B., Driver, E. T., McAdams, F. H., & Hogue, P. A. (1979). Aircraft accident report: United Airlines, Inc. McDonnell-Douglas, DC-8-61. Retrieved from Washington, DC:
Kish-Gephart, J. J., & Breaux-Soignet, D. M. (2013). Fear and silence in the workplace. In R. J. Burke & c. L. C. CBE (Eds.), Voice and whistleblowing in organizations (pp. 92 - 110). Glos, UK: Edward Elgar Publishing Limited.
Kish-Gephart, J. J., Detert, J. R., Trevino, L. K., & Edmondson, A. C. (2009). Silenced by fear: The nature, sources and consequence of fear at work. Research in Organizational Behavior, 29, 163-193.
Kleinbaum, D., Kupper, L. L., Muller, K. E., & Nizam, A. (1988). Applied regression analysis and other multivariate methods (Third ed.). Pacific Grove, CA: Duxbury Press.
Kline, R. B. (1998). Principles and practice of structural equation modeling. New York, NY: The Guildford Press.
Kline, R. B. (2012). Assumptions in structural equation modeling. In R. H. Hoyle (Ed.), Handbook of structural equation modeling (pp. 111 - 125). New York, NY: The Guilford press.
Knoll, M., & Van Dick, R. (2013a). Authenticity, employee silence, prohibitive voice, and the moderating effect of organizational identification. Journal of Positive Psychology, 8(4), 346 - 360.
Knoll, M., & van Dick, R. (2013b). Do I hear the whistle...? A first attempt to measure four forms of employee silence and their correlates. Journal of Business Ethics, 113, 349 - 362. doi:10.1007/s10551-012-1308-4
Koehn, S., Pearce, A. J., & Morris, T. (2013). The integrated model of sport confidence: A canonical correlation and mediational analysis. Journal of Sport & Exercise Psychology, 35(6), 644 - 654.
Kohn, L., Corrigan, J., & Donaldson, M. (2000). To err is human: Buliding a safer health system. Retrieved from Washington D.C.: www.nap.edu/catalog/9728.html
Kopald, S. W. (2012). Manager openness to improvement-oriented employee voice: A study searching for keys to unlock the manager's door. (Doctoral dissertation). Available from Proquest Dissertation and Theses database. (UMI No. 3524089)
Kostiuk, D. D. (2012). Silence: The reasons why people may not communicate. Available from Dissertation Abstract International: Section A. Humanity and Services 74(2).
Kwok, S., & Uncles, M. (2005). Sales promotion effectiveness: The impact of consumer differences at an ethnic-group level. The Journal of Product and Brand Management, 14(2/3), 170 - 186.
Lancia, N. (2005). The color of oppression: race and discourse. The georgetown Philosophical Review, 2(1), 59 -66.
Leary, M. R., Kowalski, R. M., Smith, L., & Phillips, S. (2003). Teasing, rejection, and violence: case studies of the school shootings. Aggressive Behavior, 29, 202 - 214.

214
Lee, D. (2013). Beliefs on "avoidant cultures" in the French multinational corporations. Cross Cultural Management, 20(1), 20 - 38.
Lee, J. Y., Swink, M., & Pandejpong, T. (2011). The roles of worker expertise, information sharing quality, and psychological safety in manufacturing process innovation: An intellectual capital perspective. Production and Operation Management, 20(4), 556 - 570.
Leger, C., Politis, D., & Romano, J. P. (1992). Bootstrap technology and application. Technometrics, 34(4), 378 - 398.
Lei, P., & Wu, Q. (2012). Estimation in structural equation modeling. In R. H. Hoyle (Ed.), Handbook of structural equation modeling (pp. 164 - 179). New York, NY: The Guilford press.
Levinson, D. R. (2012). Hospital incident reporting systems do not capture most patient harm. Retrieved from Washington, DC: http://oig.hhs.gov/oei/reports/oei-06-09-00091.asp
Leymann, H. (1990). Mobbing and psychological terror at work. Violence and Victims, 5(2), 119 - 126.
Liang, J. (2014). Ethical leadership and employee voice: Examining a moderated-mediation model. Acta Psychologica Sinica, 46(2), 252 - 264.
Liang, J., Farh, C., & Farh, J. (2012). Psychological antecedents of promotive and prohibitive voice: A two-wave examination. Academy of management Journal, 55(1), 71 - 92.
Lim, G. S., & Chan, A. (2003). Individual and situational correlates of motivation for skills upgrading: An empirical study. Human Resource Development International, 6(2), 219 - 242.
Lin, W., & Pfau, M. (2007). Can inoculation work against the spiral of silence? A study of public opinion on the future of Taiwan. International Journal of Public Opinion Research, 19(2), 155 - 172.
Liou, S., Tasai, H., & Cheng, C. (2013). Acculturation, collectivist orientation and organizational commitment among Asian nurses working in the US healthcare system. Journal of Nursing, 21(4), 614 - 623.
Liozu, S., & Hinterhuber, A. (2014). Pricing capabilities: The design, development, and validation of a scale. Management Decision, 52(1), 144 - 158.
Little, T. D., Card, N. A., Bovaird, J. A., Preacher, K. J., & Crandall, C. S. Structural equation modeling of mediation and moderation with contextual factors. In T. D. Little, J. A. Bovaid, & N. A. Card (Eds.), Modeling contextual effects in longitudinal studies. Mahwah, NJ: Lawrence Earlbaum Associates.
Liu, W., Chi, S. S., Friedman, R., & Tsai, M. (2009). Explaining incivility in the workplace: The effects of personality and culture. Negotiation and Conflict Management Research, 2(2), 164 - 184.
Loyens, K. (2013). Why police officers and labour inspectors (do not) blow the whistle: A grid group cultural theory perspective. Policing: An international Journal of Police Strategies and Management, 36(1), 2013.
215
Lu, L., & Lee, Y. (2005). The effect of culture on the management style and performance of international joint ventures in China: The prespective of foreign firms. International Journal of Management, 22(3), 452 - 508.
Lustenbuerger, D. E., & Williams, K. D. (2009). Ostracism in organizations. In J. Greenberg & M. S. Edwards (Eds.), Voice and silence in organizations. Bingley, UK: Emerald Group Publishing Limited.
Lustig, M. W., & Koester, J. (2006). The effect of code usage in intercultural communication. In M. W. Lustig & J. Koester (Eds.), Intercultural competence: Interpersonal communication across cultures (pp. 234 - 256). New York, NY: Pearson Education, Inc.
MacCallum, R. C., Browne, M. W., & Sugawara, H. M. (1996). Power analysis and determination of sample size for covariance structure modeling. Psychological methods, 1(2), 130 - 149.
MacNab, B. R. (2004). Effective ethics management and culture: Examination of internal reporting and whistleblowing within a NAFTA member context (Doctoral Dissertation). Available from Proquest Dissertation and Theses database. (UMI No. 3139775)
Malhotra, N. K., & Dash, S. (2011). Marketing Research: An applied orientation. Delhi, India: Pearson.
Mancheno-Smoak, L., Endres, G. M., Polak, R., & Athanasaw, Y. (2009). The individual cultural values and job satisfaction of the tranformational leader. Organization Development Journal, 27(3), 9 - 21.
Marler, L. E., McKee, D., Cox, S., Simmering, M., & Allen, D. (2012). Don't make me the bad guy: Organizational norms, self-monitoring, and the MUM effect. Journal of Managerial Issues, 24(1), 97 - 116.
Martins, L. L., Schilpzand, M. C., Kirkman, B. L., Ivanaj, S., & Ivanaj, V. (2013). A contingency view of the effects of cognitive diversity on team performance: The moderating roles of team psychological safety and relationship conflict. Small Group Research, 44(2), 96 - 126.
Matsumoto, D. (1994). People: Psychology from cultural perspective. Prospect Heights, IL: Waveland Press Inc.
Maxfield, D. G., Grenny, J., Lavandero, R., & Groah, L. (2011). The silent treatment: Why safety tools and checklists aren't enough to save lives. Retrieved from http://www.aacn.org/wd/hwe/docs/the-silent-treatment.pdf
Maxfield, D. G., Grenny, J., McMillan, R., Patterson, K., & Switzier, A. (2005). Silence kills: The seven crucial conversations for healthcare. Retrieved from
Maxfield, D. G., Lyndon, A., Kennedy, H. P., O'Keefe, D. F., & Zlatnik, M. G. (2013). Confronting safety gaps across labor and delivery. American Journal of Obstetics and Gynecology. doi:10.1016/j.ajog.2013.07.013
McCrosky, J. C. (1984). The communication apprehension perspective. In J. A. Daly & J. C. McCrosky (Eds.), Avoiding communication: Shyness, reticence, and communication (pp. 13 - 32). Beverly Hills, CA: Sage Publications.

216
McCrosky, J. C., Richmond, V. P., & Davis, L. M. (1986). Apprehension about communication with supervisors: A test of a theoretical relationship between types of communication apprehension. The Western Journal of Speech Communication, 50(Spring), 171 - 182.
McDevitt, R. (2007). Introduction to confucius, confucianism, and the analects. Education about Asia, 12(1), 1 - 4. Retrieved from http://www.asian-studies.org/eaa/confucianism_handouts.pdf
McGowan, R. A. (2002). Organizational discourse: Sounds of silence. (Doctoral dissertation, York University). Retrieved from http://www.management.ac.nz/ejrot/cmsconference/2003/proceedings/silenceandvoice/McGowan.pdf
McIver, S. (2001). Medical nightmares: The human face of errors. Toronto, ON: Chestnut Publishing Group Inc.
McMahon, T. (2013). Why the world's best and brightest struggle to find jobs in Canada: Why do skilled immigrants only fare worse here than in the US and the UK? MACLEAN'S, April 24.
McSweeney, B. (2013). Fashion founded on a flaw: The ecological mono-deterministic fallacy of Hofstede, GLOBE, and followers. International Marketing Review, 30(5), 483 - 504.
Mecklin, A., & Mundfrom, D. (2003). On using asymptotic critical values in testing for multivariate normality. Interstat: Statistics on the internet, 9(1), 1 - 12.
Merkin, R., Taras, V., & Steel, P. (2014). State of the art themes in cross-cultural communication research: A systemic and meta-anlytic review. International journal of Intercultural Relations, 28, 1 - 23.
Merrit, A. (2000). Culture in the cockpit: Do Hofstede's dimensions replicate? Journal of Cross-Cultural Psychology, 31(3), 283 - 301.
Michon, R., & Chebat, J. (2008). Breaking open the consumer behavior black box: SEM and retail atmospheric manipulations. Journal of Marketing Theory and Practice, 16(4), 299 - 307.
Migliore, L. A. (2011). Relationship between big five personality traits and Hofstede's cultural dimensions: Samples from the USA and India. Cross Cultural Management: An International Journal, 18(1), 38 - 54.
Migration Policy Institute. (n.d.). United States. Migration information source. Retrieved from http://www.migrationpolicy.org/country-resource/united-states
Millenson, M. L. (2003). The silence. Health Affairs, 22(2), 103 - 112.
Milliken, F., & Lam, N. (2009). Making the decision to speak up or to remain silent: Implications for organizational learning. In J. Greenberg & M. S. Edwards (Eds.), Voice and silence in organizations (pp. 225 - 244`Ten). Bingley, UK: Emerald Group Publishing Limited.

217
Milliken, F., Morrison, E., & Hewlin, P. (2003). An exploratory study of employee silence: Issues that employees don't communicate upward and why. Journal of Management Studies, 40(6), 1453 - 1476.
Millsap, R. E., & Kwok, O. (2004). Evaluating the impact of partial factorial invariance on selection in two populations. Psychological methods, 9(1), 93 - 115.
Ministry of Citizenship and Immigration. (2013). Annual report to parliament on immigration 2013. Retrieved from Ottawa: http://www.cic.gc.ca/english/pdf/pub/annual-report-2013.pdf
Minkov, M. (2013). Cross-cultural analysis: The science and art of comparing the World's modern societies and their cultures. Thousand Oaks, CA: Sage Publications, Inc.
Moore, M. (2014). A time to keep silent, and a time to speak. et Cetera, 7(1), 14 - 20.
Morrison, E., & Milliken, F. (2000). Organizational silence: A barrier to change and development in a pluralistic world. Academy of Management Review, 25(4), 706 - 725.
Morrison, E., & Rothman, N. B. (1999). Silence and the dynamics of power. In J. Greenberg & M. S. Edwards (Eds.), Voice and silence in organizations (pp. 111 - 133). Bingley, UK: Emerald Group Publishing Limited.
Moskop, J. C., Gelderman, J. M., Hobgood, D. L., & Larkin, G. L. (2006). Emergency physicians and disclosure of medical errors. Annals of Emergency Medicine, 48(5), 523 - 531.
Moulettes, A. (2007). The absence of women's voices in Hofstede's Cultural's Consequences: A postcolonial reading. Women in Management Review, 22(6), 443 - 455.
Mueller, R. O. (1996). Basic principles of structural equation modeling: An introduction to Lisrel and EQS. New York, NY: Springer-Verlag New York Inc.
Munson, J. (2015). Medical lab facing a staffing shortage: technologists. Retrieved from http://ipolitics.ca/2015/04/28/medical-labs-facing-a-staffing-shortage-technologists/
Nash, K. R. (2005). Differences in the responses of managers to 360-degree feedback in low, medium and high power distance cultures. Available from Dissertation Abstracts International: Section B. Sciences and Engineering, 66(8),4524.
Nayena Blankson, A., & McArdle, J. J. (2013). Measurement invariance of cognitive abilities across ethnicity, gender and time among older Americans. Journal of Gerontology Biological Sciences and Social Sciences, 70(3).
Nembhard, I. M., & Edmondson, A. C. (2012, para. 6). Psychological safety: A foundation for speaking up, collaboration, and experimentation in organizations. In K. S. Cameron & G. M. Spreitzer (Eds.), The Oxford handbook of positive organizational scholarship. New York, NY: Oxford University Press. doi: 10.1093/oxfordhb/9780199734610.013.0037
Neuliep, J. W. (2012). Cultural context. In J. W. Neiliep (Ed.), Intercultural communication: A contextual approach (Fifth ed.). Thosand Oaks, CA: Sage Publication, Inc.
218
Neuman, W. L. (2006a). Planning and preparation. In W. L. Neuman (Ed.), Social research methods: Qualitative and quantitative approaches (Sixth ed., pp. 179 - 218). Boston, MA: Pearson Education, Inc.
Neuman, W. L. (2006b). Social research method: Qualitative and quantitative approaches (Sixth ed.). New York, NY: Pearson.
Nevitt, J., & Hancock, G. R. (2001). Performance bootstrapping approaches to model test statistics and parameter standard error estimation in structural equation modeling. Structural Equation Modeling, 8(3), 353 - 377.
Niedl, K. (1996). Mobbing and well-being: Economic and personnel development implications. European Journal of Work and Organizational Psychology, 5(2), 239 - 249.
Noelle-Neumann, E. (1974). The spiral of silence: A theory of public opinion. Journal of Communication, 43- 51.
O'Hagan, J., MacKinnon, N. J., Persaud, D., & Etchegary, H. (2009). Self-reported medical errors in seven countries: Implications for Canada. Healthcare Quaterly, 12(special issue), 55 - 61.
O'Reilly, J., Robinson, S. L., Berdahl, J. L., & Banki, S. (2014). Is negative attention better than no attention? The comparative effect of ostracism and harassment at work. Organization Science. Advance online publication.
Ogden, H., & Cheng, S. (2011). Cultural dimensions and materialism: Comparing Canada and China. Asia Pacific Journal of Maketing and Logistics, 23(4), 431 - 447.
Ontario Public Service Employee Union. (n.d.). Union basics: your personal guide. In O. P. S. E. Union (Ed.).
Parisella, J. (2013). Obama, Jackie Robinson and black history month. Quarterly Americas, February 20, 2013.
Park, J. (2011). Employee responses to negative workplace situations: Does culture matter? (Doctoral dissertation). Available from Proquest Dissertation and Theses database. (UMI No. 3489808)
Parker, K. A. (2014). The workplace bully: The ultimate silencer. Journal of Organizational Culture, Communication and Conflict, 18(1), 169 - 185.
Patterson, P. G., Cowley, E., & Prasongsukarn, K. (2006). Service failure recovery: The moderating impact of individual-level cultural value orientation on perceptions of justice. International Journal of Research in Marketing, 23, 263 - 277.
Phalet, K., & Swyngedouw, M. (2004). A cross-cultural analysis of immigrant and host values and acculturation orientations. In H. Vinken, J. Soeters, & P. Ester (Eds.), Comparing cultures: Dimensions of culture in a comparative perspective (pp. 181 - 208). Leiden, The Netherlands: Brill.

219
Piche, C., & Plante, C. (1991). Perceived masculinity, femininity and androgeny among primary school boys: Relationships with the adaptation level of these students and the attitudes of the teachers towards them. European Journal of Psychology of Education, 6(4), 423 - 435.
Pinder, C. C., & Harlos, K. P. (2001). Employee silence: Quiescense and acquiescence as responses to perceived injustice. . Research in Personnel and Human Resource Management, 20, 331 - 369.
Ploeger, N. (2011). Confronting and defending unethical organizational behavior: Communication and ethical sensegiving. (Doctoral dissertation). Available from Proquest Dissertations and Theses database. (UMI No. 3454206)
Podsakoff, P. M., MacKenzie, S. B., Lee, J. Y., & Podsakoff, N. P. (2003). eCommon method biases in bahavioral research: A critical review of the literature and recommendation. Journal of Applied Psycology, 88(5), 879 - 903.
Podsakoff, P. M., MacKenzie, S. B., & Podsakoff, N. P. (2012). Sources of method bias in social science research and recommendations on how to control it. Annual Review of Psychology, 63(1), 539 - 569.
Poliko-Harris, K. (1995). The influence of nation on work-related values and job satisfaction between American and Filipino registered nurses. (Doctoral dissertation). Available from Proquest Dissertations and Theses database. (UMI No. 9542157)
Porhola, M. (2002). Arousal style during public speaking. Communication Education, 51(4), 420 - 438.
Posthuma, R. A. (2009). National culture and union membership: A cultural-cognitive perspective. Relations Industrielles, 64(3), 507 529.
Prasongsukarn, K. (2009). Validating the cultural value scale (CVSCALE): A case study of Thailand. ABAC Journal, 29(2), 1 - 13.
Preacher, K. J., & Coffman, D. L. (2006). Computing power and minimum sample size for RMSEA [Computer Software]. Retrieved from http://quantpsy.org/
Prieto, L., Phipps, S. T., & Osiri, J. K. (2009). Linking workplace diversity to organizational performance. Journal of Diversity Management, 4(4), 13-21.
Public Service Commission. (2014). Valuing diversity. Retrieved from http://www.gov.pe.ca/diversity/
Pyc, L. S. (2011). The moderating effects of workplace ambiguity and perceived job control on the relations between abusive supervision and employees' behavioral, psycholoigcal and physical strains. (Doctoral dissertation). Available from Proquest Dissertation and Theses database. (UMI No. 4834345)
Radley, D. C., Wasserman, M. R., Olsho, L. E., Shoemaker, S. J., Spranca, M. D., & Bradshaw, B. (2013). Reduction in medication errors in hospitals due to adoption of computerized provider order entry systems. Journal of American Medical Information Association, 1-7. doi:10.1136/amiajnl-2012-001241

220
Raes, E., Decuyper, S., Lismont, B., Van den Bossche, P., Kyndt, E., Demeyere, S., & F, D. (2013). Facilitating team learning through transformational leadership. Instructional Science, 41(2), 287-305.
Ragan, P. H. (2004). Cross cultural communication in aviation. Paper presented at the European Symposium on language for special purposes, Surrey, UK.
Ralston, A. R., Gustafon, D. J., Elsass, P. M., Cheung, F., & Terpstra, R. H. (1992). Eastern values: A comparison of managers in the United States, Hong Kong, and the People's Republic of China. Journal of Applied Pstchology, 77(5), 664 - 671.
Ratzlaff, C., Matsumoto, D., Kouznetsova, N., Raroque, J., & Ray, R. (2000). Individual psychological culture and subjective well-being. In E. Diener & E. Suh, M (Eds.), Culture and subject well-being. Boston, MA: MIT Press.
Reid, V. (2011). A study of the influence of individual-level cultural value orientation on the formation of service quality expectations. (Doctoral thesis, University of Nottingham, Nottingham, United Kingdom). Available from Dissertation Abstract Information: Section C: Worldwide, 74(06).
Reinharz, S. (1994). Toward an ethnography of "Voice" and "Silence". In E. J. Trickett, R. J. Watts, & D. Birman (Eds.), Human diversity: Perspectives on people in context (pp. 178 - 200). San Francisco, CA: Jossey-Bass Publishers.
Rhee, J., Dedahanov, A., & Lee, D. (2014). Relationship among power distance, collectivism, punishment, and acquiescent, defensive, or prosocial silence. Social Behavior and Personality, 42(5), 705 - 720.
Ristig, K. (2004). Antecedents and consequences of trust within organizations. (Doctoral dissertation). Available from Proquest Dissertation and Theses database. (UMI No. 3129179)
Robertson, C. J., & Hoffman, J. J. (2000). How different are we? An investigation of Confucian values in the United States. Journal of Management Issues, 12(1), 34 - 47.
Robinson, R. V. (1983). Geert Hofstede, culture's consequences: International differences in work-related values. Work and Occupations, 10(1), 110 - 115.
Robinson, S. L., O'Reilly, J., & Wang, W. (2013). Invisible at work: An integrated model of workplace ostracism. Journal of Management, 39(1), 203 - 231.
Rohan, M. J. (2000). A rose by any name? The values construct. Personality and Social Psychology Review, 4(3), 255 - 277.
Rokeach, M. (1972). Beliefs, Attitudes, and Values. San Francisco, CA: Jossey-Bass Inc., Publishers.
Rokeach, M. (1973). The nature of human values. New York, NY: The Free Press.
Rokeach, M. (1979). Undertsnding human vlues: individual and societal. New York, NY: The Free Press.

221
Rosen, S., & Tesser, A. (1970). On reluctance to communicate undesirable information: The MUM effect. American Sociological Association, 33(3), 253 - 263.
Rosen, S., & Tesser, A. (1972). Fear of negative evaluation and the reluctance to transmit bad news. The Journal of Communication, 22, 124 - 141.
Roser, M. (2015). Life expectancy. Retrieved from http://ourworldindata.org/data/population-growth-vital-statistics/life-expectancy/
Rottig, D. (2009). Overcoming common pitfalls in cross cultural management research. International Business: Research teaching and practice, 3(1), 32 - 51.
Roussin, C. J., & Webber, S. S. (2012). Impact of organizational identification and psychological safety on initial perceptions of coworker trustworthiness. Journal of Business Psychology, 27, 317 - 329.
Royal Bank of Canada. (2012). RBC diversity blueprint 2012-2015: Priorities and objectives (100722 (09/2012)). Retrieved from
Royal Bank of Canada. (2013). Why does diversity matter? Retrieved from http://www.rbc.com/diversity/why-does-diversity-matter.html
Rucker, D. D., Preacher, K. J., Tormala, Z. L., & Petty, R. E. (2011). Mediation analysis in social psychology: Current practices and new recommendations. Social and Personality Psychology Compass, 5/6, 359 - 371.
Samnani, A. (2013). "Is this bullying?" Understanding target and witness reactions. Journal of Managerial Psychology, 28(3), 290 - 305.
Sandall, R. (2005). Doctor death in Bundaberg. Quadrant, 49(12), 11 - 20.
Sayre, M. M., McNeese-Smith, D., Leach, L. S., & Phillips, L. R. (2012). An educational intervention to increase "Speaking Up" behaviors in nurses and improve patient safety. Journal of Nursing Care Quality, 27(2), 154 - 160.
Schaubroeck, J., Lam, S. S. K., & Peng, A. C. (2011). Cognition-based and affect-based trust as mediator of leader behavior influences on team performance. Journal of Applied Psychology, 96(4), 863 - 871.
Schein, E. H. (1990). Organizational culture. American Psychology, 45(2), 109 - 119.
Schein, E. H. (2004). Organizational culture and leadership (Third ed.). San Francisco: Jossey-Bass.
Schumacker, R. E., & Lomax, R. G. (2010). A beginner's guide to structural equation modeling (Third ed.). New York, NY: Routledge Taylor & Francis Group.
Schwartz, S. H. (1990). Individualism-collectivism: Critique and proposed refinement. Journal of Cross-Cultural Psychology, 21(2), 139 - 157.

222
Schwartz, S. H. (1999). A theory of cultural values and some implications for work. Applied Psychology: An internal Review, 48(1), 23 - 47.
Schwartz, S. H. (2004). Mapping and interpreting cultural differences around the world. In H. Vinken, J. Soeters, & P. Ester (Eds.), Comparing cultures: Dimensions of culture in a comparative perspective (pp. 43 -73). Leiden, The Netherlands: Brill.
Schwochau, S. (1987). Union effects on job attitudes. Industrial and Labor Relation Reviews, 40(2), 209 - 224.
Seker, H. (2013). In/out-of-school learning environment and SEM analyses usage attitude towards school. In M. S. Khine (Ed.), Application of structural equation modeling in educational research and practice (Vol. 7, pp. 135 - 167). Rotterdam, The Netherlands: Senses Publishers.
Siemsen, E., Roth, A. V., Balasubramanian, S., & Anand, G. (2009). The influence of psychological safety and confidence in knowledge on employee knowledge sharing. Manufacturing and Service operations Management, 11(3), 429 - 447.
Sims, D. E. (2009). The impact of intraorganizational trust and learning oriented climate on error reporting. Psychology. University of Central Florida. Orlando, FL.
Singh, B., Winkel, D. E., & Selvarajan, T. T. (2013). Managing diversity at work: Does psychological safety hold the key to racial differences in employee performance? Journal of Occupational and organizational Psychology, 86, 242-263.
Smith, B. (2009). Ethical ideology and cultural orientation: Understanding the individualized ethical inclinations of marketing students. American Journal of Marketing Education, 2(8), 27 - 36.
Smith, B. (2011). Who shall lead us? How cultural values and ethical ideologies guide young marketers' evaluations of the transformational manager-leader. Journal of Business Ethics, 100, 633 - 645.
Soonthornsawad, P. (2009). Cultures and genetic markers as predictors of communication apprehension. (Master of Arts), Hawaii Pacific University, Honolulu, HI.
Spector, P. E., Cooper, C. L., & Sparks, K. (2001). An international study of the psychometric properties of the Hofstede Value Survey module 1994: A comparison of individual and country/province level results. Applied Psychology: An international review, 50(2), 269 - 281.
St. Clair, R. N. (2003). The social and cultural construction of silence. In H. Nuboyuki & B. Hoffer (Eds.), Festschrift for Masanori Higa. San Antonio, TX: Trinity University.
Statistics Canada. (2011). Study: Projected trends to 2031 for the Canadian labour force. Ottawa.
Steenkamp, J. E. M., & Baumgartner, H. (1998). Assessing measurement invariance in cross-national consumer research. Journal of Consumer Research, 25(1), 78 - 90.
Strohmaier, M. (1997). An intersection of communication apprehension, willingness to communicate, and cultural difference: The university classroom. English Department. Purdue University. Indiana.

223
Sumanth, J. J. (2011). Be careful what you ask for: Inclusive leaders diminish upward communication quality. (Doctoral dissertation). Available from Proquest and Theses database. (3464994)
Tabachnick, B. G., & Fidell, L. S. (2007). Cleaning up your act: Screening data. In B. G. Tabachnick & L. S. Fidell (Eds.), Using multivariate statistics. Boston, MA: Pearson Education, Inc.
Tangirala, S., Kamdar, D., Venkataramani, V., & Parke, M. R. (2013). Doing right versus getting ahead: The effects of duty and achivement orientation on employees' voice. Journal of Applied Psychology. doi:Advace online publication. 10.1037/a0033855
Tangirala, S., & Ramanujam, R. (2008). Employee silence on critical work issues: The cross level effects of procedural justice climate. Personal Psychology, 61(1), 37 - 68.
Tankari, M. (2012). Online learning satisfaction: Does culture matter? (Doctoral dissertation). Available from Proquest Dissertation and Theses database. (UMI No. 3509829)
Taras, V. (2008). Catalogue of instruments for measuring culture. Retrieved from www.ucalgary.ca/~taras/_private/Culture_Survey_Catalogue.pdf
Taras, V., Kirkman, B. L., & Steel, P. (2010). Examing the impact of Culture's Consequences: A three-decade, multilevel, meta analysis review of Hofstede's cultural value dimension. Journal of Applied Psychology, 95(3), 405 - 439.
Taylor, B. (2005). Bootstrap theorem: Creating empirical distributions. Retrieved from http://economics.fundamentalfinance.com/bootstrap.php
Templeton, G. F. (2011). A two-step approach for transformating continuous variables to normal: Implication and recommendation for IS research. Communication s of the Association for Information System, 28(4), 41 - 58.
Teo, T., Tsai, L. T., & Yang, C. (2013). Applying structural equation modeling (SEM) in Educational Research: An introduction. In M. S. Khine (Ed.), Application of structural equation modeling in educational research and practice The Netherlands: Senses Publishers.
The Hofstede Centre. (n.d.). National cultural dimensions. Retrieved from http://geert-hofstede.com/national-culture.html
Thompson, B. (1994). The pivotal role of replication in psychological results. Journal of Personality, 62(2), 157 - 176.
Thompson, M. S., & Green, S. B. (2013). Evaluatingbetween-group diffeences in latent variabl means. In G. R. Hancock & R. O. Mueller (Eds.), Structural equation modelling (pp. 163 - 218). Charlotte, NC: Information Age Publishing, Inc.
Triandis, H. C. (1995). Individualism and collectivism. Boulder, CO: Westview Press.
Triandis, H. C. (1995). A theoretical framework for the study of diversity. In M. M. Chemers, S. Oskamp, & M. A. Costanzo (Eds.), Diversity in organizations: new perspectives for a changing workplace (pp. 11 - 37). Thousand Oaks, CA: Sage Publications.

224
University of Minnesota. (2014). Reporting and addressing concerns of misconduct. Retrieved from http://policy.umn.edu/Policies/Operations/Compliance/MISCONDUCTREPORTING.html
Uysal, A., & Oner-Ozkan, B. (2007). A self-presentational approach to transmission of good and bad news. Social Bahavior and Personality, 35(1), 63 - 78.
Vago, S. (1999). Social change. Upper Saddle River, NJ: Prentice Hall.
Vajjhala, N. R., & Stang, K. D. (2014). Collaboration strategies for a transition economy: Measuring culture in Albania. Cross Cultural Management, 21(1), 78 - 103.
Vakola, M., & Bouradas, D. (2005). Antecedents and consequences of organizational silence: An empirical investigation. Employee Relations, 27(5), 441 - 458.
Van Alstine, J., Cox, S. R., & Roden, D. M. (2013). The costs and benefits of diversity: Are religious differences more important? Journal of Global Business Issues, 7(2), 9-20.
Van Dyne, L., Ang, S., & Botero, I. C. (2003). Conceptializing employee silence and employee voice as multidimensional constructs. Journal of Management Studies, 40(6), 1359 - 1392.
van IJzendoorn, M. H., & Kroonenberg, P. M. (1988). Cross-cultural patterns of attachment: A meta analysis of the Strange Situation. Child Development, 59(1), 146 - 156.
Vaughan, D. (1998). Rational choice, situated action, and the social control of organizations. Law and Society Review, 32(1), 23 - 61.
Vega, G., & Comer, D. R. (2005). Sticks and stones may break your bones, but words can break your spirit: Bullying in the workplace. Journal of Business Ethics, 58, 101 - 109.
Velbeck, W. M. (2009). An exploratory study of how manager behavior influences employee decisions about accurately reporting business problems. Available from Dissertation Abstract International: Section A: Humanities and Social Sciences, 71(1), 353. (UMI No. 3387676)
Vickers, M. H., & Parris, M. A. (2005). Towards ending the silence: Working women caring for children with chronic illness. Employee Responsibilities and Rights Journal, 17(2), 91 - 108.
Wang, H. E., Lave, J. R., Sirlo, C. A., & Yealy, D. M. (2006). Paramedic intubation errors: Isolated events or symptoms of larger problems? Health Affairs, 25(2), 501 - 509.
Weaver, D. E. (2011). How professional women learn to speak up and negotitae for themselves in the workplace. (Doctor of Education), Columbia University, New York, NY.
Wei, F., & Si, S. (2013). Tit for tat? Abusive supervision and counterproductive work behaviors: The moderarting effects of locus of control and perceived mobility. Asia Pacific Journal of Management, 30, 281 - 296.
Whiteside, D. B., & Barclay, L. J. (2013). Echoes of silence: Employee silence as a mediator betweenoverall justice and employee outcomes. Journal of Business Ethics, 116, 251 - 266.

225
Williams, B., & Boyle, M. (2008). Paramedic identification of electrocardiograph J-point and ST-segment. Prehospital and Disaster Medicine, 23(6), 526 - 529.
Williams, K. D. (2007). Ostracism: The kiss off social death. Social and Personality Psychology Compass, 1, 236 - 247.
Wilson, F. M. (2010). Leadership. In F. M. Wilson (Ed.), Organizational behaviour and work: A critical introduction (Third ed.). Italy: Oxford University Press.
Withers, L. A., & Vernon, L. L. (2006). To err is human: Embarrassment, attachment, and communication apprehension. Personality and Individual Differences, 40, 99 - 110.
Wong, A., & Tjosvold, D. (2010). Leadership values and learning in China: The mediating role of psycchological safety. Asia Pacific Journal of Human Resources, 48(1), 86 - 107.
Woodland, K. (2010). Mechanisms of voice-grieveance, injury reporting, absence, turnover and adverse events and their association with collective bargaining: An analysis of Eastern Health Employees, St. John's Region. (Master's thesis, Memorial University of Newfoundland). Retrieved from http://collections.mun.ca/cdm/ref/collection/theses4/id/144138
World Values Survey. (2015). Findings and insights. Retrieved from http://www.worldvaluessurvey.org/WVSContents.jsp
Wu, L., Yim, F. H., Kwan, H. K., & Zhang, X. (2012). Coping with workplace ostracism: The roles of ingratiation and political skill in employee psychological distress. Journal of Management Studies, 49(1), 178 - 199.
Wu, M. (2006). Hofstede's cultural dimensions 30 years later: A study of Taiwan and the United States. International Communication Studies, 15(1), 33-42.
Yammarino, F. J., & Dansereau, F. (2013). Multilevel issues in organizational culture and climate research. In N. M. Ashkanasy, C. P. M. Wilderom, & M. F. Peterson (Eds.), The handbook of organizational culture and climate. Thousand Oaks, CA: Sage Publications, Inc.
Yildiz, A. (2013). The effect of national cultures on unionization. Sosyoloji Konferanslari, 48(2), 19 - 33.
Yoo, B., & Donthu, N. (1998). validating Hofstede's five-dimensional measure of culture at the individual level. Americal Marketing Association. Conference Proceedings, 9, 83.
Yoo, B., & Donthu, N. (2002). The effect of marketing education and individual cultural values on marketing ethics of students. Journal of Marketing Education, 24(2), 92 - 103.
Yoo, B., Donthu, N., & Lenartowicz, T. (2011). Measuring Hofstede 's five dimensions of cultural values at the individual level: Development and validation of CVSCALE. Journal of International Consumer Marketing, 23, 193 - 210.
Yoon, H. J. (2012). Predicting employee voice behavior: An explorationn of the roles of empowering leadership, power distance, organizational leanring capacities, and sense of empowerment in

226
Korean organizations (Doctoral dissertation). Available from Proquest Dissertation and Theses database. (UMI No. 3513386)
York, C. M. (2013). Exploring the differences in drinking motives among adolescent binge and non-binge drinkers. Available from Dissertation Abstract International: Section B. Sciences and Engineering, 75(7).
Yu, K. Y. T., & Cable, D. M. (2011). Unpacking cooperation in diverse teams: Incorporating long-term orientation and civic virtue in the study of information diversity. Team Performance Management, 17(1), 63 - 82.
Yuksel, M. (2010). The straitjacket at workplace: Mobbing. Chinese Business Review, 9(3), 13 - 21.
Zapf, D., Knorz, C., & Kulla, M. (1996). On the relationship between mobbing factors, and job content, social work environment, and health outcomes. European Journal of Work and Organizational Psychology, 5(2), 215 - 237.
Zhao, X., Lynch, J. G., & Chen, Q. (2010). Reconsidering Baron and Kenny: Myths and truths about mediation analysis. Journal of Consumer Research, 37(2), 197 - 206.
Zheng, X., Ke, J., Shi, J., & Zheng, X. (2008). Survey on employee silence and the impact of trust on it in China. Acta Psychologica Sinica, 40(2), 219 - 227.

227
Table A1
Demographics
Please answer all questions.
1. Gender Male Female
2. Age group
20 – 30 31 – 40 41 – 50 51 and over
3. Religion
--------------------------------------------------------------------------------------------------------------------------------------------------------
4. Profession
-------------------------------------------------------------------------------------------------------------------------------------------------
5. Tenure (years in your organizations)-----------------------------------------------------------------------------------------------------------
6. In what country were you born? -----------------------------------------------------------------------------------------------------------------
Appendix A
Questionnaire

228
When you remain silent at work, it is:
1. Because of fear of negative consequence
2. Because I fear disadvantages from speaking up
3. Because I do not want to be criticized by colleagues or superiors
4. Because I want avoid conflicts with coworkers or supervisors
5. Because I did not want to be viewed as a trouble maker
6. Because others say nothing
7. Because I don’t want to hurt the feelings of colleagues or superiors
8. Because I do not want to embarrass others
9. Because I don’t want others to get into trouble
10. Because I do not want to damage my relationships to colleagues or superiors
11. To not give away my knowledge advantage
12. Because of concern that others could take an advantage of my ideas
13. Because I wanted others to experience the effects from their mistakes
14. Because my superiors do not deserve my involvement
15. Because that would mean having to do avoidable additional work
16. Because I will not find a sympathetic ear, anyway
1 2 3 4 5 6 7
1 2 3 4 5 6 7
1 2 3 4 5 6 7
1 2 3 4 5 6 7
1 2 3 4 5 6 7
1 2 3 4 5 6 7
1 2 3 4 5 6 7
1 2 3 4 5 6 7
1 2 3 4 5 6 7
1 2 3 4 5 6 7
1 2 3 4 5 6 7
1 2 3 4 5 6 7
1 2 3 4 5 6 7
1 2 3 4 5 6 7
1 2 3 4 5 6 7
1 2 3 4 5 6 7
Strongly Strongly
Disagree
Agree
Table A2
Employee Silence
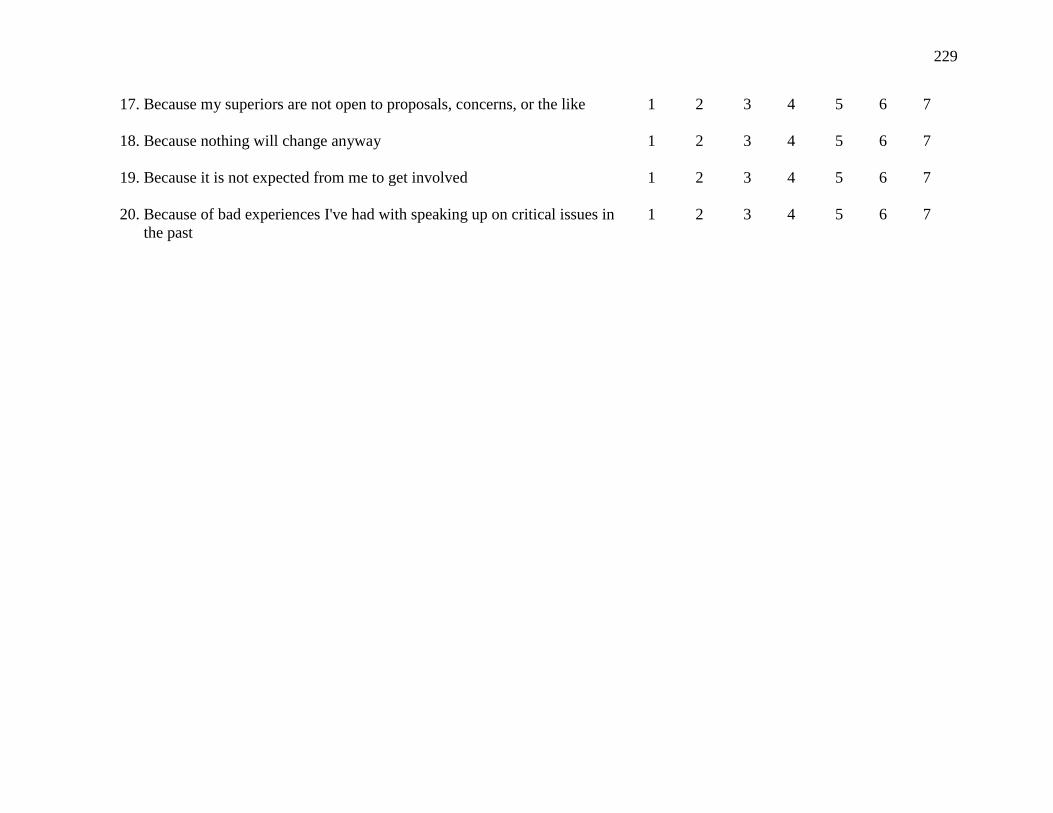
229
17. Because my superiors are not open to proposals, concerns, or the like
18. Because nothing will change anyway
19. Because it is not expected from me to get involved
20. Because of bad experiences I've had with speaking up on critical issues in
the past
1 2 3 4 5 6 7
1 2 3 4 5 6 7
1 2 3 4 5 6 7
1 2 3 4 5 6 7

230
Please answer all questions
1. People in higher positions should make most decisions without consulting
people in lower positions
2. People in higher positions should not ask opinions of people in lower
positions too frequently
3. People in higher positions should avoid social interaction with people in
lower positions
4. People in lower positions should not disagree with decisions by people in
higher positions
5. People in higher positions should not delegate important tasks to people in
lower positions
6. It is important to have instruction spelled out in detail so that I know what
I’m expected to do
7. It is important to closely follow instruction and procedures
8. Rules and regulations are important because they inform me of what is
expected to me
9. Standardized work procedures are helpful
10. Instructions for operations are important
11. Individuals should sacrifice self-interest for the group
12. Individuals should stick with the group even through difficulties
1 2 3 4 5 6 7
1 2 3 4 5 6 7
1 2 3 4 5 6 7
1 2 3 4 5 6 7
1 2 3 4 5 6 7
1 2 3 4 5 6 7
1 2 3 4 5 6 7
1 2 3 4 5 6 7
1 2 3 4 5 6 7
1 2 3 4 5 6 7
1 2 3 4 5 6 7
1 2 3 4 5 6 7
Table A3
Individual Cultural Values
Strongly Strongly
Disagree Agree

231
13. Group welfare is more important than individual rewards
14. Group success is more important than individual success
15. Individuals should pursue their goals after considering the welfare of the
group
16. Group loyalty should be encouraged even if individual goals suffer
17. People should carefully manage their money
18. People have to remain resolute in spite of opposition
19. Personal steadiness and stability are desirable human characters
20. Long term planning is important
21. I would give up today’s fun for future success
22. It is more important to work hard for future success
23. It is more important for men to have a professional career than it is for
women
24. Men usually solve problems with logical analysis; women usually solve
problem with intuition
25. Solving difficult problems usually requires an active, forcible approach
26. There are some jobs that men can always do better than women
1 2 3 4 5 6 7
1 2 3 4 5 6 7
1 2 3 4 5 6 7
1 2 3 4 5 6 7
1 2 3 4 5 6 7
1 2 3 4 5 6 7
1 2 3 4 5 6 7
1 2 3 4 5 6 7
1 2 3 4 5 6 7
1 2 3 4 5 6 7
1 2 3 4 5 6 7
1 2 3 4 5 6 7
1 2 3 4 5 6 7
1 2 3 4 5 6 7

232
Please answer all questions
1. If you make mistake in this team, it is likely held against you
2. Members of this team are able to bring up problems and tough issues
3. People of this team sometimes reject others for being different
4. It is safe to take a risk on this team
5. It is difficult to ask other members of this team for help
6. No one on this team would deliberately act in a way that undermines my efforts
7. Working with members of this team, my unique skills and talents are valued and
utilized
1 2 3 4 5 6 7
1 2 3 4 5 6 7
1 2 3 4 5 6 7
1 2 3 4 5 6 7
1 2 3 4 5 6 7
1 2 3 4 5 6 7
1 2 3 4 5 6 7
Table A4
Psychological Safety
Strongly Strongly
Disagree Agree

233
Appendix B
Descriptive Statistics of Questionnaire Items
Variable M Median SD Skewness
Std. Error
of
Skewness Kurtosis
Std.
Error of
Kurtosis
PO1 2.03 1.00 1.40 1.57 .13 1.95 .25
PO2 1.83 1.00 1.34 1.91 .13 3.10 .25
PO3 1.84 1.00 1.39 1.78 .13 2.41 .25
PO4 1.70 1.00 1.14 1.97 .13 4.04 .25
PO5 1.82 1.00 1.17 1.68 .13 2.92 .25
UN1 5.30 6.00 1.74 -.98 .13 .02 .25
UN2 6.09 6.50 1.25 -1.83 .13 3.71 .25
UN3 6.03 6.00 1.40 -2.08 .13 4.55 .25
UN4 6.15 7.00 1.27 -2.03 .13 4.42 .25
UN5 6.36 7.00 1.15 -2.76 .13 8.87 .25
CO1 3.80 4.00 1.77 -.06 .13 -.99 .25
CO2 4.63 5.00 1.71 -.48 .13 -.72 .25
CO3 4.68 5.00 1.63 -.48 .13 -.45 .25
CO4 4.80 5.00 1.71 -.57 .13 -.57 .25
CO5 4.70 5.00 1.69 -.56 .13 -.47 .25
CO6 3.72 4.00 1.59 .12 .13 -.73 .25
LT1 6.42 7.00 1.02 -2.56 .13 8.04 .25
LT2 4.87 5.00 1.61 -.61 .13 -.41 .25
LT3 6.07 6.00 1.11 -1.75 .13 4.13 .25
LT4 6.26 6.00 .99 -2.10 .13 6.82 .25
LT5 5.05 5.00 1.63 -.72 .13 -.21 .25
LT6 6.22 7.00 1.11 -2.30 .13 7.07 .25
MA1 1.50 1.00 1.28 3.00 .13 8.67 .25
MA2 2.37 2.00 1.67 .96 .13 -.24 .25
MA3 3.01 3.00 1.75 .53 .13 -.84 .25
MA4 3.00 2.00 2.00 .47 .13 -1.18 .25
QS1 4.89 5.00 1.76 -.86 .13 -.09 .25
QS2 4.40 5.00 1.85 -.44 .13 -.87 .25
QS3 4.29 5.00 1.89 -.42 .13 -.99 .25
QS4 4.70 5.00 1.80 -.65 .13 -.57 .25
QS5 4.02 4.00 1.99 -.15 .13 -1.21 .25
QS6 3.60 4.00 1.88 .13 .13 -1.08 .25
PR1 4.00 5.00 1.72 -.32 .13 -.93 .25
PR2 4.17 5.00 1.58 -.53 .13 -.49 .25
PR3 4.25 5.00 1.68 -.48 .13 -.72 .25
PR4 4.46 5.00 1.76 -.66 .13 -.46 .25

234
OS1 2.37 2.00 1.60 1.04 .13 .16 .25
OS2 2.48 2.00 1.70 .91 .13 -.34 .25
OS3 2.42 2.00 1.60 .87 .13 -.31 .25
OS4 2.19 1.00 1.63 1.35 .13 .89 .25
OS5 2.25 2.00 1.59 1.14 .13 .21 .25
AS1 3.39 3.00 2.08 .31 .13 -1.30 .25
AS2 3.84 4.00 2.12 .03 .13 -1.37 .25
AS3 4.01 4.00 2.06 -.08 .13 -1.30 .25
AS4 2.93 3.00 1.71 .55 .13 -.70 .25
AS5 3.63 4.00 2.05 .10 .13 -1.30 .25
PS1 3.89 4.00 1.99 .06 .13 -1.25 .25
PS2 4.68 5.00 1.75 -.62 .13 -.57 .25
PS3 4.42 5.00 1.85 -.46 .13 -.84 .25
PS4 4.00 4.00 1.72 -.16 .13 -.86 .25
PS5 2.94 3.00 1.81 .65 .13 -.74 .25
PS6 4.04 4.00 1.94 .07 .13 -1.18 .25
PS7 4.77 5.00 1.78 -.62 .13 -.55 .25

235
Appendix C
Correlation Matrix for Variables Investigated in Part A
PO1 PO2 PO3 PO4 PO5 UN1 UN2 UN3 UN4 UN5 QS1 QS2 QS3
PO1 1
PO2 .51**
1
PO3 .24**
.32**
1
PO4 .34**
.31**
.25**
1
PO5 .08 .07 .03 .19**
1
UN1 -.03 .08 .05 .09 .06 1
UN2 -.03 .05 -.08 .06 -.02 .40**
1
UN3 .01 .02 -.09 .07 -.02 .35**
.58**
1
UN4 -.04 .07 -.02 -.01 -.06 .28**
.58**
.63**
1
UN5 .01 .01 -.07 -.01 -.09 .32**
.56**
.63**
.69**
1
QS1 .03 .00 -.01 -.01 .08 .00 -.04 .02 -.03 .02 1
QS2 .06 .02 -.04 -.01 .14**
.05 -.05 .00 -.02 .01 .70**
1.00
QS3 .07 .05 -.03 .09 .16**
.06 .00 .04 .02 .08 .56**
.64**
1
QS4 .07 .06 -.05 .14**
.04 .09 .08 .06 .06 .13* .52
** .54
** .68
**
QS5 .09 .06 .02 .15**
.09 .14**
.04 .03 .01 .06 .41**
.45**
.50**
QS6 .13**
.15**
.01 .09 .11* -.01 -.08 -.05 -.05 .00 .35
** .37
** .47
**
AS1 .08 .04 .11* -.02 .09 -.07 -.11 -.06 -.06 -.02 .22
** .33
** .20
**
AS2 .09 .02 .11* -.05 .13
* -.11 -.19 -.12 -.15 -.11 .24
** .34
** .22
**
AS3 .10 .07 .08 .04 .15**
-.13 -.22 -.13 -.21 -.13 .23**
.30**
.23**
AS4 .23**
.10 .10* .10 .11
* -.02 -.13 -.10 -.08 -.06 .21
** .34
** .32
**
AS5 .11* .15
** .09 .05 .11
* -.14 -.19 -.16 -.11 -.11 .30
** .39
** .28
**
PS1 .07 .03 .06 .03 .12* -.08 -.11 -.06 -.07 -.08 .20
** .30
** .25
**
PS2 .08 -.03 -.09 -.03 -.09 .07 .22**
.14**
.10 .16**
-.19 -.246**
-.10
PS3 -.03 -.03 .01 -.03 -.03 -.09 -.08 -.07 -.03 -.03 .12* .18
** .07
PS4 -.03 -.02 -.04 -.06 -.06 .15**
.16**
.14**
.06 .10 -.25 -.297**
-.21**
PS5 .05 .04 .07 .04 .05 -.11 -.14 -.09 .01 -.05 .11* .23
** .15
**
PS6 -.01 .02 -.03 .02 .05 .18**
.09 .11* .02 .02 -.10 -.210
** -.11
*
PS7 -.01 -.03 -.07 .06 -.08 .10 .14**
.08 .06 .13**
-.24 -.323**
-.20**

236
Appendix C (Continued)
QS4 QS5 QS6 AS1 AS2 AS3 AS4 AS5 PS1 PS2 PS3 PS4 PS5 PS6 PS7
QS4 1
QS5 .56**
1
QS6 .42**
.40**
1
AS1 .10 .23**
.18**
1
AS2 .12* .17
** .18
** .69
** 1
AS3 .20**
.21**
.21**
.57**
.69**
1
AS4 .20**
.27**
.25**
.44**
.46**
.49**
1
AS5 .19**
.27**
.30**
.48**
.47**
.55**
.45**
1
PS1 .14**
.21**
.18**
.48**
.49**
.45**
.40**
.43**
1
PS2 .01 -.12* -.12
* -.32
** -.34
** -.28
** -.20
** -.29
** -.37
** 1
PS3 .11* .13
* .12
* .28
** .30
** .32
** .24
** .24
** .41
** -.22
** 1
PS4 -.13* -.18
** -.13
* -.30
** -.33
** -.31
** -.30
** -.30
** -.43
** .51
** -.29
** 1
PS5 .07 .14**
.18**
.34**
.31**
.32**
.31**
.37**
.49**
-.35**
.43**
-.30**
1
PS6 -.05 -.02 -.09 -.24**
-.16**
-.20**
-.14**
-.21**
-.35**
.29**
-.31**
.33**
-.41**
1
PS7 -.13* -.13
* -.12
* -.42
** -.44
** -.40
** -.37
** -.32
** -.48
** .42
** -.35
** .44
** -.43
** .40
** 1
**. Correlation is significant at .01 level (2-tailed)
*. Correlation is significant at .05 level (2-tailed)

237
Appendix D
EFA patterns of QUS, UNA, ACS, POD and PSY
Pattern Matrixa
Factor
1 2 3 4 5
QS4 .86
QS3 .84
QS2 .71
QS1 .69
QS5 .63
QS6 .53
UN4 .85
UN5 .81
UN3 .78
UN2 .69
AS2 .94
AS1 .76
AS3 .72
PS2 .77
PS4 .69
PS7 -.26 .46
PO1 .70
PO2 .69
PO4 .49
Extraction Method: Principal Axis Factoring.
Rotation Method: Promax with Kaiser Normalization.
a. Rotation converged in 5 iterations.

238
Appendix E
Comparison of Standardized Regression Weights between MLE and Bootstrapping Technique
Bootstrapping
MLE
Estimate Mean Bias
QS4 <--- QUS .758 .756 -.002
QS3 <--- QUS .821 .820 -.001
QS2 <--- QUS .795 .797 .002
QS1 <--- QUS .735 .736 .001
QS5 <--- QUS .623 .620 -.003
QS6 <--- QUS .532 .529 -.003
UN4 <--- UNA .824 .821 -.002
UN5 <--- UNA .815 .812 -.003
UN3 <--- UNA .777 .776 -.001
UN2 <--- UNA .716 .714 -.001
AS2 <--- ACS .894 .894 0
AS1 <--- ACS .767 .767 0
AS3 <--- ACS .768 .769 0
PS2 <--- PSY .668 .668 0
PS4 <--- PSY .685 .685 -.001
PS7 <--- PSY .676 .674 -.002
PO1 <--- POD .759 .767 .008
PO2 <--- POD .669 .667 -.002
PO4 <--- POD .454 .453 -.001

239
Appendix F
Standardized Regression Weights Pre- and Post-Common Latent Factor
With CLF Estimate Without CLF Estimate Δ
QS4 <--- QS .64 QS4 <--- QS .76 -.12
QS3 <--- QS .73 QS3 <--- QS .82 -.09
QS2 <--- QS .92 QS2 <--- QS .80 .13
QS1 <--- QS .76 QS1 <--- QS .74 .03
QS5 <--- QS .53 QS5 <--- QS .62 -.10
QS6 <--- QS .44 QS6 <--- QS .53 -.09
UN4 <--- UN .82 UN4 <--- UN .82 .00
UN5 <--- UN .80 UN5 <--- UN .82 -.01
UN3 <--- UN .77 UN3 <--- UN .78 .00
UN2 <--- UN .70 UN2 <--- UN .72 -.02
AS2 <--- AS .88 AS2 <--- AS .89 -.01
AS1 <--- AS .75 AS1 <--- AS .77 -.01
AS3 <--- AS .78 AS3 <--- AS .77 .01
PS2 <--- PS .64 PS2 <--- PS .67 -.03
PS4 <--- PS .68 PS4 <--- PS .69 .00
PS7 <--- PS .66 PS7 <--- PS .68 -.02
PO1 <--- PO .76 PO1 <--- PO .76 .00
PO2 <--- PO .66 PO2 <--- PO .67 -.01
PO4 <--- PO .43 PO4 <--- PO .45 -.03
QS4 <--- CLF -.60
QS3 <--- CLF -.36
QS2 <--- CLF .09
QS1 <--- CLF -.05
QS5 <--- CLF -.38
QS6 <--- CLF -.28
UN4 <--- CLF -.08
UN5 <--- CLF -.16
UN3 <--- CLF -.08
UN2 <--- CLF -.15
AS2 <--- CLF .15
AS1 <--- CLF .14
AS3 <--- CLF -.01
PS2 <--- CLF -.23
PS4 <--- CLF -.08
PS7 <--- CLF -.14
PO1 <--- CLF -.08

240
PO2 <--- CLF -.09
PO4 <--- CLF -.25

241
Appendix G
Moderation Effects
Table G1
Standardized Regression Weights for Pooled Sample
Regression path Standardized
coefficient
p-value
ZQUS ZPOD .02 .71
ZACS ZPOD .11 <.01
ZQUS POD × PSY .01 .78
ZACS POD × PSY .02 .69
ZQUS ZPSY -.64 <.01
ZACS ZPSY -.67 <.01
ZQUS UNA × PSY -.02 .55
ZACS UNA × PSY -.03 .43
ZQUS ZUNA .08 .05
ZACS ZUNA -.06 .12
Table G2
Standardized Regression Weights for RN Group
Regression path Standardized
coefficient
p-value
ZQUS ZPOD .015 .83
ZACS ZPOD .17 .01
ZQUS POD × PSY .10 .17
ZACS POD × PSY .10 .15
ZQUS ZPSY -.57 <.01
ZACS ZPSY -.62 <.01
ZQUS UNA × PSY -.01 .94
ZACS UNA × PSY <.01 .96
ZQUS ZUNA .16 .01
ZACS ZUNA -.01 .87

242
Table G3
Standardized Regression Weights for MLT Group
Regression path Standardized
coefficient
p-value
ZQUS ZPOD .07 .33
ZACS ZPOD .10 .16
ZQUS POD × PSY <.01 .97
ZACS POD × PSY -.06 .37
ZQUS ZPSY -..62 <.01
ZACS ZPSY -.66 <.01
ZQUS UNA × PSY -.12 .18
ZACS UNA × PSY -.03 .74
ZQUS ZUNA .09 .21
ZACS ZUNA -.02 .82
Table G4
Standardized Regression Weights for PCP Group
Regression path Standardized
coefficient
p-value
ZQUS ZPOD -.06 .48
ZACS ZPOD .10 .19
ZQUS POD × PSY <-.01 .97
ZACS POD × PSY .03 .72
ZQUS ZPSY -.54 <.01
ZACS ZPSY -.67 <.01
ZQUS UNA × PSY .06 .50
ZACS UNA × PSY -.09 .26
ZQUS ZUNA .01 .89
ZACS ZUNA -.09 .24

243
Appendix H
Correlation Matrix for Variables Investigated in Part B
PR1 PR2 PR3 PR4 OS1 OS2 OS3 OS4 OS5 CO1 CO2 CO3 CO4 CO5 CO6
PR1 1
PR2 .75**
1
PR3 .59**
.64**
1
PR4 .42**
.53**
.52**
1
OS1 .01 .09 .06 .21**
1
OS2 .01 .09 .10 .18**
.58**
1
OS3 .01 .02 .01 .13* .40
** .39
** 1
OS4 -.05 .00 .09 .12* .31
** .36
** .37
** 1
OS5 .06 .07 .14**
.11* .31
** .31
** .33
** .50
** 1
CO1 .04 .05 .04 .06 -.07 -.09 -.10 -.07 -.16**
1
CO2 .06 .03 -.04 -.02 -.06 -.08 -.06 -.05 -.17**
.35**
1
CO3 .15**
.13* -.01 .03 -.09 -.02 -.01 -.01 -.09 .40
** .43
** 1
CO4 .17**
.17**
.04 .11* -.04 .01 -.01 .02 -.19
** .35
** .37
** .75
** 1
CO5 .03 -.01 .00 -.02 -.02 .05 .04 .09 -.02 .23**
.25**
.29**
.36**
1
CO6 .14**
.11* .06 .01 -.04 -.04 -.08 -.03 -.10 .37
** .40
** .46
** .48
** .43
** 1
LT1 .10 .09 .08 .06 -.03 -.01 .05 -.01 -.09 .00 .11* .03 .12
* .15
** .06
LT2 .05 .02 .09 .05 -.01 -.01 .07 -.02 -.11* .15
** .18
** .11
* .20
** .17
** .23
**
LT3 -.01 -.02 .02 .01 .00 -.02 -.01 -.03 -.16**
.04 .19**
.09 .11* .21
** .12
*
LT4 .05 .02 .05 .01 -.03 -.05 .01 .06 -.01 .01 .14**
.03 .07 .16**
.09
LT5 .01 .04 .02 .04 .01 -.00 .06 .11* .01 .20
** .06 .12
* .14
** .22
** .17
**
LT6 .06 .06 .05 .16**
.04 -.02 -.01 -.05 -.14**
-.02 .11* .03 .06 .12
* .06
MA1 -.02 .01 .13* .02 .04 .02 .06 .15
** .09 .00 .00 -.02 -.03 .05 .01
MA2 .09 .08 .07 .08 .11* .07 .11
* .08 .10
* .01 .04 .00 .00 .06 .07
MA3 .02 .02 .04 .02 .11* .09 .11
* .05 .00 .01 .12
* .06 .03 .03 .13
*
MA4 .07 .11* .08 .02 .02 .04 .09 .10
* .11
* .01 .0 .05 .03 .03 .09

244
Appendix H (Continued)
LT1 LT2 LT3 LT4 LT5 LT6 MA1 MA2 MA3 MA4
LT1 1
LT2 .26**
1
LT3 .37**
.33**
1
LT4 .46**
.19**
.54**
1
LT5 .20**
.10* .25
** .38
** 1
LT6 .47**
.15**
.48**
.57**
.39**
1
MA1 -.07 .10 -.03 .00 .09 -.02 1
MA2 .02 .15**
.01 .01 .06 .04 .35**
1
MA3 .02 .12* .11
* .07 .10
* .09 .22
** .25
** 1
MA4 .02 .11* .05 -.01 .05 .01 .37
** .32
** .23
** 1

245
Appendix I
EFA patterns of PRS, LTO, COL, COM and OPS
Pattern Matrixa
Factor
1 2 3 4 5
PR2 .89
PR1 .80
PR3 .77
PR4 .59
LT4 .79
LT6 .74
LT3 .66
LT1 .59
CO4 .88
CO3 .86
CO6 .53
OS1 .77
OS2 .75
OS3 .52
MA1 .65
MA4 .58
MA2 .53
Extraction Method: Principal Axis Factoring with 0.2 Suppression.
Rotation Method: Promax with Kaiser Normalization.
a. Rotation converged in 5 iterations.

246
Appendix J
CFA Model of PRS, LTO,COL, OPS and COM
Note: The model shows standardized regression weights and correlctions among the five constructs.

247
Appendix K
Comparision of Standardized Regression Weights between MLE and Bootstrapping Technique.
MLE
Estimate
Bootstrapping
Mean Values Δ
PR2 <--- PRS .909 .91 -.001
PR1 <--- PRS .813 .813 0
PR3 <--- PRS .723 .723 0
PR4 <--- PRS .588 .587 .001
LT4 <--- LTO .782 .78 .002
LT6 <--- LTO .733 .728 .005
LT3 <--- LTO .662 .657 .005
LT1 <--- LTO .601 .601 0
CO4 <--- COL .896 .898 -.002
CO3 <--- COL .836 .837 -.001
CO6 <--- COL .539 .537 .002
OS1 <--- OSL .777 .778 -.001
OS2 <--- OSL .747 .748 -.001
OS3 <--- OSL .516 .513 .003
MA1 <--- COM .617 .62 -.003
MA4 <--- COM .589 .59 -.001
MA2 <--- COM .556 .552 .004

248
Appendix L
CFA-CFL of Part B

249
Appendix M
Comparison of Standardized Regression Weights of Pre- and Post-CLF of PRS, LTO, COL,
OPS, and COM
With
CLF Estimate
Without
CLF Estimate
Δ
PR2 <--- PRS .88 PR2 <--- PRS .91 .03
PR1 <--- PRS .86 PR1 <--- PRS .81 -.04
PR3 <--- PRS .70 PR3 <--- PRS .72 .03
PR4 <--- PRS .50 PR4 <--- PRS .59 .09
LT4 <--- LTO .79 LT4 <--- LTO .78 .00
LT6 <--- LTO .73 LT6 <--- LTO .73 .00
LT3 <--- LTO .66 LT3 <--- LTO .66 .00
LT1 <--- LTO .60 LT1 <--- LTO .60 .00
CO4 <--- COL .90 CO4 <--- COL .90 -.01
CO3 <--- COL .83 CO3 <--- COL .84 .00
CO6 <--- COL .54 CO6 <--- COL .54 .00
OS1 <--- OSL .73 OS1 <--- OSL .78 .05
OS2 <--- OSL .72 OS2 <--- OSL .75 .03
OS3 <--- OSL .49 OS3 <--- OSL .52 .03
MA1 <--- COM .61 MA1 <--- COM .62 .00
MA4 <--- COM .60 MA4 <--- COM .59 -.01
MA2 <--- COM .55 MA2 <--- COM .56 .00
PR2 <--- CLF .13
PR1 <--- CLF -.01
PR3 <--- CLF .23
PR4 <--- CLF .74
LT4 <--- CLF -.01
LT6 <--- CLF .18
LT3 <--- CLF .02
LT1 <--- CLF .03
CO4 <--- CLF .01
CO3 <--- CLF -.08
CO6 <--- CLF -.08
OS1 <--- CLF .26
OS2 <--- CLF .21
OS3 <--- CLF .17
MA1 <--- CLF .02
MA4 <--- CLF -.04
MA2 <--- CLF .05

250
Appendix N
Correlation Matrix for Variables Investigated in Part C
QS1 QS2 QS3 QS4 QS5 QS6 PR1 PR2 PR3 PR4
QS1 1
QS2 .70**
1
QS3 .56**
.64**
1
QS4 .53**
.54**
.68**
1
QS5 .41**
.45**
.50**
.56**
1
QS6 .35**
.37**
.47**
.42**
.40**
1
PR1 .29**
.26**
.37**
.44**
.32**
.32**
1
PR2 .29**
.24**
.34**
.38**
.33**
.33**
.75**
1
PR3 .31**
.26**
.35**
.44**
.39**
.33**
.59**
.64**
1
PR4 .39**
.38**
.41**
.43**
.38**
.35**
.42**
.53**
.52**
1
OS1 .13* .22
** .24
** .12
* .16
** .21
** .01 .09 .06 .21
**
OS2 .11* .17
** .16
** .10
* .10 .19
** .01 .09 .10 .18
**
OS3 .12* .12
* .12
* .09 .05 .16
** .01 .02 .01 .13
*
OS4 .19**
.22**
.18**
.14**
.10 .18**
-.05 .00 .09 .12*
OS5 .12* .21
** .18
** .11
* .14
** .22
** .06 .07 .14
** .11
*
AS1 .22**
.33**
.20**
.10 .23**
.18**
-.01 .07 .17**
.16**
AS2 .24**
.34**
.22**
.12* .17
** .18
** .01 .09 .19
** .21
**
AS3 .23**
.30**
.23**
.20**
.22**
.21**
.01 .08 .26**
.29**
AS4 .21**
.34**
.32**
.20**
.27**
.25**
.09 .12* .23
** .22
**
AS5 .30**
.39**
.28**
.19**
.27**
.30**
.10* .18
** .25
** .38
**

251
Appendix N (Continued)
OS1 OS2 OS3 OS4 OS5 AS1 AS2 AS3 AS4 AS5
OS1 1
OS2 .58**
1
OS3 .40**
.39**
1
OS4 .31**
.36**
.37**
1
OS5 .31**
.31**
.33**
.50**
1
AS1 .21**
.23**
.28**
.43**
.32**
1
AS2 .17**
.20**
.17**
.46**
.27**
.69**
1
AS3 .22**
.22**
.22**
.44**
.28**
.57**
.69**
1
AS4 .30**
.26**
.24**
.40**
.40**
.44**
.46**
.49**
1
AS5 .26**
.38**
.24**
.37**
.30**
.48**
.47**
.55**
.45**
1
**. Correlation is significant at the .01 level (2-tailed)
*. Correlation is significant at the .05 level (2-tailed

252
Appendix O
The EFA Pattern of QUS, PRS, ACS and OPS
Pattern Matrixa
Factor
1 2 3 4
QS2 .83
QS3 .81
QS1 .76
QS4 .75
QS5 .54
PR2 .92
PR1 .82
PR3 .69
AS2 .93
AS1 .74
AS3 .73
OS1 .80
OS2 .74
OS3 .49
Extraction Method: Maximum Likelihood.
Rotation Method: Promax with Kaiser Normalization.
a. Rotation converged in 6 iterations.

253
Appendix P
CFA Model for Silence Dimensions

254
Appendix Q
Common Latent Factor for Silence Dimensions

255
Appendix R
Comparison of Standardized Regression Weights of Pre- and Post-CLF of QUS, PRS, ACS and
OPS
With CLF
Estimate
Without CLF
Estimate Δ
QS2 <--- QUS .786 QS2 <--- QUS .718 -0.068
QS3 <--- QUS .505 QS3 <--- QUS .838 0.333
QS1 <--- QUS .510 QS1 <--- QUS .657 0.147
QS4 <--- QUS .266 QS4 <--- QUS .808 0.542
QS5 <--- QUS .296 QS5 <--- QUS .643 0.347
PR2 <--- PRS .824 PR2 <--- PRS .877 0.053
PR1 <--- PRS .644 PR1 <--- PRS .847 0.203
PR3 <--- PRS .520 PR3 <--- PRS .724 0.204
AS2 <--- ACS .899 AS2 <--- ACS .892 -0.007
AS1 <--- ACS .771 AS1 <--- ACS .770 -0.001
AS3 <--- ACS .753 AS3 <--- ACS .768 0.015
OS1 <--- OPS .766 OS1 <--- OPS .772 0.006
OS2 <--- OPS .747 OS2 <--- OPS .746 -0.001
OS3 <--- OPS .521 OS3 <--- OPS .525 0.004
QS2 <--- CLF .382
QS3 <--- CLF .641
QS1 <--- CLF .462
QS4 <--- CLF .847
QS5 <--- CLF .57
PR2 <--- CLF .43
PR1 <--- CLF .507
PR3 <--- CLF .50
AS2 <--- CLF .031
AS1 <--- CLF .025
AS3 <--- CLF .136
OS1 <--- CLF .086
OS2 <--- CLF .058
OS3 <--- CLF .051

256
Appendix S
Correlation Matrix for Variables Investigated in Part D
PO1 PO2 PO3 PO4 PO5 UN1 UN2 UN3 UN4 UN5 MA1 MA2 MA3 MA4
PO1 1
PO2 .51**
1
PO3 .24**
.32**
1
PO4 .34**
.31**
.25**
1
PO5 .08 .07 .03 .19**
1
UN1 -.03 .08 .05 .09 .06 1
UN2 -.03 .05 -.08 .06 -.02 .40**
1
UN3 .01 .02 -.09 .07 -.02 .35**
.58**
1
UN4 -.04 .07 -.02 -.01 -.06 .28**
.58**
.63**
1
UN5 .01 .01 -.07 -.01 -.09 .32**
.56**
.63**
.69**
1
MA1 .21**
.19**
.10 .13* .04 .02 -.12
* -.08 -.12
* -.07 1
MA2 .14**
.08 .09 -.00 .03 .14**
-.02 -.04 -.01 .00 .35**
1
MA3 .15**
.12* .03 .03 .05 .05 -.06 -.05 .00 .01 .22
** .25
** 1
MA4 .19**
.16**
.10* .20
** .17
** .10 .02 .06 .01 .04 .37
** .32
** .23
** 1
**. Correlation is significant at the 0.01 level (2-tailed).
*. Correlation is significant at the 0.05 level (2-tailed).

257
Appendix T
The EFA Pattern Matrix of UNA, POD and COM
Pattern Matrixa
Factor
1 2 3
UN5 .80
UN4 .80
UN3 .79
UN2 .74
UN1 .45
PO1 .72
PO2 .70
PO4 .47
MA2 .62
MA1 .60
MA4 .55
Extraction Method: Principal Axis Factoring.
Rotation Method: Promax with Kaiser
Normalization.a
a. Rotation converged in 4 iterations.

258
Appendix U
CFA Model of Part D

259
Appendix V
Comparison of Standardized Regression Weights between MLE and Bootstrapping Technique
Parameter MLE Bootstrap Bias
UN4 <--- UNA .828 .826 -.002
UN5 <--- UNA .814 .811 -.002
UN3 <--- UNA .776 .778 .001
UN2 <--- UNA .711 .712 .001
MA1 <--- COM .666 .673 .007
MA4 <--- COM .580 .580 0
MA2 <--- COM .511 .504 -.007
PO2 <--- POD .674 .677 .003
PO1 <--- POD .750 .749 -.001
PO4 <--- POD .459 .462 .003

260
Appendix W
CFA-CLF of UNA, COM and POD

261
Appendix X
Comparison of Standradized Regression Weights Pre- and Post-Common Latent Factor
Pre-CLF
Estimate
Post-CLF
Estimate Δ
UN4 <--- UNA .828 UN4 <--- UNA .826 .002
UN5 <--- UNA .814 UN5 <--- UNA .825 -.011
UN3 <--- UNA .776 UN3 <--- UNA .757 .019
UN2 <--- UNA .711 UN2 <--- UNA .69 .021
PO1 <--- POD .750 PO1 <--- POD .785 -.035
PO2 <--- POD .674 PO2 <--- POD .641 .033
PO4 <--- POD .459 PO4 <--- POD .427 .032
MA1 <--- COM .666 MA1 <--- COM .642 .024
MA2 <--- COM .511 MA2 <--- COM .536 -.025
MA4 <--- COM .580 MA4 <--- COM .606 -.026
UN4 <--- CLF .058
UN5 <--- CLF .008
UN3 <--- CLF .221
UN2 <--- CLF .21
PO1 <--- CLF .013
PO2 <--- CLF .098
PO4 <--- CLF .422
MA1 <--- CLF -.035
MA2 <--- CLF -.153
MA4 <--- CLF .194