Embed Size (px)
Citation preview
University of VermontScholarWorks @ UVM
Graduate College Dissertations and Theses Dissertations and Theses
2014
Exploring the nature of crystals in cheese throughX-ray diffractionGil Fils TansmanUniversity of Vermont, [email protected]
Follow this and additional works at: http://scholarworks.uvm.edu/graddisPart of the Food Science Commons
This Thesis is brought to you for free and open access by the Dissertations and Theses at ScholarWorks @ UVM. It has been accepted for inclusion inGraduate College Dissertations and Theses by an authorized administrator of ScholarWorks @ UVM. For more information, please [email protected].
Recommended CitationTansman, Gil Fils, "Exploring the nature of crystals in cheese through X-ray diffraction" (2014). Graduate College Dissertations andTheses. Paper 321.
EXPLORING THE NATURE OF CRYSTALS IN CHEESE THROUGH X-RAY DIFFRACTION
A Thesis Presented
by
Gil Fils Tansman
to
The Faculty of the Graduate College
of
The University of Vermont
In Partial Fulfillment of the Requirements for the Degree of Master of Science
Specializing in Nutrition and Food Science
October, 2014

Accepted by the Faculty of the Graduate College, The University of Vermont, in partial fulfillment of the requirements for the degree of Master of Science, specializing in Nutrition and Food Science. Thesis Examination Committee:
____________________________________ Advisor Dr. Paul Kindstedt, Ph.D. ____________________________________ Dr. Catherine Donnelly, Ph.D.
____________________________________ Chairperson Dr. John Hughes, Ph.D.
____________________________________ Dean, Graduate College Cynthia J. Forehand, Ph.D. Date: August 28, 2014

ABSTRACT
The optimization of powder x-ray diffraction (PXRD) for the study of cheese crystals was the focus of this study. A survey was conducted of various manifestations of calcium lactate crystals on the rindless surface and within mechanical openings of Cheddar cheese using PXRD. The diffraction reference card database contained a card that was entitled calcium lactate pentahydrate and corresponded to some of the crystalline material found on the cheeses. Diffractions patterns generated from other samples of crystalline material revealed the existence of an unknown crystal that resembled and behaved similarly to calcium lactate pentahydrate, but did not match the reference card.
The existence of two enantiomeric variants of calcium lactate pentahydrate had been firmly established; an experiment was thus designed to determine if the unknown diffraction pattern represented one enantiomeric form, and if the ambiguously named reference card represented the other. This experiment demonstrated that the existing reference card corresponded to calcium DL-lactate pentahydrate and that the unknown diffraction pattern was generated from calcium L-lactate pentahydrate. This study resulted in the proposal of a new reference card for calcium L-lactate pentahydrate and the proposed renaming of the existing card to calcium DL-lactate pentahydrate. This discovery allows the rapid identification of both forms of calcium lactate that form in and on cheese.
In order to conduct the survey and experiment that are described above, the PXRD method needed to be adjusted for use with cheese crystals. Samples of cheese crystals pose a particular challenge because they are often composed of high proportions of moisture, fat, protein, and other amorphous material; these all disrupt the efficient diffraction of crystals and thus needed to be removed or minimized. The removal of water from samples is a particular challenge because some cheese crystals contain water of hydration that may be driven off in the process, thereby destroying the crystals. A protocol for the preparation of cheese samples for PXRD was consequently developed.
ii
CITATIONS
Material from this thesis has been accepted for publication in The Journal of Dairy Science on September 15, 2014 in the following form: Tansman, G., Kindstedt, P.S., Hughes, J.M. Powder X-ray diffraction can differentiate between enantiomeric variants of calcium lactate pentahydrate crystals in cheese.
iii
ACKNOWLEDGEMENTS
This work was made possible by the generosity of my mentors, teachers, fellow graduate
students, and loved ones. Without the interminable attention and nurturing of my
research advisor, Dr. Paul Kindstedt, I would not have discovered the joy of scientific
investigation in this field of study that I love. Dr. Kindstedt is the central pillar in the
structure of my academic endeavor.
Dr. John Hughes, who devoted a bounty of his energy to this work, demonstrated the
extent to which academic curiosity can transcend disciplines. I am truly indebted to Dr.
Hughes for his benevolence and beneficence.
I offer my sincere gratitude to Dr. Catherine Donnelly for serving on my defense
committee and for providing her expertise and feedback.
Serach Eladia -- my wife and life partner. It is in the shadow of your essence that I
accomplish anything.
iv
TABLE OF CONTENTS
CITATIONS .................................................................................................................................. ii ACKNOWLEDGEMENTS ........................................................................................................ iii CHAPTER 1: COMPREHENSIVE LITERATURE REVIEW ................................................ 1 1.1. Inorganic Calcium-‐Containing Crystals in Milk and Cheese ....................................... 1 1.2. Calcium Phosphate Crystals in Surface Ripened Cheese ............................................. 6 1.3. Formation of Calcium Lactate Crystals ............................................................................ 10 1.4. The Effects of Sanitation and Pasteurization on CLP formation ............................. 16 1.5. Promoting the Formation of CLP within the Cheese Matrix ..................................... 19 1.6. Amino Acid Crystal Formation ........................................................................................... 22 1.7. Development and Historical Use of XRD in Cheese Research .................................. 25 1.8. References ................................................................................................................................. 31
CHAPTER 2: POWDER X-‐RAY DIFFRACTION CAN DIFFERENTIATE BETWEEN ENANTIOMERIC VARIANTS OF CALCIUM LACTATE PENTAHYDRATE CRYSTALS IN CHEESE ................................................................................................................................ 38 2.1. ABSTRACT ................................................................................................................................. 38 2.2. INTRODUCTION ....................................................................................................................... 39 2.3. MATERIALS AND METHODS ................................................................................................ 42 2.3.1. Synthesis of DL-‐CLP Crystals ....................................................................................................... 42 2.3.2. CLP Crystals from Cheese ............................................................................................................. 43 2.3.3. Compositional Analysis of CLP Crystals ................................................................................. 44 2.3.4. Diffraction Pattern of CLP Crystals ........................................................................................... 46 2.3.5. Statistical Analysis ........................................................................................................................... 46
2.4. RESULTS ..................................................................................................................................... 47 2.4.1. Characterization of Synthetic DL-‐CLP ..................................................................................... 47 2.4.2. New Reference Card for Calcium L-‐lactate Pentahydrate ............................................... 49 2.4.3. Characterization of CLP Crystals from Cheese ..................................................................... 49
2.5. DISCUSSION ............................................................................................................................... 51 2.5.1. PXRD to Determine the Degree of Dehydration of Laboratory Synthesized CLP . 51 2.5.2. Synthesis of a new CLP Variant .................................................................................................. 51 2.5.3. PXRD to Distinguish Between CLP Variants from Cheese Samples ............................ 52
2.6. CONCLUSION ............................................................................................................................. 54 2.7. ACKNOWLEDGEMENTS ......................................................................................................... 54
CHAPTER 3: ENHANCING THE USE OF POWDER X-‐RAY DIFFRACTION TO IDENTIFY CRYSTALS IN CHEESE ...................................................................................... 66 3.1. Abstract ...................................................................................................................................... 66 3.2. Technical Note ......................................................................................................................... 66 3.3. References ................................................................................................................................. 76
4.1. Comprehensive Bibliography ................................................................................... 85

1
CHAPTER 1: COMPREHENSIVE LITERATURE REVIEW
1.1. Inorganic Calcium-Containing Crystals in Milk and Cheese
Crystals of different sizes and compositions exist in cheese. They impact cheese
chemistry, aging, and sensory characteristics. Inorganic salts play a critical role in the
formation of curds and the maturation of cheese. Several different salts have been
documented, and theories have been developed about their chemistries and precise
compositions. In particular, calcium salts are central to the “submicelle model” of casein,
which describes calcium microcrystals that bind these important proteins together. In
addition, maturation of cheese and concentration of cheese serum cause several cheese
compounds to form solid precipitates on exposed surfaces within the cheese matrix and
on external surfaces of rindless cheeses.
Inorganic calcium salts naturally exist in complex equilibria with several
compounds in fresh milk (Fox et al., 2000). Calcium is present in milk at high enough
concentrations that it naturally exceeds its solubility. Ionic calcium (Ca2+) only accounts
for approximately 10% of the total calcium in milk (Fox et al., 2000). The rest of the
calcium is complexed with either phosphate, citrate, or exists in calcium-phosphate-
casein complexes known as colloidal calcium phosphate (CCP) (Fox et al., 2000).
Approximately 66% of calcium in fresh milk exists at CCP. Although the
precise interactions between CCP and casein have not been fully documented, it is
theorized that CCP somehow stabilizes casein micelles (Fox, 1993) by forming
complexes with casein phosphate (Fox et al., 2000). Phosphate in CCP can either be
associated with phosphoserine residues on caseins or it can be unassociated phosphate
2
(Agarwal et al., 2006a). The precise chemical composition of CCP has not been
determined, but one theory proposed that calcium binds with casein phosphate to form
microcrystals of brushite, CaHPO4.2H2O (Fox et al., 2000). The “submicelle model”
describes protein aggregates bound together by colloidal calcium phosphate to form large
casein micelles (Fox et al., 2000).
When CCP is experimentally removed from micelles, the micelles become
unstable and change conformation, so that they are no longer sensitive to rennet (Fox,
1993). This is a critical point, as all renneted milk must initially contain a threshold CCP
content in order to form a gel. CCP is solubilized by acidification; in fact, acid curds
contain no CCP at all (Fox et al., 2000); however, the mechanism for acid curd formation
is different from rennet coagulation and will not be discussed here.
It is notable, however, that increased acidity shifts calcium from the colloidal
state to the soluble state and increases the concentration of ionic calcium in solution (Fox
et al., 2000). Protons from acidic entities displace colloidal calcium (Kindstedt, 2005) and
greater acidity increases the solubility of brushite in solution (Ferreira et al., 2003); both
processes push calcium into the soluble state. Acidification also decreases binding of
calcium to citrate and phosphate, as these entities provide buffering against milk
acidification (Fox et al., 2000). After curd formation, prolonged acidification continues to
drive CCP into the soluble state (Swearingen et al., 2004).
Calcium phosphate deposits, in the form of crystalline brushite, have been
observed by several researchers on various surfaces of cheese (Conochie and Sutherland,
1965, Tansman et al., 2013). In general, certain conditions promote the formation of

3
crystals; the components of a crystalline entity must exceed the solubility of that entity
(Rajbhandari and Kindstedt, 2005); nucleation sites must provide a place for crystal
growth to begin (Swearingen et al., 2004); and physical space, in the form of an open
structure or exposed surface, must provide room for the crystal deposit to grow (Johnson
et al., 1990b).
In the case of brushite, both calcium and phosphate must be in high enough
concentrations to exceed the solubility of brushite. As stated previously, solubilization of
CCP increases ionic calcium levels in the cheese serum. Fermentation of residual lactose
after pressing can greatly increase the concentration of ionic calcium (Blake et al., 2005).
If serum calcium and phosphate levels are sufficiently high, brushite crystallization is
expected; however, calcium and phosphorus retention in cheese is a complex chemistry
that depends on initial concentrations of those entities as well as the particular
acidification regimen (Keller et al., 1974)
Specific chemical conditions within an aging cheese may affect the formation of
some crystals. Brushite solubility is very sensitive to changes in acidity, with lower
acidities greatly diminishing its solubility in solution (Ferreira et al., 2003). Acidity levels
may shift over the course of aging, especially in bloomy rind and washed rind varieties
(Fox, 1987). In those varieties, the acidity at the rind decreases faster than the acidity at
the center of the cheese. It is thus not surprising that insoluble calcium phosphate crystals
form below the rinds of bloomy rind cheeses during aging (Fox, 1987).
Brushite has also been observed in curd granule junctions of Cheddar cheese
(Conochie and Sutherland, 1965). This condition is referred to as “seaminess” and is
4
considered a manufacturing defect. According to Conochie and Sutherland (1965), the
physical parameters necessary for crystal nucleation and growth (i.e. saturation,
nucleation, and crystal growth) seem to be satisfied.
Conochie and Sutherland (1965) concluded that improper salting of milled
Cheddar curds results in seaminess. The impact of salting on brushite crystallization is
multifaceted. If salt application is too heavy, which is commonly the case when milling
size is large (Conochie and Sutherland, 1965), water is drawn out of the surface of the
curds by osmosis. Conochie and Sutherland (1965) demonstrated that whey that is
removed during heavy salting is more dilute with respect to calcium and phosphorus than
the cheese serum within the curds. This effectively concentrates calcium and phosphorus
in the serum. If the salting process causes sufficient removal of water through osmosis,
then brushite crystallization is possible.
Although Conochie and Sutherland (1965) did not explicitly identify any
nucleation sites in their system, the surfaces of curd granules likely act like any other
surfaces where crystallization has been observed. Rajbhandari and Kindstedt (2008)
speculated that the contact points between Cheddar cheese surfaces and packaging
materials could provide suitable nucleation sites for calcium lactate crystals; so too, curd
junctions could conceivably provide adequate nucleation sites for brushite crystals,
especially if the curds do not properly fuse.
Conochie and Sutherland (1965) further noted that improperly salted Cheddar
curds do not fully fuse. After overnight pressing, Cheddar curds usually fuse into a
uniform mass. Their experiments showed that any substance that forms a barrier between
5
curds during pressing would prevent full fusion of curd granules. Conochie and
Sutherland (1965) demonstrated that excessive moisture, and even sand, could prevent
fusion.
In Cheddar production, improper salting causes dehydration of curd granule
surfaces. When these curd granules are pressed, a thin layer of heavily salted whey
containing undissolved salt crystals creates a barrier between curd granules (Conochie
and Sutherland, 1965). This leads to openness between the curd granules where brushite
crystals form and cause seaminess. Conochie and Sutherland (1965) found that salting
milled curd at a high pH was a major cause of seaminess because it led to excessive
release of calcium and phosphate into the curd serum and encouraged super-saturation of
calcium and phosphate in the cheese serum.
6
1.2. Calcium Phosphate Crystals in Surface Ripened Cheese
Brushite is just one of many calcium phosphate crystals that exist in nature.
Within the last half century, a theory was developed that linked the formation of an
unidentified form of crystalline calcium phosphate to the softening of surface ripened
cheeses. Cheese researchers developed a theory that the softening of these cheeses was
caused by the diffusion of calcium and phosphate out of the cheese center to the rind (Le
Graet et al., 1983); this idea challenged the previously held notion that proteases derived
from surface microflora caused cheese softening by digesting the casein matrix (Noomen,
1983).
The question remained as to what drove the diffusion of calcium and phosphorus
and what became of accumulated minerals once they were concentrated near the rind.
Several authors devised experiments that came to the same conclusion that a pH gradient,
resulting from proteolysis and ammonia production at the surface of the cheese, caused
the diffusion of calcium and phosphorus toward the rind (Le Graet et al., 1983, Noomen,
1983, Karahadian and Lindsay, 1987).
According to calculations made by Gaucheron et al. (1999), after extensive
diffusion of calcium and phosphorus to the surface of model cheeses, the solubilities of
several calcium and magnesium salts should be exceeded. Brooker (1987) used
phosphate staining along with light microscopy to observe that the distribution density of
phosphate containing crystals increased with distance toward the rind. Brooker (1987)
also used scanning electron microscopy to obtain x-ray mapping, which confirmed that
the crystals were indeed calcium phosphate. Using transmission electron micrographs,
7
Brooker (1987) observed a consistent interaction between crystals and fungal hyphae
from surface microflora; these data suggested that hyphae at the mold-cheese interface
provide a nucleation sites for the calcium phosphate crystals to form. Karahadian and
Lindsay (1987) reported that large, perceptible calcium phosphate crystals formed at the
surface of bloomy rind cheeses that were inoculated with P. caseicolum when B. linens is
excluded. This phenomenon is not often observed, but grittiness, possibly attributed to
calcium phosphate crystals, is often observed at the surface of washed rind cheeses
(personal communication with cheese mongers).
It is unclear whether the identity of the crystals affects the final size and thus the
perceived mouthfeel of the crystals. Despite the bounty of electron micrographs of
surface ripened cheeses, which provide excellent morphological data on crystals, the
exact identity of the calcium phosphate crystals has not been determined (Boutrou et al.,
1999). Some authors used x-ray spectroscopy to obtain semi-quantitative compositional
data, but the data were not sufficient to determine the identity of the crystals (Brooker,
1987; Morris et al., 1988). Gaucheron et al. (1999) used atomic absorption spectrometry
to measure a Ca/P ratio of 2/1 at the surface of their model cheeses; they speculated that
this ratio suggests the presence of tricalcium phosphate, which has a mass ratio of 1.93.
However, this conclusion necessitates several additional questions; although calcium
phosphate describes a mineral by its chemical composition, it is insufficient to identify
the crystal entity. There are several crystals that have a Ca/P of approximately 2, but that
form under different conditions. Le Graet et al. (1983) found that the surface of
Camembert cheese had a Ca/P ratio of 1.87 and Tansman et al. observed that the surface
8
of a washed rind cheese had a Ca/P of 2.3. Furthermore, the diversity of ripening
conditions that this class of cheeses experiences may alter the chemical environment at
the surface of the cheese, as demonstrated by storage in an ammoniacal atmosphere
(Gaucheron et al., 1999) and by the influence of different surface microflora (Karahadian
and Lindsay, 1987); different chemical conditions could potentially impact the type of
calcium phosphate crystals that form.
Although the consensus that a pH gradient drives the diffusion of calcium of
phosphate minerals remains unchallenged, several other factors may be at play. It is
unlikely that the neutralization of acidity at the surface of these cheeses causes the
diffusion of calcium and phosphate to the surface, as these ions are typically less soluble
at neutral pH. It is more likely that the removal of calcium and phosphate from solution
through crystal formation and growth is the driving force. To draw an analogy, Johnson
et al. (1990b) observed that only calcium DL-lactate crystals formed when as little as
25% of lactate was in the D form. This crystallization represents a disproportionate
removal of D-lactate from solution through crystallization of that entity from the cheese
serum. Similarly, if the formation CaP crystals of varying Ca/P ratios relied on chemical
conditions other than the ratio of calcium and phosphate in solution, the disproportionate
removal of either calcium or phosphate from the cheese serum could characteristically
drive the diffusion of these minerals. Although this scenario parallels the phenomenon
that was observed by Johnson et al. (1990b), this concept makes the assumption that
diffusion of calcium and phosphate is driven by the formation of CaP crystals and not just

9
by the formation of a pH gradient; this point has not been addressed and indicates the
need for further work in this area.
10
1.3. Formation of Calcium Lactate Crystals
Calcium lactate pentahydrate (CLP) crystals are formed when calcium and
lactate exceed the solubility of CLP in a given cheese serum. Lactate, which is the
conjugate base of lactic acid, is not native to milk, and is fermented from lactose by lactic
acid bacteria (LAB) over the course of cheesemaking and early aging (Fox, 1993). As
lactose is fermented, the acidity of the cheese-milk, and after coagulation the whey,
increases. Thus, the production of lactic acid by LAB simultaneously causes CCP to
dissolve and release soluble calcium. The processes of lactate formation and calcium
release are bound and occur steadily throughout the cheesemaking process. Cheddar
producers often have difficulties optimizing these processes, which frequently leads to
undesirable CLP crystallization (Agarwal et al., 2008).
Agarwal et al. (2006b) demonstrated that cheese-milk that was purposely
inoculated with Lb. curvatus yielded Cheddar cheese that formed CLP on exposed
surfaces within a short time after manufacture. Rapid CLP formation was attributed to
certain NSLAB species, notably Lb. curvatus, which rapidly racemize lactate. It has been
demonstrated that CLP crystals form more frequently in cheeses that contain both L(+)-
lactate and D(-)-lactate (Johnson et al., 1990b).
Two different types of CLP can form on cheese; calcium L-lactate pentahydrate
(L-CLP) and calcium DL-lactate pentahydrate (DL-CLP) (Agarwal et al., 2005). DL-CLP
is much less soluble than L-CLP (Cao et al., 2001). Thus, cheese serum that contains both
L(+)-lactate and D(-)-lactate has a lower saturation point for CLP than cheese serum that
contains only L(+)-lactate. Cheese serum that is racemic for lactate will thus reach the
11
saturation point for CLP at lower concentrations of lactate and soluble calcium. Both the
starter culture and NSLAB have an impact on the concentrations of L(+) and D(-) that
result in the finished product.
When D(-)-lactate comprises as little as 25% of serum lactate, crystals of
calcium DL-lactate pentahydrate (DL-CLP) preferentially form (Johnson et al., 1990b).
DL-CLP is comprised of a racemic mixture of lactate. In contrast, when little D(-)-lactate
is present in cheese serum, crystals of calcium L-lactate pentahydrate (L-CLP)
preferentially form. This phenomenon is likely due to differences in solubility between
the two CLP variants; DL-CLP is much less soluble than L-CLP (Cao et al., 2001) and
will thus crystallize from solutions that contain less dissolved calcium and lactate.
Starter cultures are responsible for the majority of lactose fermentation,
especially in high quality milk that does not contain high quantities of NSLAB (Crow et
al., 2001). Starter cultures are usually homofermentative, which means that they produce
exclusively L(+)-lactate from lactose (Chou et al., 2003). In contrast, some
heterofermentative bacteria produce both L(+)-lactate and D(-)-lactate from lactose.
Heterofermentative bacteria are sometimes included in starter culture cocktails because
they may produce desirable sensory properties (Poveda et al., 2003) although this practice
is not exceedingly common. The extent to which heterofermentative bacteria, whether
they are starter cultures or adventitious NSLAB, produce D(-)-lactate depends on the rate
at which they ferment lactose and how quickly the lactose is depleted.
Mature Cheddar cheese may contain trace amounts of D(-)-lactate and large
quantities of L(+)-lactate (Swearingen et al., 2004). Such a scenario likely indicates that a
12
small population of heterofermentative bacteria converted lactose to D(-)-lactate during
manufacturing, but ceased to produce it once the residual lactose was depleted. The
amount of time necessary for complete depletion of residual lactose in cheese depends on
several factors including aging temperature, salt-in-moisture, and the size of the bacterial
population (Blake et al., 2005).
The other source of D(-)-lactate is racemization by NSLAB (Thomas and Crow,
1983). In order for this phenomenon to occur, racemase-positive bacteria must inhabit the
cheese matrix; however, the initial population of racemase-positive bacteria does not
need to be very large to cause vigorous lactate racemization, as NSLAB numbers can
increase greatly during early aging (Thomas and Crow, 1983).
Although the precise mechanism of racemization is unknown, researchers have
demonstrated that racemization involves the conversion of L(+)-lactate to D(-)-lactate by
a pair of stereospecific lactic acid dehydrogenase enzymes (Thomas and Crow, 1983).
Racemization of lactate in cheese is temperature dependent, and will fluctuate depending
on the aging temperature, but under standard Cheddar aging temperatures, complete
racemization of lactate can occur in as little as 19 days after manufacture (Thomas and
Crow, 1983), assuming that racemase-positive bacteria are present.
Most physical parameters in Cheddar cheese, such as salt content and pH, are
ideal for racemase activity; in order to inhibit racemization, the salt in moisture content
would need to be unacceptably high (Thomas and Crow, 1983). It is apparent that the
most effective way to prevent lactate racemization is to maintain strict sanitation during
milk handling and to prevent racemase-positive NSLAB from contaminating cheese-milk
13
(Blake et al., 2005). If racemase-positive bacteria are present in cheese-milk, the
complete racemization of lactate is inevitable (Johnson et al., 1990b).
Raw milk cheese is more susceptible to lactate racemization that pasteurized-
milk cheese because initial NSLAB populations are typically much higher in raw milk
(Johnson et al., 1990b). The potential for contamination with racemase-positive NSLAB
in raw milk is consequently much higher. Thus raw milk Cheddar producers need to
focus on parameters other than lactate racemization if they wish to prevent CLP
crystallization.
Although the saturation point for CLP is higher in Cheddar cheeses that do not
contain D(-)-lactate, exceedingly high concentrations of L(+)-lactate and soluble calcium
may nonetheless cause CLP formation. Conversely, cheeses that contain racemic lactate
need not form CLP if the concentrations of total lactate and soluble calcium are within
the solubility range of DL-CLP. A great deal of research has been performed to
determine how to minimize total lactate and soluble calcium in cheese serum. The
microbiology, and specifically the rate of acid production by starter cultures, is central to
reducing calcium and lactate concentrations in cheese serum.
The rates at which the starter culture and NSLAB ferment residual lactose to
lactic acid determine the amount of total lactate in the cheese serum. If starter cultures
cease acid production at relatively low salt-in-moisture levels, residual lactose will be
converted to lactate slowly by NSLAB, and lactate levels will remain low for some time
(Johnson et al., 1990a). Although most of the residual lactose will eventually be
fermented, albeit at a slower pace, this can give distributers an opportunity to market their
14
cheeses before the onset of crystallization, especially if the cheese is sold relatively
young (Johnson et al., 1990b). In aged cheeses of course, this is not an option.
For producers of aged Cheddar cheese, it is critical to remove as much lactose
from the cheese as possible during the make procedure. This is achieved by using a
starter that vigorously acidifies the curds before drainage and milling. Blake et al. (2005)
recommended drainage and milling pH values of 6.0 and 5.3 respectively. This
effectively allows the manufacturer to remove large quantities of lactate from the curds in
the drained whey before pressing seals the cheese. In addition to removing critical
quantities of lactate, high drainage and milling acidities promote the dissolution of
colloidal calcium and the subsequent removal of the soluble calcium in the drained whey
(Swearingen et al., 2004). By fermenting large quantities of lactose and removing the
resulting lactate in the drained whey, starter cultures have less residual lactose to ferment
after pressing, which reduces the concentration of lactic acid in the cheese serum. In
addition, removing calcium from the colloidal state during cheesemaking, by extension,
reduces the amount of calcium that is available to enter the soluble state after pressing.
Increased levels of lactate and calcium in the cheese serum increase the probability of
CLP formation during aging (Kubantseva et al., 2004), and a high milling acidity has
been shown experimentally to prevent CLP formation (Blake et al., 2005).
As stated previously, if lactate and calcium concentrations are too high, even
cheeses that contain only L(+)-lactate can form CLP. This has been observed in
commercially produced Cheddar cheeses (Agarwal et al., 2005, Agarwal et al., 2006a).
Agarwal et al. (2006a) argued that new manufacturing practices such as ultra-filtering
15
milk, concentrating milk through reverse osmosis and evaporation, and adding nonfat dry
milk to cheese-milk has led to an increase in L-CLP occurrence. Although concentrating
milk may encourage CLP formation, Agarwal et al. (2006a) also demonstrated that CLP
formation can be mitigated through vigorous acid development during cheesemaking,
even in cheeses made from concentrated milk.
16
1.4. The Effects of Sanitation and Pasteurization on CLP formation
Some cheesemaking facilities may variably produce batches of Cheddar cheese
that are racemic for lactate and batches that contain negligible D(-)-lactate. This would
reflect variable inoculation with racemase-positive NSLAB. Somers et al. (2001) found
that postpasteurization contamination provided the main entry of NSLAB, including
heterofermentative NSLAB and racemase-positive NSLAB, into cheese-milk. Once these
bacteria inoculate cheese-milk, they undoubtedly racemize lactate (Johnson et al., 1990b).
Somers et al. (2001) found that some of these NSLAB form biofilms and could survive
some sanitation procedures. In such cases, a single inoculation could cause contamination
of subsequent batches and cause DL-CLP crystals to form perpetually.
NSLAB inoculation is variable (Fox et al., 2000) and the species of NSLAB that
exist in a particular environment may change depending on a variety of factors. Picture
the scenario of a Cheddar cheese facility that was troubled by the appearance of DL-CLP
over an extended amount of time but suddenly find that cheeses produced there no longer
contain racemic lactate or form DL-CLP crystals. This scenario could occur if the
NSLAB that is responsible for the racemization and biofilm formation were from an
outside source. A change in the facility’s sanitation regimen, or even more vigorous
scrubbing during a single sanitation could eliminate the biofilm and prevent subsequent
contamination (Somers et al., 2001).
If a biofilm of racemase-positive NSLAB existed somewhere in the cheese plant
that was more difficult to sanitize, such as in a pasteurizer (Bouman et al., 1982), or in
certain types of cheese vats that are difficult to clean (Somers et al., 2001), complete
17
elimination of the biofilm would be difficult and racemization would not likely abate. In
order to fully eliminate the biofilm and prevent successive contamination, the source of
the contamination would have to be pinpointed and vigorously sanitized.
In raw milk cheese, inoculation with racemase-positive NSLAB is more likely
than in pasteurized milk cheese because the general load of NSLAB tends to be larger in
raw milk (Johnson et al., 1990b). It is possible, however, that some batches of raw
cheese-milk could avoid inoculation with racemase-positive NSLAB. Raw milk Cheddar
cheese operations likely have much more variable DL-CLP formation than Cheddar
cheese operations that use pasteurized milk. Further research is needed to determine the
specific efficacy that pasteurization has on racemase-positive NSLAB, and the frequency
that raw milk is contaminated with racemace-positive bacteria. Pasteurization greatly
diminishes the general population of NSLAB, and kills organisms that cause other quality
defects (Fox et al., 2000), thus it is logical that pasteurization is efficient at eliminating
many strains of racemase-positive NSLAB that cause DL-CLP formation.
In addition to management choices, such as the use of raw or pasteurized milk,
or selection of a sanitation regimen, other management practices that affect milk
chemistry may also impact the formation of calcium lactate crystals. The decision to
fortify cheese-milk with powdered milk solids, for instance, may promote the formation
of CLP deposits on cheese because it results in higher residual calcium and lactate levels
in finished cheeses (Agarwal et al., 2006a).
Small differences in make procedure schedules between different Cheddar
cheese producers may also impact the formation CLP deposits. Several authors have
18
noted that draining and milling curds at low acidities promotes the formation of CLP,
regardless of whether or not racemization of lactate has occurred (Dybing et al., 1988,
Blake et al., 2005). Thus, Cheddar producers may experience varying degrees of CLP
formation depending on differences in their equipment, milk quality, and manufacturing
practices.
19
1.5. Promoting the Formation of CLP within the Cheese Matrix
Although surface CLP crystallization is not a desirable characteristic, even on
artisan Cheddar cheese, consumer rejection seems to be a matter of visual perception
rather than a rejection of the sensory characteristics of crystals in general (Agarwal et al.,
2006b). In fact, CLP crystals that infrequently form as small aggregates within Cheddar
cheese are well received by consumers (personal communication with a local cheese
monger). It would appear that the rejection of surface CLP deposits on Cheddar cheese
stems from a lack of consumer familiarity with the phenomenon and the perception that
surface crystals look like fungal growth (Agarwal et al., 2006b).
Artisan Cheddar cheese is particularly prone to DL-CLP formation because it is
often made with raw milk. As stated previously, raw milk contains a higher incidence of
racemase-positive bacteria. In order to make CLP deposits more acceptable to consumers,
artisan Cheddar producers may consider strategies to promote the precipitation of DL-
CLP into small internal aggregates that are acceptable to consumers. According to
Agarwal et al. (2005), crystallization of CLP into aggregates within cheeses reduces
surface crystallization on exposed surfaces. Cheesemakers can capitalize on the balance
between internal and external CLP deposits to prevent external CLP while promoting
desirable internal CLP crystals.
Appropriate adjunct cultures would be useful for promoting the type of internal
aggregation mentioned by Agarwal et al. (2005). Although no such procedure has been
published, the literature seems to indicate that it is feasible. Certain NSLAB strains can
20
contribute to chemical and physical phenomena that may promote the formation of
internal DL-CLP aggregates.
In order to ensure the consistent formation of crystals, the racemization of
lactate must be predictable. To achieve this, cheesemakers could add an adjunct culture
containing Lb. curvatus, as Agarwal et al. (2006b) did experimentally, or some other
species of NSLAB that fully racemizes lactate. Although it has been demonstrate that raw
milk often contains NSLAB that racemize lactate (Johnson et al., 1990b), it would not be
prudent for cheesemakers to rely on racemization to happen by chance; isolating reliable
NSLAB and adding them to cheese-milk mitigates the chance of failure.
The nucleation environment must also be optimized as DL-CLP aggregates will
not form within Cheddar cheese unless mechanical openings in the matrix allow
nucleation and growth of crystals (Johnson et al., 1990b). Certain heterofermentative
NSLAB produce sufficient quantities of carbon dioxide early in the cheesemaking
process; this gas helps to promote an open curd structure (Somers et al., 2001) that
provides the physical conditions for internal DL-CLP nucleation and crystal growth.
The most logical place to culture desirable NSLAB is from cheeses that display
desirable traits. Crow et al. (2001) used this strategy to isolate NSLAB from Cheddar that
had good flavor. Likewise, one could isolate gas-producing heterofermentative NSLAB
from cheeses that displayed the desirable amount of openness. NSLAB populations shift
over the course of aging (Crow et al., 2001); therefore, cheeses of various ages would
have to be used to isolate NSLAB that predominate during particular times during aging.
21
NSLAB could be isolated and screened for ideal growing conditions and
undesirable traits using the methods employed by Crow et al. (2001). Crow et al. (2001)
isolated NSLAB using Selective Rogosa Agar; they then screened the strains for lipolytic
and proteolitic activity by plating on caseinate and tributyrin agars and assaying the
breakdown products of the media. They tested the NSLAB strains for acid, salt, and
temperature effects and produced sample cheeses to evaluate whether or not the adjuncts
produced off-flavors.
Theoretically, if isolated NSLAB strains showed potential as adjunct cultures to
promote the formation of crystals, they could be cultured in an appropriate nutrient broth,
separated by centrifugation, and desiccated in a freeze drier under vacuum (Carvalho et
al., 2002). This would produce what is known as DVI cultures that could be used by
cheesemakers to directly inoculate their cheese-milk. Ideal inoculation rates would need
to be determined experimentally.

22
1.6. Amino Acid Crystal Formation
Not all crystal formation is viewed as a defect. In some cheeses, such as aged
Gouda and Parmigiano-Reggiano, desirable crystalline deposits may form from the
accumulation of amino acid deposits (Zannoni et al., 1994, Tansman et al., 2013).
Various crystallized amino acids have been observed including tyrosine (Zannoni et al.,
1994), cysteine (Harper et al., 1953), and leucine (Harper et al., 1953).
The process of amino acid nucleation and crystal growth is not as well
documented as CLP crystallization, but one may assume that the general concept is
similar. Most of the past research that has contributed to the understanding of amino acid
crystallization examined how amino acids accumulate in the cheese serum. Just as is the
case with CLP and brushite, crystallization of amino acids seems be a matter of
exceeding threshold solubility before crystallization is possible.
Kosikowski (1951) found that small quantities of free amino acids could be
detected in cheese immediately after manufacturing. Additionally, Tuckey and Ruehe
(1938) found that proteins in Cheddar cheese are uniformly digested during aging, and
that the result of protein hydrolysis is a steady free amino acid accumulation. It appears
that the release of amino acids from cheese proteins is nonselective; Silverman and
Kosikowski (1955) noted that the relative quantities of amino acids released during aging
are proportional to their occurrence in casein.
It was observed that raw milk cheeses display a more rapid increase in free
amino acid accumulation than comparable pasteurized milk cheeses (Silverman and
Kosikowski, 1955). It may be concluded that amino acid liberation is the result of the

23
general proteolysis of NSLAB during ripening cheese. Although starter cultures are
important during manufacturing as well, they die during early aging and NSLAB
typically dominate the aging process (Agarwal et al., 2006b).
The fact that only some amino acids appear to form crystalline deposits may
pose a challenge to the claim that amino acids are proportionally liberated from casein;
however, selective crystallization of amino acids can be explained by the vastly different
solubilities of amino acids. In addition, microbial transformation of certain amino acids
after they are liberated diminishes the concentrations of those amino acids in solution,
and prevents them from salting out; these points will be depicted below using specific
amino acids as examples.
Some amino acids that are relatively insoluble and are abundant in cheese do not
crystallize in cheese. This phenomenon can be attributed to the transformation of certain
amino acids by NSLAB. For instance, glutamate is fairly insoluble (Amend and
Helgeson, 1997) and abundant in cheese (Fox et al., 2000), and is indeed released
proportionally by protein hydrolysis (Kosikowski, 1951); however, glutamate is often
metabolized by NSLAB shortly after it is released from hydrolyzed protein (Kosikowski,
1951, Crow et al., 2001), and likely does not often exceed its solubility threshold in
cheese.
Leucine should also theoretically form crystal deposits based on its low
solubility (Amend and Helgeson, 1997) and abundance in cheese (Fox et al., 2000);
however, grainy leucine deposits, as would be expected, have not been mentioned in the
literature. Nonetheless, leucine does appear to crystallize in some cheeses, although

24
crystalline deposits of leucine are unique and may not be identified as crystalline without
proper analytical equipment; Bianchi et al. (1974) noted that high concentrations of
leucine form large “spots” in Parmigiano-Reggiano, and Tansman et al. (2013) noted that
the same phenomenon exists in in aged Gouda cheese. Tuckey and Ruehe (1938)
observed crystal diffraction patterns from samples of Cheddar cheese that did not contain
crystals, which suggests that leucine may form sub-visible crystals in some Cheddar
cheeses.
Visible and abundant tyrosine crystals form in some aged cheeses and yet not
form at all in others. Tyrosine is interesting because of its particularly low solubility
(Blake et al., 2005). Notably, while tyrosine crystal aggregates form in Gouda and
Parmigiano-Reggiano, tyrosine aggregates are not observed in cheddar Cheeses of similar
age (Tansman et al., 2013). This can be explained by the observation that Cheddar cheese
often contains NSLAB that convert tyrosine to tyramine (Marth, 1963). In contrast,
Kosikowski and Dahlberg (1954) did not find any tyramine produced in Gouda cheese.
Thus, it may be suggested that certain manufacturing practices, for instance high cooking
temperatures, inhibit the NSLAB that transform tyrosine to tyramine, and as a result,
tyrosine accumulates and crystallizes in some cheeses and not in others.
25
1.7. Development and Historical Use of XRD in Cheese Research
Powder X-ray Diffraction (PXRD) is a powerful technology that can be
harnessed to generate information about crystalline phases. Although various forms of
PXRD have been available for decades, powerful computing technology and advances in
instrument design have recently made PXRD a user-friendly tool. PXRD and its
accompanying software have become so user-friendly that a variety of disciplines have
adopted its use for analytical and qualitative research. Notable among these disciplines,
are dairy-food research, and more specifically quality control in cheese.
Dairy-food scientists have used PXRD for decades to identify crystals on cheese
products. Between 1930 and 2013 there were at least eight papers published in the
Journal of Dairy Science (the preeminent dairy research journal in the United States) that
used PXRD to examine crystals in cheese (Tuckey and Ruehe, 1938, Tuckey et al., 1938,
Harper et al., 1953, Scharpf and Michnick, 1967, Severn and Johnson, 1986, Dybing et
al., 1988, Chou et al., 2003, Agarwal et al., 2006b).
An early description of crystals on cheese appears in a 1909 technical manual
entitled The Science and Practice of Cheese-Making (Van Slyke and Publow, 1909) in
which the authors speculate on the composition of “white particles” found on Cheddar
cheese. The particles were chemically analyzed and appeared to contain large amounts of
calcium. Due to the smear-able texture of the particles, the authors concluded that they
are a combination of calcium and fatty acids, which they called “calcium soaps.”
Shortly thereafter, William Lawrence Bragg developed Bragg’s law, and subsequently, x-
ray diffraction became available to researchers. In 1938, researchers used x-ray
26
diffraction to generate d-values for crystals that they isolated from Cheddar cheese and
claimed that the interplanar spacings matched those of calcium lactate (Tuckey et al.,
1938). Little detail was given in the publication about the origin of the calcium lactate
standard that was used to make the comparison; in addition, it is unclear how the
researchers were able to narrow their search for comparable reference diffraction patterns
in the database. It is also unclear how extensive the database of reference diffraction
patterns was in 1938. Although the database was certainly a morsel of what it is today,
manually finding a match must have been a considerable undertaking.
Several important observations can be made here: notably, a reference
diffraction pattern for “calcium lactate” was available in 1938, and secondly, an effective
method was in place to match generated diffraction patterns with reference diffraction
patterns. It should further be noted that the reference diffraction pattern for “calcium
lactate pentahydrate” (Folen, 1975) that currently resides in the ICDD apparently
replaced this earlier reference pattern for unknown reasons. Although the original
reference pattern is lost to time, Tuckey et al. (1938) also published select d-values from
the reference pattern for comparison. The reference spacings do not perfectly match the
reference pattern published later by Folen (1975), although it is difficult to tell for certain
because Tuckey et al. (1938) only included a partial reference diffraction pattern in their
publication.
The reference diffraction pattern entitled “calcium lactate” that was available in
1938 was ambiguously named. The problem of ambiguously named reference diffraction
patterns seems to have misguided cheese researchers for decades. ‘Calcium lactate’ can
27
refer to many crystalline and non-crystalline compounds that form under various
conditions and have different reactivities, solubilities, and diffraction patterns (Sakata et
al., 2005). Calcium lactate can vary in the proportion of calcium and lactate to associated
water, and can exist in a non-crystalline amorphous form. Calcium lactate can also vary
in the enantiomeric configuration of its lactate molecules. Although most of the variants
of calcium lactate have not been documented in cheese, the ambiguously named
reference diffraction patterns have led to some dubious conclusions; this point will be
expanded upon subsequently.
Dorn and Dahlberg (1942) challenged the finding by Tuckey et al. (1938) that
white specks were calcium lactate by conducting chemical analysis and demonstrating
that crystalline material that they obtained from Cheddar cheese did not contain large
quantities of lactate. However, they did observe that there was a significant amount of
calcium present as an “impurity.” They concluded instead that the white specks were
crystalline tyrosine.
Other authors (McDowall and McDowell, 1939, Shock et al., 1948) also did
chemical analysis on crystals from Cheddar cheese and had conflicting results. McDowall
and McDowell (1939) supported the conclusion made previously by Tuckey et al. (1938)
who claimed that the white specks were calcium lactate. Shock et al. (1948) demonstrated
that the crystals were a mix of calcium lactate and tyrosine. This seemingly unresolvable
contradiction was clarified by Harper et al. (1953) who collected crystals from a variety
of cheeses and demonstrated that a diversity of crystals can form on cheese and that each
crystalline species produces a unique and reproducible diffraction pattern.
28
Harper’s work was a critical development to further use of XRD in cheese
research. Previous to Harper et al. (1953), XRD was undoubtedly recognized for its
potential use, but the failure to reproduce the conclusions made by Tuckey et al. (1938)
was certainly troubling and must have shed doubt on the efficacy of XRD as a qualitative
tool for cheese scientists. Harper et al. (1953) states frankly that his research was carried
out “to determine whether or not the white particles from different lots of Cheddar cheese
have the same chemical composition.” This statement clearly demonstrates that by 1953
cheese researchers strongly considered the possibility that XRD was leading them and
their colleagues to sensible yet erroneous conclusions. The study by Harper et al. (1953)
not only gave validity to a handful of previous publications that had endured heavy
scrutiny, but this study laid the foundation for cheese scientists to routinely use XRD to
distinguish a variety of crystalline species.
Insight about the precise method used by researchers to generate experimental d-
values can be gained from another publication that was published during the same time.
Tuckey and Ruehe (1938) used XRD to generate diffraction patterns from dried cheese
that contained microcrystals. The output that appears in Figure 1 appears similar to the
output that is obtained from single crystal XRD. The group measured the distance
between concentric circles in the diffraction output and obtained the d-values, probably
by calculating them from Bragg’s law. Despite how antiquated this method appears to the
contemporary PXRD user, researchers of that era drew conclusions from their data that
laid the foundation for all further cheese crystal work. Not surprisingly, some of the
diffraction patterns that Harper et al. (1953) generated could not be matched to reference
29
patterns in the database that was available at that time. Although the ICDD database has
grown enormously since 1953, the problem of unidentifiable diffraction patterns persists
to this day.
Innovative research in 1964 (Conochie and Sutherland, 1965) made use of XRD
to determine relative quantities of crystalline material at different depths within a piece of
cheese. Although the RIR values, which are used for actual quantitative comparison, have
not been documented for most crystalline entities in cheese, Conochie and Sutherland
(1965) used a novel approach to obtain semi-quantitative data. They generated diffraction
patterns from samples of cheese at various depths to determine if crystals formed and to
what extent. They gauged the strength of the XRD pattern to determine if microcrystals
were present and in what relative quantity. This new approach represents one of the scant
examples of quantitative XRD work in cheese research.
The potential for XRD to be used in cheese science to obtain quantitative data is
evident. One application in particular involves quantifying the relative quantities of
crystalline species that appear in complex precipitates on the surface of Cheddar cheeses.
Several researchers have demonstrated that XRD can be used to identify different
crystalline species in complex deposits (Shock et al., 1948; Harper et al., 1953) even
when some species are in relatively minute quantities (Tansman et al., 2013), however,
they cannot be quantified using XRD.
The first explicit use of PXRD with powdered crystalline material from cheese
was published in 1967 (Scharpf and Michnick), although the work a few years earlier by
Conochie and Sutherland (1965) probably also involved a specialized powder
30
diffractometer. Conochie and Sutherland (1965) used dried but-otherwise-unaltered
pieces of cheese to generate diffraction patterns. As a result, concern was raised by
Scharpf and Michnick (1967) that “in situ” diffraction of samples could lead to problems
with preferred orientation, yielding inaccurate data. Their subsequent work addressed this
concern and found that cheese samples that were used “in situ” did not present any
significant complications as a result of preferred orientation of crystallites. This finding
further demonstrated the nondestructive analysis that can be performed with XRD.

31
1.8. References
Agarwal, S., M. Costello, and S. Clark. 2005. Gas-flushed packaging contributes to
calcium lactate crystals in Cheddar cheese. Journal of Dairy Science 88:3773-3783.
Agarwal, S., R. J. Powers, B. G. Swanson, S. Chen, and S. Clark. 2006a. Cheese pH,
protein concentration, and formation of calcium lactate crystals. Journal of Dairy Science
89:4144-4155.
Agarwal, S., R. J. Powers, B. G. Swanson, S. Chen, and S. Clark. 2008. Influence of salt-
to-moisture ratio on starter culture and calcium lactate formation. Journal of Dairy
Science 91:2967-2980.
Agarwal, S., K. Sharma, B. G. Swanson, U. Yuksel, and S. Clark. 2006b. Nonstarter
lactic acid bacteria biofilms and calcium lactate crystals in Cheddar cheese. Journal of
Dairy Science 89:1452-1466.
Amend, J. P. and H. C. Helgeson. 1997. Solubilities of the common L-alpha-amino acids
as a function of temperature and solution pH. Pure and Applied Chemistry 69(5):935-
942.
Bianchi, A., G. Berretta, G. Caserio, and G. Giolitti. 1974. Amino acid composition of
granules and spots in Grana Padano cheeses. Journal of Dairy Science 57(12):1504-1508.
Blake, A. J., R. J. Powers, L. O. Luedecke, and S. Clark. 2005. Enhanced lactose cheese
milk does not guarantee calcium lactate crystals in finished Cheddar cheese. Journal of
Dairy Science 88:2302-2311.
32
Bouman, S., D. B. Lind, F. M. Driessen, and D. G. Schmidt. 1982. Growth of
thermoresistant streptococci and deposition of milk constituents on plates of heat
exchangers during long operating times. Journal of Food Protection 45:806-812.
Boutrou, R., F. Gaucheron, M. Piot, F. Michel, J. Maubois, and J. Leonil. 1999. Changes
in the composition of juice expressed from Camembert cheese during ripening. Lait
79:503-513.
Brooker, B. E. 1987. The crystallization of calcium phosphate at the surface of mould-
ripened cheeses. Food Microstructure 6:25-33.
Cao, X., H. Lee, H. Yun, and Y. Koo. 2001. Solubilities of calcium and zinc lactate in
water and water-ethanol mixture. Korean Journal of Chemical Engineering 18(1):133-
135.
Carvalho, A. S., S. J., Ho.P., P. Teixeira, F. X. Malcata, and P. Gibbs. 2002. Survival of
freeze-dried Lactobacillus plantarum and Lactobacillus rhamnosus during storage in the
presence of protectants. Biotechnology Letters 24:1587-1591.
Chou, Y. E., C. G. Edwards, L. O. Luedecke, M. P. Bates, and S. Clark. 2003. Nonstarter
lactic acid bacteria and aging temperature affect calcium lactate crystallization in
Cheddar cheese. Journal of Dairy Science 86:2516-2524.
Conochie, J. and B. J. Sutherland. 1965. The nature and cause of seaminess of Cheddar
cheese. Journal of Dairy Research 32:35-44.
Crow, V., B. Curry, and M. Hayes. 2001. The ecology of non-starter lactic acid bacteria
(NSLAB) and their use as adjuncts in New Zealand Cheddar. International Dairy Journal
11:275-283.

33
Dorn, F. L. and A. C. Dahlberg. 1942. Identification of the white particles found on
ripened Cheddar cheese. Journal of Dairy Science 25(1):31-36.
Dybing, S. T., J. A. Wiegand, S. A. Brudvig, E. A. Huang, and R. C. Chandan. 1988.
Effect of processing variables on the formation of calcium lactate crystals on Cheddar
cheese. Journal of Dairy Science 71(7):1701-1710.
Ferreira, A., C. Oliveira, and F. Rocha. 2003. The different phases in the precipitation of
dicalcium phosphate dihydrate. Journal of Crystal Growth 252:599-611.
Folen, V. A. 1975. X-Ray powder diffraction data for some drugs, excipients, and
adulterants in illicit samples. Journal of Forensic Science 20(2):348-372.
Fox, P. F. 1987. Cheese: Chemistry, Physics, and Microbiology. Vol. 2. Gallaird
(Printers) Ltd., Great Yarmouth, Great Britain.
Fox, P. F. 1993. Cheese: Chemistry, Physics, and Microbiology. Vol. 1. Chapman and
Hall, Great Yarmouth, Great Britain.
Fox, P. F., T. P. Guinee, T. M. Cogan, and P. L. H. McSweeney. 2000. Fundamentals of
Cheese Science. Aspen Publishers Inc., Gaithersburg, Maryland.
Gaucheron, F., Y. Le Graet, F. Michel, V. Briard, and M. Piot. 1999. Evolution of
various salt concentrations in the moisture and in the outer layer and centre of a model
cheese during its brining and storage in an ammoniacal atmosphere. Lait 79:553-566.
Harper, W. J., A. M. Swanson, and H. H. Sommer. 1953. Observations on the chemical
composition of white particles in several lots of Cheddar cheese. Journal of Dairy Science
36(4):368-372.
34
Johnson, M. E., B. A. Riesterer, C. Chen, B. Tricomi, and N. F. Olson. 1990a. Effect of
packaging and storage conditions on calcium lactate crystallization on the surface of
Cheddar cheese. Journal of Dairy Science 73:3033-3041.
Johnson, M. E., B. A. Riesterer, and N. F. Olson. 1990b. Influence of nonstarter bacteria
on calcium lactate crystallization on the surface of Cheddar cheese. Journal of Dairy
Science 73:1145-1149.
Karahadian, C. and R. C. Lindsay. 1987. Integrated rales of lactate, ammonia, and
calcium in texture development of mold surface-ripened cheese. Journal of Dairy Science
70(5):909-918.
Keller, B., N. F. Olson, and T. Richardson. 1974. Mineral retention and rheological
properties of Mozzarella cheese made by direnct acidification. Journal of Dairy Science
57(2):174-180.
Kindstedt, P. S. 2005. American Farmstead Cheese. Chelsea Green Publishing Company,
White River Junction, Vermont.
Kosikowski, F. V. 1951. The liberation of free amino acids in raw and pasteurized milk
Cheddar cheese during ripening. Journal of Dairy Science 34(3):235-241.
Kosikowski, F. V. and A. C. Dahlberg. 1954. A quantitative appraisal of the free amino
acids in foreign type cheese. Journal of Dairy Science 37(2):167-172.
Kubantseva, N., R. W. Hartel, and P. A. Swearingen. 2004. Factors affecting solubility of
calcium lactate in aqueous solutions. Journal of Dairy Science 87:863-867.

35
Le Graet, Y., A. Lepienne, G. Brule, and P. Ducruet. 1983. Migration du calcium et des
phosphates inorganiques dans les fromages à pâte molle de type Camembert au cours de
l'affinage. Le Lait 63:317-332.
Marth, E. H. 1963. Microbiological and chemical aspects of Cheddar cheese ripening. A
review. Journal of Dairy Science 46(9):869-890.
McDowall, F. H. and A. K. R. McDowell. 1939. The white particles in mature Cheddar
cheese. Journal of Dairy Research 10:118-119.
Morris, H. A., C. Hold, J. B. Brooker, and W. Manson. 1988. Inorganic constituents of
cheese: analysis of juice from a one-month-old Cheddar cheese and the use of light and
electron microscopy to characterize the crystalline phases. Journal of Dairy Research
55:255-268.
Noomen, A. 1983. The role of the surface flora in the softening of cheeses with a low
initial pH. Neth. Milk Dairy Journal 37:229-232.
Poveda, J. M., M. J. Sousa, L. Cabezas, and P. L. H. McSweeney. 2003. Preliminary
observations on proteolysis in Manchego cheese made with a defined-strain starter
culture and adjunct starter (Lactobacillus plantarum) or a commercial starter.
International Dairy Journal 13:169-178.
Rajbhandari, P. and P. S. Kindstedt. 2005. Compositional factors associated with calcium
lactate crystallization in smoked Cheddar cheese. Journal of Dairy Science 88(11):3737-
3744.
Rajbhandari, P. and P. S. Kindstedt. 2008. Characterization of calcium lactate crystals on
Cheddar cheese by image analysis. Journal of Dairy Science 91:2190-2195.
36
Sakata, Y., S. Shiraishi, and M. Otsuka. 2005. Characterization of dehydration and
hydration behavior of calcium lactate pentahydrate and its anhydrate. Colloids and
Surfaces B: Biointerfaces 46:135-141.
Scharpf, L. G. and M. J. Michnick. 1967. In situ identification of crystals on process
cheese by x-ray diffraction. Journal of Dairy Science 50(12):1989-1991.
Severn, D. J. and M. E. Johnson. 1986. Determination of Lactic Acid in Cheddar Cheese
and Calcium Lactate Crystals. Journal of Dairy Science 69:2027-2030.
Shock, A. A., W. J. Harper, A. M. Swanson, and H. H. Sommer. 1948. What's in those
"white specks" on cheddar. Wis. Agr. Expt. Sta. Bull. 474:31-32.
Silverman, G. J. and F. V. Kosikowski. 1955. Tyrosine in Cheddar. Journal of Dairy
Science 38(9):950-958.
Somers, E. B., M. E. Johnson, and A. C. L. Wong. 2001. Biofilm formation and
contamination of cheese by nonstarter lactic acid bacteria in the dairy environment.
Journal of Dairy Science 84:1926-1936.
Swearingen, P. A., D. E. Adams, and T. L. Lensmire. 2004. Factors affecting calcium
lactate and liquid expulsion defects in Cheddar cheese. Journal of Dairy Science 87:574-
582.
Tansman, G., P. S. Kindstedt, and J. M. Hughes. 2013. Application of an improved
powder x-ray diffraction method to evaluate cheese crystals. Journal of Dairy Science
96(E-Suppl. 1):195.
Thomas, T. D. and V. L. Crow. 1983. Mechanisms of D(-)-lactic acid formation in
Cheddar cheese. New Zealand Journal of Dairy Scienceand Technology 18:131-141.
37
Tuckey, S. L. and H. A. Ruehe. 1938. An x-ray diffraction analysis of Cheddar cheese.
Journal of Dairy Science 21(12):777-789.
Tuckey, S. L., H. A. Ruehe, and G. L. Clark. 1938. X-ray diffraction analysis of white
specks in Cheddar cheese. Journal of Dairy Science 21:161.
Van Slyke, L. L. and A. B. Publow. 1909. The Science and Practice of Cheese-Making.
Orange Judd Company, New York.
Zannoni, M., B. L., and H. E. A. 1994. Comparison of Parmigiano-Reggiani and
American Parmesan cheeses by sensory analysis of texture. Scienza E Technica Lattiero-
Casearia 45(6):505-518.
38
CHAPTER 2: POWDER X-RAY DIFFRACTION CAN DIFFERENTIATE
BETWEEN ENANTIOMERIC VARIANTS OF CALCIUM LACTATE
PENTAHYDRATE CRYSTALS IN CHEESE
2.1. ABSTRACT
Powder X-ray diffraction has been used for decades to identify crystals of
calcium lactate pentahydrate in Cheddar cheese. According to this method,
diffraction patterns are generated from a powdered sample of the crystal(s) and
compared to reference cards within a database that contains the diffraction patterns
of known crystals. During a preliminary study of crystals harvested from various
Cheddar cheese samples we observed two slightly different but distinct diffraction
patterns that suggested that calcium lactate pentahydrate may be present in two
different crystalline forms. We hypothesized that the two diffraction patterns
corresponded to two enantiomeric forms of calcium lactate pentahydrate (L- and
DL-) that are believed to occur in Cheddar cheese, based on previous studies
involving enzymatic analyses of the lactate enantiomers in crystals obtained from
Cheddar cheeses. However, the powder X-ray diffraction database currently
contains only one reference diffraction card under the title “calcium lactate
pentahydrate”. In order to resolve this apparent gap in the powder X-ray
diffraction database, we generated diffraction patterns from reagent grade calcium
L-lactate pentahydrate and laboratory-synthesized calcium DL-lactate
pentahydrate. From the resulting diffraction patterns we determined that the
existing reference diffraction card corresponds to calcium DL-lactate pentahydrate,
39
and that the other form of calcium lactate pentahydrate observed in cheese crystals
corresponds to calcium L-lactate pentahydrate. Therefore, this report presents
detailed data from the two diffraction patterns, which may be used to prepare two
reference diffraction cards that differentiate calcium L-lactate pentahydrate from
calcium DL-lactate pentahydrate. Furthermore, we collected crystals from the
exteriors and interiors of Cheddar cheeses to demonstrate the ability of powder X-
ray diffraction to differentiate between the two forms of calcium lactate
pentahydrate crystals in Cheddar cheeses. Powder X-ray diffraction results were
validated using enzymatic assays for lactate enantiomers. These results
demonstrated that powder X-ray diffraction can be used as a diagnostic tool to
quickly identify different forms of calcium lactate pentahydrate that may occur in
Cheddar cheese.
Key Words: calcium lactate, crystal, X-ray diffraction, Cheddar, defect
2.2. INTRODUCTION
Powder X-ray diffraction (PXRD) has been used for decades to identify
crystalline species that appear in aged cheeses. Cheese crystal species include calcium
phosphate, cysteine, calcium lactate pentahydrate (CLP) and tyrosine (Harper et al.,
1953, Conochie et al., 1960). Much of the research in the past has focused on the
appearance of calcium lactate deposits on the surface of rindless Cheddar cheese, which

40
is seen as a defect (Dybing et al., 1988; Johnson et al., 1990a; Swearingen et al., 2004;
Rajbhandari et al., 2009).
While exploring the capabilities of PXRD to differentiate and identify crystals in
cheese, we observed that crystals isolated from the surfaces of Cheddar cheese samples
produced one of two slightly different but distinct diffraction patterns. One of the
diffraction patterns could be matched to a reference card labeled “calcium lactate
pentahydrate” (International Centre for Diffraction Data (ICDD) card #: 00-029-1596),
whereas the other diffraction pattern could not be matched to any reference card and was
regarded as an unidentified crystal. The discovery of an unidentified crystal in Cheddar
cheese is noteworthy given that the diffraction patterns produced by approximately
250,000 known crystalline species have been identified and archived as reference cards in
the PXRD instrumentation database.
Johnson et al. (1990b) showed that two types of CLP crystals form on Cheddar
cheese depending on the enantiomeric form of lactate in the cheese serum. Although L-
lactate is produced by the starter culture, which gives rise to crystals of calcium L-lactate
pentahydrate (L-CLP), it can be converted to D-lactate by non-starter bacteria.
Conversion of as little as 25% of L-lactate to D-lactate can cause all surface
crystallization to occur as calcium DL-lactate pentahydrate (DL-CLP). Furthermore,
Johnson et al. (1990b) demonstrated that DL-CLP contains equal quantities of D-lactate
and L-lactate. This suggests that in the presence of D-lactate and L-lactate calcium will
preferentially bond with one L-lactate and one D-lactate molecule, rather than with two

41
L-lactate or two D-lactate molecules. Furthermore, Cao et al. (2001) demonstrated that
DL-CLP is less soluble than L-CLP.
It is thus evident that two forms of CLP that have different formation dynamics
and different solubilities can exist in Cheddar cheese. These characteristics suggest that
the two forms of CLP also have different bonding structures, and thus different crystal
structures. Such a distinction, if it exists, can be observed as distinguishable PXRD
patterns. However, as noted earlier, the PXRD database contains only one reference card
for CLP of unspecified enantiomeric conformation, thus revealing a gap in the current
database with respect to CLP.
Preliminary work was conducted in order to determine the enantiomeric identity
of the CLP species designated by the reference card. These preliminary data indicated
that reagent grade calcium L-lactate pentahydrate (L-CLP) did not match the reference
card. Calcium DL-lactate pentahydrate (DL-CLP) was not available through commercial
suppliers. The following study was intended to determine if the diffraction pattern in the
ICDD reference card is indeed DL-CLP.
DL-CLP and L-CLP emerge in Cheddar cheese under different microbiological
conditions (Agarwal et al., 2008). Therefore, the specific enantiomeric form of CLP in
cheese represents useful diagnostic information. It is important for cheese researchers and
cheesemakers to properly identify the enantiomeric form of unwanted CLP crystals when
they occur so that they can address the underlying causes of the crystal formation, which
may differ depending on the CLP variant. We hypothesize that PXRD can rapidly and
reliably differentiate between enantiomeric variants of CLP crystals that form in cheese.

42
The specific aims of the present study were to demonstrate that PXRD patterns of L-CLP
and DL-CLP are distinguishable and to further demonstrate that PXRD can be used to
distinguish between L-CLP and DL-CLP crystals obtained from Cheddar cheese.
2.3. MATERIALS AND METHODS
2.3.1. Synthesis of DL-CLP Crystals A reagent grade source of DL-CLP was not available; therefore we synthesized
DL-CLP from reagent grade DL-lactic acid (Sigma-Aldrich Co. LLC, St. Louis, MO) and
reagent grade calcium carbonate (Sigma-Aldrich Co. LLC, St. Louis, MO) using the
following method:
Four grams of calcium carbonate were dissolved in 50 mL of deionized water.
Ten ml of DL-lactic acid were added slowly so that the effervescence would not overflow
the 100 ml beaker that served as the reaction vessel. The solution was stirred slowly with
a magnetic stirrer until all of the effervescence had ceased and the solution was clear. A
metal spatula was used to scratch the bottom of the glass beaker, which facilitated the
crystallization of DL-CLP. The magnetic stirring was maintained until the solution
became a semi-solid.
The semi-solid mixture of crystalline DL-CLP and solution were transferred to a
Buchner funnel with #541 filter paper (Sigma-Aldrich Co. LLC, St. Louis, MO) fitted
onto an aspirated vacuum flask and dried with a vacuum of residual solution. After no
more solution was drawn from the sample for at least half an hour, the crystalline DL-
CLP was transferred to a desiccator to further dry for 24 h.
43
After drying in the desiccator, the sample was finely ground using a mortar and
pestle and placed in an oven at 38°C for 12 h. As DL-CLP is hygroscopic (Sakata et al.,
2005), this was intended to completely dry the sample. Care was taken not to drive off the
associated water, which would skew the results of the experiment. When associated water
molecules are evolved by either heating or high vacuum, CLP will lose its crystallinity, as
indicated in the X-ray diffractograms. Thus, after each sample was dried an X-ray
diffraction pattern was generated to ensure that the water of hydration was still present.
Those samples that were excessively dried to the point of becoming partially or
completely anhydrous were discarded.
Approximately 0.8 g of dried sample were dissolved in 500 ml of deionized
water as a stock solution for compositional analysis. Composition analyses of D-lactate,
L-lactate and calcium were then conducted as described below to ensure that the sample
contained pure calcium DL-lactate pentahydrate.
2.3.2. CLP Crystals from Cheese Several samples of experimentally produced rindless Cheddar were obtained
from a previous aging study. These samples displayed heavy surface crystallization. Two
samples, each displaying a different diffraction pattern from its surface crystals, were
eventually selected for further analysis. Calcium lactate precipitates were scraped from
the surface of the cheese with a metal spatula. In addition, large granular crystals were
found inside three blocks of commercially produced Vermont Cheddar. These crystals
44
were excised using a spatula or dissection needle. Granular crystals from each block all
displayed identical diffraction patterns and the excised crystals were pooled.
Most of the collected crystalline material was defatted and dried using a single acetone
wash in a Buchner funnel; a portion of the calcium lactate that was not washed in acetone
was used to verify that the acetone wash did not create any diffraction artifacts.
Diffraction patterns of defatted and non-defatted surface precipitates were compared; the
acetone wash was expected to lower the baseline caused by non-crystalline phases, but
care was taken to ensure that the acetone wash did not cause any crystallization of entities
that would be detected on the diffractogram.
Once it was determined that the acetone wash was suitable for preparing surface
precipitates for PXRD, only the dried and defatted sample powders were used for further
analysis; defatted samples provided less noisy diffractograms and were easier to work
with when conducting chemical analysis.
Solutions of defatted surface crystals were dissolved in deionized water at the
rate of approximately 0.04 g per 100 ml H2O for chemical analysis. Solutions were
shaken vigorously until almost all material was dissolved. After 15 minutes of shaking,
any remaining solid material in solution was removed by filtration through Whatman #1
filter paper (GE Healthcare Bio-Sciences, Pittsburgh, PA) and a Buchner funnel.
2.3.3. Compositional Analysis of CLP Crystals For the analysis of synthesized DL-CLP, a 10 ml aliquot was taken from the
stock solution and diluted to 100 ml; a 50 ml aliquot of this solution was then diluted to
45
100 ml to yield a solution that contained approximately 0.04 g of DL-CLP per 100 ml of
deionized water. These steps were necessary to achieve a lactate concentration that was
appropriate for the enzymatic lactate assay (test kit no. 11112821035, Boehringer
Mannheim/R-Biopharm AG, Darmstadt, Germany) used to quantify lactate enantiomers
in solution. Aliquots of 0.1 ml were tested in paired triplicate for D-lactate and L-lactate
according to the manufacturer’s directions, in which the concentrations of both D and L-
lactate are measured sequentially for each aliquot. Enzymatic reactions were allowed to
proceed at ambient temperature until absorbance values, measured at 340 nm using a
Thermo Scientific Genesys™ 10S UV-VIS Spectrophotometer (Thermo Fisher
Scientific, Inc., Waltham, MA) ceased rising.
Ten ml aliquots of the stock solution were analyzed in triplicate for calcium.
Standard EDTA solution (Fisher Scientific, Pittsburgh, PA) and murexide indicator
(Fisher Scientific, Pittsburgh, PA) were used in the titration. The aliquots were
transferred quantitatively to a beaker using deionized water and slightly alkalized with
five drops of 0.1 M NaOH (Fisher Scientific, Pittsburgh, PA). A spatula-tip-full of
murexide (ca. 0.02 g) was added to the beaker. EDTA was added to the beaker from a
burette until a lingering color change was observed.
For the analysis of CLP crystals from cheese, 0.1 ml aliquots were taken from a
stock solution and the enzymatic assay for L and DL lactic acid (test kit no.
11112821035, Boehringer Mannheim/R-Biopharm AG, Darmstadt, Germany) was
conducted according to the directions. Enzymatic reactions were allowed to proceed at
ambient temperature until absorbance values, measured at 340 nm using a Thermo
46
Scientific Genesys™ 10S UV-VIS Spectrophotometer (Thermo Fisher Scientific, Inc.,
Waltham, MA), ceased rising, which often took longer for cheese precipitates than for
synthetic samples.
2.3.4. Diffraction Pattern of CLP Crystals Diffraction patterns were generated from synthetic DL-CLP and cheese crystals
using a MiniFlex II powder X-Ray diffractometer (Rigaku, The Woodlands, TX) and
analyzed to verify the crystallinity and purity of the synthetic sample and identify cheese
crystals.
Powdered samples were finely ground using a mortar and pestle and transferred
to a glass diffraction slide with a well. The powder in the slide well was leveled with the
surface of the diffraction slide using a microscope slide.
Diffractograms were generated at a speed of 2°2θ/m between 5 and 50°2θ.
Diffraction patterns were compared to the existing card (ICDD card #: 00-029-1596)
entitled “calcium lactate pentahydrate” using a specialized calculation called a ‘figure of
merit.’ The figure of merit was calculated automatically by PDXL, the diffractometer
software package (Rigaku, The Woodlands, TX). An acceptance threshold of 1 was set
for the figure of merit.
2.3.5. Statistical Analysis Mean concentrations of L-lactate, D-lactate and calcium in synthesized DL-CLP
were compared to the theoretical values using two-tailed T-tests with α = 0.05.

47
Theoretical values were calculated using molar equivalent weights for CLP- containing
calcium, D-lactate, L-lactate and water in a 1:1:1:5 molar ratio
2.4. RESULTS
2.4.1. Characterization of Synthetic DL-CLP The measured means for D-lactate, L-lactate and calcium in the synthesized DL-
CLP are compared with the theoretical values in Table 1. The water content, calculated
by difference (100% - (% L-lactate + % D-lactate + % calcium)), is also compared with
the theoretical value. Measured means for D-lactate, L-lactate and calcium did not differ
significantly (P> 0.05) from the theoretical values. The data confirm that the synthetic
crystalline material consisted of DL-CLP.
The diffraction pattern generated from the synthetic DL-CLP is shown in Figure
1. The bars represent the reference card (ICDD card #: 00-029-1596) labeled “calcium
lactate pentahydrate.” Note that the reference bars match the diffraction peaks and that
the baseline of the diffraction is very close to zero. This, along with the tests for lactate
enantiomers and calcium (Table 1), indicates that the synthetic DL-CLP was very pure.
Most importantly, this clearly demonstrates that the pattern in the diffractometer
reference card entitled “calcium lactate pentahydrate” can be characterized more
specifically as calcium DL-lactate pentahydrate.
The reference card entitled “calcium lactate pentahydrate” was originally
published by Folen (1975), and was intended for the study of illicit drugs, in which CLP
is occasionally used as a filler material. The author presents metrics for diffraction peak
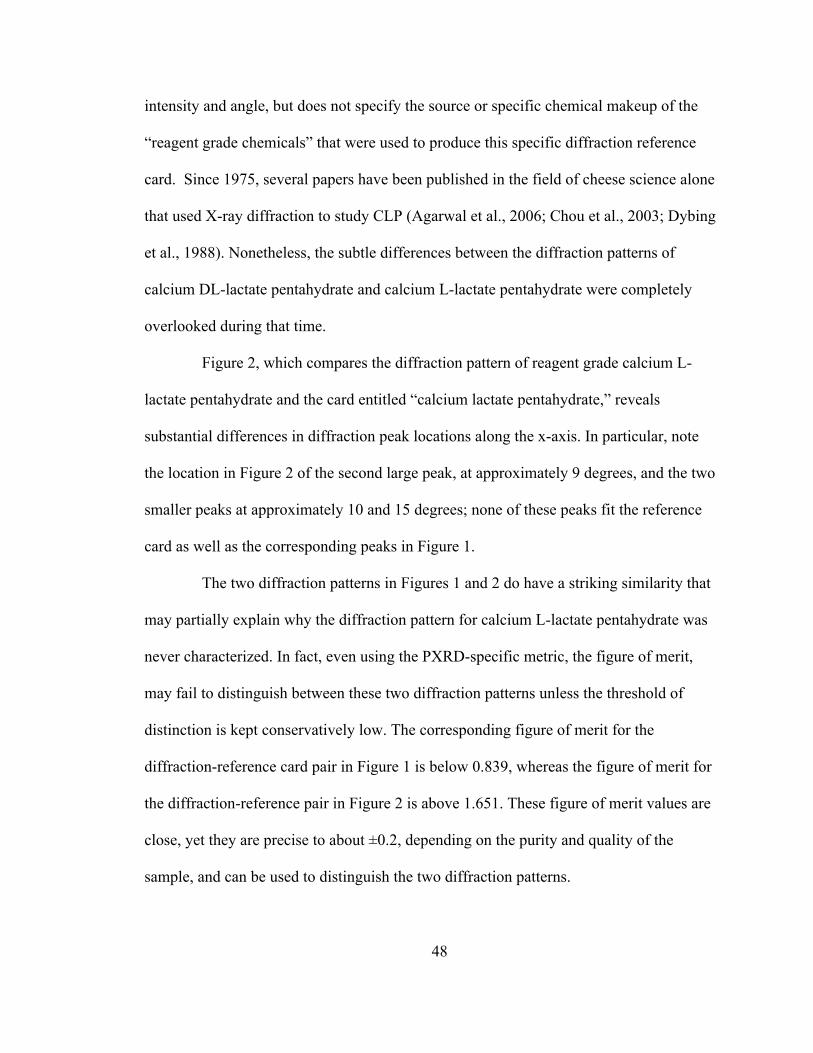
48
intensity and angle, but does not specify the source or specific chemical makeup of the
“reagent grade chemicals” that were used to produce this specific diffraction reference
card. Since 1975, several papers have been published in the field of cheese science alone
that used X-ray diffraction to study CLP (Agarwal et al., 2006; Chou et al., 2003; Dybing
et al., 1988). Nonetheless, the subtle differences between the diffraction patterns of
calcium DL-lactate pentahydrate and calcium L-lactate pentahydrate were completely
overlooked during that time.
Figure 2, which compares the diffraction pattern of reagent grade calcium L-
lactate pentahydrate and the card entitled “calcium lactate pentahydrate,” reveals
substantial differences in diffraction peak locations along the x-axis. In particular, note
the location in Figure 2 of the second large peak, at approximately 9 degrees, and the two
smaller peaks at approximately 10 and 15 degrees; none of these peaks fit the reference
card as well as the corresponding peaks in Figure 1.
The two diffraction patterns in Figures 1 and 2 do have a striking similarity that
may partially explain why the diffraction pattern for calcium L-lactate pentahydrate was
never characterized. In fact, even using the PXRD-specific metric, the figure of merit,
may fail to distinguish between these two diffraction patterns unless the threshold of
distinction is kept conservatively low. The corresponding figure of merit for the
diffraction-reference card pair in Figure 1 is below 0.839, whereas the figure of merit for
the diffraction-reference pair in Figure 2 is above 1.651. These figure of merit values are
close, yet they are precise to about ±0.2, depending on the purity and quality of the
sample, and can be used to distinguish the two diffraction patterns.
49
2.4.2. New Reference Card for Calcium L-lactate Pentahydrate A new reference card entitled “calcium L-lactate pentahydrate,” based on the
diffraction pattern generated from the reagent grade calcium L-lactate pentahydrate
(Figure 2) is thus proposed. In addition, the existing reference card (ICDD card #: 00-
029-1596), originally published by Folen (1975), should be renamed “calcium DL-lactate
pentahydrate” to reflect its identity more precisely. For this purpose, Tables 2 and 3
present more detailed metrics from Figures 1 and 2, respectively.
2.4.3. Characterization of CLP Crystals from Cheese Diffraction patterns were generated from crystals isolated from several different
Cheddar cheese samples. Two experimentally produced cheeses were selected for further
analysis; each cheese had heavy surface crystallization. One cheese had crystals that
diffracted as DL-CLP, and the other had surface crystals that diffracted as L-CLP. Each
crystalline sample was analyzed enzymatically for D- and L-lactate enantiomers. In
addition, several granular crystals from the interior of commercially produced Vermont
Cheddar were similarly analyzed.
Crystalline material that produced a DL-CLP diffraction pattern consistently
yielded equivalent quantities of D and L-lactate by enzymatic analysis, as expected.
Furthermore, crystalline material that produced L-CLP diffraction patterns consistently
yielded only L-lactate by enzymatic analysis, thus confirming the capacity of PXRD to
distinguish between the two CLP enantiomeric variants in cheese. Whereas crystals of L-
50
CLP were likely caused by L-lactate produced by starter culture, DL-CLP crystallization
was probably triggered by the conversion of L to D-lactate by nonstarter bacteria during
ripening (Johnson et al., 1990b).
Surface crystalline deposits were variably DL-CLP and L-CLP, whereas the
large interior crystals were exclusively DL-CLP. Notably, each cheese sample contained
only one enantiomeric form of CLP, regardless of the extent of crystallization, which is
consistent with the view that in the presence of D-lactate, calcium preferentially bonds
with one D-lactate and one L-lactate molecule, rather than two L-lactate molecules.
No obvious morphological differences were observed visually between surface
crystalline deposits of DL-CLP and those of L-CLP. However, the large spheroid crystals
of DL-CLP that formed within the interior of some cheese samples were much harder
than any of the surface deposits. These interior crystals appeared to form preferentially
within curd junctions and mechanical openings, which may provide nucleation sites for
crystallization. Very large interior crystals are a cause of significant concern among some
manufacturers of long-aged Cheddar cheese, based on anecdotal reports that our
laboratory has received from industry sources. Thus, further work to identify the
nonstarter bacteria responsible for the production of the D-lactate that gives rise to such
crystals, as well as microstructural and macrostructural factors that contribute to the
formation of very large interior crystals of DL-CLP, appears warranted.
51
2.5. DISCUSSION
2.5.1. PXRD to Determine the Degree of Dehydration of Laboratory Synthesized CLP As mentioned earlier, the laboratory-synthesized calcium DL-lactate
pentahydrate needed to be dried of hygroscopic water without driving off the water
associated with the crystal structure. According to Sakata et al. (2005), anhydrous CLP
does not diffract x-rays, and will instead display a characteristic “halo pattern.” Using
this as a guide, diffraction patterns from oven and vacuum dried samples were produced
to ensure that associated hydration water was not driven off.
Figure 3 depicts the diffraction pattern from a sample of calcium DL-lactate
pentahydrate that was oven dried at 80°C for several hours. Note the complete lack of
characteristic diffraction peaks, and the broad amorphous humps that typify poorly
crystallized material; this indicates that the sample was excessively dried to the point of
dehydration. Figure 4 depicts the diffraction pattern from a sample of DL-CLP that was
dried under high vacuum at ambient temperature for 48 hours. Several of the larger
characteristic peaks can still be distinguished, but the raised baseline and severely
broadened peaks indicate a partial loss of crystallinity. This last point demonstrates the
sensitivity of DL-CLP to various drying treatments and the trial and error that was
necessary to find an appropriate drying method.
2.5.2. Synthesis of a new CLP Variant It should be noted that while synthesizing a sample of calcium DL-lactate
pentahydrate, a crystalline variant of CLP was produced as a major impurity. This can be
52
seen in the diffraction of that sample in Figure 5. The diffraction pattern of DL-CLP, as
indicated by the bars of the reference card, can be clearly identified; however, large
unexplained peaks also appear. No card exists in the database that satisfactorily identifies
the crystalline species that is responsible for the extra peaks, but based on circumstance,
it is likely caused by a hydration variant of calcium lactate.
Hydration variants, monohydrate and trihydrate, have been noted in the
literature (Sakata et al., 2005; Peveler and Palmer, 2012), but reference cards have not
been published to date. The variant may be one of these two species, although
identification of this crystalline species is beyond the scope of this publication. In order
to avoid the synthesis of this contaminant, DL-CLP synthesis was not allowed to proceed
to the point where water became a limiting reagent; this was relevant because only a
fairly concentrated solution would yield crystals, but the synthesis of crystals also
incorporates what water is available into the crystal structure.
The synthesis of a hydration variant along with DL-CLP would have skewed the
analysis of the synthesized powder because hydration variants do not weigh the same as
DL-CLP. Thus, diffraction patterns were generated after each synthesis to ensure the
absence of this contaminant and the purity of the sample.
2.5.3. PXRD to Distinguish Between CLP Variants from Cheese Samples The ability to easily differentiate between DL-CLP and L-CLP is a valuable tool
for cheese researchers who are supporting cheesemakers. Diffraction patterns can be
generated within minutes, and with almost no sample preparation. Diffractometers are
53
relatively inexpensive to operate, are fairly common in universities, and are used in many
different disciplines ranging from geology to pharmaceuticals. In contrast, enzymatic
analysis, which is the current practice (Agarwal et al., 2006b; Rajbhandari et al., 2009),
can take up to several hours, and assay kits have a limited shelf-life and are fairly
expensive. Furthermore, crystalline deposits in cheese contain varying quantities of non-
crystalline material such as cheese serum, fat, and protein. In order to get accurate
readings, the lactate content of the samples must be within a narrow range, which makes
it difficult to predict the appropriate sample size when working with crystals that contain
highly variable levels of non-crystalline material.
Using PXRD, any non-crystalline material will increase the background noise of
the diffraction pattern, but the diffraction reading can be easily observed and analyzed
even when non-crystalline material exists in excess. In addition, PXRD, by design,
discriminates between crystalline CLP and free calcium, lactate, and water that may exist
as non-crystalline impurities in the sample; chemical analysis does not have this
capability.
Understanding the composition of unwanted crystalline deposits in and on
cheese can be of great benefit to producers. It has previously been established that
nonstarter bacteria can convert L-lactate to D-lactate, and in doing so decrease the
solubility of CLP in the cheese serum (Agarwal et al., 2006; Chou et al., 2003; Johnson et
al., 1990 b). Differentiating between DL and L-CLP can give cheesemakers a much
clearer snapshot of the chemical and microbiological environment in their cheeses.
Depending on the type of CLP, different process changes can be proposed. For instance,
54
if L-CLP forms, it indicates that racemizing nonstarter bacteria are likely absent, but that
soluble calcium and L-lactate exist in excess. If DL-CLP forms, the microbiology of the
cheese is a main cause, and various steps to standardize the microbiology may be
proposed.
2.6. CONCLUSION
This study has demonstrated the ability of PXRD to rapidly and accurately
differentiate between DL-CLP and L-CLP from synthetic sources and from cheddar
cheese. PXRD, where available, can thus replace time-consuming and costly enzymatic
assays for the analysis of crystalline deposits in and on cheese.
2.7. ACKNOWLEDGEMENTS
The financial support of USDA Hatch Project VT-H01905 is gratefully acknowledged as
is a grant from the National Science Foundation (EAR-0922961).
2.8. REFERENCES Agarwal, S., R. J. Powers, B. G. Swanson, S. Chen, and S. Clark. 2008. Influence of salt-
to-moisture ratio on starter culture and calcium lactate formation. Journal of Dairy
Science 91:2967-2980.
55
Agarwal, S., K. Sharma, B. G. Swanson, U. Yuksel, and S. Clark. 2006b. Nonstarter
lactic acid bacteria biofilms and calcium lactate crystals in Cheddar cheese. Journal of
Dairy Science 89:1452-1466.
Cao, X., H. Lee, H. Yun, and Y. Koo. 2001. Solubilities of calcium and zinc lactate in
water and water-ethanol mixture. Korean Journal of Chemical Engineering 18(1):133-
135.
Conochie, J., J. Czulak, A. J. Lawrence, and W. F. Cole. 1960. Tyrosine and calcium
lactate crystals on rindless cheese. Australian Journal of Dairy Technology 15(3):120.
Dybing, S. T., J. A. Wiegand, S. A. Brudvig, E. A. Huang, and R. C. Chandan. 1988.
Effect of processing variables on the formation of calcium lactate crystals on Cheddar
cheese. Journal of Dairy Science 71(7):1701-1710.
Folen, V. A. 1975. X-Ray powder diffraction data for some drugs, excipients, and
adulterants in illicit samples. Journal of Forensic Science 20(2):348-372.
Harper, W. J., A. M. Swanson, and H. H. Sommer. 1953. Observations on the chemical
composition of white particles in several lots of Cheddar cheese. Journal of Dairy Science
36(4):368-372.
Johnson, M. E., B. A. Riesterer, C. Chen, B. Tricomi, and N. F. Olson. 1990a. Effect of
packaging and storage conditions on calcium lactate crystallization on the surface of
Cheddar cheese. Journal of Dairy Science 73:3033-3041.
Johnson, M. E., B. A. Riesterer, and N. F. Olson. 1990b. Influence of nonstarter bacteria
on calcium lactate crystallization on the surface of Cheddar cheese. Journal of Dairy
Science 73:1145-1149.
56
Peveler, W. W. and T. G. Palmer. 2012. Effecs of magnesium lactate dihydrate and
calcium lactate monohydrate on 20-km cycling time trial performance. Journal of
Strength and Conditioning Research 26(4):1149-1153.
Rajbhandari, P., J. Patel, E. Valentine, and P. S. Kindstedt. 2009. Chemical changes that
predispose smoked Cheddar cheese to calcium lactate crystallization. Journal of Dairy
Science 92(8):3616-3622.
Sakata, Y., S. Shiraishi, and M. Otsuka. 2005. Characterization of dehydration and
hydration behavior of calcium lactate pentahydrate and its anhydrate. Colloids and
Surfaces B: Biointerfaces 46:135-141.
Swearingen, P. A., D. E. Adams, and T. L. Lensmire. 2004. Factors affecting calcium
lactate and liquid expulsion defects in Cheddar cheese. Journal of Dairy Science 87:574-
582.
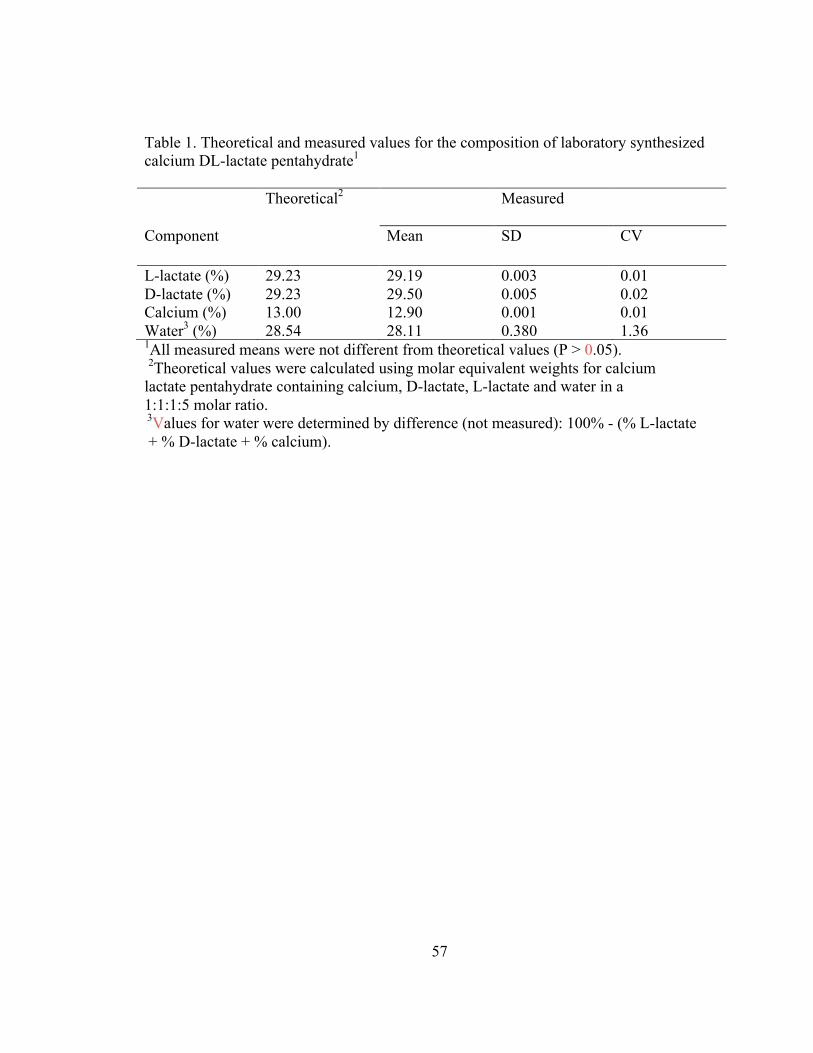
57
Table 1. Theoretical and measured values for the composition of laboratory synthesized calcium DL-lactate pentahydrate1 Theoretical2 Measured
Component Mean SD CV
L-lactate (%) 29.23 29.19 0.003 0.01 D-lactate (%) 29.23 29.50 0.005 0.02 Calcium (%) 13.00 12.90 0.001 0.01 Water3 (%) 28.54 28.11 0.380 1.36 1All measured means were not different from theoretical values (P > 0.05). 2Theoretical values were calculated using molar equivalent weights for calcium lactate pentahydrate containing calcium, D-lactate, L-lactate and water in a 1:1:1:5 molar ratio. 3Values for water were determined by difference (not measured): 100% - (% L-lactate + % D-lactate + % calcium).
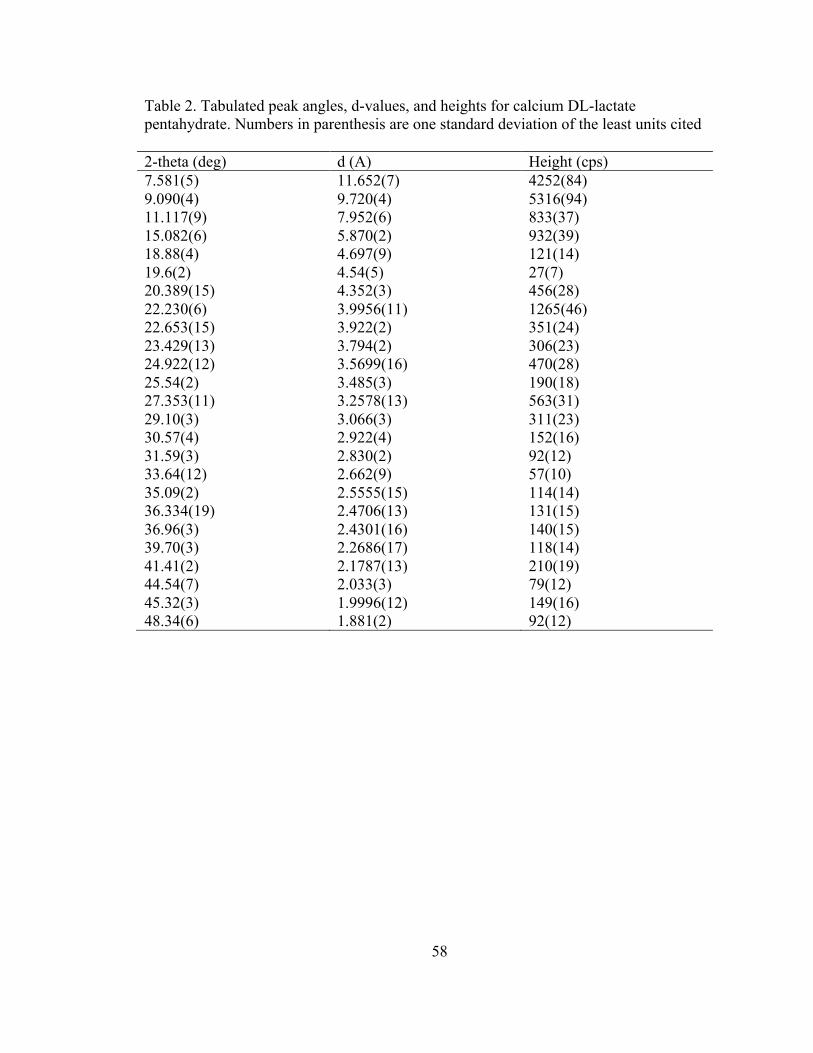
58
Table 2. Tabulated peak angles, d-values, and heights for calcium DL-lactate pentahydrate. Numbers in parenthesis are one standard deviation of the least units cited 2-theta (deg) d (A) Height (cps) 7.581(5) 11.652(7) 4252(84) 9.090(4) 9.720(4) 5316(94) 11.117(9) 7.952(6) 833(37) 15.082(6) 5.870(2) 932(39) 18.88(4) 4.697(9) 121(14) 19.6(2) 4.54(5) 27(7) 20.389(15) 4.352(3) 456(28) 22.230(6) 3.9956(11) 1265(46) 22.653(15) 3.922(2) 351(24) 23.429(13) 3.794(2) 306(23) 24.922(12) 3.5699(16) 470(28) 25.54(2) 3.485(3) 190(18) 27.353(11) 3.2578(13) 563(31) 29.10(3) 3.066(3) 311(23) 30.57(4) 2.922(4) 152(16) 31.59(3) 2.830(2) 92(12) 33.64(12) 2.662(9) 57(10) 35.09(2) 2.5555(15) 114(14) 36.334(19) 2.4706(13) 131(15) 36.96(3) 2.4301(16) 140(15) 39.70(3) 2.2686(17) 118(14) 41.41(2) 2.1787(13) 210(19) 44.54(7) 2.033(3) 79(12) 45.32(3) 1.9996(12) 149(16) 48.34(6) 1.881(2) 92(12)
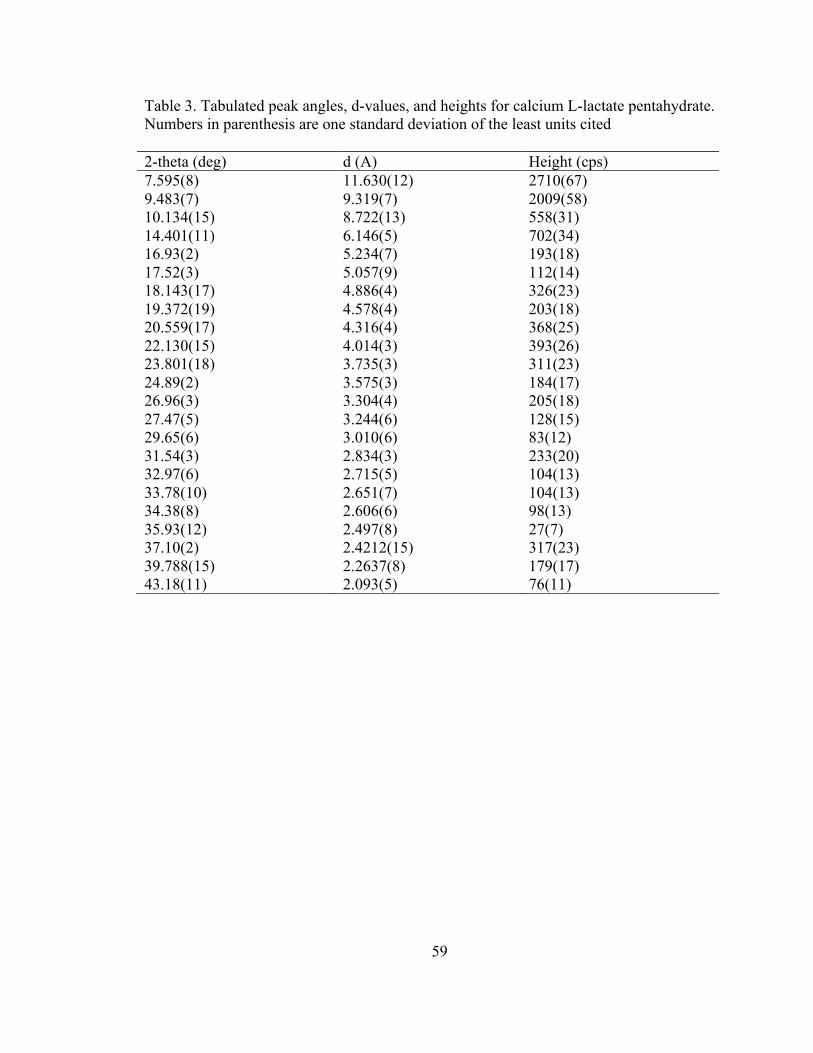
59
Table 3. Tabulated peak angles, d-values, and heights for calcium L-lactate pentahydrate. Numbers in parenthesis are one standard deviation of the least units cited 2-theta (deg) d (A) Height (cps) 7.595(8) 11.630(12) 2710(67) 9.483(7) 9.319(7) 2009(58) 10.134(15) 8.722(13) 558(31) 14.401(11) 6.146(5) 702(34) 16.93(2) 5.234(7) 193(18) 17.52(3) 5.057(9) 112(14) 18.143(17) 4.886(4) 326(23) 19.372(19) 4.578(4) 203(18) 20.559(17) 4.316(4) 368(25) 22.130(15) 4.014(3) 393(26) 23.801(18) 3.735(3) 311(23) 24.89(2) 3.575(3) 184(17) 26.96(3) 3.304(4) 205(18) 27.47(5) 3.244(6) 128(15) 29.65(6) 3.010(6) 83(12) 31.54(3) 2.834(3) 233(20) 32.97(6) 2.715(5) 104(13) 33.78(10) 2.651(7) 104(13) 34.38(8) 2.606(6) 98(13) 35.93(12) 2.497(8) 27(7) 37.10(2) 2.4212(15) 317(23) 39.788(15) 2.2637(8) 179(17) 43.18(11) 2.093(5) 76(11)
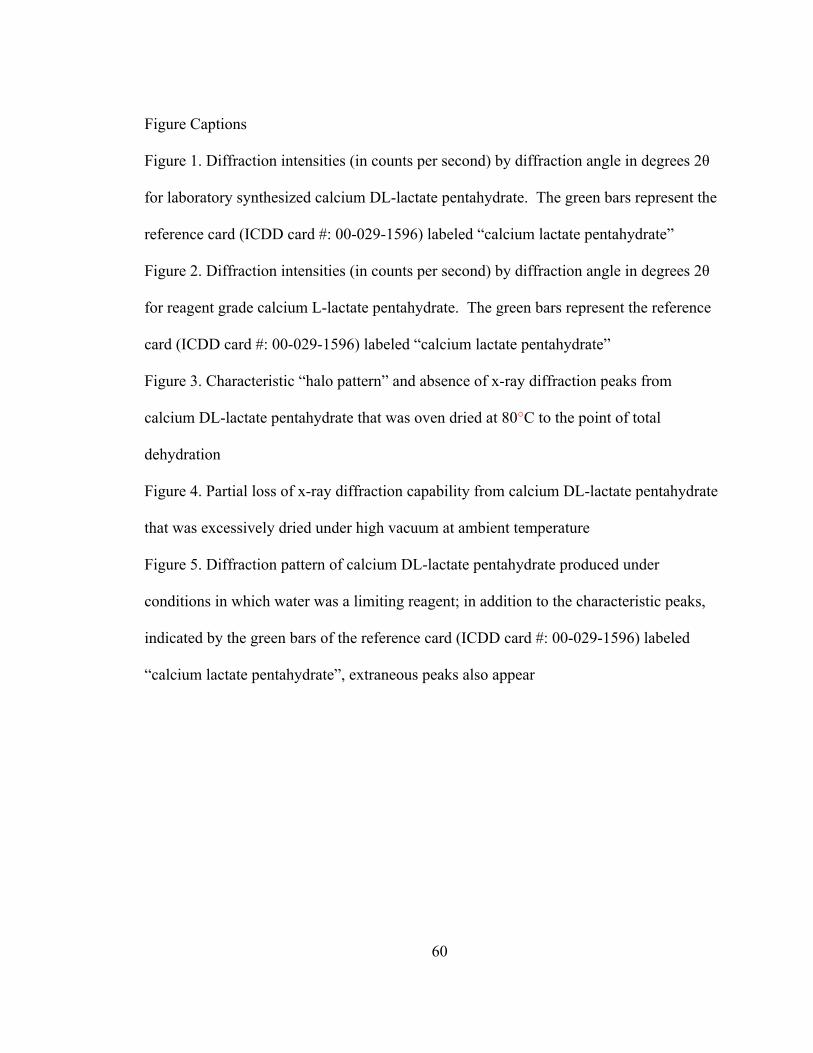
60
Figure Captions Figure 1. Diffraction intensities (in counts per second) by diffraction angle in degrees 2θ
for laboratory synthesized calcium DL-lactate pentahydrate. The green bars represent the
reference card (ICDD card #: 00-029-1596) labeled “calcium lactate pentahydrate”
Figure 2. Diffraction intensities (in counts per second) by diffraction angle in degrees 2θ
for reagent grade calcium L-lactate pentahydrate. The green bars represent the reference
card (ICDD card #: 00-029-1596) labeled “calcium lactate pentahydrate”
Figure 3. Characteristic “halo pattern” and absence of x-ray diffraction peaks from
calcium DL-lactate pentahydrate that was oven dried at 80°C to the point of total
dehydration
Figure 4. Partial loss of x-ray diffraction capability from calcium DL-lactate pentahydrate
that was excessively dried under high vacuum at ambient temperature
Figure 5. Diffraction pattern of calcium DL-lactate pentahydrate produced under
conditions in which water was a limiting reagent; in addition to the characteristic peaks,
indicated by the green bars of the reference card (ICDD card #: 00-029-1596) labeled
“calcium lactate pentahydrate”, extraneous peaks also appear

61
Tansman Figure 1
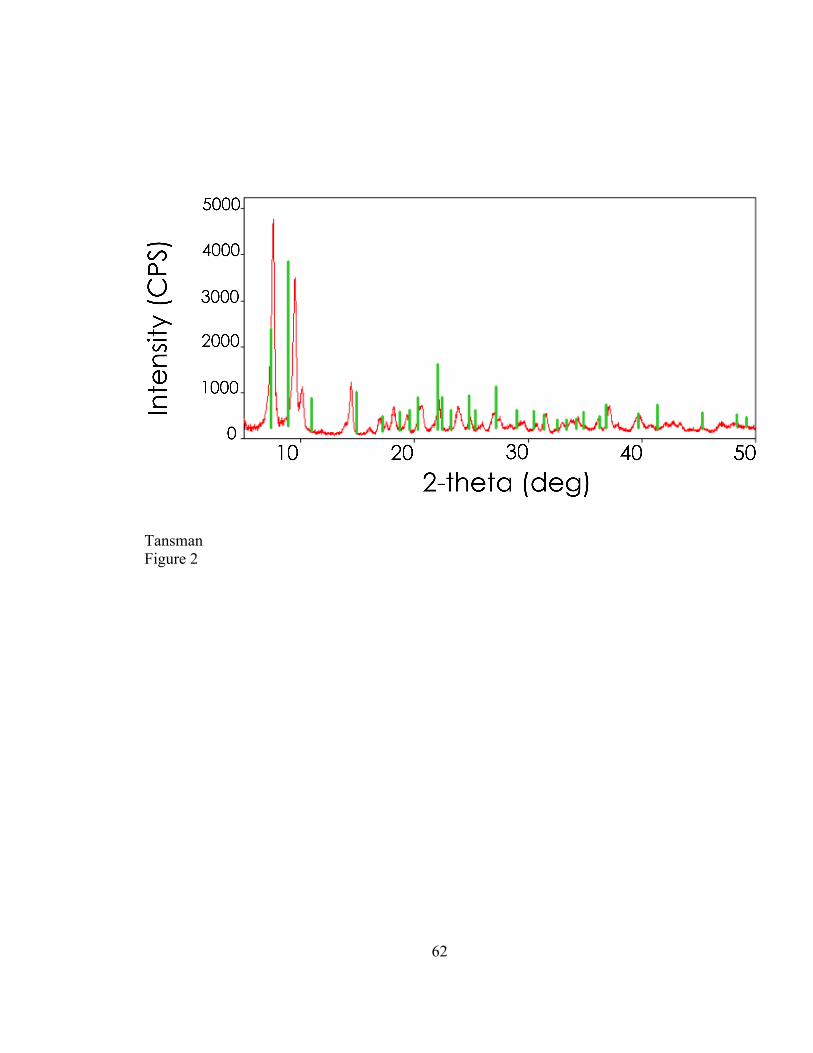
62
Tansman Figure 2
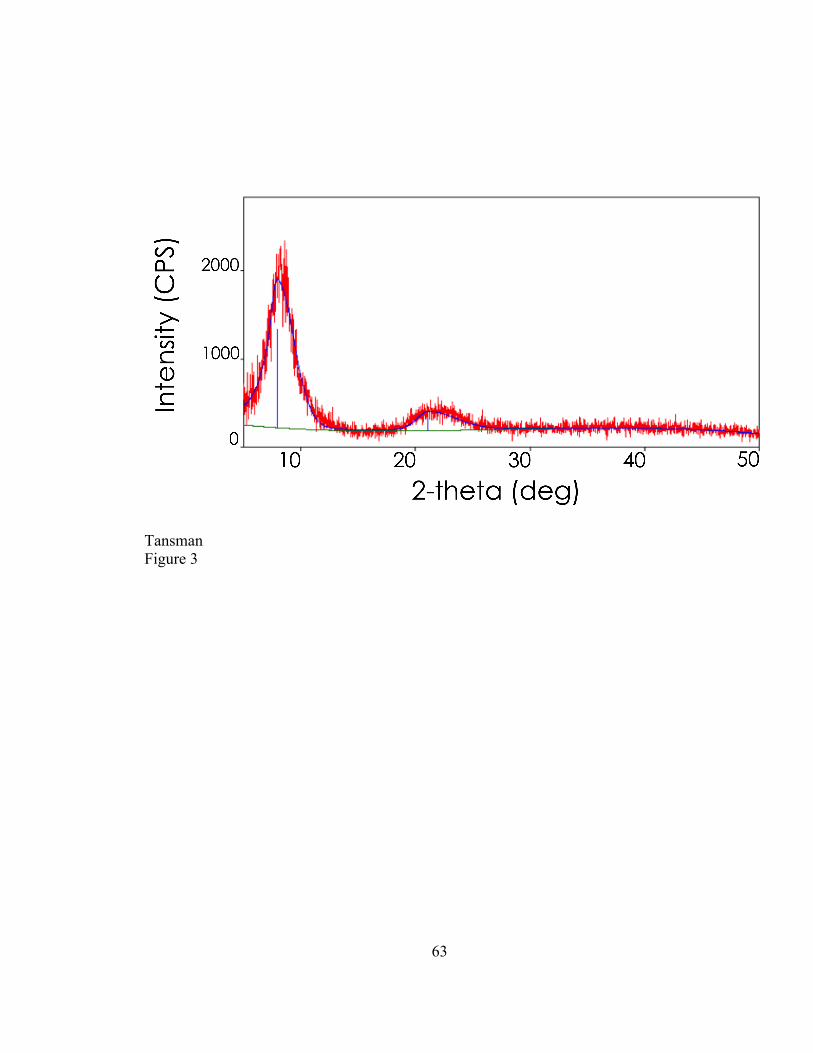
63
Tansman Figure 3

64
Tansman Figure 4
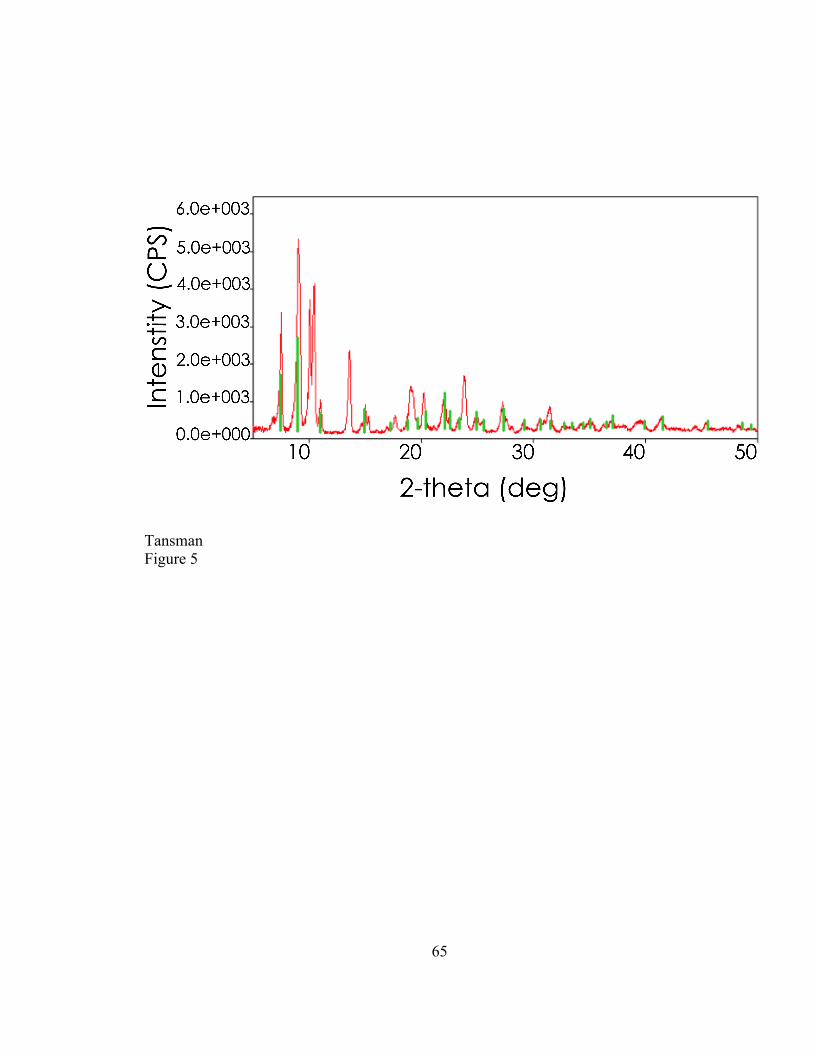
65
Tansman Figure 5

66
CHAPTER 3: ENHANCING THE USE OF POWDER X-RAY DIFFRACTION TO
IDENTIFY CRYSTALS IN CHEESE
3.1. Abstract
Powder X-ray diffraction (PXRD) is a central tool in the study of crystal
precipitates in cheese. In preparing crystal samples for analysis, several
considerations must be made in order to produce samples that are of sufficient
quality and purity for PXRD. Techniques for removing fat and moisture are
discussed as well as proper homogenization of samples. Data from improperly
prepared samples are presented to demonstrate the possible artifacts that may
occur. Methods for isolating crystals from various types of cheeses are presented,
and several difficulties in identifying crystals from cheese using PXRD are
discussed.
3.2. Technical Note
X-ray diffraction (XRD) has been used in cheese research for decades to
examine crystals that form in both natural (Tuckey and Ruehe, 1938; Tuckey et al., 1938)
and process (Scharpf and Michnick, 1967) cheese. Recently, we used a modified XRD
technique, known as powder X-ray diffraction (PXRD), to differentiate between
enantiomeric variants of calcium lactate pentahydrate (CLP) found on Cheddar cheese
(Tansman et al. (2014). Geologists and mineralogists have used PXRD extensively to
examine crystalline compounds in rocks and soil; however, we had to significantly
modify the methods to collect and prepare cheese crystals for PXRD analysis in order to
67
achieve satisfactory results. As a result of that work, we have identified the need for a
detailed description of the methods and challenges of using PXRD to evaluate cheese
crystals to guide researchers who are seeking to optimize the use of PXRD for this
application. This report aims to provide cheese researchers with comprehensive technical
information needed to take full advantage of PXRD.
The most notable difficulty in using PXRD for cheese samples is the high
moisture content. When generating diffraction patterns, moisture acts like other non-
crystalline phases in the sample by raising the diffraction baseline and creating noise.
This noise can be so pronounced that it obstructs diffraction peaks that are important for
identifying the diffracting crystal; milk fat similarly increases diffraction noise. A
reliable method for removing moisture and fat is thus essential for effectively preparing
samples. However, the conditions used for drying must be chosen carefully to prevent
water that may be associated with the crystalline structure, such as that associated with
CLP, from being driven off (Tansman et al., 2014).
Several researchers (Tuckey et al., 1938; Harper et al., 1953; Chou et al., 2003)
used ethyl ether to defat cheese and crystal samples destined for XRD. They then
followed the ether wash with a drying step (i.e., either drying in a desiccator overnight at
ambient temperature (Chou et al., 2003), drying under vacuum at ambient temperature
(Harper et al., 1953), or drying at 37°C for 12-24 h (Tuckey et al., 1938)). However, we
recommend the use of an acetone wash in place of ethyl ether, which enables samples to
be dried and defatted simultaneously and rapidly. As we noted previously (Tansman et
al., 2014 ), treating cheese samples with acetone does not drive off associated water in
68
CLP, nor does it induce crystallization of additional compounds in the samples and thus
can be effectively used to dry and defat samples rapidly without creating diffraction
artifacts. A detailed description of the method is as follows:
Crystalline deposits are removed from cheese surfaces or interiors using
tweezers or a dissecting needle with care to minimize adhering cheese. The deposits are
then immersed in acetone and allowed to soak in a covered beaker for 30 min.
Subsequently, the sample is agitated with a spatula and allowed to soak for another 15
min. The acetone is then again agitated to suspend the crystals in solution and the
suspension is immediately transferred to a Buchner funnel with #50 filter paper (Fisher
Scientific, Pittsburgh, PA) attached to an Erlenmeyer flask with vacuum from an
aspirator or pump. The beaker should be rinsed with acetone to transfer any sample
adhering to the beaker, and the washings should be passed through the Buchner funnel as
well.
A vacuum is passed through the Buchner setup until the sample is dry and
crumbly, which typically requires about 10 min. The dry sample is then transferred to a
mortar and ground to a fine powder with a pestle. At this point, the sample should be a
loose, fluffy powder that may be off-white to yellow, depending on how much cheese
material was included initially in the crystalline sample. Total time to prepare the
dehydrated and defatted crystalline powder is about 55 min.
The sample may now be used to generate diffraction patterns using a powder X-
ray diffractometer. The powder is loaded onto a diffraction slide with a well; wells vary
in depth, and the size selected depends on the amount of sample available, with a deeper
69
well typically producing a crisper diffraction pattern. A glass microscope slide is drawn
across the surface of the mounting slide to make the powder sample perfectly flush with
the plane of the mounting slide. This is a critical step because if the sample is not flush,
the diffraction pattern may be shifted along the X-axis in the positive or negative
direction, if there is too much or too little sample, respectively. Such a shift impacts all
diffraction peaks uniformly, but this still hinders the software from automatically
identifying the pattern. Reference diffraction patterns are indexed with the location of
diffraction peaks along the X-axis, instead of relative peak locations. Thus, if an entire
diffraction pattern is shifted, the software will likely not match the pattern with the
reference pattern. The diffraction pattern presented in Figure 1 illustrates spectral
shifting that may occur when a crystal sample is improperly loaded with too much sample
into the well of the diffraction slide. In our initial trials, crystalline scrapings from
cheddar cheese were mounted on a slide without defatting or grinding, which made
mounting difficult. Samples were not perfectly flush with the mounting slide and spectral
shifting occurred. This was easily resolved by preparing samples as detailed above.
The diffraction spectrum should span from 5 degrees 2θ to at least 50 degrees 2θ
and run at 2 degrees 2θ per minute. The instrument may be run at 10 degrees 2θ per
minute initially to confirm that the sample is crystalline, but the slower speed should be
used to generate crisp diffractions. After generating the diffraction, the sample may be
collected from the mounting slide and used in further analysis. The diffraction patterns
obtained from crystalline scrapings from Cheddar cheese before and after dehydrating
and defatting with acetone as described above are shown in Figure 2 and 3, respectively.
70
Note the lower baseline and crisper diffraction pattern after treatment with acetone
(Figure 3) as compared with before treatment (Figure 2). It is also important to note that
the diffraction pattern obtained after acetone treatment (Figure 3) contained no new peaks
that were not present before treatment (Figure 2), indicating that crystalline products
were not formed as a result of washing in acetone.
Insufficiently ground crystals can also cause another type of distortion; if
crystalline deposits have a preferred orientation, which may occur because crystal
powders are too coarse, diffraction intensities will be distorted. Preferred orientation can
be avoided by thoroughly grinding and mixing crystalline deposits.
Occasionally samples can only be collected in such small quantities that the
material is not sufficient to fill a mounting well; for instance, crystalline deposits may
occur in cracks or fissures of cheese, but harvesting sufficient volumes of these deposits
can be challenging. In such cases a zero-background slide can be used. This slide is
composed of a non-diffracting material on which a very thin film of sample is mounted
according to the following procedure:
The sample is defatted and dried as described above and ground to a fine
powder. The powder is poured into the middle of the slide to form a small mound. A
pipette is used to drip several drops of acetone on the powder with a velocity that allows
the sample to disperse uniformly over the face of the slide. Acetone is dripped onto the
slide until the sample is completely suspended in the acetone and no mounds of it remain.
After a minute or so, the acetone will evaporate and the sample will have formed a film
on the slide. This slide may be used to generate the diffraction patterns just like the glass
71
mounting slides, although samples on the zero-background slide tend to generate noisier
diffraction patterns than those on a glass slide. Nonetheless, if prepared as described
above, the diffractions are reliable. The zero-background slide is particularly useful for
investigating small, embedded granular crystals that form in aged cheeses.
Diffraction patterns can reveal the presence of a single crystalline phase or
several crystalline phases mixed together. Harper et al. (1953) used an early form of X-
ray diffraction to identify several different crystalline compounds in crystals from
cheddar cheese. In order for a crystalline phase to be identifiable in a diffraction, the
compound must comprise roughly 10% or more of the total sample (Harper et al., 1953),
although with modern instrumentation this number may be lower; thus if the crystal in
question exists in trace amounts, it may not be evident from the generated diffraction.
We have observed this scenario with calcium lactate crystals from Cheddar
cheese; although a crystalline deposit may appear to be entirely calcium lactate
pentahydrate from a diffraction, several other crystallized compounds may exist; when
crystalline calcium lactate deposits from the surface of Cheddar cheese were dissolved in
hot water, a small amount of residual material could be collected by filtration. When
mounted on a zero-background slide, this material revealed the presence of several other
crystalline compounds. For example, the diffraction pattern in Figure 4 generated from
crystalline material scraped from the surface of Cheddar cheese appears to include only
CLP, except for the presence of small, unidentified peak at 6 degrees (2 theta). However,
when the scrapings were subjected to separation based on solubility in hot water,
crystalline tyrosine and an unidentified crystalline component were found to be present,
72
as seen in the diffraction patterns presented in Figure 5. This process also amplified the
unknown peak at 6 degrees (2 theta), which was part of the diffraction of the unknown
crystalline component. This demonstrates that some crystalline phases in cheese can be
separated through differential solubility using appropriate solvents to reveal crystalline
species that are not visible in in diffractions generated from the bulk crystalline material.
This method can reveal minor crystalline components that may be sensorily important or
may provide information about the progress of cheese ripening. A zero-background slide
is critical for analyzing minor crystalline components, as they are often isolated in very
small quantities.
A similar method can be employed to extract crystalline material from the
surface of washed rind cheese. In this class of cheeses, crystalline material may manifest
as grittiness or sandiness on a cheese surface that may or may not be desirable. This
grittiness is likely due to the crystallization of calcium phosphate in various forms. The
crystalline nature of surface grittiness can be rapidly confirmed by generating X-ray
diffractions.
Some washed rind cheeses may not present any perceptible grittiness on their
surface but surface scrapings of the bacterial smear will strongly diffract X-rays
nonetheless. This is an indication that sub-visible, imperceptible crystals have formed on
the surface. Although these microscopic micro-crystals do not seem to affect sensory
characteristics, they may have an impact on cheese ripening processes such as calcium
migration and body softening.

73
Currently, several crystalline compounds that we have observed from washed
rind and long-aged cheeses remain unidentified, such as the diffraction pattern shown in
Figure 6, which was generated from the smear of a washed rind cheese. Although
satisfactory diffraction patterns have been generated from these crystals, they have not
been successfully matched with a reference diffraction pattern. We assume that reference
patterns for these particular crystalline entities have not been submitted to the
International Center for Diffraction Data (ICDD); although the ICDD database contains
approximately 250,000 reference patterns for different crystalline substances, some
crystals that form in and on cheese may be missing. As noted earlier, we recently
characterized the diffraction pattern for an enantiomeric form of calcium lactate
pentahydrate that frequently forms on cheddar cheese, which did not have an indexed
diffraction pattern in the database (Tansman et al., 2014).
Using PXRD for the study of calcium phosphate is much more complicated than
studying amino acid or organic-calcium crystals due to the complexity of calcium
phosphate crystallization. Although the number of different calcium phosphates that
form under physiological conditions is limited, crystals that form in biological systems
often display a large degree of substitution and amorphousness (Dorozhkin and Epple,
2002). Extensive substitution could impact the atomic arrangement of the crystals and
would thus manifest in the diffraction patterns generated from calcium phosphates on
cheese. This phenomenon could explain the diversity of unidentified diffraction patterns
that we have generated from the smear material on washed rind cheeses.

74
X-ray diffraction alone cannot be used to identify crystals for which diffraction patterns
have not been generated and indexed. Nonetheless, PXRD can be used to demonstrate
the absence of common cheese crystals under certain conditions. For instance, PXRD
can demonstrate that calcium lactate, tyrosine, and brushite, all common cheese crystals,
are not responsible for the gritty texture that is characteristic of the rinds of many surface
ripened cheeses. When diffractograms generated from cheese indicate the presence of an
unidentified crystal phase, other analytical tools must be employed to identify the
crystals. X-ray microanalysis in combination with scanning election microscopy has
shown some promise for identifying the precise atomic compositions of cheese crystals in
situ (Morris et al., 1988) and recently, Tansman et al. (2014) identified the previously
undocumented diffraction pattern of calcium DL-lactate pentahydrate in cheese using
enzymatic analysis.
Although PXRD cannot be used at the moment to identify crystals that form on
washed rind cheese, qualitative data from PXRD can nonetheless provide detailed
information about the extent and type of crystallization. Sharp, well-defined peaks that
rise well above the baseline indicate the presence of crystallized entities (Legeros et al.,
2003), and conversely, peak broadening indicates small crystallite size (Venkateswarlu et
al., 2010). According to Venkateswarlu et al. (2010), there is potential to use PXRD to
determine the size of crystallites in a sample from information in a diffractogram;
however, in order to obtain quantitative data on crystallite size, lattice strain values must
be known for a given substance or they must be determined experimentally. If a crystal
75
species is missing lattice strain information or has not been identified, peak broadening
can provide qualitative data about the relative sizes of crystallites in a sample.
Crystallite size data is important for the quality control of cheeses that are susceptible to
crystal formation. Very small crystals in food may not be perceived at all, whereas very
large crystals may produce an undesirable texture (Hough et al., 1990). In addition, in
some cheeses crystals cause grittiness that is desirable (personal communication with
local cheesemonger) and crystals within a certain size range may cause this. The ability
to quantify crystallite size using PXRD represents an alternative to the expensive and
cumbersome method of using light microscopy for the same purpose.
Calcium phosphates differ in composition depending on the pH and chemical
composition of the aqueous phases from which they form (Dorozhkin and Epple, 2002).
In cheese, the pH, calcium, and phosphate composition can differ based on a plethora of
manufacturing variables (Le Graet et al., 1983), and thus many different forms of calcium
phosphate can be observed in and on cheese. To date, we have observed no less than 6
different and unidentified diffraction patterns from material harvested from the rinds of
surface ripened cheeses, where calcium phosphate precipitates accumulate (Brooker,
1987). It has never before been conclusively demonstrated that these precipitates are
indeed crystalline; however, in the absence of reference diffraction patterns, one may
only speculate about the precise composition of these crystals.
Although the instrumental and analytical capabilities of PXRD are highly
developed, they can only be fully harnessed when the ICDD database contains the
76
relevant reference diffraction data. Thus, cheese scientists should further develop this
highly useful instrument to suit research and quality control applications.
3.3. References
Brooker, B. E. 1987. The crystallization of calcium phosphate at the surface of mould-
ripened cheeses. Food Microstructure 6:25-33.
Chou, Y. E., C. G. Edwards, L. O. Luedecke, M. P. Bates, and S. Clark. 2003. Nonstarter
lactic acid bacteria and aging temperature affect calcium lactate crystallization in
Cheddar cheese. Journal of Dairy Science 86:2516-2524.
Dorozhkin, S. V. and M. Epple. 2002. Biological and medical significance of calcium
phosphates. Angew. Chem. Int. Ed. 41:3130-3146.
Harper, W. J., A. M. Swanson, and H. H. Sommer. 1953. Observations on the chemical
composition of white particles in several lots of Cheddar cheese. Journal of Dairy Science
36(4):368-372.
Hough, G., E. Martinez, and A. Contarini. 1990. Sensory and objective measurement of
sandiness in Dulce de Leche, a typical Argentine dairy product. Journal of Dairy Science
73(3):604-611.
Le Graet, Y., A. Lepienne, G. Brule, and P. Ducruet. 1983. Migration du calcium et des
phosphates inorganiques dans les fromages à pâte molle de type Camembert au cours de
l'affinage. Le Lait 63:317-332.
77
Legeros, R. Z., S. Lin, R. Roganizadeh, D. Mijares, and J. P. Legeros. 2003. Biphasic
calcium phosphate bioceramics: preparation, properties and applications. Journal of
materials science: materials in medicine 14:201-209.
Morris, H. A., C. Hold, J. B. Brooker, and W. Manson. 1988. Inorganic constituents of
cheese: analysis of juice from a one-month-old Cheddar cheese and the use of light and
electron microscopy to characterize the crystalline phases. Journal of Dairy Research
55:255-268.
Scharpf, L. G. and M. J. Michnick. 1967. In situ identification of crystals on process
cheese by x-ray diffraction. Journal of Dairy Science 50(12):1989-1991.
Tansman, G., P. S. Kindstedt, and J. M. Hughes. 2014. Powder x-ray diffraction can
differentiate between enantiomeric variants of calcium lactate pentahydrate crystal in
cheese. Journal of Dairy Science Under Review.
Tuckey, S. L. and H. A. Ruehe. 1938. An x-ray diffraction analysis of Cheddar cheese.
Journal of Dairy Science 21(12):777-789.
Tuckey, S. L., H. A. Ruehe, and G. L. Clark. 1938. X-ray diffraction analysis of white
specks in Cheddar cheese. Journal of Dairy Science 21:161.
Venkateswarlu, K., A. Chandra Bose, and N. Rameshbabu. 2010. X-ray peak broadening
studies of nanocrystalline hydroxyapatite by Williamson-Hall analysis. Physica B:
Condensed Matter 405(20):4256-4261.
78
Figure Captions
Figure 1. Spectral shifting caused by improper loading of calcium lactate penthydrate on
a glass diffraction slide. The red pattern corresponds to a properly loaded sample, while
the blue pattern corresponds to a sample that was overloaded.
Figure 2. Diffraction pattern of crystalline scrapings from Cheddar cheese before
defatting and drying with acetone.
Figure 3. Diffraction pattern of crystalline scrapings from Cheddar cheese after defatting
and drying with acetone.
Figure 4. Diffraction pattern of crystalline scrapings from the surface of Cheddar cheese
suggests only the presence of crystalline calcium lactate except for one small peak at 6
degrees (2 theta). The green bars correspond to calcium lactate and the small peak at 6
degrees (2 theta) belongs to an unknown entity.
Figure 5. Diffraction pattern of insoluble material that remained after crystalline material
from the surface of Cheddar cheese was dissolved in water. The green bars correspond to
tyrosine, the large peak at 6 degrees (2 theta) belongs to an unknown entity, and the other
peaks belong to calcium lactate that was not dissolved.
Figure 6. Diffraction pattern of gritty material from the surface of a washed rind cheese;
the pattern does not match any of the reference cards in the ICDD.
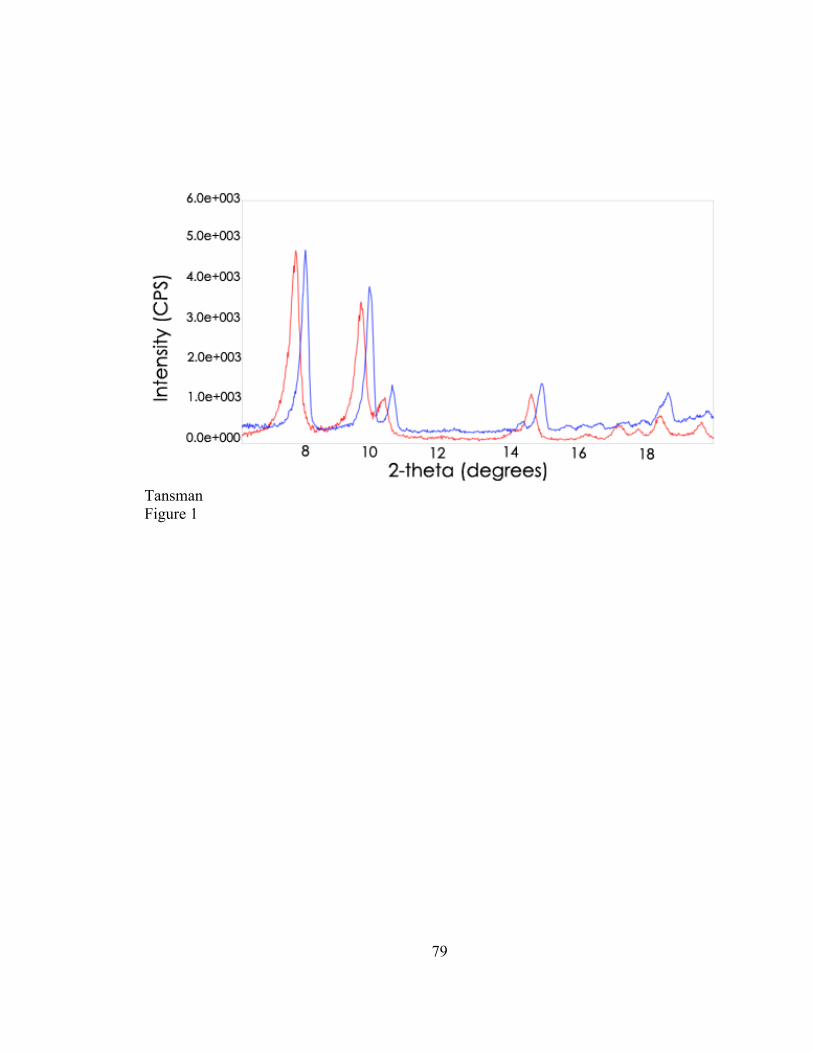
79
Tansman Figure 1
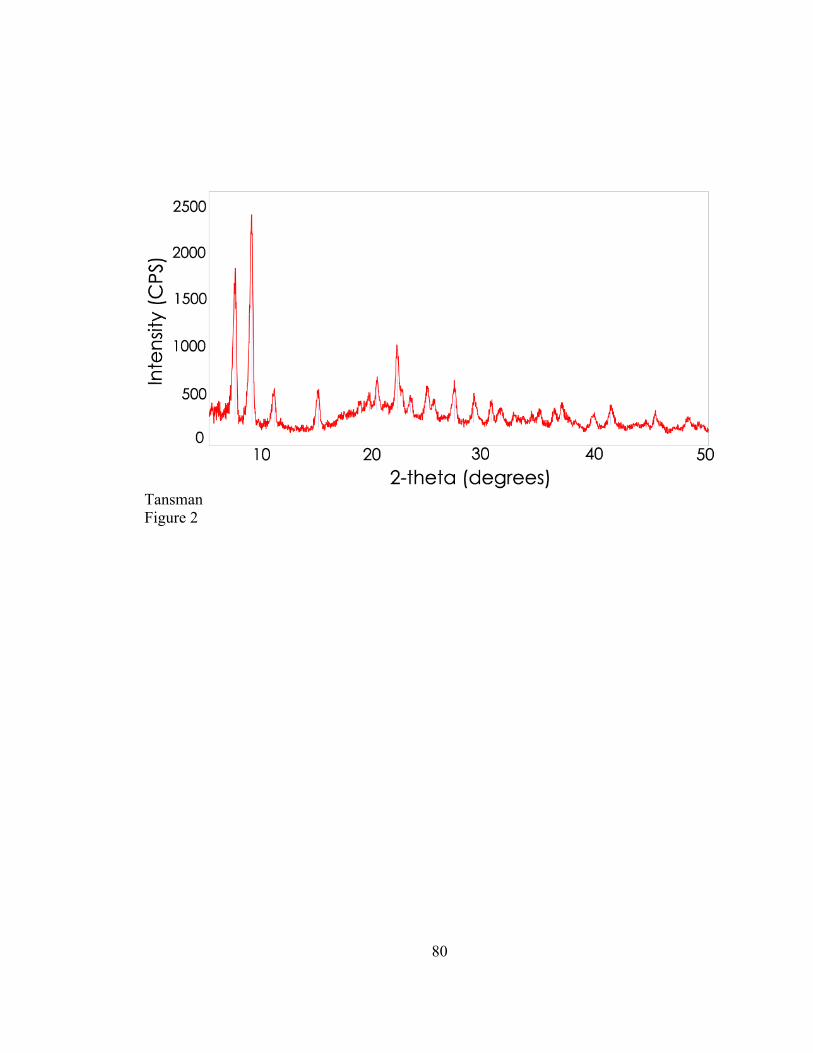
80
Tansman Figure 2
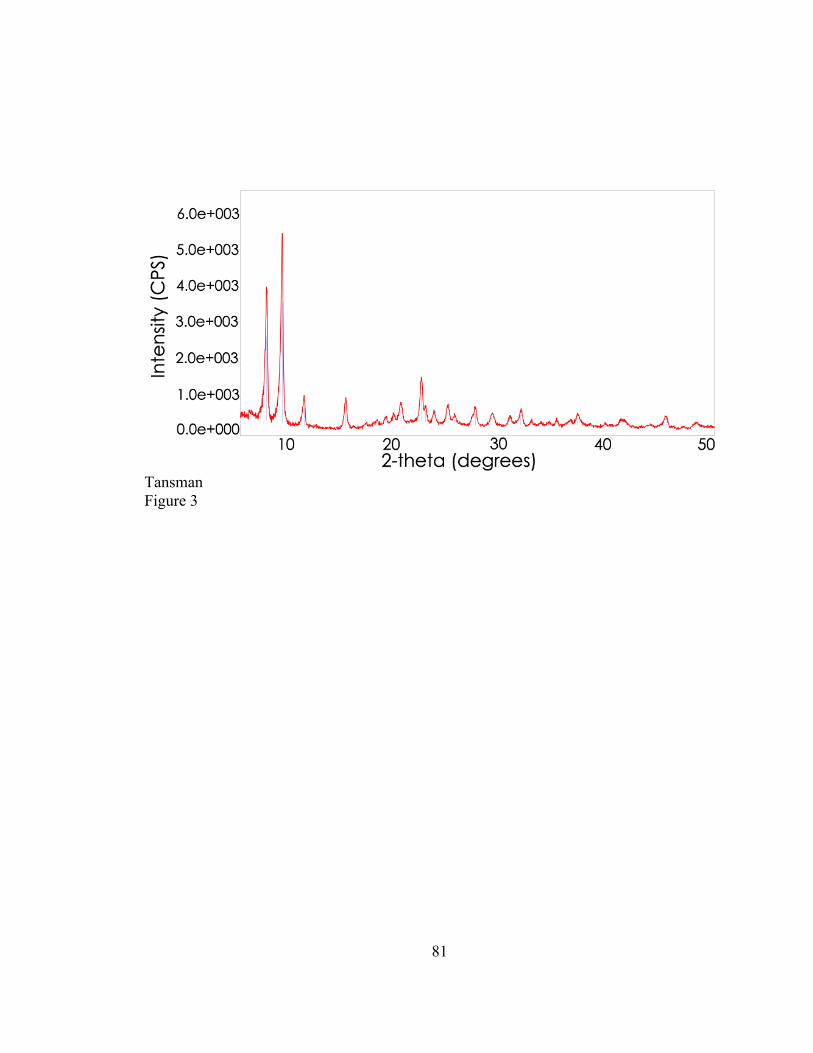
81
Tansman Figure 3
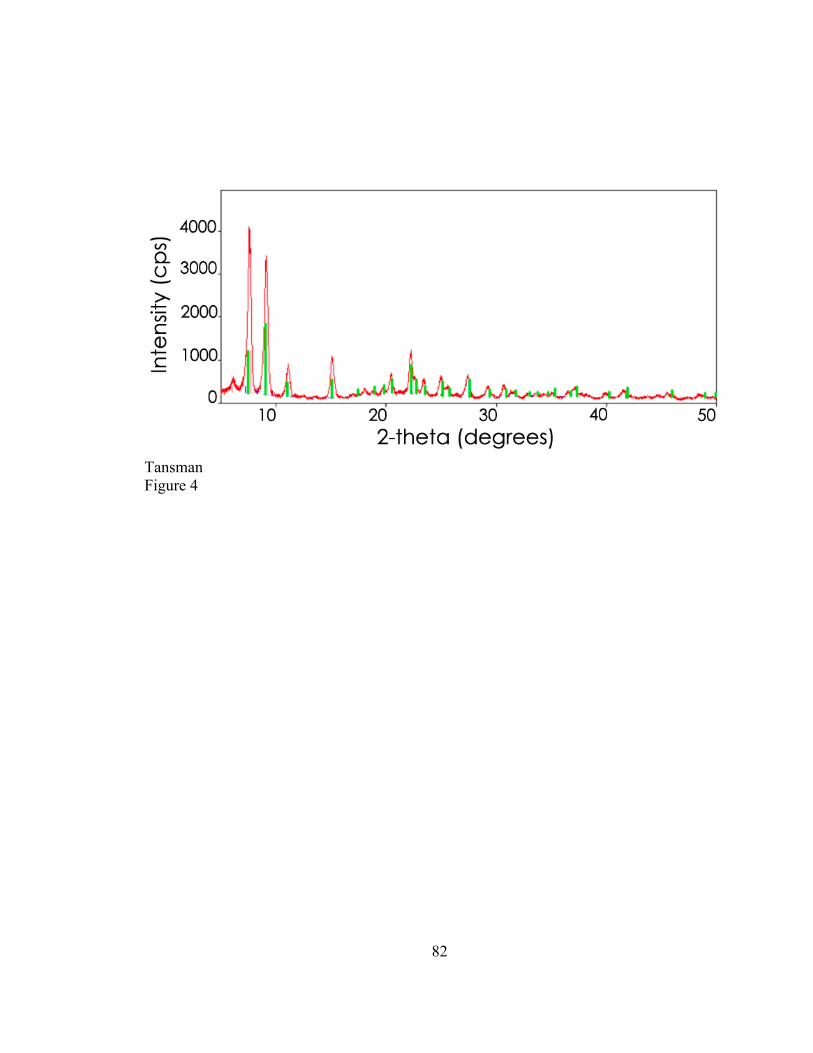
82
Tansman Figure 4
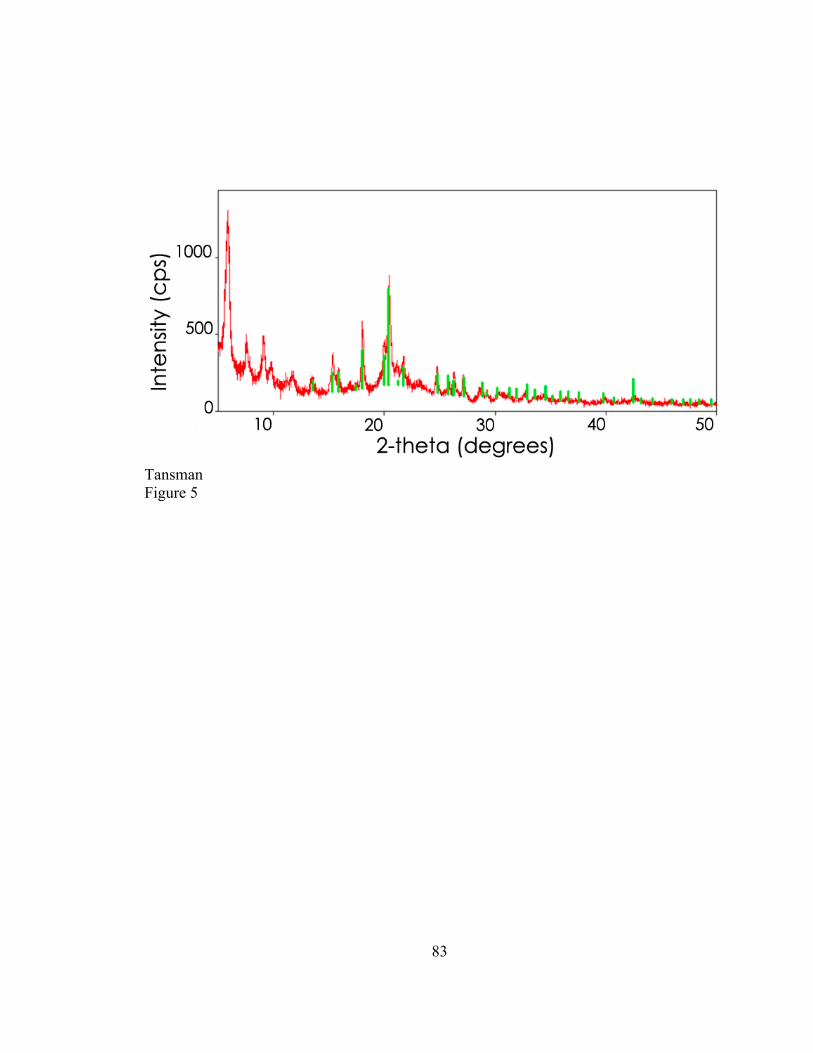
83
Tansman Figure 5
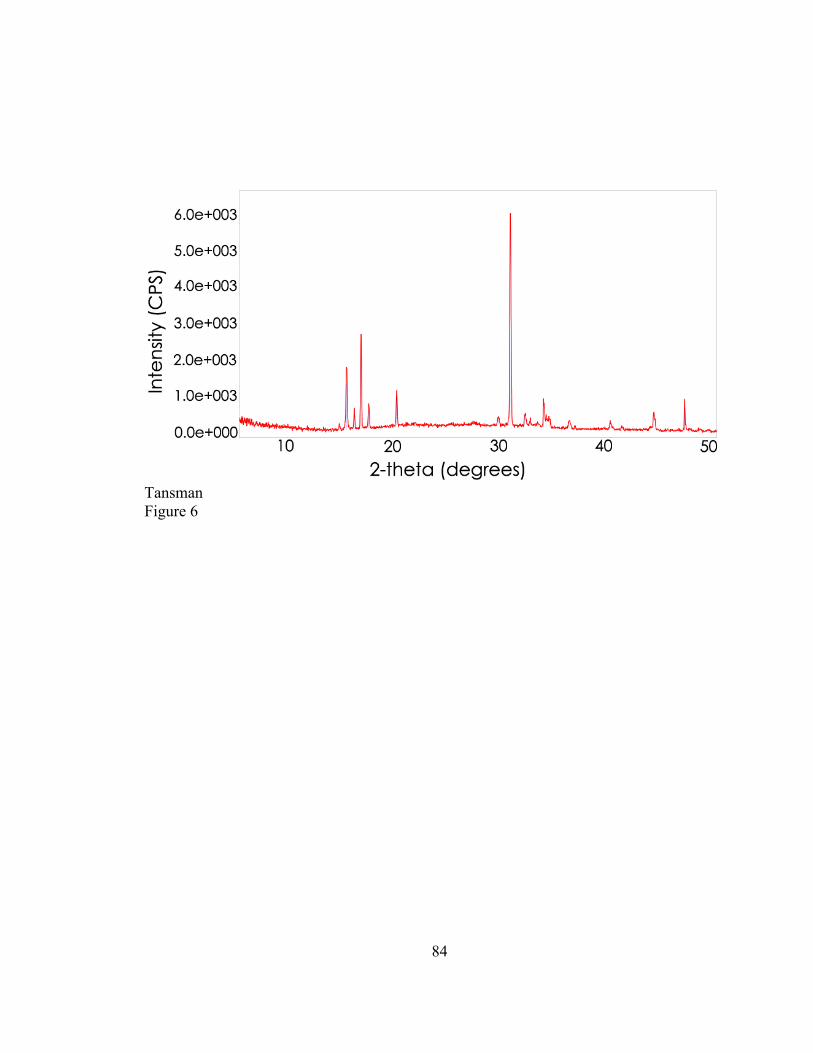
84
Tansman Figure 6
85
4.1. Comprehensive Bibliography
Agarwal, S., M. Costello, and S. Clark. 2005. Gas-flushed packaging contributes to
calcium lactate crystals in Cheddar cheese. Journal of Dairy Science 88:3773-3783.
Agarwal, S., R. J. Powers, B. G. Swanson, S. Chen, and S. Clark. 2006a. Cheese pH,
protein concentration, and formation of calcium lactate crystals. Journal of Dairy Science
89:4144-4155.
Agarwal, S., R. J. Powers, B. G. Swanson, S. Chen, and S. Clark. 2008. Influence of salt-
to-moisture ratio on starter culture and calcium lactate formation. Journal of Dairy
Science 91:2967-2980.
Agarwal, S., K. Sharma, B. G. Swanson, U. Yuksel, and S. Clark. 2006b. Nonstarter
lactic acid bacteria biofilms and calcium lactate crystals in Cheddar cheese. Journal of
Dairy Science 89:1452-1466.
Amend, J. P. and H. C. Helgeson. 1997. Solubilities of the common L-alpha-amino acids
as a function of temperature and solution pH. Pure and Applied Chemistry 69(5):935-
942.
Bianchi, A., G. Berretta, G. Caserio, and G. Giolitti. 1974. Amino acid composition of
granules and spots in Grana Padano cheeses. Journal of Dairy Science 57(12):1504-1508.
Blake, A. J., R. J. Powers, L. O. Luedecke, and S. Clark. 2005. Enhanced lactose cheese
milk does not guarantee calcium lactate crystals in finished Cheddar cheese. Journal of
Dairy Science 88:2302-2311.
86
Bouman, S., D. B. Lind, F. M. Driessen, and D. G. Schmidt. 1982. Growth of
thermoresistant streptococci and deposition of milk constituents on plates of heat
exchangers during long operating times. Journal of Food Protection 45:806-812.
Boutrou, R., F. Gaucheron, M. Piot, F. Michel, J. Maubois, and J. Leonil. 1999. Changes
in the composition of juice expressed from Camembert cheese during ripening. Lait
79:503-513.
Brooker, B. E. 1987. The crystallization of calcium phosphate at the surface of mould-
ripened cheeses. Food Microstructure 6:25-33.
Cao, X., H. Lee, H. Yun, and Y. Koo. 2001. Solubilities of calcium and zinc lactate in
water and water-ethanol mixture. Korean Journal of Chemical Engineering 18(1):133-
135.
Carvalho, A. S., S. J., Ho.P., P. Teixeira, F. X. Malcata, and P. Gibbs. 2002. Survival of
freeze-dried Lactobacillus plantarum and Lactobacillus rhamnosus during storage in the
presence of protectants. Biotechnology Letters 24:1587-1591.
Chou, Y. E., C. G. Edwards, L. O. Luedecke, M. P. Bates, and S. Clark. 2003. Nonstarter
lactic acid bacteria and aging temperature affect calcium lactate crystallization in
Cheddar cheese. Journal of Dairy Science 86:2516-2524.
Conochie, J., J. Czulak, A. J. Lawrence, and W. F. Cole. 1960. Tyrosine and calcium
lactate crystals on rindless cheese. Australian Journal of Dairy Technology 15(3):120.
Conochie, J. and B. J. Sutherland. 1965. The nature and cause of seaminess of Cheddar
cheese. Journal of Dairy Research 32:35-44.
87
Crow, V., B. Curry, and M. Hayes. 2001. The ecology of non-starter lactic acid bacteria
(NSLAB) and their use as adjuncts in New Zealand Cheddar. International Dairy Journal
11:275-283.
Dorn, F. L. and A. C. Dahlberg. 1942. Identification of the white particles found on
ripened Cheddar cheese. Journal of Dairy Science 25(1):31-36.
Dorozhkin, S. V. and M. Epple. 2002. Biological and medical significance of calcium
phosphates. Angew. Chem. Int. Ed. 41:3130-3146.
Dybing, S. T., J. A. Wiegand, S. A. Brudvig, E. A. Huang, and R. C. Chandan. 1988.
Effect of processing variables on the formation of calcium lactate crystals on Cheddar
cheese. Journal of Dairy Science 71(7):1701-1710.
Ferreira, A., C. Oliveira, and F. Rocha. 2003. The different phases in the precipitation of
dicalcium phosphate dihydrate. Journal of Crystal Growth 252:599-611.
Folen, V. A. 1975. X-Ray powder diffraction data for some drugs, excipients, and
adulterants in illicit samples. Journal of Forensic Science 20(2):348-372.
Fox, P. F. 1987. Cheese: Chemistry, Physics, and Microbiology. Vol. 2. Gallaird
(Printers) Ltd., Great Yarmouth, Great Britain.
Fox, P. F. 1993. Cheese: Chemistry, Physics, and Microbiology. Vol. 1. Chapman and
Hall, Great Yarmouth, Great Britain.
Fox, P. F., T. P. Guinee, T. M. Cogan, and P. L. H. McSweeney. 2000. Fundamentals of
Cheese Science. Aspen Publishers Inc., Gaithersburg, Maryland.
88
Gaucheron, F., Y. Le Graet, F. Michel, V. Briard, and M. Piot. 1999. Evolution of
various salt concentrations in the moisture and in the outer layer and centre of a model
cheese during its brining and storage in an ammoniacal atmosphere. Lait 79:553-566.
Harper, W. J., A. M. Swanson, and H. H. Sommer. 1953. Observations on the chemical
composition of white particles in several lots of Cheddar cheese. Journal of Dairy Science
36(4):368-372.
Hough, G., E. Martinez, and A. Contarini. 1990. Sensory and objective measurement of
sandiness in Dulce de Leche, a typical Argentine dairy product. Journal of Dairy Science
73(3):604-611.
Johnson, M. E., B. A. Riesterer, C. Chen, B. Tricomi, and N. F. Olson. 1990a. Effect of
packaging and storage conditions on calcium lactate crystallization on the surface of
Cheddar cheese. Journal of Dairy Science 73:3033-3041.
Johnson, M. E., B. A. Riesterer, and N. F. Olson. 1990b. Influence of nonstarter bacteria
on calcium lactate crystallization on the surface of Cheddar cheese. Journal of Dairy
Science 73:1145-1149.
Karahadian, C. and R. C. Lindsay. 1987. Integrated rales of lactate, ammonia, and
calcium in texture development of mold surface-ripened cheese. Journal of Dairy Science
70(5):909-918.
Keller, B., N. F. Olson, and T. Richardson. 1974. Mineral retention and rheological
properties of Mozzarella cheese made by direnct acidification. Journal of Dairy Science
57(2):174-180.
89
Kindstedt, P. S. 2005. American Farmstead Cheese. Chelsea Green Publishing Company,
White River Junction, Vermont.
Kosikowski, F. V. 1951. The liberation of free amino acids in raw and pasteurized milk
Cheddar cheese during ripening. Journal of Dairy Science 34(3):235-241.
Kosikowski, F. V. and A. C. Dahlberg. 1954. A quantitative appraisal of the free amino
acids in foreign type cheese. Journal of Dairy Science 37(2):167-172.
Kubantseva, N., R. W. Hartel, and P. A. Swearingen. 2004. Factors affecting solubility of
calcium lactate in aqueous solutions. Journal of Dairy Science 87:863-867.
Le Graet, Y., A. Lepienne, G. Brule, and P. Ducruet. 1983. Migration du calcium et des
phosphates inorganiques dans les fromages à pâte molle de type Camembert au cours de
l'affinage. Le Lait 63:317-332.
Legeros, R. Z., S. Lin, R. Roganizadeh, D. Mijares, and J. P. Legeros. 2003. Biphasic
calcium phosphate bioceramics: preparation, properties and applications. Journal of
materials science: materials in medicine 14:201-209.
Marth, E. H. 1963. Microbiological and chemical aspects of Cheddar cheese ripening. A
review. Journal of Dairy Science 46(9):869-890.
McDowall, F. H. and A. K. R. McDowell. 1939. The white particles in mature Cheddar
cheese. Journal of Dairy Research 10:118-119.
Morris, H. A., C. Hold, J. B. Brooker, and W. Manson. 1988. Inorganic constituents of
cheese: analysis of juice from a one-month-old Cheddar cheese and the use of light and
electron microscopy to characterize the crystalline phases. Journal of Dairy Research
55:255-268.
90
Noomen, A. 1983. The role of the surface flora in the softening of cheeses with a low
initial pH. Neth. Milk Dairy Journal 37:229-232.
Peveler, W. W. and T. G. Palmer. 2012. Effecs of magnesium lactate dihydrate and
calcium lactate monohydrate on 20-km cycling time trial performance. Journal of
Strength and Conditioning Research 26(4):1149-1153.
Poveda, J. M., M. J. Sousa, L. Cabezas, and P. L. H. McSweeney. 2003. Preliminary
observations on proteolysis in Manchego cheese made with a defined-strain starter
culture and adjunct starter (Lactobacillus plantarum) or a commercial starter.
International Dairy Journal 13:169-178.
Rajbhandari, P. and P. S. Kindstedt. 2005. Compositional factors associated with calcium
lactate crystallization in smoked Cheddar cheese. Journal of Dairy Science 88(11):3737-
3744.
Rajbhandari, P. and P. S. Kindstedt. 2008. Characterization of calcium lactate crystals on
Cheddar cheese by image analysis. Journal of Dairy Science 91:2190-2195.
Rajbhandari, P., J. Patel, E. Valentine, and P. S. Kindstedt. 2009. Chemical changes that
predispose smoked Cheddar cheese to calcium lactate crystallization. Journal of Dairy
Science 92(8):3616-3622.
Sakata, Y., S. Shiraishi, and M. Otsuka. 2005. Characterization of dehydration and
hydration behavior of calcium lactate pentahydrate and its anhydrate. Colloids and
Surfaces B: Biointerfaces 46:135-141.
Scharpf, L. G. and M. J. Michnick. 1967. In situ identification of crystals on process
cheese by x-ray diffraction. Journal of Dairy Science 50(12):1989-1991.
91
Severn, D. J. and M. E. Johnson. 1986. Determination of Lactic Acid in Cheddar Cheese
and Calcium Lactate Crystals. Journal of Dairy Science 69:2027-2030.
Shock, A. A., W. J. Harper, A. M. Swanson, and H. H. Sommer. 1948. What's in those
"white specks" on cheddar. Wis. Agr. Expt. Sta. Bull. 474:31-32.
Silverman, G. J. and F. V. Kosikowski. 1955. Tyrosine in Cheddar. Journal of Dairy
Science 38(9):950-958.
Somers, E. B., M. E. Johnson, and A. C. L. Wong. 2001. Biofilm formation and
contamination of cheese by nonstarter lactic acid bacteria in the dairy environment.
Journal of Dairy Science 84:1926-1936.
Swearingen, P. A., D. E. Adams, and T. L. Lensmire. 2004. Factors affecting calcium
lactate and liquid expulsion defects in Cheddar cheese. Journal of Dairy Science 87:574-
582.
Tansman, G., P. S. Kindstedt, and J. M. Hughes. 2013. Application of an improved
powder x-ray diffraction method to evaluate cheese crystals. Journal of Dairy Science
96(E-Suppl. 1):195.
Tansman, G., P. S. Kindstedt, and J. M. Hughes. 2014. Powder x-ray diffraction can
differentiate between enantiomeric variants of calcium lactate pentahydrate crystal in
cheese. Journal of Dairy Science Under Review.
Thomas, T. D. and V. L. Crow. 1983. Mechanisms of D(-)-lactic acid formation in
Cheddar cheese. New Zealand Journal of Dairy Scienceand Technology 18:131-141.
Tuckey, S. L. and H. A. Ruehe. 1938. An x-ray diffraction analysis of Cheddar cheese.
Journal of Dairy Science 21(12):777-789.
92
Tuckey, S. L., H. A. Ruehe, and G. L. Clark. 1938. X-ray diffraction analysis of white
specks in Cheddar cheese. Journal of Dairy Science 21:161.
Van Slyke, L. L. and A. B. Publow. 1909. The Science and Practice of Cheese-Making.
Orange Judd Company, New York.
Venkateswarlu, K., A. Chandra Bose, and N. Rameshbabu. 2010. X-ray peak broadening
studies of nanocrystalline hydroxyapatite by Williamson-Hall analysis. Physica B:
Condensed Matter 405(20):4256-4261.
Zannoni, M., B. L., and H. E. A. 1994. Comparison of Parmigiano-Reggiani and
American Parmesan cheeses by sensory analysis of texture. Scienza E Technica Lattiero-
Casearia 45(6):505-518.