Embed Size (px)
Citation preview
E X P L OR ING T HE IMP OR TA NCE OF L O W WA GE , HIGH S OCI A L VA L UE C A R E E R SSandy Baum Urban Institute
Lorelle Espinosa Alfred P. Sloan Foundation
— 1 —
TA B L E OF C O N T E N T SIntroduction . . . . . . . . . . . . . . . . . . . . . . . . . . . . . . . . . . . . . . . . . . . . . . . . . . . . . . . . . . . . . . . . 2
Women and African Americans are Overrepresented in Many Low-Wage, High Social Value Professions Requiring a Bachelor’s Degree . . . . . . . . . . . . . . . . . . . . . . . . 4
Earnings Levels Differ Across College Majors, but Majors Do Not Necessarily Determine Occupations . . . . . . . . . . . . . . . . . . . . . . . . . . . . . 5
Women and Many Students of Color are More Likely to Choose Majors Associated with Low-Earning Occupations . . . . . . . . . . . . . . . . . . . . . . . . 6
Wages Don’t Tell the Whole Story of How Workers are Compensated . . . . . . . . . . . . . . . . . . 9
Non-Monetary Benefits of Low-Wage, High Social Value Jobs Can Outweigh Earnings Considerations . . . . . . . . . . . . . . . . . . . . . . . . . . . . . . . . . . . . . . . . . . . . . 10
Conclusion and Recommendations to the Commission . . . . . . . . . . . . . . . . . . . . . . . . . . . . . 11
References . . . . . . . . . . . . . . . . . . . . . . . . . . . . . . . . . . . . . . . . . . . . . . . . . . . . . . . . . . . . . . . . 13
Suggested citation: Baum, S., & Espinosa, L. (2021). Exploring the Importance of Low Wage, High Social Value Careers. Postsecondary Value Commission.
This paper is one in a foundational research series for the Postsecondary Value Commission authored in summer 2019 by scholars with diverse backgrounds and expertise. The research presented in these papers applies an equity lens to the philosophical, measurement, and policy considerations and assumptions underlying key components of postsecondary value to students and society, including investment, economic and non-economic returns, mobility, and racial and socioeconomic justice.
The Postsecondary Value Commission consulted this foundational research as it developed a conceptual definition of postsecondary value, a framework for measuring how institutions and programs create value and ensure equitable outcomes, and an action agenda with recommendations for applying the definition and framework to change policies and practices. Through this breadth of scholarship, the commission was better able to define the value of postsecondary education and the role institutions can play in creating a more equitable and fair United States.
Following the May 2021 release of the commission’s findings, these foundational papers were prepared for publication. The views and opinions expressed in these papers do not necessarily reflect the positions of individual members of the Postsecondary Value Commission or the organizations they represent.
The Postsecondary Value Commission along with the Bill & Melinda Gates Foundation and Institute for Higher Education Policy are deeply grateful to the authors of this series. The authors’ extensive expertise and thoughtful engagement in this work provided the foundation for the commission to develop an informed, innovative, and equity-driven framework. They also thank Deborah Seymour for editing the written products and the team at GMMB for their creative design and layout.
— 2 —
IN T R OD U C T IO NEvery occupation involves other disadvantages besides the fatigue of the work required in it, and every occupation offers other advantages besides the receipt of money wages. The true reward which an occupation offers to labour has to be calculated by deducting the money value of all its disadvantages from that of all its advantages.
— Alfred Marshall, Principles of Economics, p.155
Many college graduates who earn less than their peers are employed in occupations that bring significant benefits to society, as well as high levels of personal satisfaction. Examples include almost all forms of teaching, such as early childhood education; counseling; and social work. It is not easy—nor is there agreement on how—to precisely define the social value of these occupations or to measure the magnitude and distribution of their benefits—but understanding this issue is critical to considering the payoff to higher education.
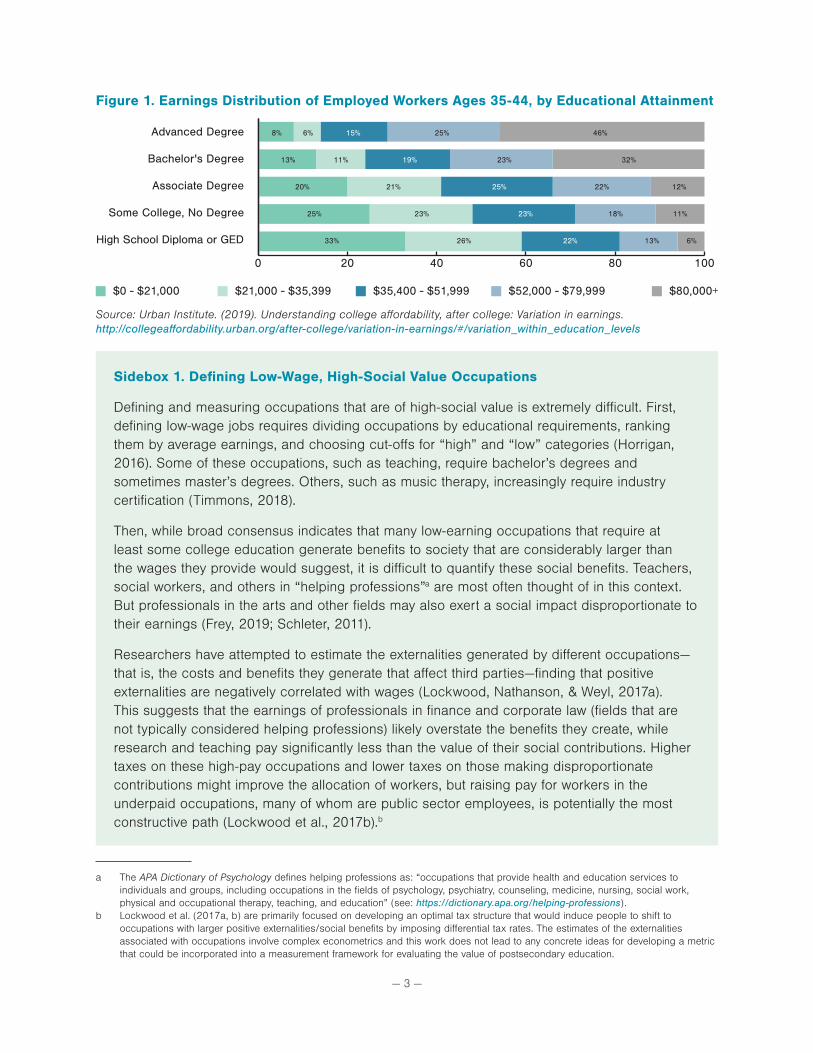
Variation in earnings among adults with the same level of education (Figure 1) results from a wide range of factors including differences in personal characteristics, geography, and work experience. But there are some occupations for which postsecondary education is required in which workers systematically earn substantially less than others with the same level of education and similar personal characteristics. Many of these occupations have high social value. This paper explores these low wage, high social value occupations in the context of defining and measuring postsecondary value. It begins by outlining variations in wages for occupations that require similar levels of education and then discusses the relationship between college major, gender, race/ethnicity, socioeconomic status, and occupation choice, as well as the importance of examining the total compensation associated with these occupations. The paper concludes with recommendations for how to measure the value of these low-wage, high social value careers as well as how to incorporate the value of these careers into the Postsecondary Value Framework.
“ It is not easy—nor is there agreement on how—to precisely define the social value of these occupations or to measure the magnitude and distribution of their benefits—but understanding this issue is critical to considering the payoff to higher education .
— 3 —
Figure 1 . Earnings Distribution of Employed Workers Ages 35-44, by Educational Attainment
Source: Urban Institute. (2019). Understanding college affordability, after college: Variation in earnings. http://collegeaffordability.urban.org/after-college/variation-in-earnings/#/variation_within_education_levels
Sidebox 1 . Defining Low-Wage, High-Social Value Occupations
Defining and measuring occupations that are of high-social value is extremely difficult. First, defining low-wage jobs requires dividing occupations by educational requirements, ranking them by average earnings, and choosing cut-offs for “high” and “low” categories (Horrigan, 2016). Some of these occupations, such as teaching, require bachelor’s degrees and sometimes master’s degrees. Others, such as music therapy, increasingly require industry certification (Timmons, 2018).
Then, while broad consensus indicates that many low-earning occupations that require at least some college education generate benefits to society that are considerably larger than the wages they provide would suggest, it is difficult to quantify these social benefits. Teachers, social workers, and others in “helping professions”a are most often thought of in this context. But professionals in the arts and other fields may also exert a social impact disproportionate to their earnings (Frey, 2019; Schleter, 2011).
Researchers have attempted to estimate the externalities generated by different occupations—that is, the costs and benefits they generate that affect third parties—finding that positive externalities are negatively correlated with wages (Lockwood, Nathanson, & Weyl, 2017a). This suggests that the earnings of professionals in finance and corporate law (fields that are not typically considered helping professions) likely overstate the benefits they create, while research and teaching pay significantly less than the value of their social contributions. Higher taxes on these high-pay occupations and lower taxes on those making disproportionate contributions might improve the allocation of workers, but raising pay for workers in the underpaid occupations, many of whom are public sector employees, is potentially the most constructive path (Lockwood et al., 2017b).b
a The APA Dictionary of Psychology defines helping professions as: “occupations that provide health and education services to individuals and groups, including occupations in the fields of psychology, psychiatry, counseling, medicine, nursing, social work, physical and occupational therapy, teaching, and education” (see: https://dictionary.apa.org/helping-professions).
b Lockwood et al. (2017a, b) are primarily focused on developing an optimal tax structure that would induce people to shift to occupations with larger positive externalities/social benefits by imposing differential tax rates. The estimates of the externalities associated with occupations involve complex econometrics and this work does not lead to any concrete ideas for developing a metric that could be incorporated into a measurement framework for evaluating the value of postsecondary education.
0 20 40 60 80 100
Advanced Degree 8% 6% 25% 46%15%
Bachelor's Degree 13% 11% 19% 23% 32%
Associate Degree 20% 21% 25% 22% 12%
Some College, No Degree 25% 23% 18% 11%23%
High School Diploma or GED 33% 26% 13% 6%22%
$21,000 - $35,399$0 - $21,000 $35,400 - $51,999 $52,000 - $79,999 $80,000+
— 4 —
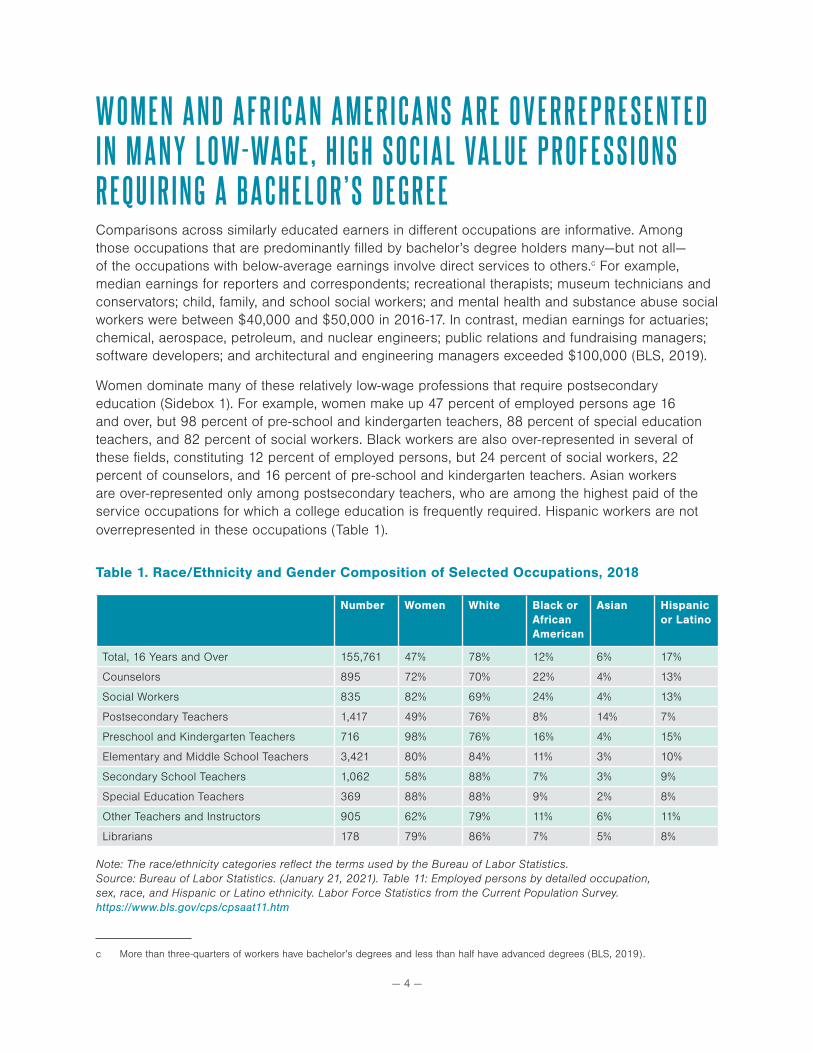
W O ME N A ND A F R IC A N A ME R IC A N S A R E O V E R R E P R E S E N T E D IN M A N Y L O W - WA G E , HIG H S O C I A L VA L UE P R OF E S S IO N S R E Q UIR IN G A B A C HE L O R ’ S DE G R E EComparisons across similarly educated earners in different occupations are informative. Among those occupations that are predominantly filled by bachelor’s degree holders many—but not all—of the occupations with below-average earnings involve direct services to others.c For example, median earnings for reporters and correspondents; recreational therapists; museum technicians and conservators; child, family, and school social workers; and mental health and substance abuse social workers were between $40,000 and $50,000 in 2016-17. In contrast, median earnings for actuaries; chemical, aerospace, petroleum, and nuclear engineers; public relations and fundraising managers; software developers; and architectural and engineering managers exceeded $100,000 (BLS, 2019).
Women dominate many of these relatively low-wage professions that require postsecondary education (Sidebox 1). For example, women make up 47 percent of employed persons age 16 and over, but 98 percent of pre-school and kindergarten teachers, 88 percent of special education teachers, and 82 percent of social workers. Black workers are also over-represented in several of these fields, constituting 12 percent of employed persons, but 24 percent of social workers, 22 percent of counselors, and 16 percent of pre-school and kindergarten teachers. Asian workers are over-represented only among postsecondary teachers, who are among the highest paid of the service occupations for which a college education is frequently required. Hispanic workers are not overrepresented in these occupations (Table 1).
Table 1 . Race/Ethnicity and Gender Composition of Selected Occupations, 2018
Number Women White Black or African American
Asian Hispanic or Latino
Total, 16 Years and Over 155,761 47% 78% 12% 6% 17%
Counselors 895 72% 70% 22% 4% 13%
Social Workers 835 82% 69% 24% 4% 13%
Postsecondary Teachers 1,417 49% 76% 8% 14% 7%
Preschool and Kindergarten Teachers 716 98% 76% 16% 4% 15%
Elementary and Middle School Teachers 3,421 80% 84% 11% 3% 10%
Secondary School Teachers 1,062 58% 88% 7% 3% 9%
Special Education Teachers 369 88% 88% 9% 2% 8%
Other Teachers and Instructors 905 62% 79% 11% 6% 11%
Librarians 178 79% 86% 7% 5% 8%
Note: The race/ethnicity categories reflect the terms used by the Bureau of Labor Statistics. Source: Bureau of Labor Statistics. (January 21, 2021). Table 11: Employed persons by detailed occupation, sex, race, and Hispanic or Latino ethnicity. Labor Force Statistics from the Current Population Survey. https://www.bls.gov/cps/cpsaat11.htm
c More than three-quarters of workers have bachelor’s degrees and less than half have advanced degrees (BLS, 2019).
— 5 —
Middle-skill occupations, including carpenters, firefighters, legal secretaries, medical assistants, and occupational therapy assistants, require some postsecondary experience, but less than a bachelor’s degree. These jobs tend to require moderate to substantial on-the-job experience and training, and typical earnings vary widely. For example, among associate degree holders working in the fields in which they hold degrees, median earnings in 2016 were $28,000 in education, $58,000 in health sciences, and $73,000 in engineering and drafting (Carnevale, Smith, & Gulish, 2018).
Women are concentrated in the low-wage middle-skill occupations, while men dominate the well-paying middle-skill jobs. According to Hegewisch et al. (2016), women comprise 83 percent of workers in middle-skill jobs paying less than $30,000, 55 percent in all middle-skill jobs, and 36 percent in those that pay at least $35,000. Within both female- and male-dominated occupations, men earn significantly more than women. Carnevale and colleagues (2018) report examples of median wages for 2012 including $39,000 for men and $25,000 for women with certificates in cosmetology; $46,000 for men and $38,000 for women in health care; and $48,000 for men and $28,000 for women in transportation and materials moving.
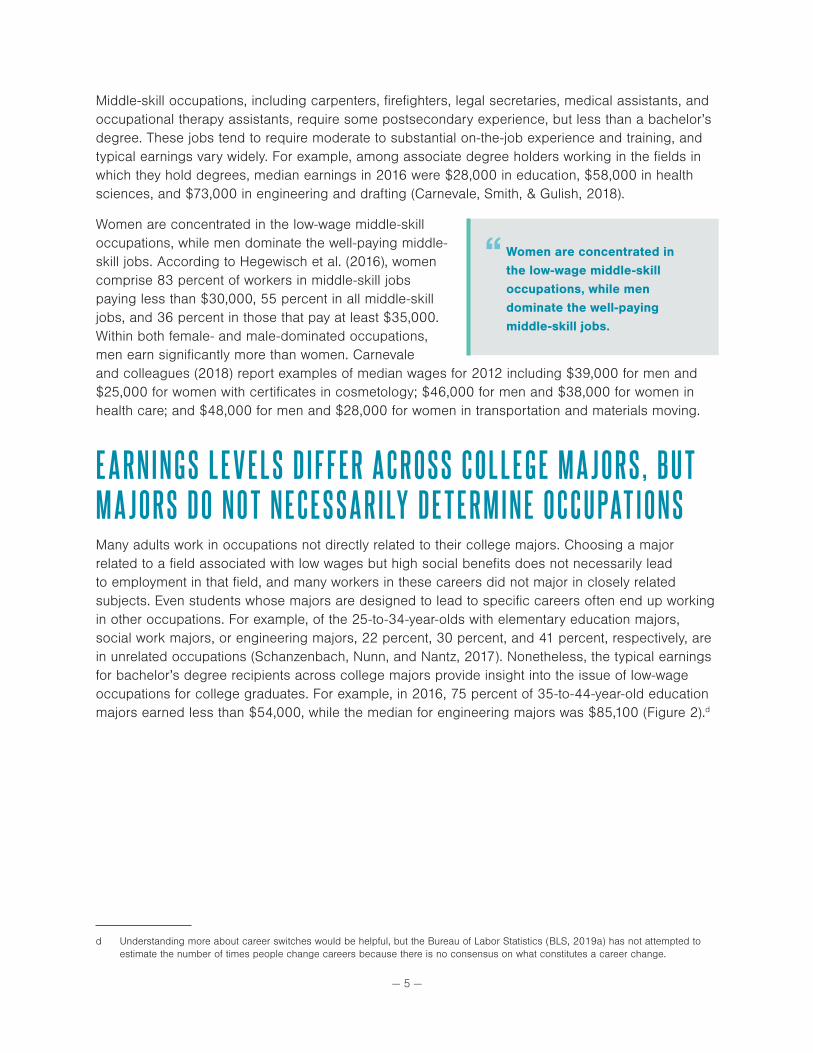
E A R NIN G S L E V E L S D IF F E R A C R O S S C OL L E G E M A J O R S , B U T M A J O R S D O N O T NE C E S S A R ILY DE T E R MINE O C C UPAT IO N SMany adults work in occupations not directly related to their college majors. Choosing a major related to a field associated with low wages but high social benefits does not necessarily lead to employment in that field, and many workers in these careers did not major in closely related subjects. Even students whose majors are designed to lead to specific careers often end up working in other occupations. For example, of the 25-to-34-year-olds with elementary education majors, social work majors, or engineering majors, 22 percent, 30 percent, and 41 percent, respectively, are in unrelated occupations (Schanzenbach, Nunn, and Nantz, 2017). Nonetheless, the typical earnings for bachelor’s degree recipients across college majors provide insight into the issue of low-wage occupations for college graduates. For example, in 2016, 75 percent of 35-to-44-year-old education majors earned less than $54,000, while the median for engineering majors was $85,100 (Figure 2).d
d Understanding more about career switches would be helpful, but the Bureau of Labor Statistics (BLS, 2019a) has not attempted to estimate the number of times people change careers because there is no consensus on what constitutes a career change.
“ Women are concentrated in the low-wage middle-skill occupations, while men dominate the well-paying middle-skill jobs .
— 6 —
Figure 2 . 2016 Earnings by Field of Study at the Median and 25th and 75th Percentiles, Employed 35-to-44-Year-Olds with Bachelor’s Degrees
Source: Urban Institute. (2019). Understanding college affordability, after college: Variation in earnings. http://collegeaffordability.urban.org/after-college/variation-in-earnings/#/field_of_study
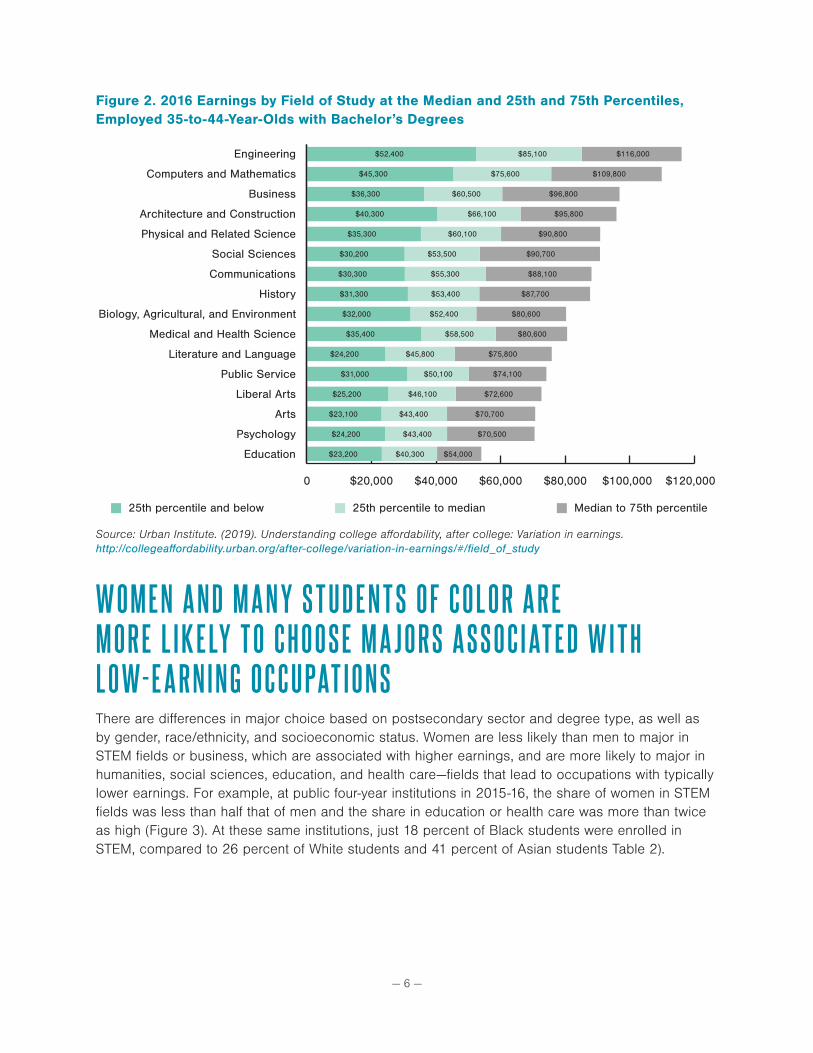
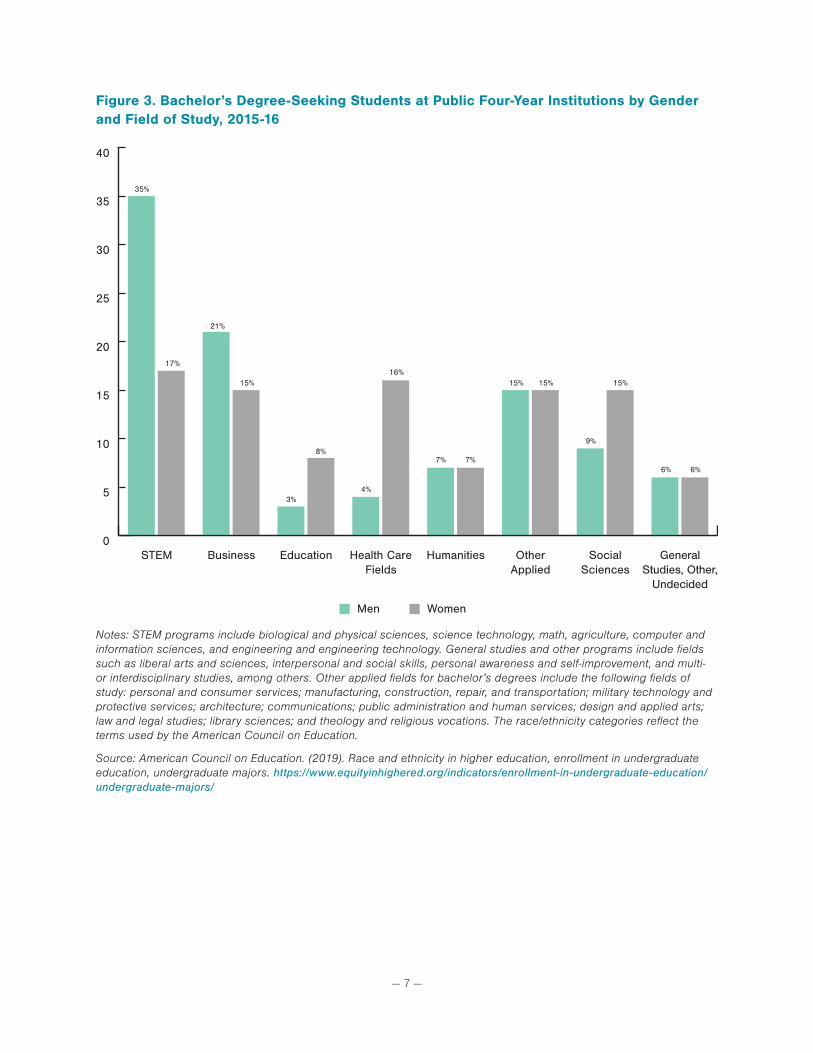
W O ME N A ND M A N Y S T UDE N T S OF C OL O R A R E M O R E L IK E LY T O C HO O S E M A J O R S A S S O C I AT E D W I T H L O W - E A R NIN G O C C UPAT IO N SThere are differences in major choice based on postsecondary sector and degree type, as well as by gender, race/ethnicity, and socioeconomic status. Women are less likely than men to major in STEM fields or business, which are associated with higher earnings, and are more likely to major in humanities, social sciences, education, and health care—fields that lead to occupations with typically lower earnings. For example, at public four-year institutions in 2015-16, the share of women in STEM fields was less than half that of men and the share in education or health care was more than twice as high (Figure 3). At these same institutions, just 18 percent of Black students were enrolled in STEM, compared to 26 percent of White students and 41 percent of Asian students Table 2).
0 $20,000 $40,000 $60,000 $80,000 $100,000 $120,000
25th percentile to median25th percentile and below Median to 75th percentile
Business $36,300 $60,500 $96,800
Education $23,200 $40,300 $54,000
Psychology $24,200 $43,400 $70,500
Arts $23,100 $43,400 $70,700
Liberal Arts $25,200 $46,100 $72,600
Public Service $31,000 $50,100 $74,100
Literature and Language $24,200 $45,800 $75,800
Medical and Health Science $35,400 $58,500 $80,600
Biology, Agricultural, and Environment $32,000 $52,400 $80,600
History $31,300 $53,400 $87,700
Communications $30,300 $55,300 $88,100
Social Sciences $30,200 $53,500 $90,700
Physical and Related Science $35,300 $60,100 $90,800
Architecture and Construction $40,300 $66,100 $95,800
Computers and Mathematics $45,300 $75,600 $109,800
Engineering $52,400 $85,100 $116,000
— 7 —
Figure 3 . Bachelor’s Degree-Seeking Students at Public Four-Year Institutions by Gender and Field of Study, 2015-16
Notes: STEM programs include biological and physical sciences, science technology, math, agriculture, computer and information sciences, and engineering and engineering technology. General studies and other programs include fields such as liberal arts and sciences, interpersonal and social skills, personal awareness and self-improvement, and multi- or interdisciplinary studies, among others. Other applied fields for bachelor’s degrees include the following fields of study: personal and consumer services; manufacturing, construction, repair, and transportation; military technology and protective services; architecture; communications; public administration and human services; design and applied arts; law and legal studies; library sciences; and theology and religious vocations. The race/ethnicity categories reflect the terms used by the American Council on Education.
Source: American Council on Education. (2019). Race and ethnicity in higher education, enrollment in undergraduate education, undergraduate majors. https://www.equityinhighered.org/indicators/enrollment-in-undergraduate-education/undergraduate-majors/
Men Women
0
5
10
15
20
25
30
35
40
35%
17%
21%
15%
3%
8%
4%
16%
7% 7%
15% 15%
9%
6% 6%
15%
STEM Business Education Health CareFields
Humanities OtherApplied
SocialSciences
GeneralStudies, Other,
Undecided
— 8 —
Table 2 . Bachelor’s Degree-Seeking Students at Public Four-Year Institutions by Race/Ethnicity and Field of Study, 2015-16
All Racial and Ethnic Groups
American Indian or Alaska Native
Asian Black Hispanic Native Hawaiian or Other Pacific Islander
White More than One Race
STEM Fields 25.6% 12.4%! 40.7% 17.7% 22.4% 21.7%! 25.8% 29.1%
Business 18.0% 13.5%! 18.3% 17.4% 16.4% 11.5%! 18.3% 14.7%
Education 5.5% 15.3%! 2.2% 5.2% 4.5% ‡ 6.4% 5.4%
Health Care Fields 10.5% 6.8%! 10.7% 13.3% 9.0% 16.2%! 10.9% 7.7%
Humanities 12.4% 17.0% 8.9% 15.5% 15.0% 17.2%! 11.0% 13.8%
Social Sciences 7.0% 5.5%!! 4.3% 4.4% 8.6% 8.9%! 7.7% 8.0%
General Studies and Other Fields
4.8% 1.7%! 4.3% 4.7% 5.0% ‡ 5.0% 4.0%
Other Applied Fields
15% 27.8% 8.8% 20.9% 17.6% 21.1%! 13.8% 16.1%
Notes: STEM programs include biological and physical sciences, science technology, math, agriculture, computer and information sciences, and engineering and engineering technology. General studies and other programs include fields such as liberal arts and sciences, interpersonal and social skills, personal awareness and self-improvement, and multi- or interdisciplinary studies, among others. Other applied fields for bachelor’s degrees include the following fields of study: personal and consumer services; manufacturing, construction, repair, and transportation; military technology and protective services; architecture; communications; public administration and human services; design and applied arts; law and legal studies; library sciences; and theology and religious vocations. The race/ethnicity categories reflect the terms used by the American Council on Education. ‡: Estimate suppressed. Reporting standards not met !: Interpret with caution. Ratio of standard error to estimate is >30% but <50%. !!: Interpret with caution. Ratio of standard error is > 50%.
Source: American Council on Education. (2019). Race and ethnicity in higher education, enrollment in undergraduate education, undergraduate majors. https://www.equityinhighered.org/indicators/enrollment-in-undergraduate-education/undergraduate-majors/
In addition, a number of studies find that students from lower socioeconomic status (SES) backgrounds are more likely than others to choose career-oriented majors, particularly in the applied sciences, including computer science, math, journalism, law enforcement, and physics (Ma, 2009; Cheng, 2017; Pinkser, 2015; and Trejo, 2016). For example, first-generation students, many of whom are also from families with lower income backgrounds, “are more risk averse than otherwise identical students who have parents who have attended college and tend to select majors with a well-defined career path, high expected wages, and low expected unemployment” (Trejo, 2016, p. 1). Further, students attending less selective institutions, who are disproportionately first-generation students, matriculate into career-oriented majors more often than their peers attending more selective institutions (Cheng, 2017). While low-income students’ representation in career-oriented majors is disproportionately high, low-income and first-generation students remain underrepresented in STEM fields (Enberg & Allen, 2011; Niu, 2016).
— 9 —
In contrast, students from higher-income families are more likely to choose history, English, and performing arts.e Researchers have explored explanations for this phenomenon and suggest that children from high SES backgrounds are more likely than others to value influence and intrinsic rewards (Ma, 2009). They are also better positioned to take risks and choose a less guaranteed path to stable and lucrative careers, since individuals from high-income backgrounds have a safety net not available to others and are more likely to remain financially secure regardless of occupation (Ma, 2009). Moreover, students from low SES backgrounds place greater value on career payoffs, at least in part because of the financial sacrifice incurred by their families supporting their college enrollment (Cheng 2017).
WA G E S D O N ’ T T E L L T HE W HOL E S T O R Y OF HO W W O R K E R S A R E C O MP E N S AT E DWages are not the only thing people consider when choosing careers. Individuals may choose to be teachers, social workers, or counselors in part because they are drawn to fringe benefits such as health care, pension contributions, and paid parental leave not included in wages and salaries. They may also respond to scheduling flexibility—notably the flexible summers associated with K-12 teaching positions—which may reduce required expenditures on things like childcare and transportation.
Researchers have attempted to measure the total compensation offered by different occupations, rather than focusing just on wages and salaries. Duncan (1976) found that level of education was a much better predictor of total compensation, including fringe benefits and other financial benefits, than of base salary alone. For example, teachers’ wages are markedly less than those of their peers in other occupations, but because of the value of their fringe benefits, the gap in total compensation, while significant, is smaller than the gap in salaries. While the relative wage penalty for teaching (after controlling for education, experience, and other factors known to affect earnings) is 21 percent, the fringe benefits gap is smaller. In other words, nonwage benefits make up a greater share of total compensation for teachers—29 percent compared with 22 percent for all professionals in 2018 (Allegretto and Mishel, 2019).
Pay penalties among those working in the helping professions are not limited to teachers. Workers in many occupations providing care for others experience an earnings penalty relative to other workers with similar characteristics (England, Budig, and Folbre, 2002). However, more information is available about teachers’ total compensation than about total compensation in other occupations, making it difficult to know whether nonwage benefits in other helping professions might similarly narrow the compensation gap.
Despite the pay penalty in helping professions, there is evidence that nonwage benefits remain desirable tradeoffs that are positively correlated with overall job satisfaction (Artz, 2010; Baughman, et al., 2003; Weathington & Tetrick, 2000). However, studies have also found inequality is greater in total compensation, particularly for women, than the inequality in wages (Chung, 2003; Monaco & Pierce, 2015; Stevenson, 2015).
e See Davies and Guppy (1997) for a detailed analysis of the association between socioeconomic status (SES) and choice of fields.
— 10 —
N O N - M O NE TA R Y B E NE F I T S OF L O W - WA G E , HIG H S O C I A L VA L UE J OB S C A N O U T W E IG H E A R NIN G S C O N S IDE R AT IO N SIn addition to income, the benefits of higher education are reflected in the nature of the work experience, the reduced risk of being involuntarily under- or unemployed, and decisions about health, marriage, and parenting. Education also has substantial consumption value to some students, and some studies suggest that the nonpecuniary (i.e., nonmonetary) returns to education are at least as large as the financial returns.
In fact, one study estimates that at least three-quarters of the effect of education on self-reported life satisfaction might be due to nonpecuniary factors (Oreopoulos and Salvanes, 2011). Similarly, Haveman and Wolfe (1984) cite studies suggesting monetary equivalent returns to schooling increase by 10 to 40 percent when nonmonetary benefits are incorporated.f Jencks, Perman, and Rainwater (1988) developed an index to measure the overall desirability of jobs, incorporating earnings and 13 nonmonetary job characteristics. Weighting the factors based on workers’ responses to questions about their jobs, they found that the nonmonetary factors combined were twice as important as earnings in determining job satisfaction; only a quarter of the job-related benefits of schooling take monetary form. They concluded that focusing exclusively on monetary returns to investment in education seriously underestimates the overall value of schooling to workers (Table 2). Additionally, Hammermesh (1999) suggests that the value of the nonmonetary returns has grown over time.
Considerable evidence shows that people prioritize factors other than earnings in choosing their careers and that a majority of college students would be willing to trade some pay for the opportunity to help others on the job. This implies that college graduates have to be paid a premium to take jobs where they do not perceive themselves as making a positive social contribution (Frank, 1996). The size of the additional earnings required to move people from more socially and psychologically rewarding jobs varies from study to study and depends on the details of the occupations. Responses to the General Social Survey (NORC, 2016) indicate that adults with higher levels of education—particularly those with at least a bachelor’s degree—are happier even if they do not have higher incomes. Psychologists studying work satisfaction also find that many factors other than pay have a significant impact on how people value their jobs. There is evidence that directly benefitting others adds meaning to people’s jobs, increasing their engagement and level of satisfaction. Many college graduates in relatively low-paying professions may consider themselves fortunate to have found these rewarding lines of work (Weir, 2013).
f Nonmonetary factors in these studies included fringe benefits (e.g., retirement plans, healthcare, and paid leave) and working conditions (e.g. schedule flexibility, hours worked, etc.), which varied by education level.
“ Considerable evidence shows that people prioritize factors other than earnings in choosing their careers and that a majority of college students would be willing to trade some pay for the opportunity to help others on the job .
— 11 —
Measuring the value of a college education for adults in relatively low-wage, high social value occupations without considering nonmonetary benefits may exaggerate the differences in the benefits of occupations. Access to information, guidance, and role models may open opportunities for many students, but these supports should not focus only on earnings maximization. Excluding nonmonetary benefits from consideration may also make it difficult to understand the choices some people make to follow these less lucrative paths in the interest of other characteristics leading to job satisfaction.
C O N C L U S IO N A ND R E C O M ME ND AT IO N S T O T HE C O M MI S S IO NMany individuals in careers with high social value receive low earnings relative to the value they provide, and to their similarly educated peers. The potential for postsecondary education to address the low earnings in socially valuable fields may be limited. Earnings are a function of a combination of factors including supply and demand, societal forces, and the sector in which a graduate is employed. Moreover, focusing solely on wages glosses over the value of these jobs not just to society, but to individuals who gain personal satisfaction from their work and the social contributions they make. Clearly the answer is not to discourage students from preparing for and entering these occupations, but to find public policy and private sector solutions that support high-quality education in these areas and provide individuals with an adequate return on the investments they are making.
To our knowledge, there is not an established way to measure the social value of many of the discussed low-wage, high-social value careers. We recommend:
• It may be possible to define those careers that are of high social value and require some form of postsecondary education. As noted previously, there is no agreed upon definition of such careers; however, several scholars have examined many of the same careers when pursuing similar lines of inquiry. The most prominent examples include teachers and social workers. We recommend the commission convene a group of experts to examine this question specifically for potential use in a value framework. Related college majors could then be mapped onto these careers. However, it should be noted that majors are not always good predictors of career trajectories.
• A next step would be to define low wages, although once again, there is no widely agreed upon definition. A reasonable option is to focus on the lowest 25 percent (or another share) of earnings for the selected level of educational attainment. It might also be possible to examine the financial health of postsecondary graduates in the careers of interest, through measures like income-to-debt ratios.
• Ongoing examination of career requirements is worthwhile. The question of which credentials are really necessary for low-wage careers is critical to ensuring that higher education pays off.
• The commission should recognize the need for further research in this area, including qualitative research that examines the attitudes and behaviors of students relating to career choice. Understanding both the risks and the benefits of pursuing high social value careers, secure careers, and high-earning careers is fundamental to these issues.
— 12 —
Within the context of a postsecondary value framework, the commission may consider:
• The overall nonmonetary value of higher education to individuals, including job and life satisfaction, and such value as experienced by those in low-wage, high social value careers, in particular.
• The inclusion of fringe benefits in any assessment of earnings, to represent full compensation. These benefits include health and retirement benefits, schedule flexibility, and parental leave.
• Postsecondary institutions producing graduates who are prepared for and enter careers of high value to society, including those with relatively low earnings. Without a strict definition of these careers, this may take the form of noting the employment sectors of graduates—private, public, and nonprofit.
• Colleges and universities pursuing research on the social benefit of higher education overall, and on the individual and societal value of the types of careers examined in this paper.
• Financial aid policies (federal, state, and institutional) that incentivize graduates pursuing high social value careers, or by proxy, careers in the public and nonprofit sectors (e.g., loan forgiveness and scholarship aid).
• Transparency on the parts of institutions in how they report out on career outcomes, at the programmatic level.
• Institutional efforts to provide meaningful career exposure to those pursuing high social value careers, for example through community partnerships, internships, and work-study opportunities.
• Program curricula that embed cultural competency education and training and provide mentoring and coaching opportunities for those underrepresented in these careers.
— 13 —
R E F E R E N C E SAllegretto, S. A., Corcoran, S. P., & Mishel, L. (2011). The teaching penalty: An update through 2010. Economic Policy Institute. https://www.epi.org/publication/the-teacher-weekly-wage-penalty-hit-21-4-percent-in-2018-a-record-high-trends-in-the-teacher-wage-and-compensation-penalties-through-2018/.
Artz, B. (2010). Fringe benefits and job satisfaction. International Journal of Manpower, 31(6), 626-644.
Bureau of Labor Statistics. (2019a). National longitudinal surveys: Frequently asked questions. https://www.bls.gov/nls/home.htm#anch43.
Baughman, R., DiNardi, D., & Holtz-Eakin, D. (2003). Productivity and wage effects of “family-friendly” fringe benefits. International Journal of Manpower, 24(3), 247-259.
Bureau of Labor Statistics. (2019). Employment Projections. https://www.bls.gov/emp/home.htm.
Carnevale, A. P., Smith, N., & Gulish, A. (2018). Women can’t win: Despite making educational gains and pursuing high-wage majors, women still earn less than men. Georgetown University Center on Education and the Workforce. https://1gyhoq479ufd3yna29x7ubjn-wpengine.netdna-ssl.com/wp-content/uploads/Women_FR_Web.pdf
Cheng, M. (2017). Students at most college don’t pick useless majors. FiveThirtyEight. https://fivethirtyeight.com/features/students-at-most-colleges-dont-pick-useless-majors/
Chung, W. (2003). Fringe benefits and inequality in the labor market. Economic Inquiry, 41(3), 517-529.
Davies, S., & Guppy, N. (1997). Fields of study, college selectivity, and student inequalities in higher education. Social Forces, 75(4), 1417-1438.
Duncan, G. J. (1976). Earnings functions and nonpecuniary benefits. Journal of Human Resources, 11(4), 462-483.
Engberg, M. E., & Allen, D. J. (2011). Uncontrolled destinies: Improving opportunity for low-income students in American higher education. Research in Higher Education, 52(8), 786–807.
England, P., Budig, M., & Folbre, N. (2002). Wages of virtue: The relative pay of care work. Social Problems, 49(4), 455-473.
Espinosa, L. L., Turk, J. M., Taylor, M., & Chessman, H. M. (2019). Race and ethnicity in higher education: A status report. American Council on Education. https://www.equityinhighered.org/data_table_category/enrollment-undergraduate/.
Frank, R. H. (1996). What price the moral high ground? Southern Economic Journal, 1-17.
Frey, B.S. (2019) The social value of art. In: Economics of art and culture. SpringerBriefs in Economics. Springer, Cham. https://doi.org/10.1007/978-3-030-15748-7_2
Hamermesh, D. S. (1999). Changing inequality in markets for workplace amenities. The Quarterly Journal of Economics, 114(4), 1085-1123.
Haveman, R. H., & Wolfe, B. L. (1984). Schooling and economic well-being: The role of nonmarket effects. Journal of Human Resources, 19(3), 377-407.
Hegewisch, A., & Institute for Women’s Policy Research. (2016). Pathways to equity: Narrowing the wage gap by improving women’s access to good middle-skill jobs. Institute for Women’s Policy Research. https://womenandgoodjobs.org/about-the-report/
Horrigan, M. (2016). High-wage / In-demand jobs: An occupation, industry, and educational requirements approach. Presentation to the Workforce Innovation Advisory Council. U.S. Bureau of Labor Statistics.
Jencks, C., Perman, L., & Rainwater, L. (1988). What is a good job? A new measure of labor-market success. American Journal of Sociology, 93(6), 1322-1357.
Kezar, A. (Ed.). (2010). Recognizing and serving low-income students in postsecondary education. Routledge.
Lockwood, B. B., Nathanson, C. G., & Weyl, E. G. (2017a). Taxation and the allocation of talent. Journal of Political Economy, 125(5), 1635-1682.
Lockwood, B. B., Nathanson, C. G., & Weyl, E. G. (2017b). What if socially useful jobs were taxed less than other jobs. Harvard Business Review. https://hbr.org/2017/10/what-if-socially-useful-jobs-were-taxed-less-than-other-jobs.
Lundy-Wagner, V. C., Veenstra, C. P., Orr, M. K., Ramirez, N. M., Ohland, M. W., & Long, R. A. (2014). Gaining access or losing ground? Socioeconomically disadvantaged students in undergraduate engineering, 1994-2003. The Journal of Higher Education, 85(3), 339-369.
Ma, Y. (2009). Family socioeconomic status, parental involvement, and college major choices—gender, race/ethnic, and nativity patterns. Sociological Perspectives, 52(2), 211-234.
Marshall, A. (2009). Principles of economics: An introductory volume (8th ed.). Online Library of Liberty. https://oll.libertyfund.org/title/marshall-principles-of-economics-8th-ed.
Monaco, K., & Pierce, B. (2015). Compensation inequality: evidence from the National Compensation Survey. Monthly Labor Review, U.S. Bureau of Labor Statistics. https://doi.org/10.21916/mlr.2015.24.
National Opinion Research Center (NORC). (2016). The General Social Survey. https://gss.norc.org/.
National Center for Education Statistics (NCES). (2016.) National Postsecondary Student Aid Study, Power Stats. https://nces.ed.gov/datalab/powerstats/default.aspx
Niu, L. (2017). Family socioeconomic status and choice of stem major in college: An analysis of a national sample. College Student Journal, 51(2), 298-312.
— 14 —
Oreopoulos, P., & Salvanes, K. G. (2011). Priceless: The nonpecuniary benefits of schooling. Journal of Economic Perspectives, 25(1), 159-84.
Pinsker, J. (2015). Rich kids study English. The Atlantic. https://www.theatlantic.com/business/archive/2015/07/college-major-rich-families-liberal-arts/397439/
Schanzenbach, D. W., Nunn, R., & Nantz, G. (2017). Putting your major to work: Career paths after college. The Hamilton Project, The Brookings Institution. http://www.hamiltonproject.org/papers/putting_your_major_to_work_career_paths_after_college
Schleter, B. M. (2011). Measuring the social, economic benefits of art and culture. Penn Current. https://penntoday.upenn.edu/2011-10-13/features/measuring-social-economic-benefits-art-and-culture.
Stevenson, B. (2015). Five facts about gender pay gap. The White House Blog. https://obamawhitehouse.archives.gov/blog/2015/04/14/five-facts-about-gender-pay-gap
Timmons, E. (2018). More and more jobs today require a license. That’s good for some workers, but not always for consumers. Harvard Business Review. https://hbr.org/2018/04/more-and-more-jobs-today-require-a-license-thats-good-for-some-workers-but-not-always-for-consumers
Trejo, S. (2016). An econometric analysis of the major choice of first-generation college students. The Developing Economist, 3(1).
Urban Institute, (2019). Understanding college affordability. http://collegeaffordability.urban.org/
Weathington, B. L., & Tetrick, L. E. (2000). Compensation or right: An analysis of employee “fringe” benefit perception. Employee Responsibilities and Rights Journal, 12(3), 141-162.
Weir, K. (2013). More than job satisfaction: Psychologists are discovering what makes work meaningful—and how to create value in any job. American Psychological Association, 44(11). https://www.apa.org/monitor/2013/12/job-satisfaction