Embed Size (px)
Citation preview
07/10/00 Exploring the Impact of Differentiated Services on Carrier
Networks
1
Exploring the Impact of Differentiated Services Exploring the Impact of Differentiated Services on Carrier Networkson Carrier Networks
Masters Thesis PresentationJuly 10, 2000
Ajay UggiralaInformation and Telecommunications Technology Center
Department of Electrical Engineering and Computer ScienceUniversity of Kansas
Thesis Committee: Dr. Victor S. Frost, ChairDr. Douglas NiehausDr. Arvin Agah
07/10/00 Exploring the Impact of Differentiated Services on Carrier
Networks
2
Organization
• Motivation.
• Introduction.
• Impact of Overbooking in DiffServ Networks.
• Impact of Number of DiffServ Classes.
• Conclusions and Lessons Learned.
• Future Work.
07/10/00 Exploring the Impact of Differentiated Services on Carrier
Networks
3
Motivation
• Lack of detailed understanding of the characteristics and impact of Differentiated Services.
• The significance of Differentiated services to carrier networks is unknown.
Goal
• To identify the problems associated in the deployment of Differentiated Services.
• To identify the target architectures, functional elements and parameters.
07/10/00 Exploring the Impact of Differentiated Services on Carrier
Networks
4
Introduction
What is Differentiated Services ?Differentiated services (DiffServ) are intended to provide service discrimination in the Internet.
Need for DiffServ:• Demand for bandwidth due to increase usage of Internet• Demand for QoS by voice and other mission critical applications.• Scalable service discrimination.
Services and Per-Hop-Behavior (PHB)• Service - Overall treatment of a subset of a customer’s traffic.• PHB - Service provided to a traffic aggregate.
07/10/00 Exploring the Impact of Differentiated Services on Carrier
Networks
5
Introduction (contd…)
Type of Service field in Internet Protocol header value may be used to categorize flows into aggregates.
The DiffServ Code Point (DSCP) value may be used to select a particular PHB for an aggregate flow.
Examples of PHBs• Expedited Forwarding.• Assured Forwarding.
Examples of Services• Premium Service - Van Jacobson.• Assured Service - David Clark.
07/10/00 Exploring the Impact of Differentiated Services on Carrier
Networks
6
Introduction (contd…)
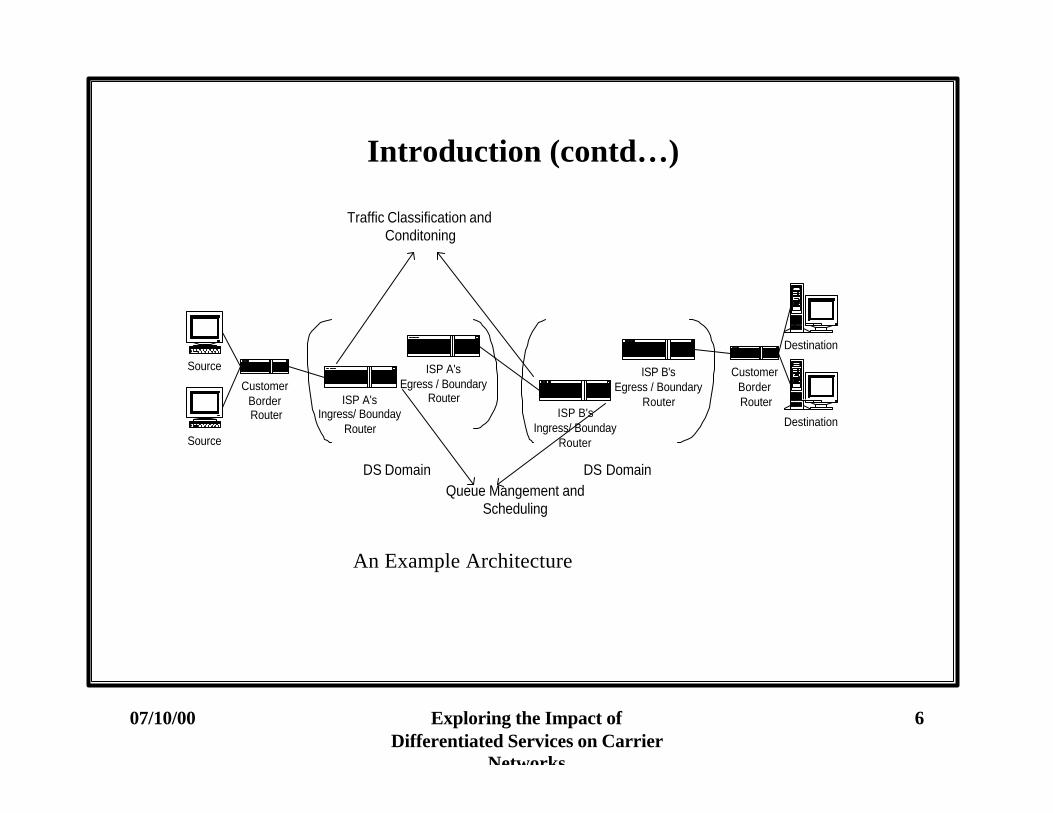
An Example Architecture
Source
Source
CustomerBorder Router
ISP A'sIngress/ Bounday
Router
ISP A'sEgress / Boundary
RouterISP B's
Ingress/ BoundayRouter
ISP B'sEgress / Boundary
Router
CustomerBorder Router
Destination
Destination
DS Domain DS Domain
Traffic Classification andConditoning
Queue Mangement andScheduling
07/10/00 Exploring the Impact of Differentiated Services on Carrier
Networks
7
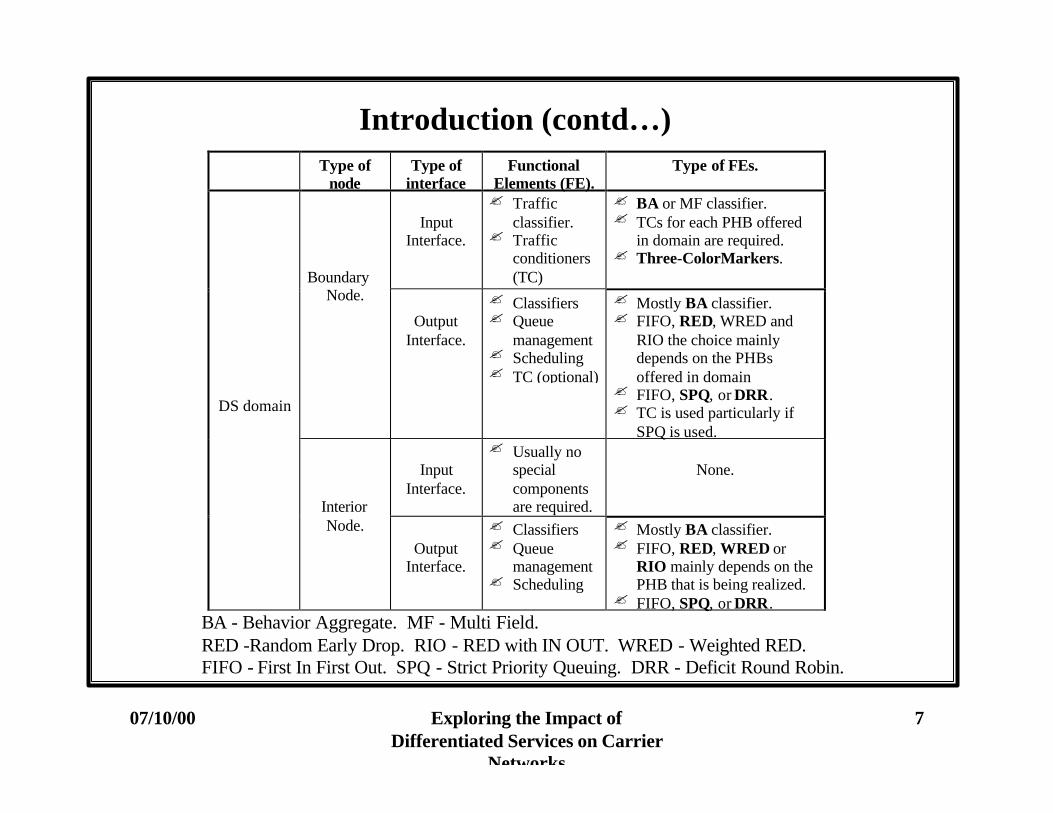
Introduction (contd…)Type of
nodeType of
interfaceFunctional
Elements (FE).Type of FEs.
InputInterface.
? Trafficclassifier.
? Trafficconditioners(TC)
? BA or MF classifier.? TCs for each PHB offered
in domain are required.? Three-ColorMarkers.
BoundaryNode.
OutputInterface.
? Classifiers? Queue
management? Scheduling? TC (optional)
? Mostly BA classifier.? FIFO, RED, WRED and
RIO the choice mainlydepends on the PHBsoffered in domain
? FIFO, SPQ, or DRR.? TC is used particularly if
SPQ is used.
InputInterface.
? Usually nospecialcomponentsare required.
None.
DS domain
InteriorNode.
OutputInterface.
? Classifiers? Queue
management? Scheduling
? Mostly BA classifier.? FIFO, RED, WRED or
RIO mainly depends on thePHB that is being realized.
? FIFO, SPQ, or DRR.BA - Behavior Aggregate. MF - Multi Field.RED -Random Early Drop. RIO - RED with IN OUT. WRED - Weighted RED.FIFO - First In First Out. SPQ - Strict Priority Queuing. DRR - Deficit Round Robin.
07/10/00 Exploring the Impact of Differentiated Services on Carrier
Networks
8
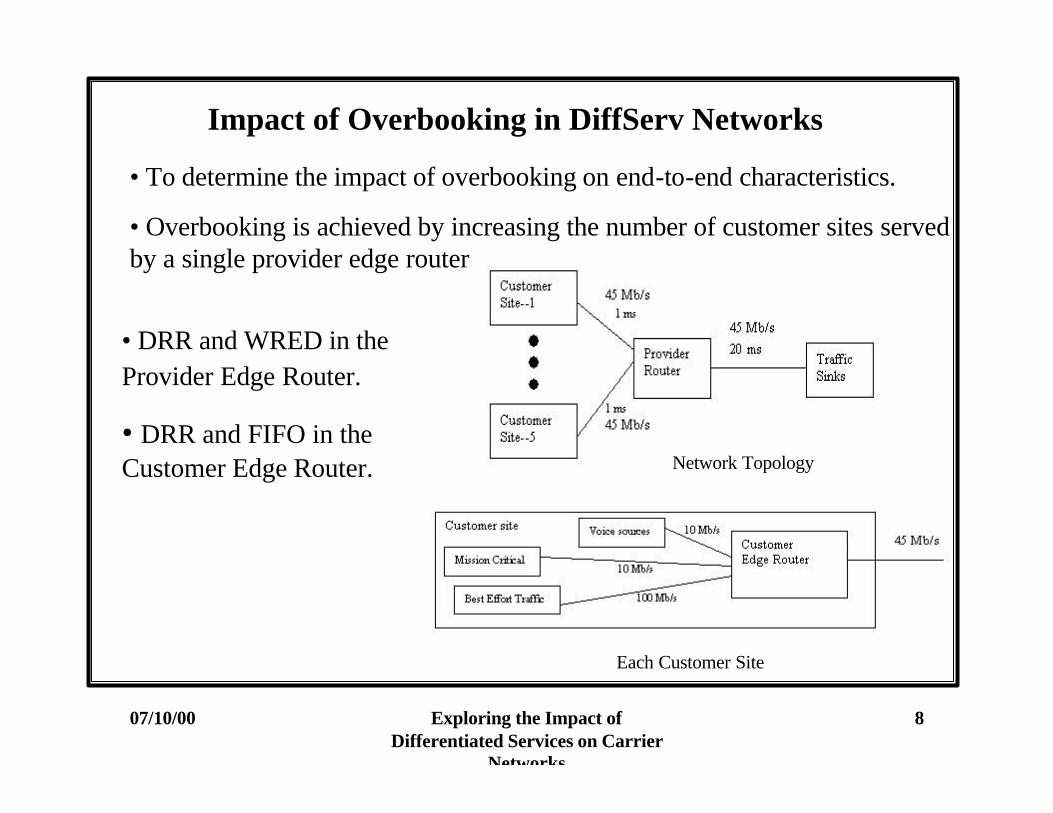
Impact of Overbooking in DiffServ Networks
• To determine the impact of overbooking on end-to-end characteristics.
• Overbooking is achieved by increasing the number of customer sites served by a single provider edge router.
Network Topology
Each Customer Site
• DRR and WRED in the Provider Edge Router.
• DRR and FIFO in the Customer Edge Router.
07/10/00 Exploring the Impact of Differentiated Services on Carrier
Networks
9
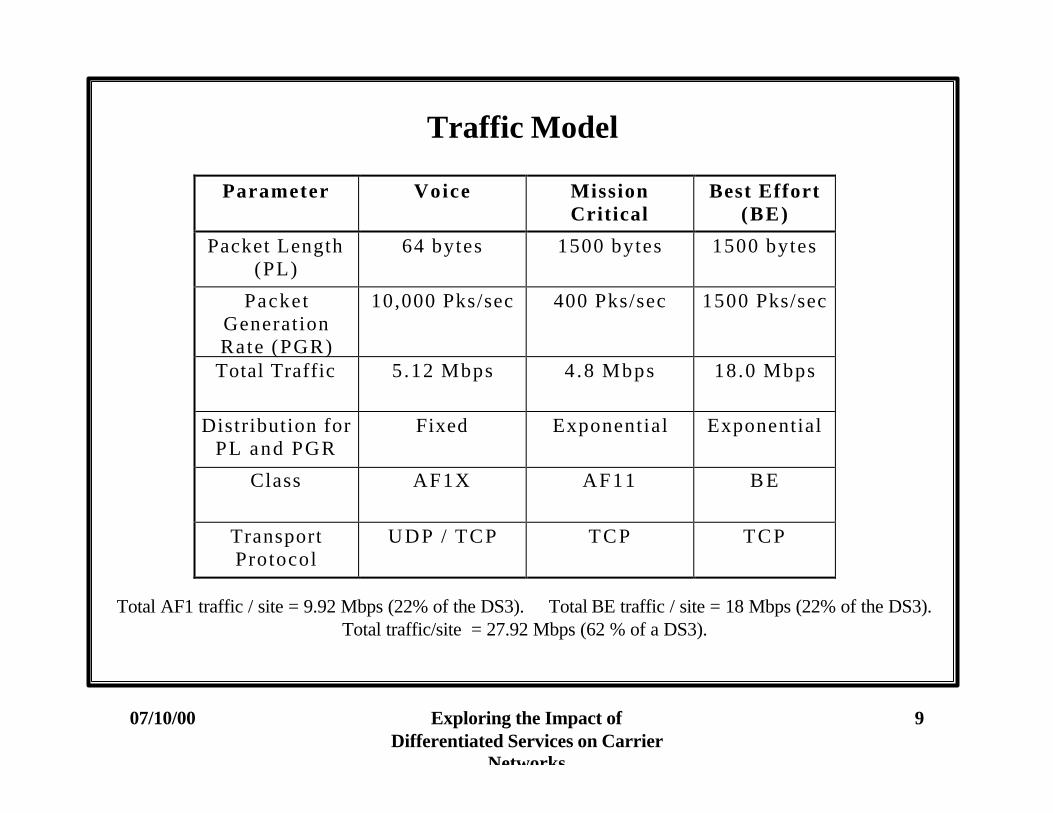
Traffic Model
Parameter Voice MissionCritical
Best Effort(BE)
Packet Length(PL)
64 bytes 1500 bytes 1500 bytes
PacketGenerationRate (PGR)
10,000 Pks/sec 400 Pks/sec 1500 Pks/sec
Total Traffic 5.12 Mbps 4.8 Mbps 18.0 Mbps
Distribution forPL and PGR
Fixed Exponential Exponential
Class AF1X AF11 B E
TransportProtocol
UDP / TCP TCP TCP
Total AF1 traffic / site = 9.92 Mbps (22% of the DS3). Total BE traffic / site = 18 Mbps (22% of the DS3).Total traffic/site = 27.92 Mbps (62 % of a DS3).
07/10/00 Exploring the Impact of Differentiated Services on Carrier
Networks
10
Parameters
0
1
2
3
4
5
6
1 2 3 4 5
Number of Sites
Nor
mal
ized
Loa
d G
ener
ated
Load on AF1Queue
Load on BEQueue
Total LoadGenerated onthe BottleneckLink
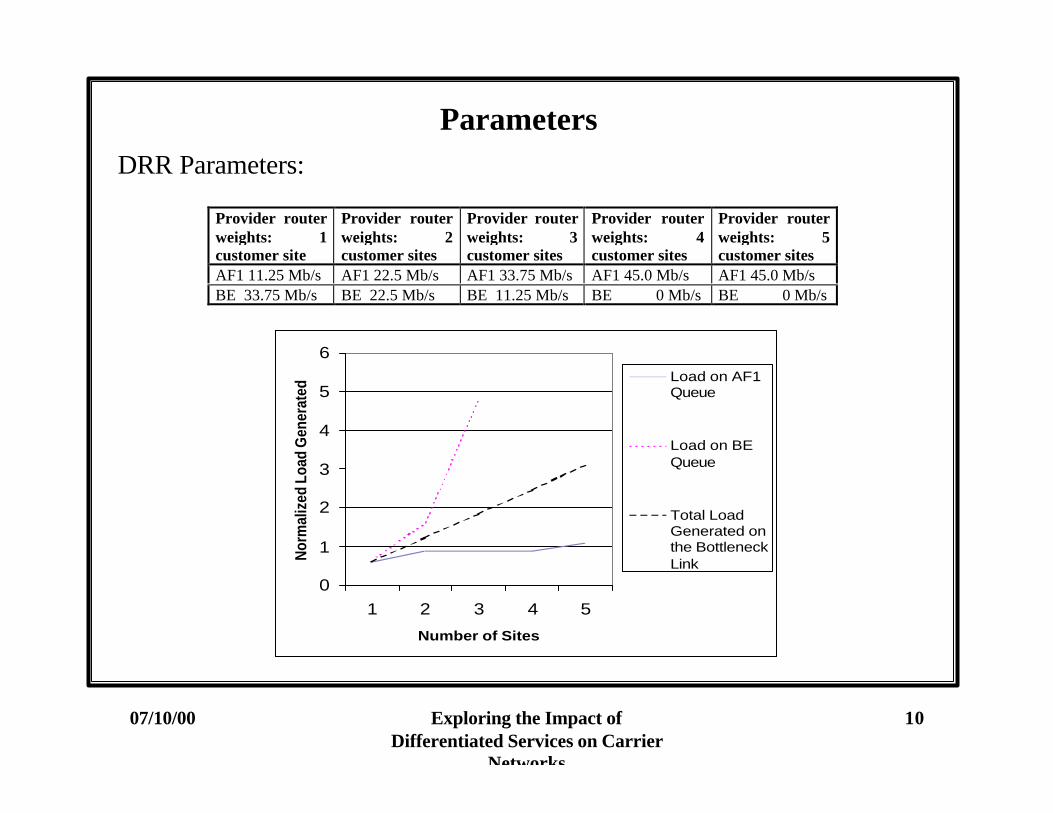
Provider routerweights: 1customer site
Provider routerweights: 2customer sites
Provider routerweights: 3customer sites
Provider routerweights: 4customer sites
Provider routerweights: 5customer sites
AF1 11.25 Mb/s AF1 22.5 Mb/s AF1 33.75 Mb/s AF1 45.0 Mb/s AF1 45.0 Mb/sBE 33.75 Mb/s BE 22.5 Mb/s BE 11.25 Mb/s BE 0 Mb/s BE 0 Mb/s
DRR Parameters:
07/10/00 Exploring the Impact of Differentiated Services on Carrier
Networks
11
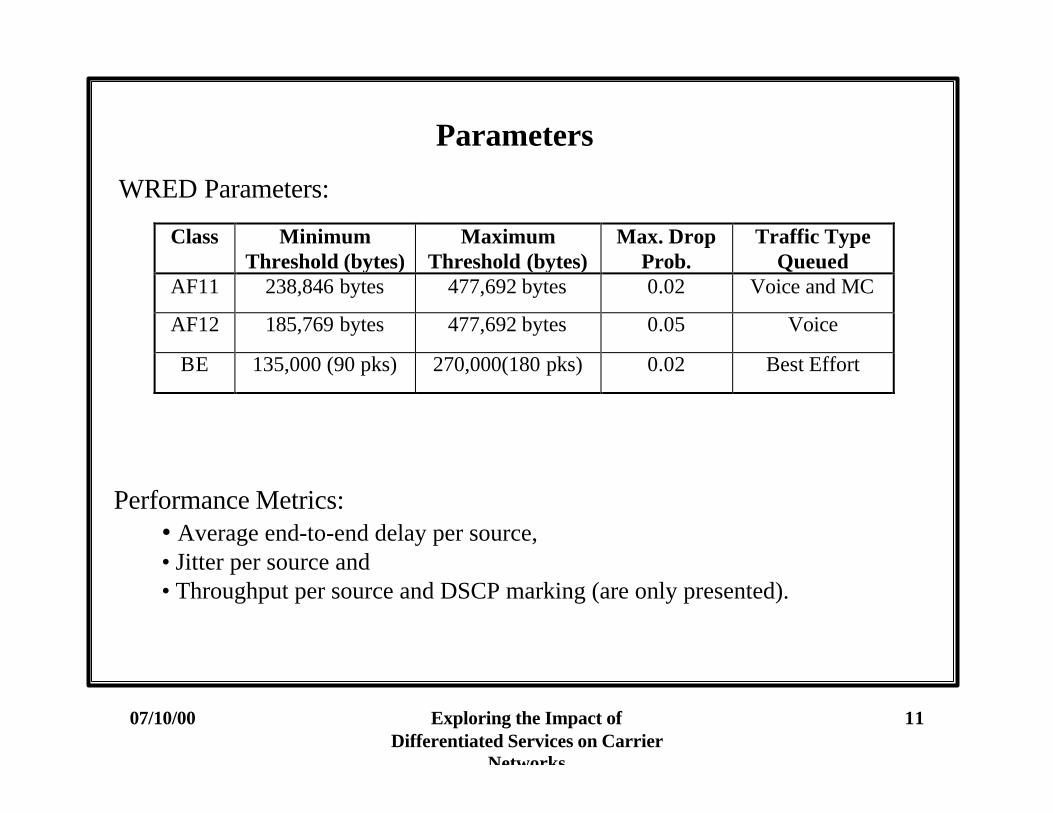
Parameters
Class MinimumThreshold (bytes)
MaximumThreshold (bytes)
Max. DropProb.
Traffic TypeQueued
AF11 238,846 bytes 477,692 bytes 0.02 Voice and MC
AF12 185,769 bytes 477,692 bytes 0.05 Voice
BE 135,000 (90 pks) 270,000(180 pks) 0.02 Best Effort
WRED Parameters:
Performance Metrics:• Average end-to-end delay per source, • Jitter per source and• Throughput per source and DSCP marking (are only presented).
07/10/00 Exploring the Impact of Differentiated Services on Carrier
Networks
12
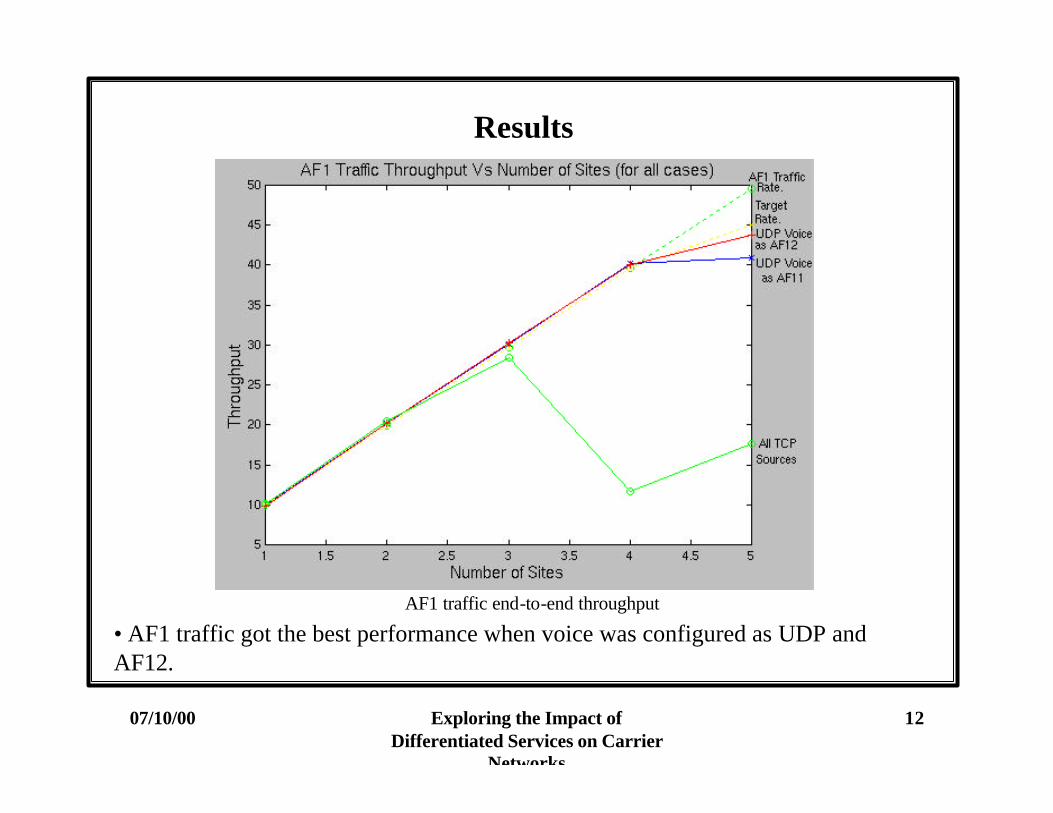
Results
AF1 traffic end-to-end throughput
• AF1 traffic got the best performance when voice was configured as UDP and AF12.
07/10/00 Exploring the Impact of Differentiated Services on Carrier
Networks
13
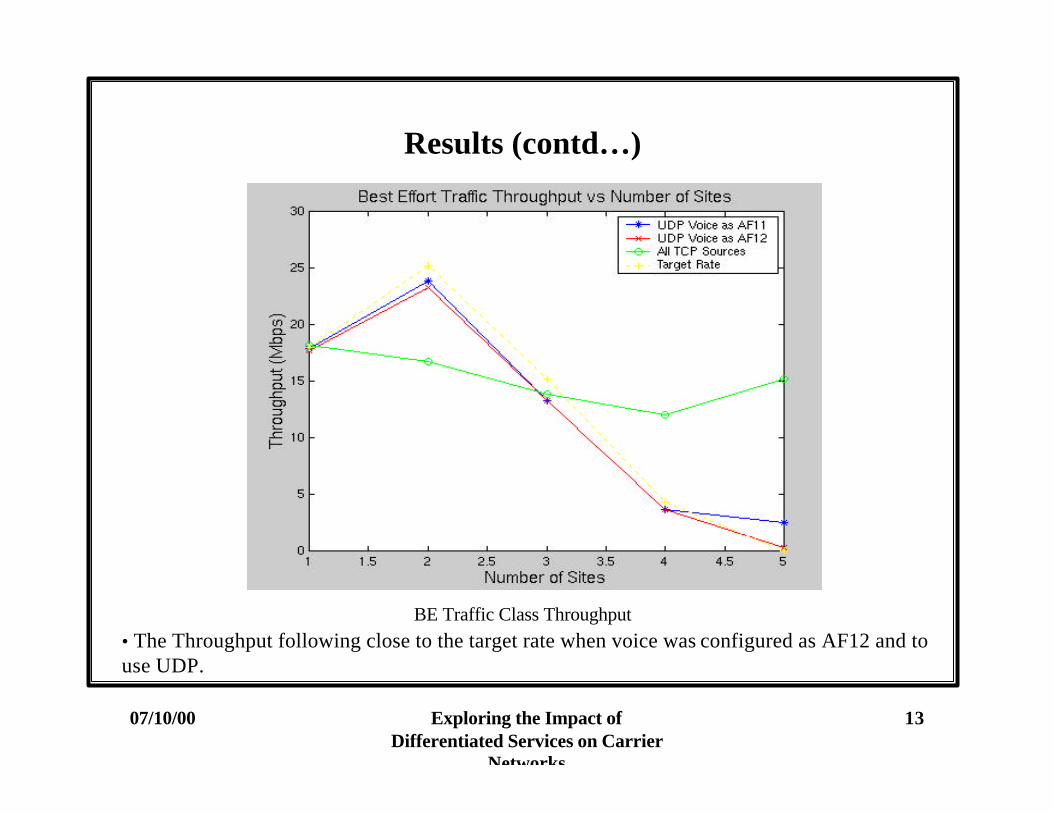
Results (contd…)
BE Traffic Class Throughput• The Throughput following close to the target rate when voice was configured as AF12 and to use UDP.
07/10/00 Exploring the Impact of Differentiated Services on Carrier
Networks
14
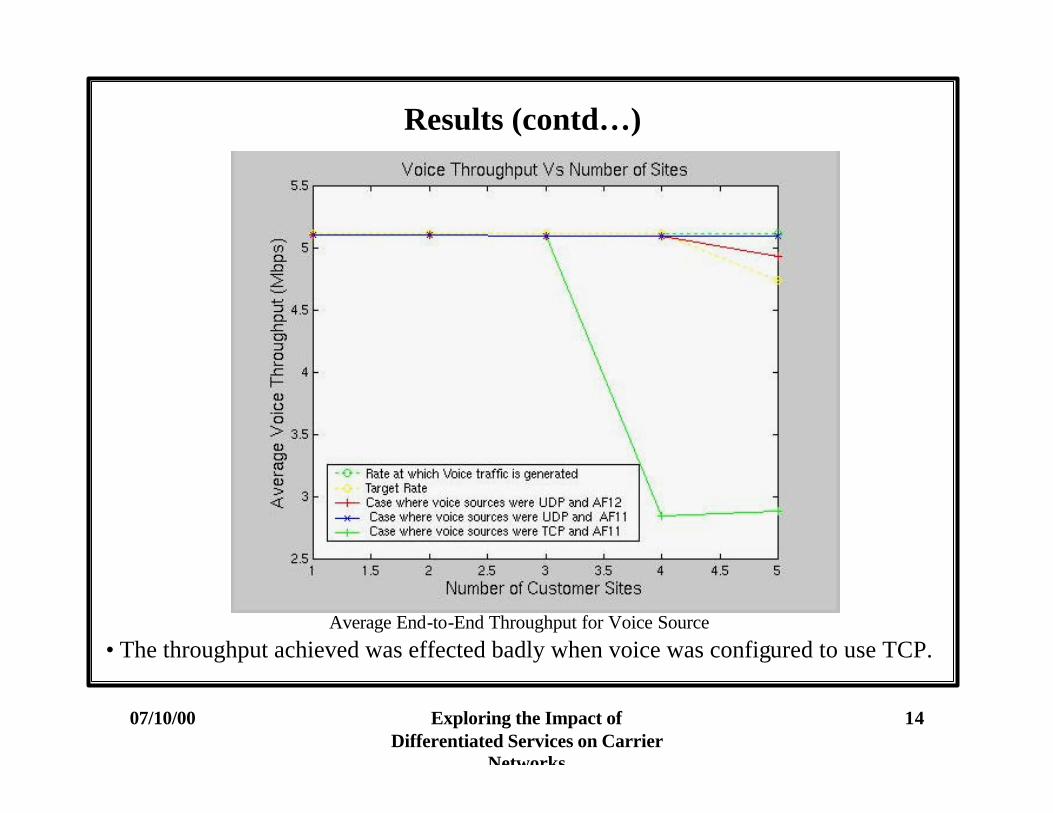
Results (contd…)
Average End-to-End Throughput for Voice Source
• The throughput achieved was effected badly when voice was configured to use TCP.
07/10/00 Exploring the Impact of Differentiated Services on Carrier
Networks
15
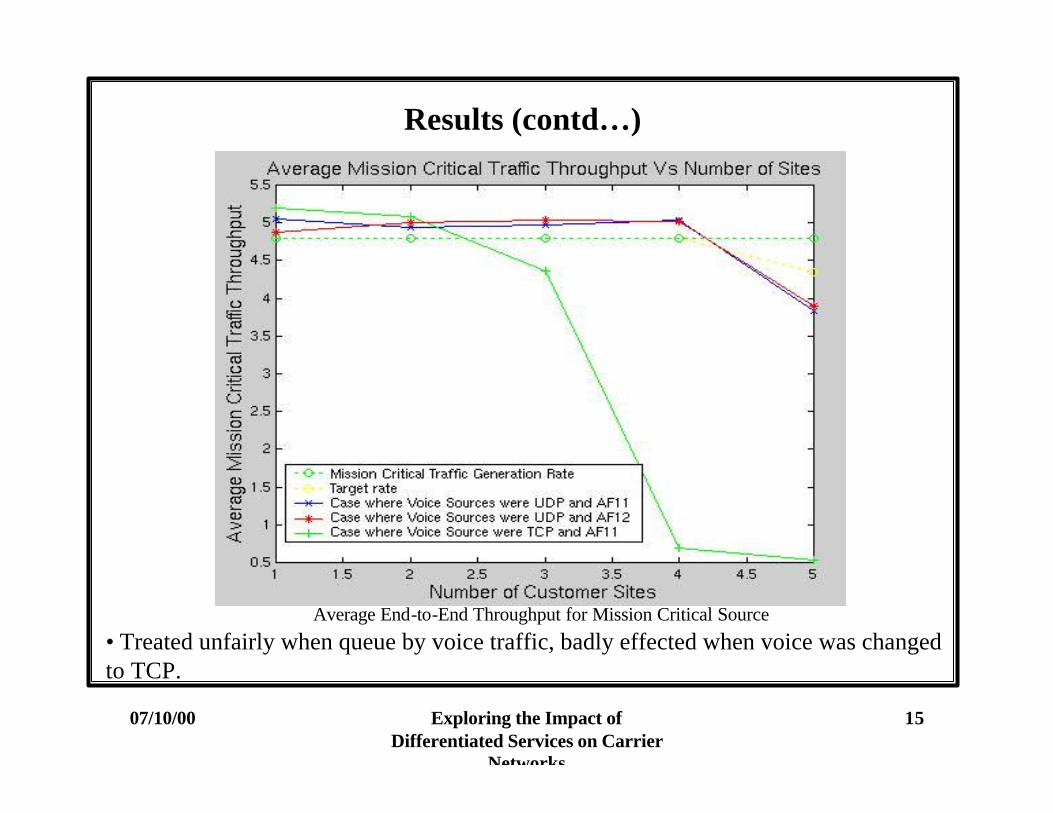
Results (contd…)
Average End-to-End Throughput for Mission Critical Source
• Treated unfairly when queue by voice traffic, badly effected when voice was changed to TCP.
07/10/00 Exploring the Impact of Differentiated Services on Carrier
Networks
16
Conclusions from Overbooking Study
• AF1 traffic achieved end-to-end results even when the link was overloaded.
• When Voice sources were using UDP, mission critical traffic was treated unfairly.
• Mission Critical traffic was protected to certain extent by assigning higher drop precedence to voice traffic.
• Both Mission Critical and Voice traffic got good performance results till the number of sites were four, when was using UDP.
• When Voice was using TCP, performance started degrading when thenumber of sites were only four.
• RED treated larger size Mission Critical packets unfairly in byte mode.
07/10/00 Exploring the Impact of Differentiated Services on Carrier
Networks
17
Evaluation of the Performance Impact of the Number of DiffServ Classes
• To compare performance of the two-queue model and the three-queue model in the provider’s core.
• To study the impact of scheduler in the customer edge.
• Three types of traffic are considered.
• Real Time (RT) (Premium).
• Non-Real Time (NRT) (Better than Best Effort / Assured).
•Best Effort (BE) (Best Effort).
• Two types of scheduling schemes in the customer edge.
• FIFO (no bandwidth allocations).
• DRR (bandwidth allocations).
07/10/00 Exploring the Impact of Differentiated Services on Carrier
Networks
18
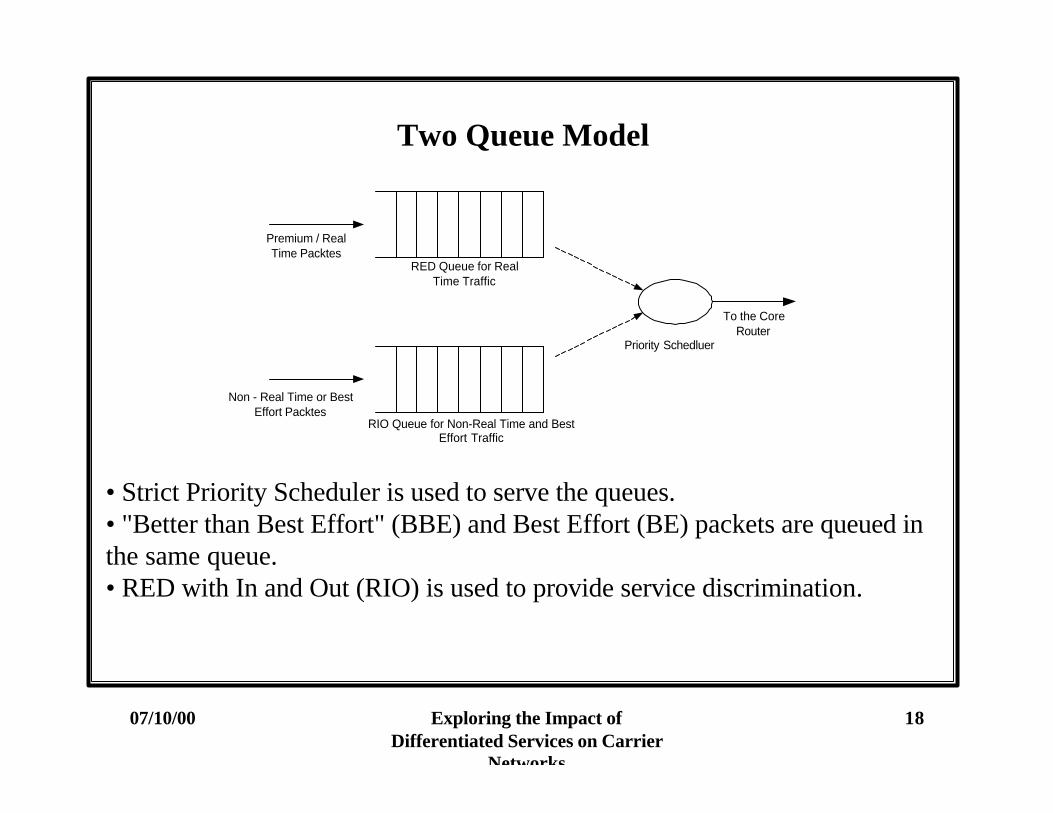
Two Queue Model
• Strict Priority Scheduler is used to serve the queues.• "Better than Best Effort" (BBE) and Best Effort (BE) packets are queued in the same queue.• RED with In and Out (RIO) is used to provide service discrimination.
RED Queue for RealTime Traffic
RIO Queue for Non-Real Time and BestEffort Traffic
Priority Schedluer
Premium / RealTime Packtes
Non - Real Time or BestEffort Packtes
To the CoreRouter
07/10/00 Exploring the Impact of Differentiated Services on Carrier
Networks
19
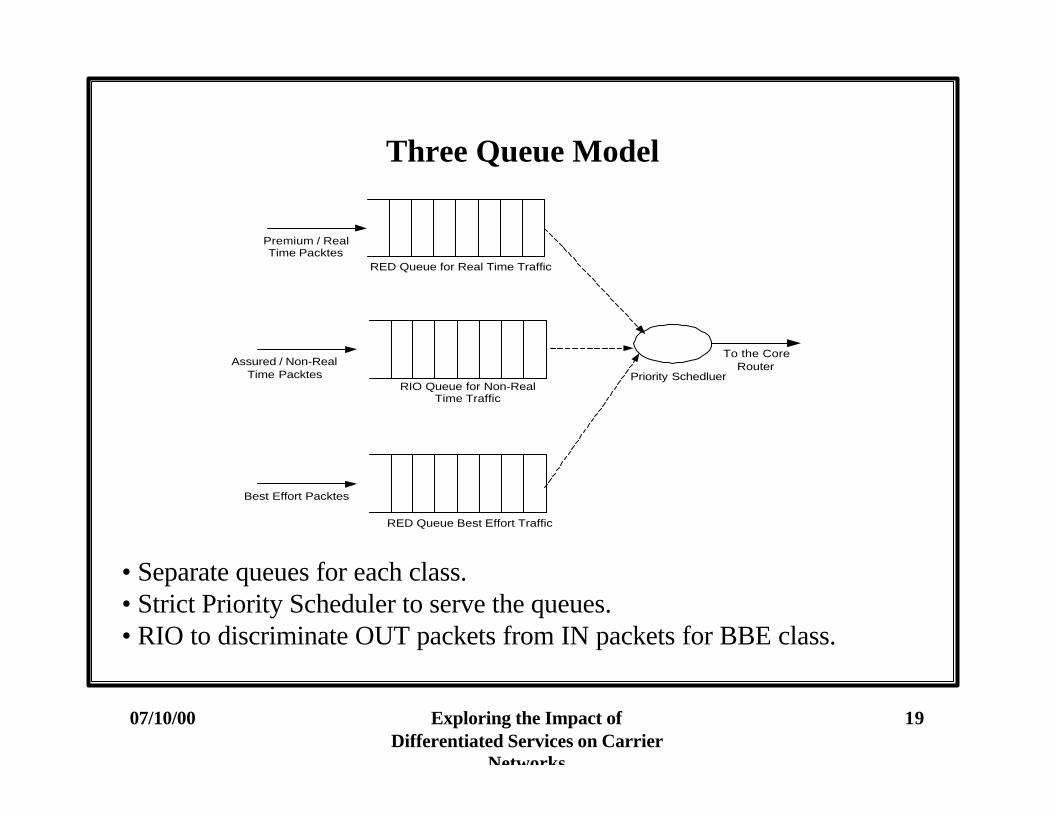
Three Queue Model
RIO Queue for Non-RealTime Traffic
RED Queue Best Effort Traffic
Priority SchedluerAssured / Non-Real
Time Packtes
Best Effort Packtes
To the CoreRouter
Premium / RealTime Packtes
RED Queue for Real Time Traffic
• Separate queues for each class.• Strict Priority Scheduler to serve the queues.• RIO to discriminate OUT packets from IN packets for BBE class.
07/10/00 Exploring the Impact of Differentiated Services on Carrier
Networks
20
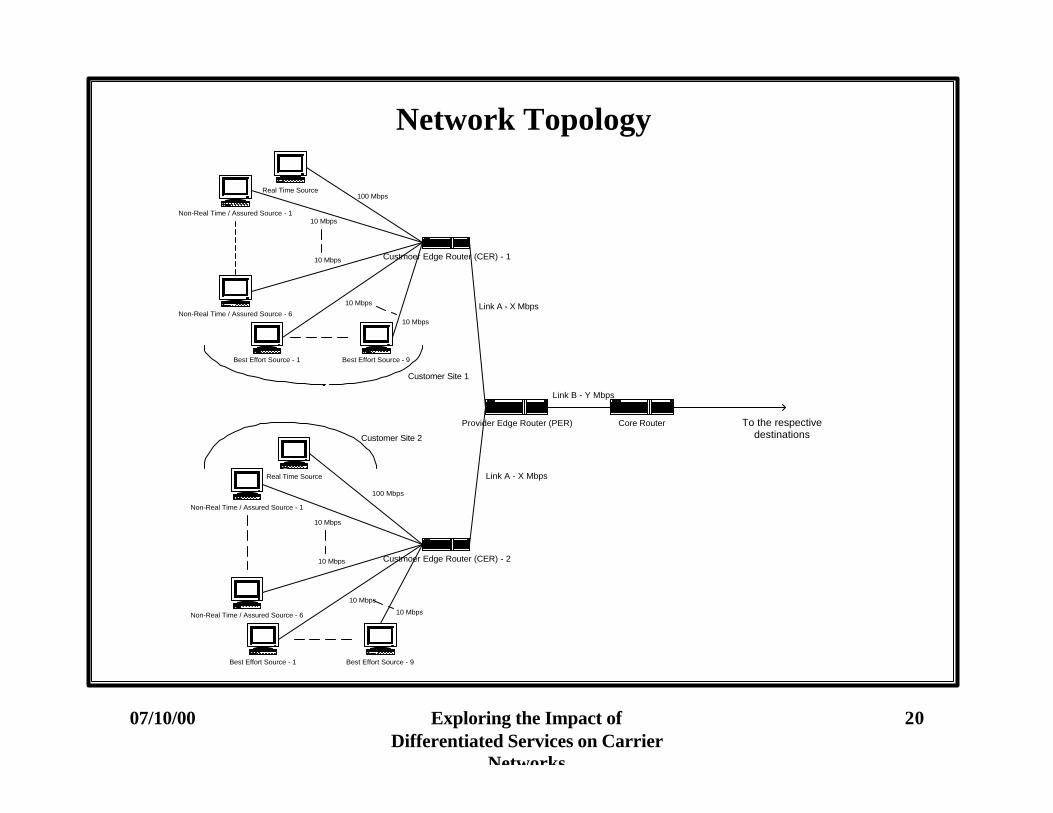
Network Topology
Real Time Source
Non-Real Time / Assured Source - 1
Non-Real Time / Assured Source - 6
Best Effort Source - 1 Best Effort Source - 9
Real Time Source
Non-Real Time / Assured Source - 1
Non-Real Time / Assured Source - 6
Best Effort Source - 1 Best Effort Source - 9
Customer Site 1
Customer Site 2
Custmoer Edge Router (CER) - 1
Custmoer Edge Router (CER) - 2
Provider Edge Router (PER) Core Router
Link A - X Mbps
Link A - X Mbps
100 Mbps
10 Mbps
10 Mbps
10 Mbps
10 Mbps
10 Mbps
10 Mbps
100 Mbps
10 Mbps
10 Mbps
Link B - Y Mbps
To the respectivedestinations
07/10/00 Exploring the Impact of Differentiated Services on Carrier
Networks
21
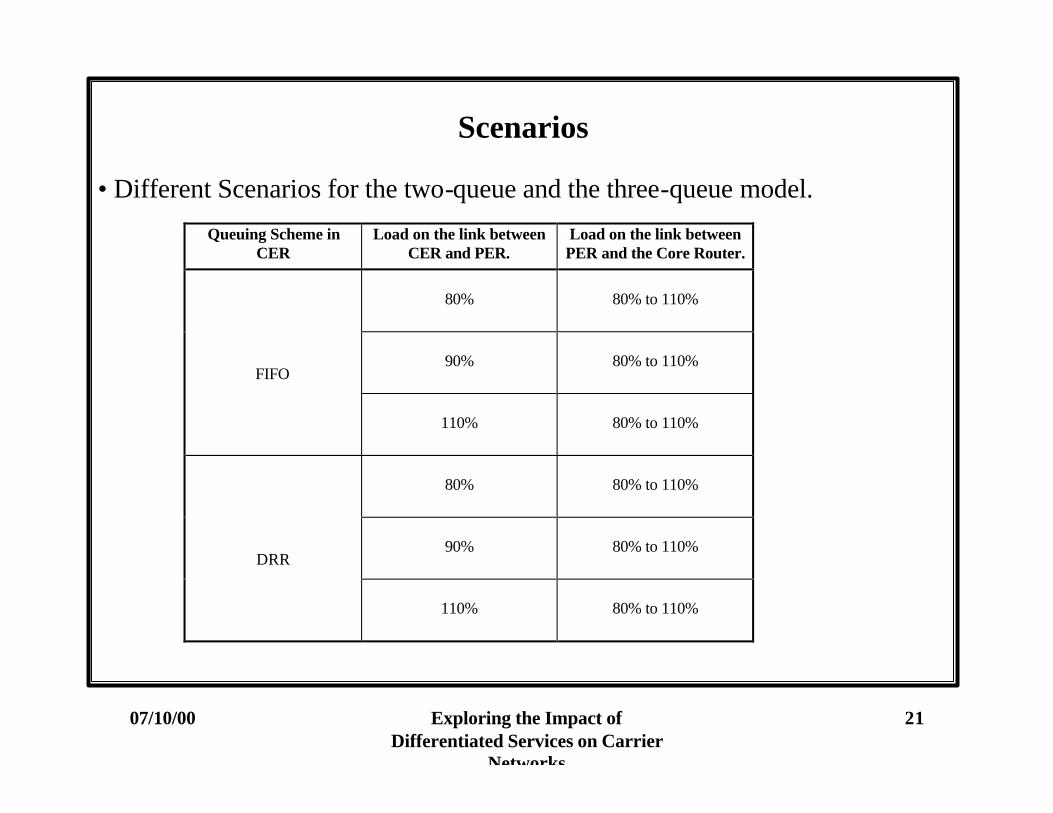
Scenarios
• Different Scenarios for the two-queue and the three-queue model.
Queuing Scheme inCER
Load on the link betweenCER and PER.
Load on the link betweenPER and the Core Router.
80% 80% to 110%
90% 80% to 110%FIFO
110% 80% to 110%
80% 80% to 110%
90% 80% to 110%DRR
110% 80% to 110%
07/10/00 Exploring the Impact of Differentiated Services on Carrier
Networks
22
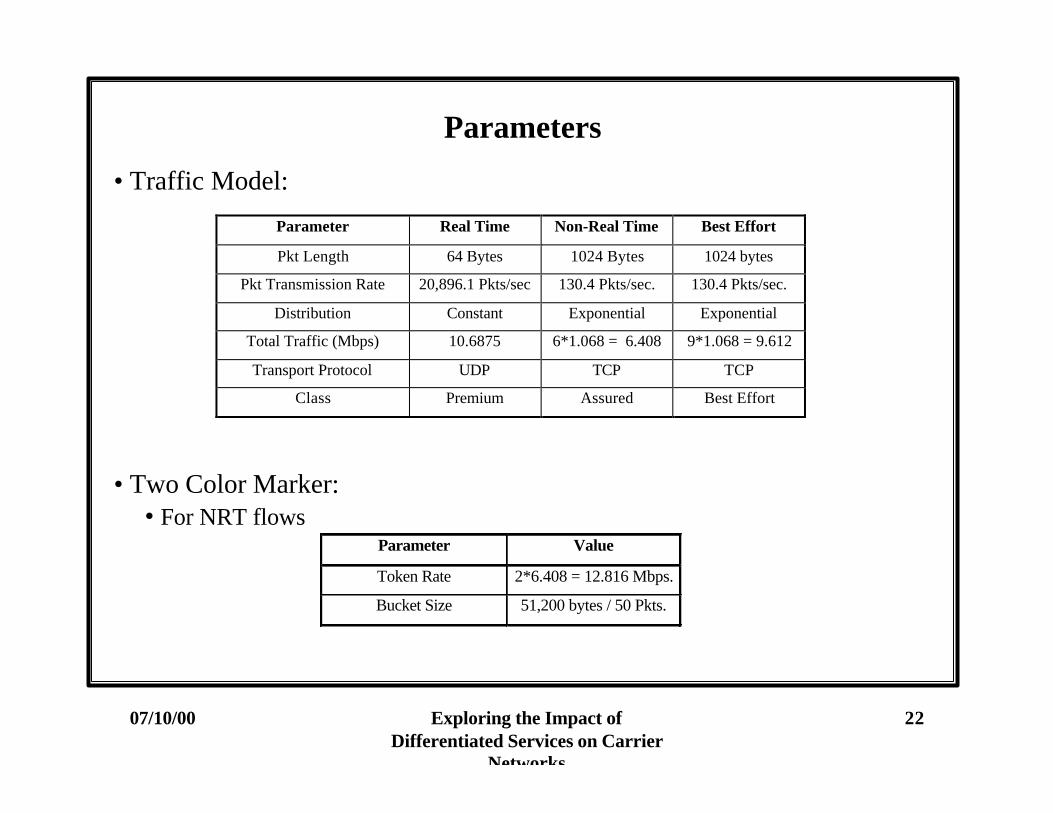
Parameters
Parameter Real Time Non-Real Time Best Effort
Pkt Length 64 Bytes 1024 Bytes 1024 bytes
Pkt Transmission Rate 20,896.1 Pkts/sec 130.4 Pkts/sec. 130.4 Pkts/sec.
Distribution Constant Exponential Exponential
Total Traffic (Mbps) 10.6875 6*1.068 = 6.408 9*1.068 = 9.612
Transport Protocol UDP TCP TCP
Class Premium Assured Best Effort
• Traffic Model:
• Two Color Marker:• For NRT flows
Parameter Value
Token Rate 2*6.408 = 12.816 Mbps.
Bucket Size 51,200 bytes / 50 Pkts.
07/10/00 Exploring the Impact of Differentiated Services on Carrier
Networks
23
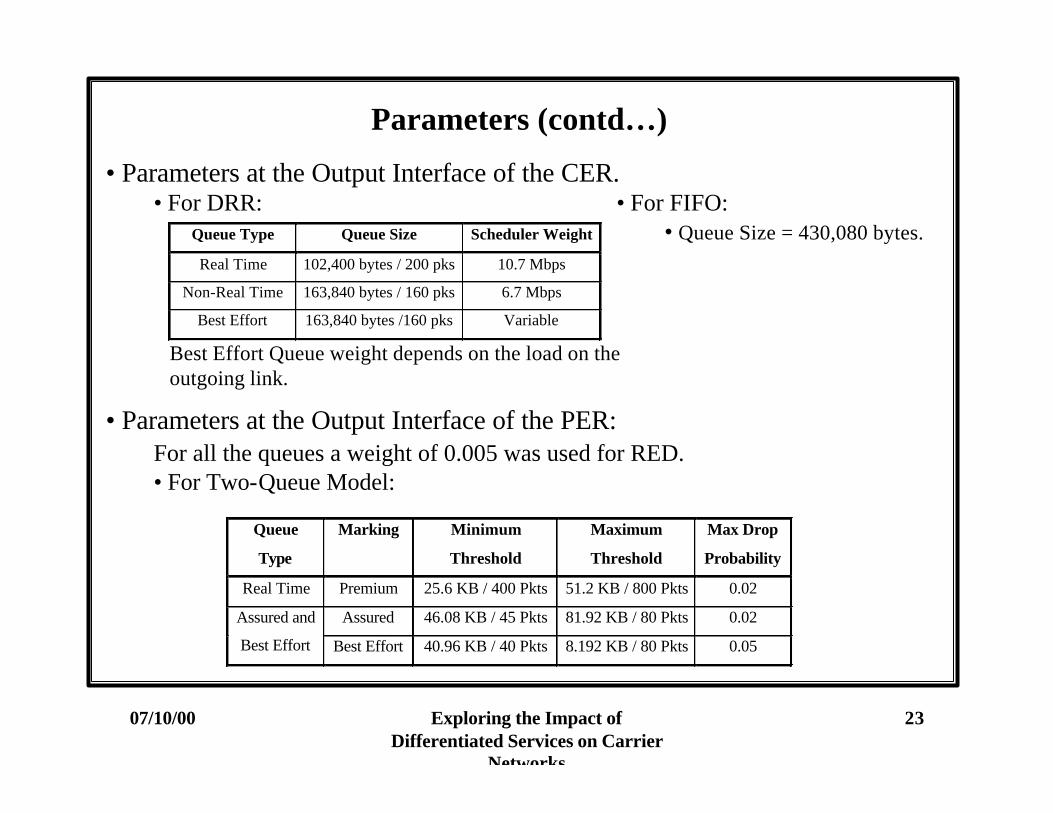
Parameters (contd…)
• Parameters at the Output Interface of the CER.• For DRR:
Queue Type Queue Size Scheduler Weight
Real Time 102,400 bytes / 200 pks 10.7 Mbps
Non-Real Time 163,840 bytes / 160 pks 6.7 Mbps
Best Effort 163,840 bytes /160 pks Variable
Best Effort Queue weight depends on the load on the outgoing link.
Queue
Type
Marking Minimum
Threshold
Maximum
Threshold
Max Drop
Probability
Real Time Premium 25.6 KB / 400 Pkts 51.2 KB / 800 Pkts 0.02
Assured 46.08 KB / 45 Pkts 81.92 KB / 80 Pkts 0.02Assured and
Best Effort Best Effort 40.96 KB / 40 Pkts 8.192 KB / 80 Pkts 0.05
• For FIFO:• Queue Size = 430,080 bytes.
• Parameters at the Output Interface of the PER:For all the queues a weight of 0.005 was used for RED.• For Two-Queue Model:
07/10/00 Exploring the Impact of Differentiated Services on Carrier
Networks
24
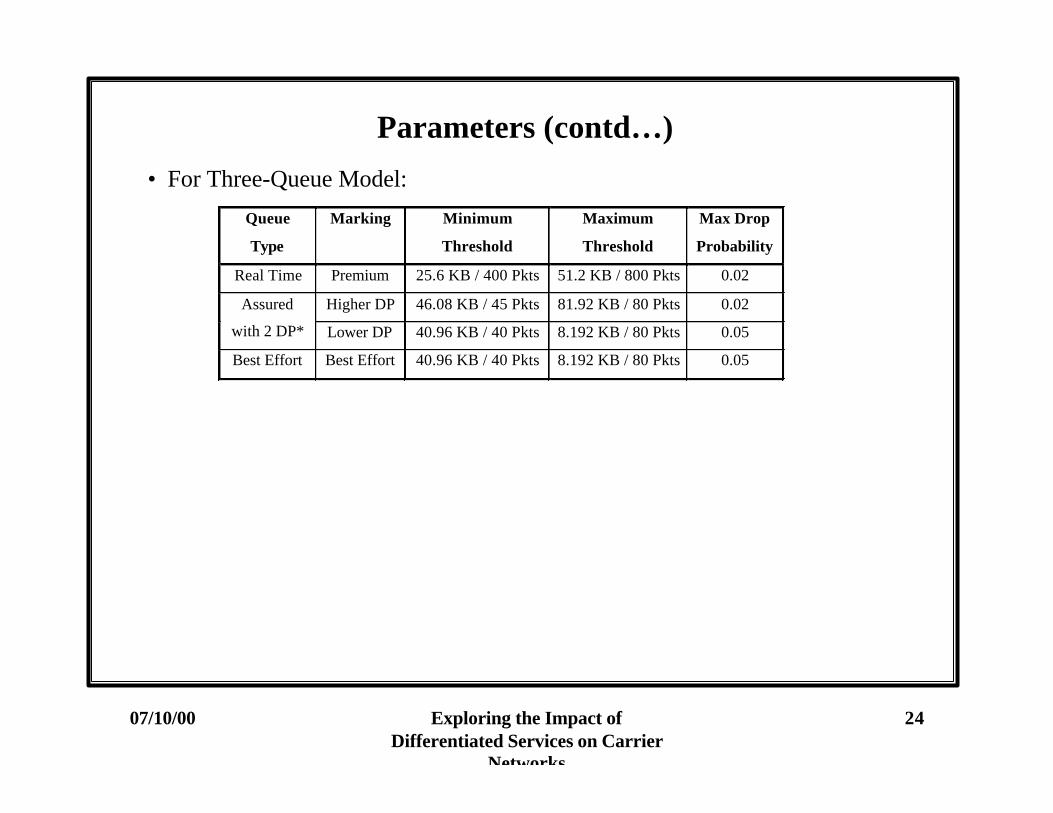
Parameters (contd…)
• For Three-Queue Model:
Queue
Type
Marking Minimum
Threshold
Maximum
Threshold
Max Drop
Probability
Real Time Premium 25.6 KB / 400 Pkts 51.2 KB / 800 Pkts 0.02
Higher DP 46.08 KB / 45 Pkts 81.92 KB / 80 Pkts 0.02Assured
with 2 DP* Lower DP 40.96 KB / 40 Pkts 8.192 KB / 80 Pkts 0.05
Best Effort Best Effort 40.96 KB / 40 Pkts 8.192 KB / 80 Pkts 0.05
07/10/00 Exploring the Impact of Differentiated Services on Carrier
Networks
25
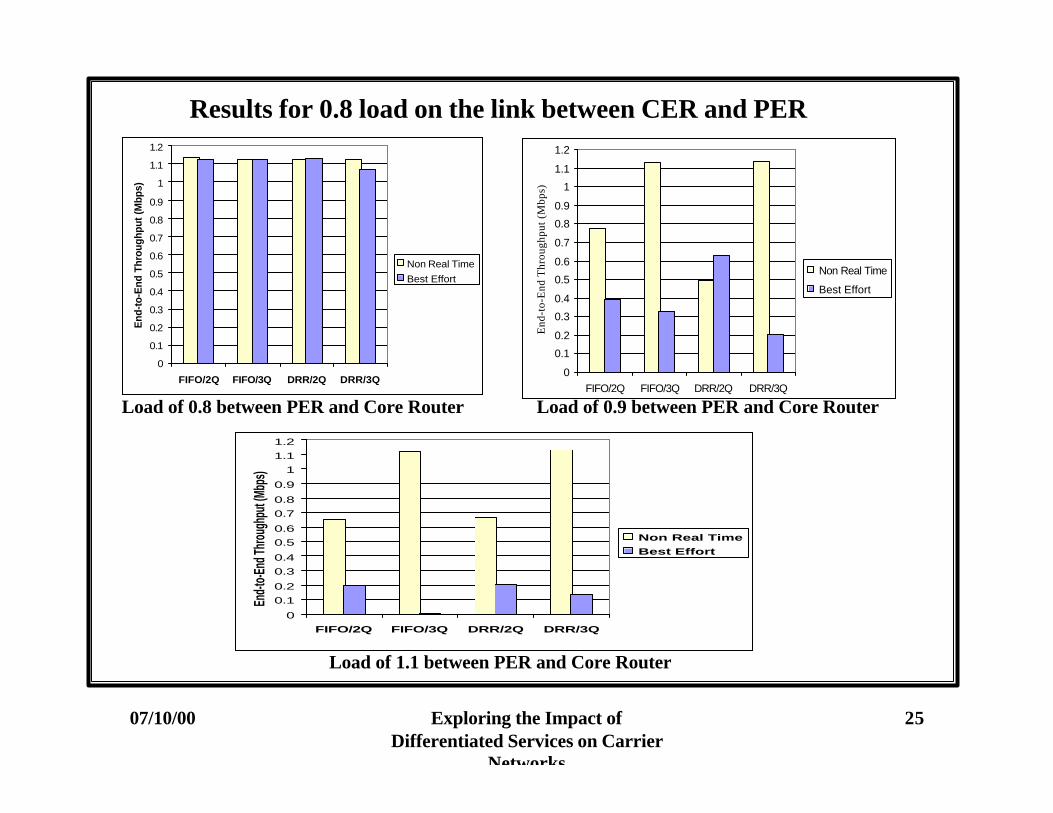
Results for 0.8 load on the link between CER and PER
0
0.1
0.2
0.3
0.4
0.5
0.6
0.7
0.8
0.9
1
1.1
1.2
FIFO/2Q FIFO/3Q DRR/2Q DRR/3Q
End
-to-
End
Thr
ough
put (
Mbp
s)
Non Real Time Best Effort
0
0.1
0.2
0.3
0.4
0.5
0.6
0.7
0.8
0.9
1
1.1
1.2
FIFO/2Q FIFO/3Q DRR/2Q DRR/3Q
End
-to-
End
Thr
ough
put (
Mbp
s)
Non Real Time
Best Effort
0
0.1
0.2
0.3
0.4
0.5
0.6
0.7
0.8
0.9
1
1.1
1.2
FIFO/2Q FIFO/3Q DRR/2Q DRR/3Q
End-t
o-End
Thro
ughp
ut (M
bps)
Non Real Time
Best Effort
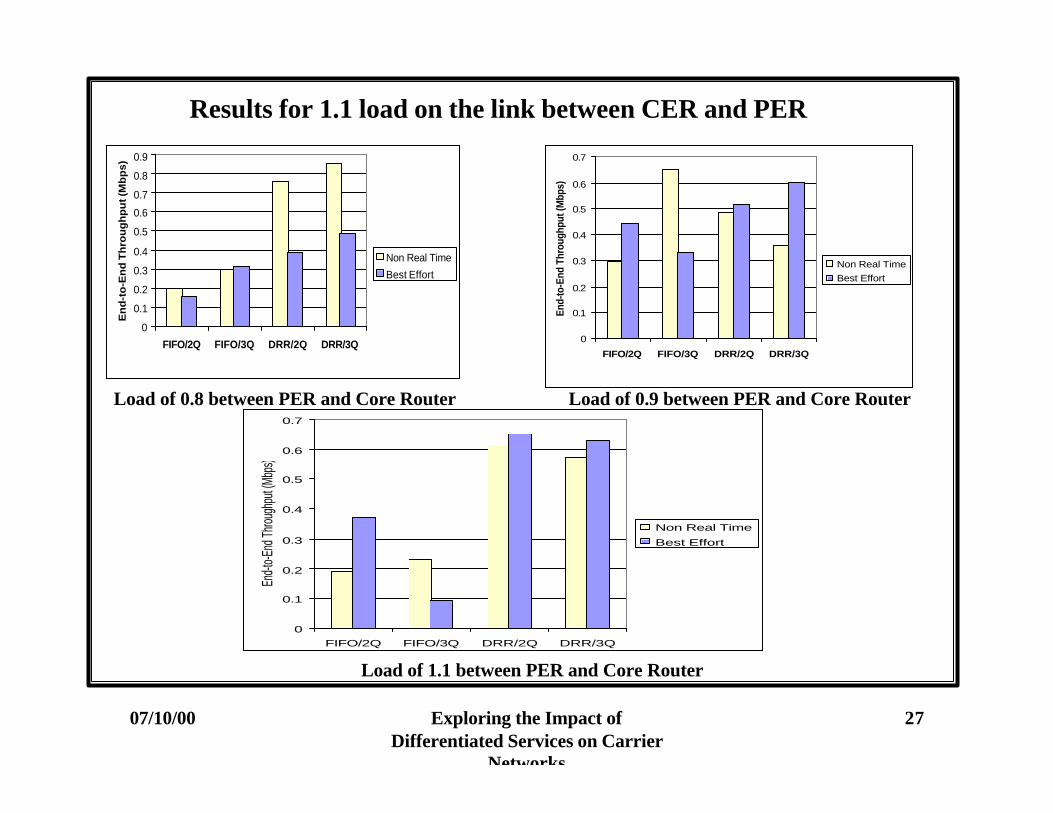
Load of 0.8 between PER and Core Router Load of 0.9 between PER and Core Router
Load of 1.1 between PER and Core Router
07/10/00 Exploring the Impact of Differentiated Services on Carrier
Networks
26
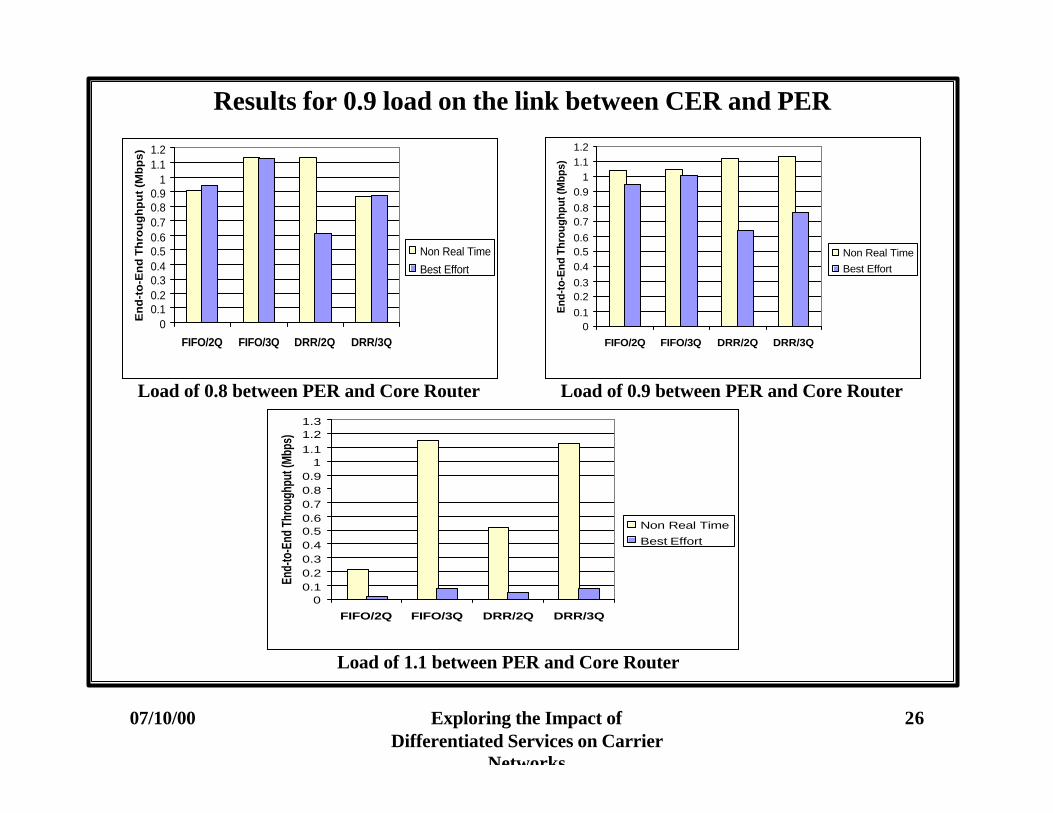
Results for 0.9 load on the link between CER and PER
00.1
0.20.3
0.40.50.6
0.70.8
0.91
1.11.2
FIFO/2Q FIFO/3Q DRR/2Q DRR/3Q
End
-to-
End
Thr
ough
put (
Mbp
s)
Non Real Time
Best Effort
00.10.20.30.40.50.60.70.80.9
11.11.2
FIFO/2Q FIFO/3Q DRR/2Q DRR/3Q
En
d-t
o-E
nd
Th
rou
gh
pu
t (M
bp
s)
Non Real Time
Best Effort
00.10.20.30.40.50.60.70.80.9
11.11.21.3
FIFO/2Q FIFO/3Q DRR/2Q DRR/3Q
End-
to-E
nd T
hrou
ghpu
t (M
bps)
Non Real Time
Best Effort
Load of 0.8 between PER and Core Router Load of 0.9 between PER and Core Router
Load of 1.1 between PER and Core Router
07/10/00 Exploring the Impact of Differentiated Services on Carrier
Networks
27
0
0.1
0.2
0.3
0.4
0.5
0.6
0.7
0.8
0.9
FIFO/2Q FIFO/3Q DRR/2Q DRR/3Q
En
d-t
o-E
nd
Th
rou
gh
pu
t (M
bp
s)
Non Real Time
Best Effort
0
0.1
0.2
0.3
0.4
0.5
0.6
0.7
FIFO/2Q FIFO/3Q DRR/2Q DRR/3Q
End-
to-E
nd T
hrou
ghpu
t (M
bps)
Non Real Time Best Effort
Load of 0.8 between PER and Core Router Load of 0.9 between PER and Core Router
Load of 1.1 between PER and Core Router
Results for 1.1 load on the link between CER and PER
0
0.1
0.2
0.3
0.4
0.5
0.6
0.7
FIFO/2Q FIFO/3Q DRR/2Q DRR/3Q
End-t
o-End
Throu
ghpu
t (Mbp
s)
Non Real Time
Best Effort
07/10/00 Exploring the Impact of Differentiated Services on Carrier
Networks
28
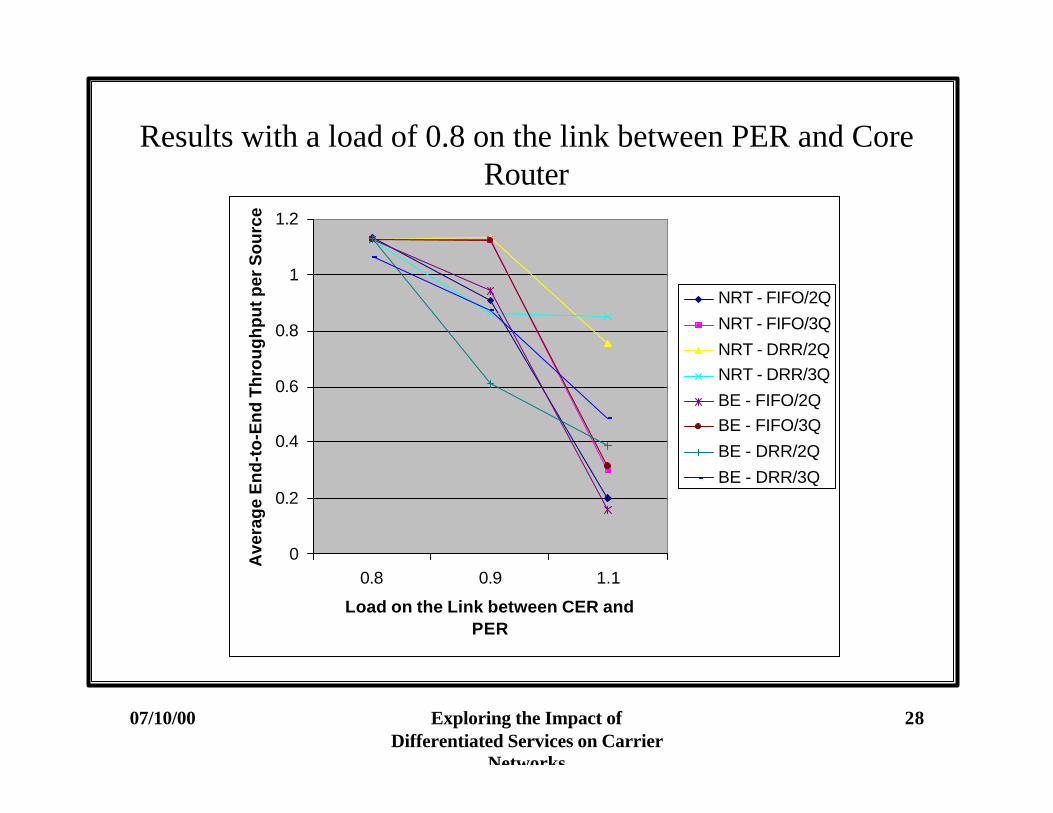
Results with a load of 0.8 on the link between PER and Core Router
0
0.2
0.4
0.6
0.8
1
1.2
0.8 0.9 1.1
Load on the Link between CER and PER
Ave
rag
e E
nd
-to
-En
d T
hro
ug
hp
ut p
er S
ou
rce
NRT - FIFO/2Q
NRT - FIFO/3Q
NRT - DRR/2QNRT - DRR/3Q
BE - FIFO/2QBE - FIFO/3Q
BE - DRR/2Q
BE - DRR/3Q
07/10/00 Exploring the Impact of Differentiated Services on Carrier
Networks
29
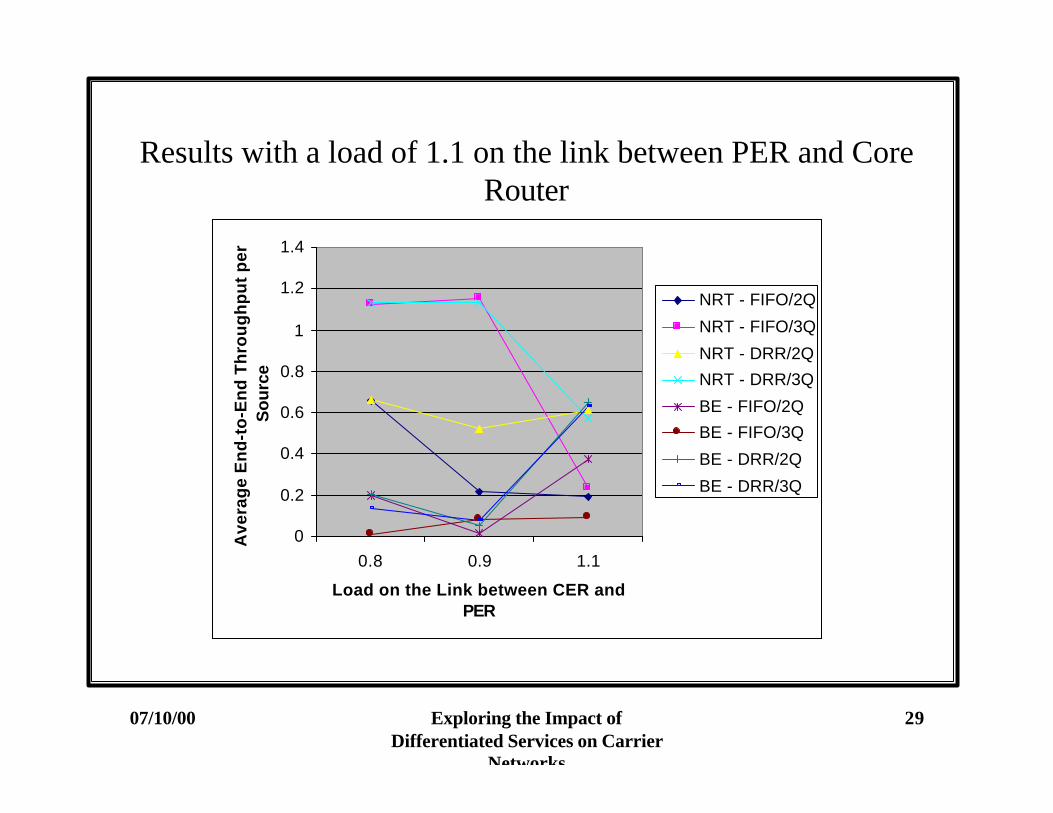
Results with a load of 1.1 on the link between PER and Core Router
0
0.2
0.4
0.6
0.8
1
1.2
1.4
0.8 0.9 1.1
Load on the Link between CER and PER
Ave
rag
e E
nd
-to
-En
d T
hro
ug
hp
ut
per
S
ourc
e
NRT - FIFO/2Q
NRT - FIFO/3Q
NRT - DRR/2Q
NRT - DRR/3Q
BE - FIFO/2Q
BE - FIFO/3Q
BE - DRR/2Q
BE - DRR/3Q
07/10/00 Exploring the Impact of Differentiated Services on Carrier
Networks
30
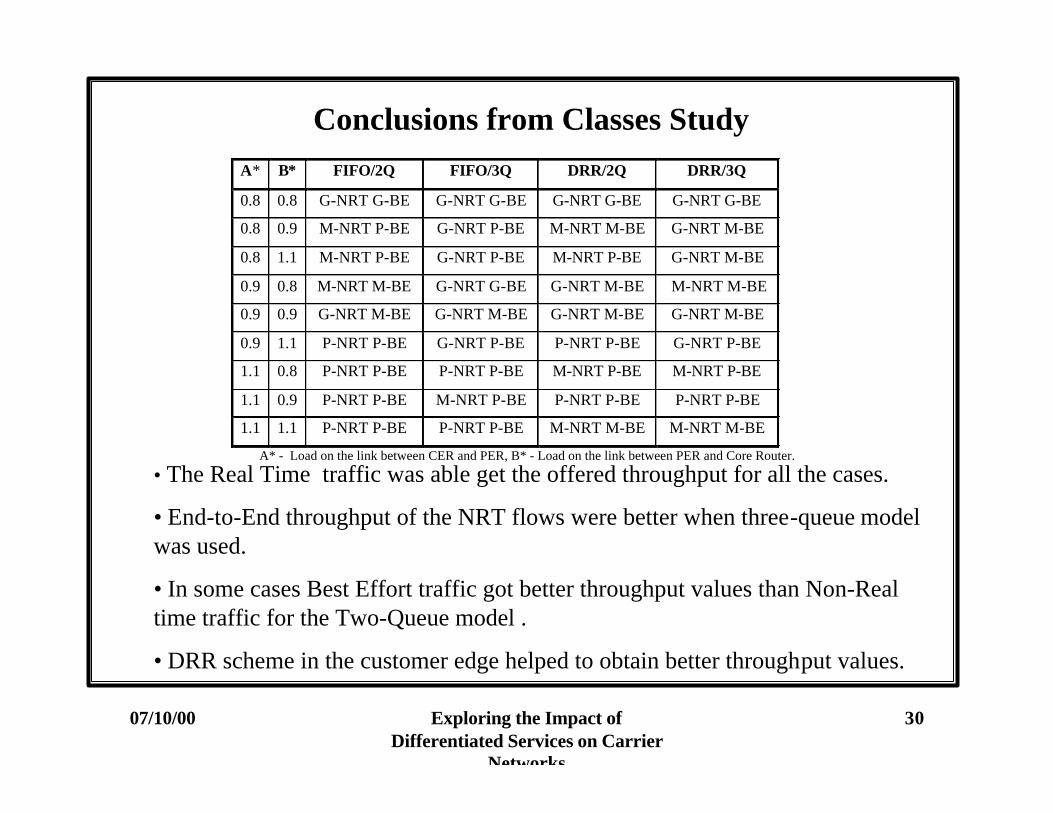
Conclusions from Classes Study
• The Real Time traffic was able get the offered throughput for all the cases.
• End-to-End throughput of the NRT flows were better when three-queue model was used.
• In some cases Best Effort traffic got better throughput values than Non-Real time traffic for the Two-Queue model .
• DRR scheme in the customer edge helped to obtain better throughput values.
A* B* FIFO/2Q FIFO/3Q DRR/2Q DRR/3Q
0.8 0.8 G-NRT G-BE G-NRT G-BE G-NRT G-BE G-NRT G-BE
0.8 0.9 M-NRT P-BE G-NRT P-BE M-NRT M-BE G-NRT M-BE
0.8 1.1 M-NRT P-BE G-NRT P-BE M-NRT P-BE G-NRT M-BE
0.9 0.8 M-NRT M-BE G-NRT G-BE G-NRT M-BE M-NRT M-BE
0.9 0.9 G-NRT M-BE G-NRT M-BE G-NRT M-BE G-NRT M-BE
0.9 1.1 P-NRT P-BE G-NRT P-BE P-NRT P-BE G-NRT P-BE
1.1 0.8 P-NRT P-BE P-NRT P-BE M-NRT P-BE M-NRT P-BE
1.1 0.9 P-NRT P-BE M-NRT P-BE P-NRT P-BE P-NRT P-BE
1.1 1.1 P-NRT P-BE P-NRT P-BE M-NRT M-BE M-NRT M-BE
A* - Load on the link between CER and PER, B* - Load on the link between PER and Core Router.
07/10/00 Exploring the Impact of Differentiated Services on Carrier
Networks
31
Conclusions and Lessons Learned
• Service level guarantees can be provided to higher service classes to certain extent even in an overloaded situation.
• UDP vs TCP
• The performance for TCP flows is badly effected when they are queued with UDP flows.
• TCP traffic could be protected to certain extent by marking UDP traffic to higher drop precedence.
• If performance results are critical for TCP traffic and congestion is expected, than it is highly desirable to mark UDP traffic to a separate class.
07/10/00 Exploring the Impact of Differentiated Services on Carrier
Networks
32
UDP Flows
• It has been seen throughout the studies that the high priority UDP traffic was always able achieve good performance.
• Providing guarantees to UDP flows is less complex than to TCP flows (hard service guarantees).
• Service provider can charge more for UDP flows because of their non responsive nature.
TCP Flows
• TCP flows are very sensitive to packets dropped.
• Parameters should be configured carefully as TCP flows are complex, i.e., TCP bursts, fragmentation etc.
• Hard service guarantees can be provided to TCP flows but extreme caution should be taken in configuring the parameters and in protecting them from UDP flows.
Conclusions and Lessons Learned (contd…)
07/10/00 Exploring the Impact of Differentiated Services on Carrier
Networks
33
Conclusions and Lessons Learned (contd…)
• RED performs better in byte mode than packet mode, but still discriminates based on packet lengths.
Classes Study:
• The three queue model was found to perform better than three queue model.
• It was found that better service guarantees can be provided if DRR is used in customer edge rather than FIFO.
• For two queue model the OUT of profile packets were dropped, which effected the whole flow.
• It can be recommended that marking packets to higher drop precedence values should be investigated further especially for TCP flows.
07/10/00 Exploring the Impact of Differentiated Services on Carrier
Networks
34
Conclusions and Lessons Learned (contd…)
• Differentiated services can be deployed into network with small number of classes or PHBs.
• The SLAs can be built based on the PHBs being offered and their expected performance.
• The network configuration should be tested thoroughly for parameter values and performance results.
•A service provider can offer service guarantees to customers whose flows are marked as high priority.
07/10/00 Exploring the Impact of Differentiated Services on Carrier
Networks
35
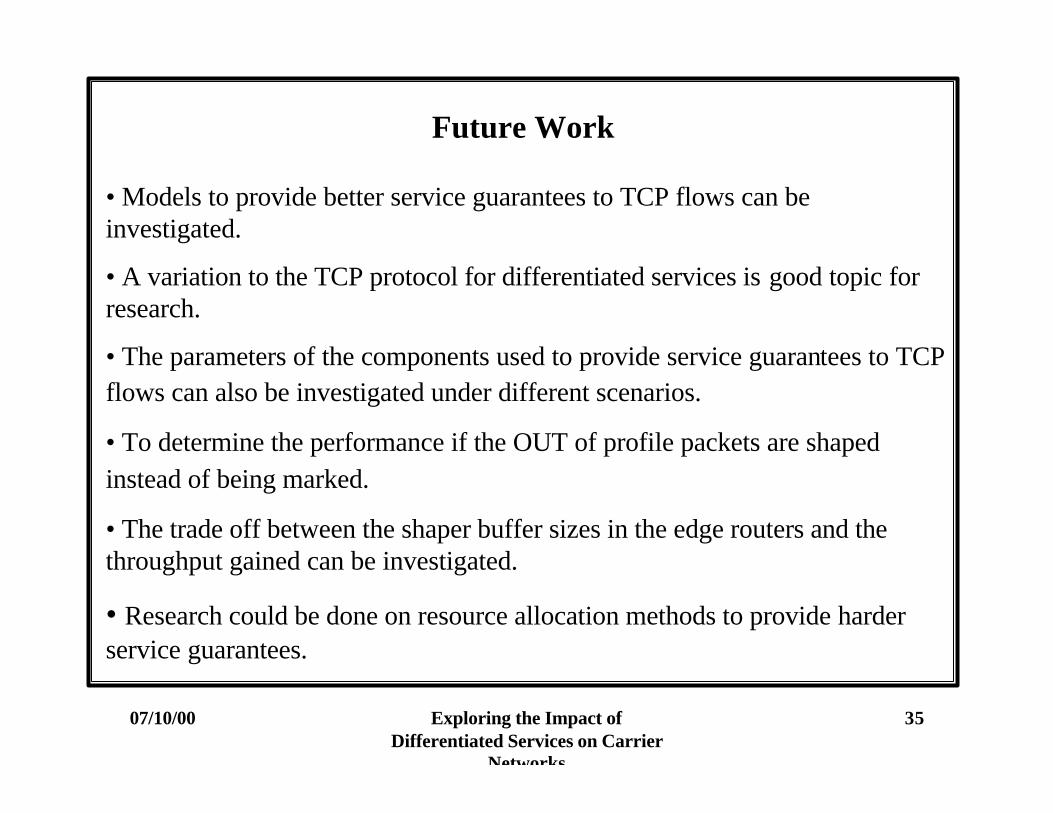
Future Work
• Models to provide better service guarantees to TCP flows can beinvestigated.
• A variation to the TCP protocol for differentiated services is good topic for research.
• The parameters of the components used to provide service guarantees to TCP flows can also be investigated under different scenarios.
• To determine the performance if the OUT of profile packets are shaped instead of being marked.
• The trade off between the shaper buffer sizes in the edge routers and the throughput gained can be investigated.
• Research could be done on resource allocation methods to provide harder service guarantees.
07/10/00 Exploring the Impact of Differentiated Services on Carrier
Networks
36
Thanks You!
Questions?