Embed Size (px)
Citation preview
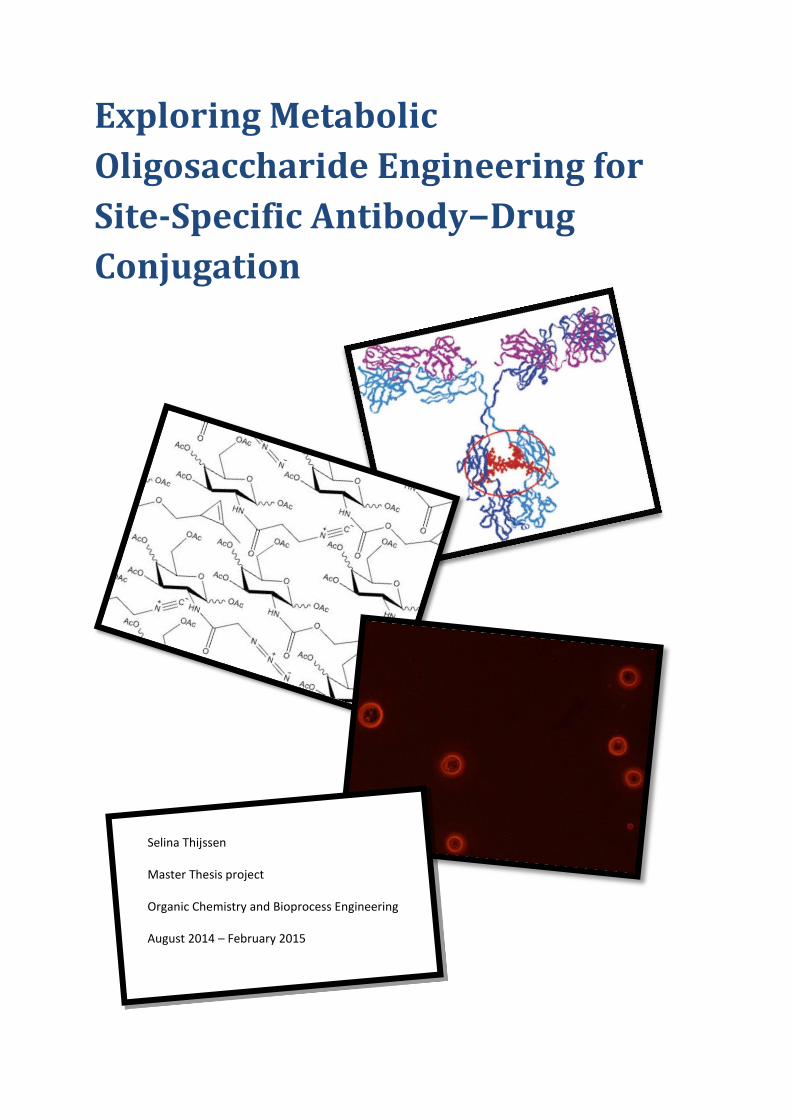
Exploring Metabolic
Oligosaccharide Engineering for
Site-Specific Antibody−Drug
Conjugation
Selina Thijssen
Master Thesis project
Organic Chemistry and Bioprocess Engineering
August 2014 – February 2015
ii
Master Thesis Project
Exploring Metabolic Oligosaccharide Engineering for Site-Specific
Antibody−Drug Conjugation
Student: Selina Thijssen
Student number: 911107830100
Supervisors: Tom Wennekes and Mathieu Streefland
Chair groups: Organic Chemistry and Bioprocess Engineering
Course code: ORC-80436
Period: August 4th 2014 – February 12th 2015
iii
Abstract Metabolic oligosaccharide engineering (MOE) is a method for incorporating functionalized carbohydrates into
glycan structures of biomolecules in living cells, such as the N-glycans of antibodies. The functional groups on
these carbohydrates can react in bioorthogonal chemistry reactions, in order to link a small molecule, that
holds a desired property, such as fluorescence, to the biomolecule. This project explores the possibility to
construct an Antibody-Drug Conjugate (ADC), while making use of MOE, between the antibody Trastuzumab,
which is produced in CHO cells, and anticancer drugs for specific breast cancer treatment. Additionally the MOE
technique will be used to visualize glycan structures on the CHO cell surface. A library of 7 carbohydrates was
synthesized: glucosamine and galactosamine functionalized with an azide, cyclopropene and isonitrile, and
fucose functionalized with an azide. The azide can react in a SPAAC reaction with bicyclononyne (BCN) and the
cyclopropene and isonitrile can react with tetrazines in an IED-DA reaction. Because of the crosslink in the
salvage pathways of glucosamine and galactosamine, initially galactosamine derivatives will be tested to
incorporate the functional groups into the antibody’s N-glycan structures. Galactosamine functionalized with
an azide (acGalNAz) was first fed to antibody producing CHO cells in different concentrations. The
incorporation of acGalNAz in cell surface glycan structures could be visualized by reaction with a BCN-
rhodamine dye with fluorescent microscopy, whoever high background signals were preventing conclusive
results. At day 5 after cultivation the antibodies were harvested and purified by a protein A-Sepharose column.
The addition of acGalNAz to the cell culture resulted in a lower cell count compared to the controls, but higher
antibody production per cell. SDS-PAGE showed that the antibodies produced by the acGalNAz fed CHO cells
reacted with the BCN-coupled fluorescent dye, which proves that the azide was incorporated into the N-
glycans of these antibodies and that they were still available for click reaction with BCN. Additionally, UPLC
analysis will be performed to determine the conformation of the N-glycan structures. So this project shows that
MOE can be used to incorporate azide functionalized galactosamine into the N-glycan structure of Trastuzumab
and that the azides are still available for the SPAAC reaction with a BCN-coupled fluorescent dye. For the
future, these azide functionalized antibodies form a promising basis for the formation of Antibody-Drug
Conjugates (ADC’s) for breast cancer treatment.
iv
List of abbreviations ac acetylated
ADC Antibody Drug Conjugate
BCN bicyclononyne
BCN-rhodamine BCN-POE3-NH-lissamine rhodamine B conjugate (23)
CHO cells Chinese Hamster Ovary cells
DCM dichloromethane
DIBAL-H di-isobutylaluminium hydride
DMF dimethyl formamide
DMSO dimethyl sulfoxide
EDC.HCl N-(3-Dimethylaminopropyl)-N′-ethylcarbodiimide hydrochloride
Et3N = TEA triethylamine
Fab region fragment antigen-binding region
Fc region fragment crystallizable region
FucAz 6-azido fucose (7)
GALE UDP-galactose 4'-epimerase
GalNAc N-acetyl galactosamine
GalNAz N-azido galactosamine (4)
GalNCyc N-cyclopropene galactosamine (13)
GalNForm N-formamido galactosamine (18)
GalNIso N-isonitrile galactosamine (19)
GlcNAc N-acetyl glucosamine
GlcNAz N-azido glucosamine (6)
GlcNCyc N-cyclopropene glucosamine (15)
GlcNForm N-formamido glucosamine (21)
GlcNIso N-isonitrile glucosamine (22)
HILIC-UPLC hydrophilic interaction ultra performance liquid chromatography 1H-NMR hydrogen-1 nuclear magnetic resonance
HOBt 1-hydroxybenzotriazole
HPLC high performance liquid chromatography
IED-DA inverse electron demanding Diels Alder reaction
IgG Immunoglobuline G
IR infra-red
MeOH methanol
MOE Metabolic Oligosaccharide Engineering
o/n overnight
PNGase F Peptide-N-Glycosidase F
rpm rounds per minute
rt room temperature
SDS-PAGE sodium dodecyl sulfate polyacrylamide gel electrophoresis
SPAAC strain promoted azide-alkyne cycloaddition
t-BAF tetra-n-butylammonium fluoride
THF tetrahydrofurane
TLC thin-layer chromatography
UDP Uridine diphosphate
UPLC ultra performance liquid chromatography
UV ultra-violet
v
Table of contents Abstract ................................................................................................................................................................... iii
List of abbreviations ................................................................................................................................................ iv
Table of contents ..................................................................................................................................................... v
1. Introduction ........................................................................................................................................................ 1
1.1 Antibody ........................................................................................................................................................ 1
1.2 Earlier work ................................................................................................................................................... 2
1.3 Click chemistry .............................................................................................................................................. 4
1.4 Approach ....................................................................................................................................................... 6
2. Results and discussion ......................................................................................................................................... 8
2.1 Chemical synthesis ........................................................................................................................................ 8
2.2 Biological experiments ................................................................................................................................ 14
2.3 Antibody purification and analysis .............................................................................................................. 21
3. Conclusion ......................................................................................................................................................... 27
3.1 Chemical synthesis ...................................................................................................................................... 27
3.2 Biological experiments ................................................................................................................................ 27
3.3 Antibody purification and analysis .............................................................................................................. 28
4. Future prospects ............................................................................................................................................... 29
5. Materials and Methods ..................................................................................................................................... 31
5.1 Chemical Synthesis ...................................................................................................................................... 31
5.2 Biological experiments ................................................................................................................................ 39
5.3 Antibody purification and analysis .............................................................................................................. 40
6. Acknowledgements ........................................................................................................................................... 41
7. References ......................................................................................................................................................... 42
8. Appendix ........................................................................................................................................................... 44
8.1 1H NMR spectra ........................................................................................................................................... 44
8.2 IgG quantification on Bio-Monolith Protein A column in a UPLC system ................................................... 51
8.3 Glycan analysis protocol .............................................................................................................................. 55
8.4 Protein measurement, SDS-PAGE, gel staining, Western blotting, Protein detection Protocols ................ 58

1
1. Introduction The high occurrence of cancer in the western world asks for more effective and specific treatments. Current
cytotoxic chemotherapy drugs are not specific enough: together with targeting the rapidly growing cancer, also
other tissues in the patient’s body are harmed. This asks for more effective drugs that can be targeted
specifically at the cancer cells. The natural defense mechanism of the body uses antibodies to specifically target
diseased cells. The properties of these antibodies are cleverly used by the drug industry in so called antibody-
drug conjugates (ADC’s). Using ADC’s, the non-specific cytotoxic anti-cancer drug is guided by the cancer-
specific antibody towards the cancer cells, where the cytotoxicity is required. This may sound as a perfect
combination, however the first generation ADC’s of the 1990 all failed during the first trials. Three mayor
problems occurred: the cytotoxicity of the drug was not high enough, the antibody was not specific enough and
the linker was not stable enough. Over the years several successful ADC’s have been developed and have
reached the market. They are currently being used to treat cancer patients, however also some have been
withdrawn due to lack of surviving patients1-3
. Especially a lot of progress can still be made in the development
of ADC’s when looking at linker stability and homogeneity. During this thesis the focus will lie on exploring the
chemistry behind the linkage between anti-cancer drugs and the breast cancer specific antibody Trastuzumab.
Trastuzumab is a synthetic antibody that is derived from an anti-breast cancer antibody found in mice4. The
antigen targeted by this antibody is HER2, a glycoprotein which is present on the outside of aggressively
growing breast cancer cells. Upon attachment of the antibody to the antigen the whole complex is internalized,
which in itself already triggers apoptosis. However the cytotoxicity of Trastuzumab alone is not high enough, so
an anticancer drug must be linked to the antibody, in order to completely eliminate the cancer in the patient.
An example of a Trastuzumab based ADC that has already been approved for medical treatment is Ado-
trastuzumab Emtansine (T-DM1)4.
1.1 Antibody
In order to develop a method for antibody-drug conjugation it is necessary to understand the natural structure
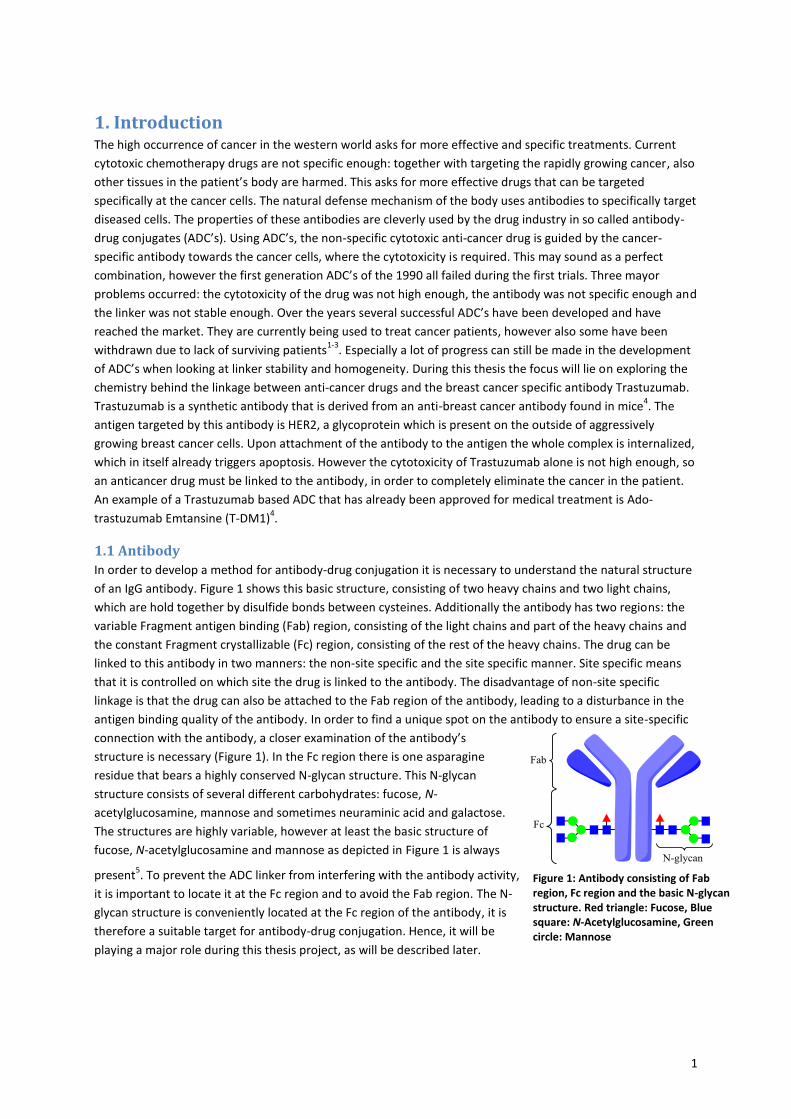
of an IgG antibody. Figure 1 shows this basic structure, consisting of two heavy chains and two light chains,
which are hold together by disulfide bonds between cysteines. Additionally the antibody has two regions: the
variable Fragment antigen binding (Fab) region, consisting of the light chains and part of the heavy chains and
the constant Fragment crystallizable (Fc) region, consisting of the rest of the heavy chains. The drug can be
linked to this antibody in two manners: the non-site specific and the site specific manner. Site specific means
that it is controlled on which site the drug is linked to the antibody. The disadvantage of non-site specific
linkage is that the drug can also be attached to the Fab region of the antibody, leading to a disturbance in the
antigen binding quality of the antibody. In order to find a unique spot on the antibody to ensure a site-specific
connection with the antibody, a closer examination of the antibody’s
structure is necessary (Figure 1). In the Fc region there is one asparagine
residue that bears a highly conserved N-glycan structure. This N-glycan
structure consists of several different carbohydrates: fucose, N-
acetylglucosamine, mannose and sometimes neuraminic acid and galactose.
The structures are highly variable, however at least the basic structure of
fucose, N-acetylglucosamine and mannose as depicted in Figure 1 is always
present5. To prevent the ADC linker from interfering with the antibody activity,
it is important to locate it at the Fc region and to avoid the Fab region. The N-
glycan structure is conveniently located at the Fc region of the antibody, it is
therefore a suitable target for antibody-drug conjugation. Hence, it will be
playing a major role during this thesis project, as will be described later.
Figure 1: Antibody consisting of Fab region, Fc region and the basic N-glycan structure. Red triangle: Fucose, Blue square: N-Acetylglucosamine, Green circle: Mannose
2
1.2 Earlier work
Several methods have already been developed to establish the covalent link between antibody and drug, for
instance via an amide bond with the amines that are naturally present on the antibody’s surface, such as
lysines 1, 3, 4
. Another popular method is making use of the naturally occurring cysteines of the antibody. The
terminal thiol group can react with another thiol to form a disulfide bond or with a maleimide to form a
thioether6-8
. The disadvantage of these methods is the lack of site-specificity, which results in ADC’s that are
heterogenous and thus less reliable for medical treatment of patients.
This asks for a more reliable method to produce homogenous ADC’s, by aiming for site specific linkage between
the antibody and drug. Several methods have been developed, for instance by a reaction with a surface
exposed tyrosine residue in the Fc region 9. Another clever tool to reach site-specific linkage for ADC’s is the
conserved N-glycan structure, like was already touched upon in section 1.1. It has a fixed position at the
asparagine residue on the Fc region of the antibody and therefore it gives a unique opportunity for site-specific
labeling of antibodies. Several published studies have explored a chemoenzymetic approach to change the
native N-glycan structure of the antibody after production, in order to incorporate a reactive group, for
instance an aldehyde, azide or thiol, that can react with a drug to form an ADC 10-13
.
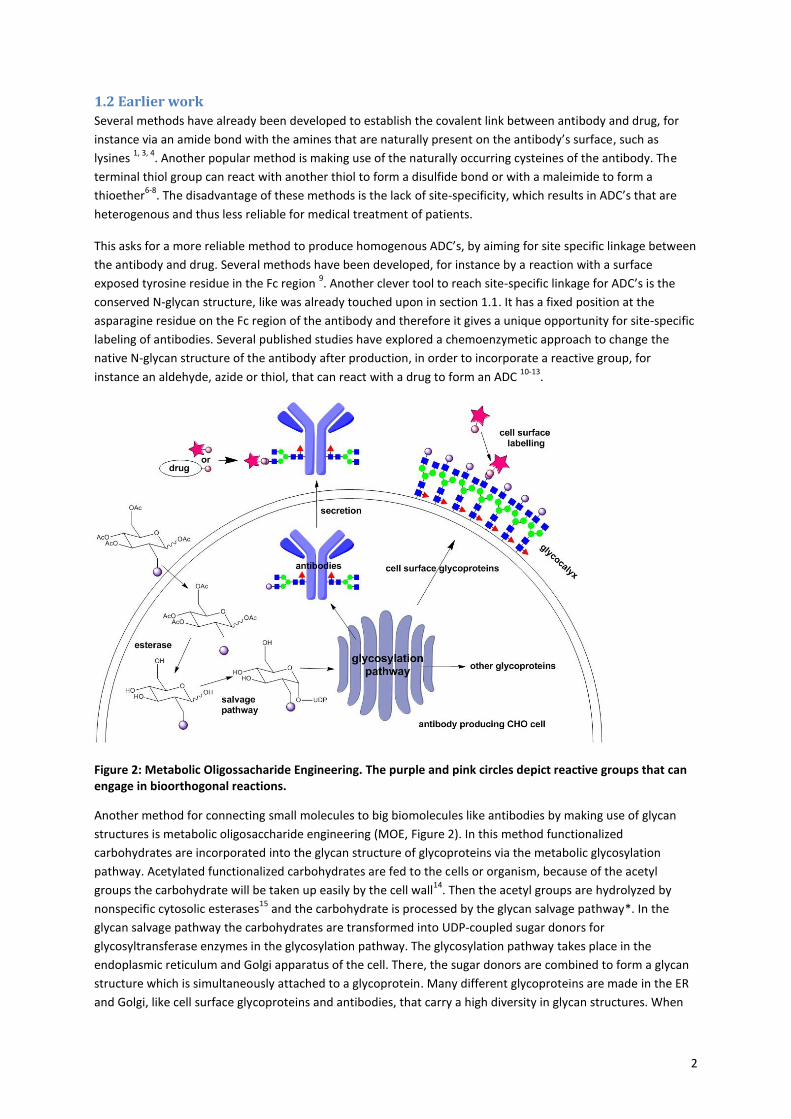
Figure 2: Metabolic Oligossacharide Engineering. The purple and pink circles depict reactive groups that can engage in bioorthogonal reactions.
Another method for connecting small molecules to big biomolecules like antibodies by making use of glycan
structures is metabolic oligosaccharide engineering (MOE, Figure 2). In this method functionalized
carbohydrates are incorporated into the glycan structure of glycoproteins via the metabolic glycosylation
pathway. Acetylated functionalized carbohydrates are fed to the cells or organism, because of the acetyl
groups the carbohydrate will be taken up easily by the cell wall14
. Then the acetyl groups are hydrolyzed by
nonspecific cytosolic esterases15
and the carbohydrate is processed by the glycan salvage pathway*. In the
glycan salvage pathway the carbohydrates are transformed into UDP-coupled sugar donors for
glycosyltransferase enzymes in the glycosylation pathway. The glycosylation pathway takes place in the
endoplasmic reticulum and Golgi apparatus of the cell. There, the sugar donors are combined to form a glycan
structure which is simultaneously attached to a glycoprotein. Many different glycoproteins are made in the ER
and Golgi, like cell surface glycoproteins and antibodies, that carry a high diversity in glycan structures. When
3
successful, these glycoproteins will carry the functionalized carbohydrate in the glycan structure and reactions
can be performed on this functional group14
. Such a small chemical handle can be used for several applications
involving cell surface labelling, ‘glycomics’ evaluations and carbohydrate-based cell adhesion16
.
Starting in 2000, the research group of Carolyn Bertozzi from the University of California has been developing
the MOE method for cell surface labeling. They started with incorporating azide functionalized sugars, for
instance mannosamine derivatives, into glycoproteins present in the glycocalyx of the cell17
. The glycocalyx is
the outer surface layer of living cell, which is composed of glycans and glycoproteins and plays a key role in
cellular communication. Via the glycan salvage pathway an azide functionalized mannosamine will be turned
into a neuraminic acid and incorporated into glycoproteins present on the surface of the cell. The azido
neuraminic acids were then reacted with a fluorescent compound via a Staudinger ligation. In this way the
presence of glycoproteins can be visualized in the cell wall of living cells and organisms. For instance, in 2008
Bertozzi’s group incorporated the azidosugars in the glycocalyx of zebrafish embryos. By making use of
differently colored fluorescent compounds over time, the evolving pattern of glycans during the development
of the zebrafish embryos could be visualized 18
.
The MOE method was also adopted by other research groups for cell surface labeling, however they made use
of their own bioorthogonal chemistry methods. Since 2012, several groups have been working on
carbohydrates containing a cyclopropene. N-acetyl mannosamine, N-acetyl glucosamine and N-acetyl
galactosamine derivatives containing a cyclopropene were incorporated in the glycoproteins of cell surfaces in
Jurkat cells 19-22
. In 2013, the group of Leeper has been working on carbohydrates containing an isonitrile
group. They constructed N-acetyl glucosamine, N-acetyl mannosamine and N-acetyl galactosamine analogues
with a isonitrile group, which were incorporated in the glycocalyx of Lewis Lung Carcinoma (LL2) cells23, 24
. The
exposed cyclopropenes and isonitriles can react with a tetrazine-fluorophore conjugate.
Interestingly, the MOE method has also already been used to incorporate functionalized carbohydrates into the
N-glycan structures of antibodies for ADC development. For instance, Okeley et al. 25
synthesized a fucose
derivative with a C6 thiol group and fed this to antibody producing CHO cells. The 6-thiofucose was
incorporated into the N-glycan structure of the produced antibodies. Next the free thiols were reacted with a
drug containing a maleimide to produce an ADC. In 2013 Rochefort et al.26
also developed a method to site-
specifically label antibodies, by incorporation of an N-azidoacetyl mannosamine into the N-glycan structure,
followed by a Staudinger ligation with a phosphine-fluorophore conjugate. The incorporation of functionalized
carbohydrates into the N-glycan structure of the antibody, by making use of the glycosylation metabolism of
the cell, will also be the approach investigated during this thesis.
* For more details on the salvage pathways of GalNAc, GlcNAc and Fucose, see Luchansky, Bertozzi et al., 2003 14.
4
1.3 Click chemistry
The chemistry that was used in the aforementioned studies all have in common that the reactive groups do not
interact with the metabolic processes of the cell itself. This kind of chemistry is called bioorthogonal chemistry
and was first introduced by Bertozzi et al. in 200314
. It allows for performing chemistry on glycans, proteins and
lipids in living organisms, without interfering with chemistry of the cell itself 27
. Small synthetic molecules, such
as a drug or fluorophore can be linked to complex biomolecules, like antibodies or the glycocalyx.
A subfield within bioorthogonal chemistry is click chemistry. A click chemistry reaction has a high reaction rate
and high yields with simple reaction conditions. Also most click chemistry reactions can be performed in an
aqueous environment to form stable products. No harmful by-products are produced during the reaction,
which is favorable in biological system because the cytotoxicity will be kept to a minimum28
. Several click
chemistry methods have been developed in the last decade, however the most famous is the copper catalyzed
alkyne-azide cycloaddition (CuAAC), based on the Huisgen 1,3 cycloaddition 29-31
. The downside of this reaction
is the use of copper, which is toxic to living organisms. So a new alkyne-azide click reaction was introduced in
2004 by Bertozzi: the copper-free Strain Promoted Azide-Alkyne Cycloaddition (SPAAC) 32
. In this reaction a
strained alkyne is reacted with an azide in a [2+3]cycloaddition to form a triazole (Figure 3) without the need of
a catalyst. The strained alkyne used in this project is the bicyclononyne (BCN), because of its high reactivity, low
lipophilicity 33
and the commercial availability of a BCN-fluorophore conjugate, which will be used for
visualization during this project.
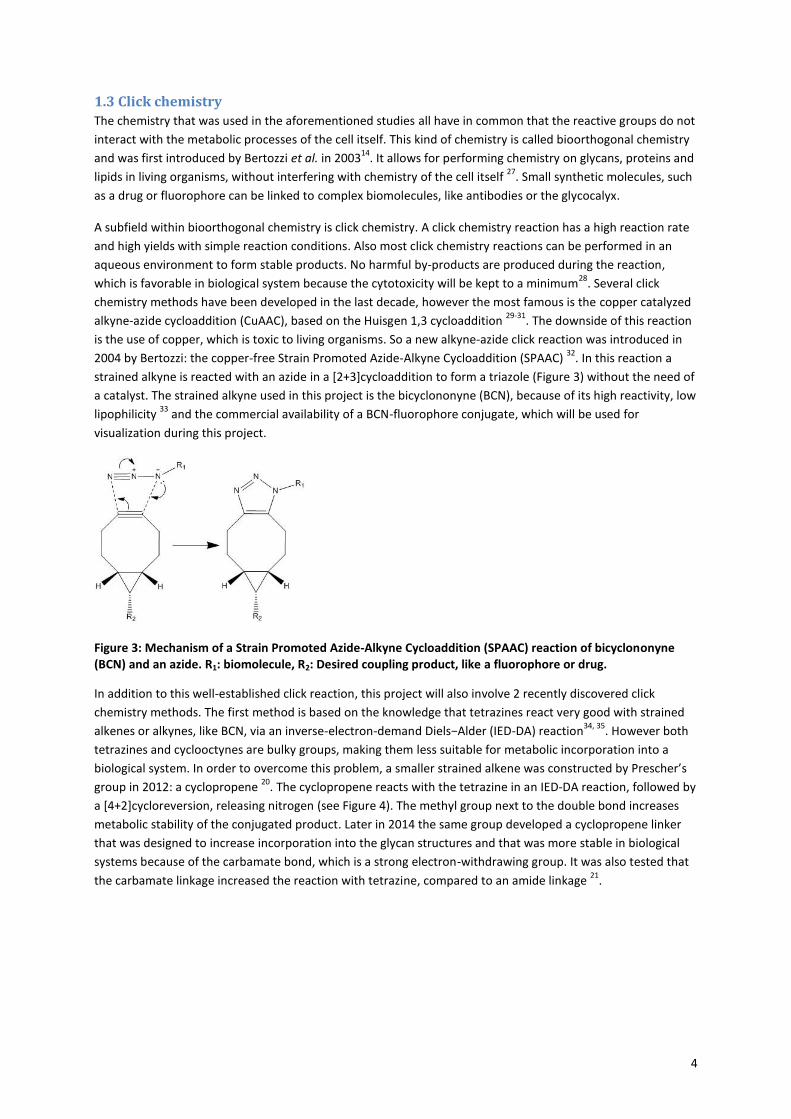
Figure 3: Mechanism of a Strain Promoted Azide-Alkyne Cycloaddition (SPAAC) reaction of bicyclononyne (BCN) and an azide. R1: biomolecule, R2: Desired coupling product, like a fluorophore or drug.
In addition to this well-established click reaction, this project will also involve 2 recently discovered click
chemistry methods. The first method is based on the knowledge that tetrazines react very good with strained
alkenes or alkynes, like BCN, via an inverse-electron-demand Diels−Alder (IED-DA) reaction34, 35
. However both
tetrazines and cyclooctynes are bulky groups, making them less suitable for metabolic incorporation into a
biological system. In order to overcome this problem, a smaller strained alkene was constructed by Prescher’s
group in 2012: a cyclopropene 20
. The cyclopropene reacts with the tetrazine in an IED-DA reaction, followed by
a [4+2]cycloreversion, releasing nitrogen (see Figure 4). The methyl group next to the double bond increases
metabolic stability of the conjugated product. Later in 2014 the same group developed a cyclopropene linker
that was designed to increase incorporation into the glycan structures and that was more stable in biological
systems because of the carbamate bond, which is a strong electron-withdrawing group. It was also tested that
the carbamate linkage increased the reaction with tetrazine, compared to an amide linkage 21
.
5
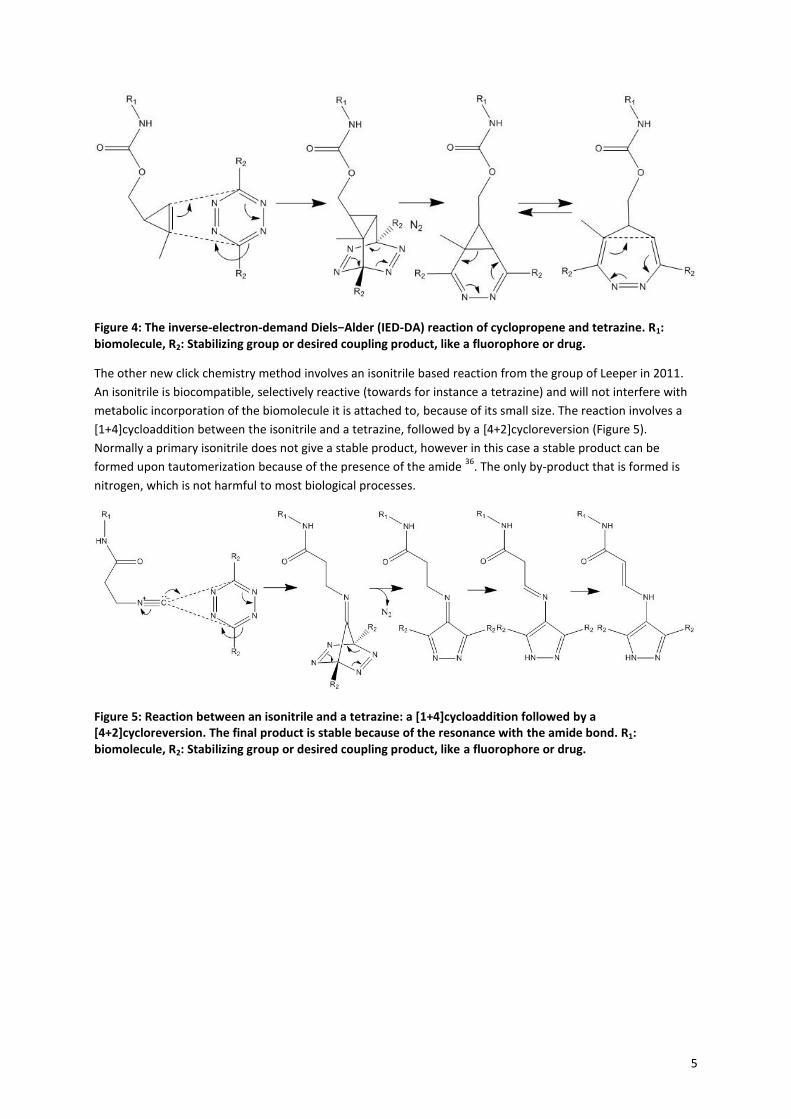
Figure 4: The inverse-electron-demand Diels−Alder (IED-DA) reaction of cyclopropene and tetrazine. R1: biomolecule, R2: Stabilizing group or desired coupling product, like a fluorophore or drug.
The other new click chemistry method involves an isonitrile based reaction from the group of Leeper in 2011.
An isonitrile is biocompatible, selectively reactive (towards for instance a tetrazine) and will not interfere with
metabolic incorporation of the biomolecule it is attached to, because of its small size. The reaction involves a
[1+4]cycloaddition between the isonitrile and a tetrazine, followed by a [4+2]cycloreversion (Figure 5).
Normally a primary isonitrile does not give a stable product, however in this case a stable product can be
formed upon tautomerization because of the presence of the amide 36
. The only by-product that is formed is
nitrogen, which is not harmful to most biological processes.
Figure 5: Reaction between an isonitrile and a tetrazine: a [1+4]cycloaddition followed by a [4+2]cycloreversion. The final product is stable because of the resonance with the amide bond. R1: biomolecule, R2: Stabilizing group or desired coupling product, like a fluorophore or drug.
6
1.4 Approach
The goal of this project is to develop an antibody-drug conjugation method that involves metabolic
oligosaccharide engineering (MOE) with functionalized carbohydrates and the click chemistry toolbox. The
functionalized carbohydrates will be fed to Chinese Hamster Ovary (CHO) cells, specifically the BC4 CHO-K1 cell
line which is mutated to produce high amounts of the antibody Trastuzumab. The main aim of the experiments
will be to investigate whether the functionalized carbohydrates are incorporated into the N-glycan structure of
the produced antibodies, and whether the functional groups that are incorporated into the N-glycan are still
available for click chemistry. Additionally fluorescent cell surface labeling will be used to examine whether the
functionalized carbohydrates are incorporated in the glycocalyx.
To determine which carbohydrates are most suitable to test the hypothesis, the metabolic glycosylation
pathway of antibody N-glycans has been examined. When taking the basic structure of the IgG antibody N-
glycan (Figure 1) into account, the most suitable carbohydrates would be fucose, N-acetylglucosamine (GlcNAc)
and mannose. However the use of functionalized mannoses are not found in literature, presumable because
substitution of the hydroxyl groups causes the mannose derivatives to become unrecognizable by the
glycosylation enzymes. N-acetylmannosamine is frequently used in literature, but is less suitable in this case. N-
acetylmannosamine can be modified by the salvage pathway into neuraminic acid, which is sometimes present
at the terminal position of N-glycans, but is not part of the basic structure.
N-acetylglucosamine seems the most suitable carbohydrate, however in several recent papers concerning
metabolic cell surface labelling, replacement of GlcNAc by an azide derivative does not lead to significant
incorporation into the glycans of the glycocalyx37
. Apparently the addition of a functional group on the GlcNAc
leads to decreased recognition by the enzymes of the GlcNAc salvage pathway. Boyce et al. looked more
closely at the metabolic pathway of O-GlcNAc structures and noticed the cross-talk in the GalNAc and GlcNAc
salvage pathway. In the stage of the UDP sugar donors, the UDP-GalNAc can be converted into UDP-GlcNAc and
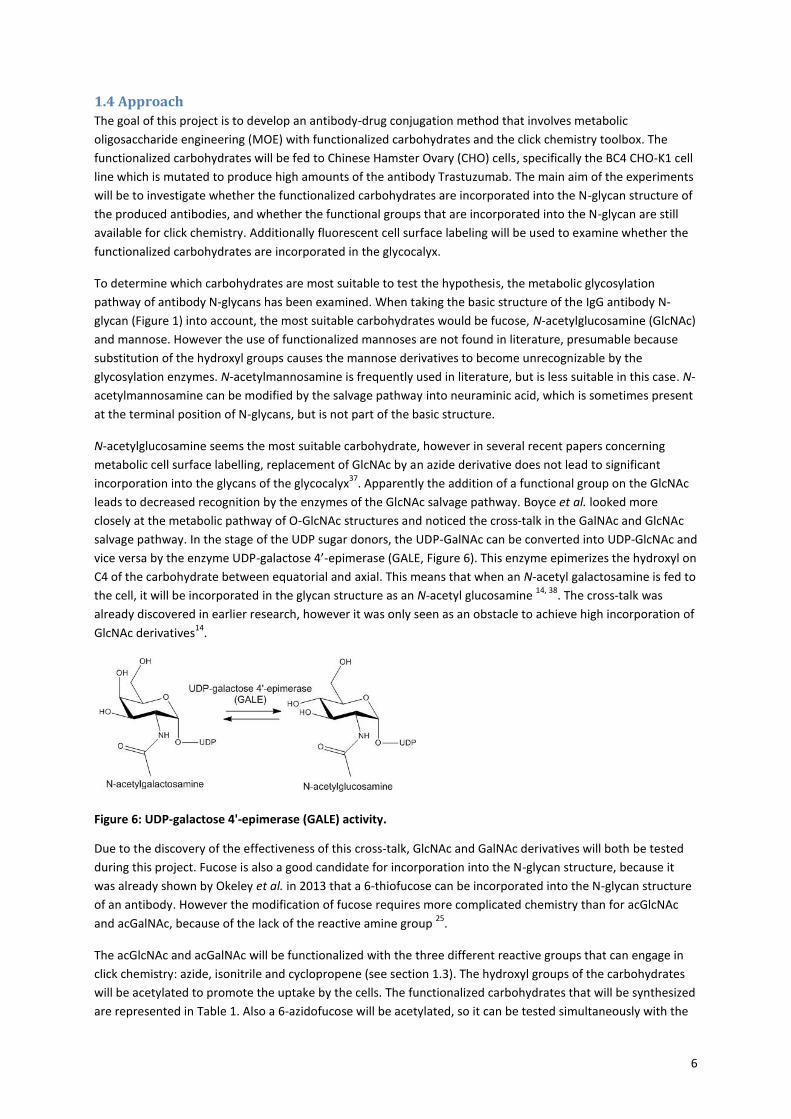
vice versa by the enzyme UDP-galactose 4’-epimerase (GALE, Figure 6). This enzyme epimerizes the hydroxyl on
C4 of the carbohydrate between equatorial and axial. This means that when an N-acetyl galactosamine is fed to
the cell, it will be incorporated in the glycan structure as an N-acetyl glucosamine 14, 38
. The cross-talk was
already discovered in earlier research, however it was only seen as an obstacle to achieve high incorporation of
GlcNAc derivatives14
.
Figure 6: UDP-galactose 4'-epimerase (GALE) activity.
Due to the discovery of the effectiveness of this cross-talk, GlcNAc and GalNAc derivatives will both be tested
during this project. Fucose is also a good candidate for incorporation into the N-glycan structure, because it
was already shown by Okeley et al. in 2013 that a 6-thiofucose can be incorporated into the N-glycan structure
of an antibody. However the modification of fucose requires more complicated chemistry than for acGlcNAc
and acGalNAc, because of the lack of the reactive amine group 25
.
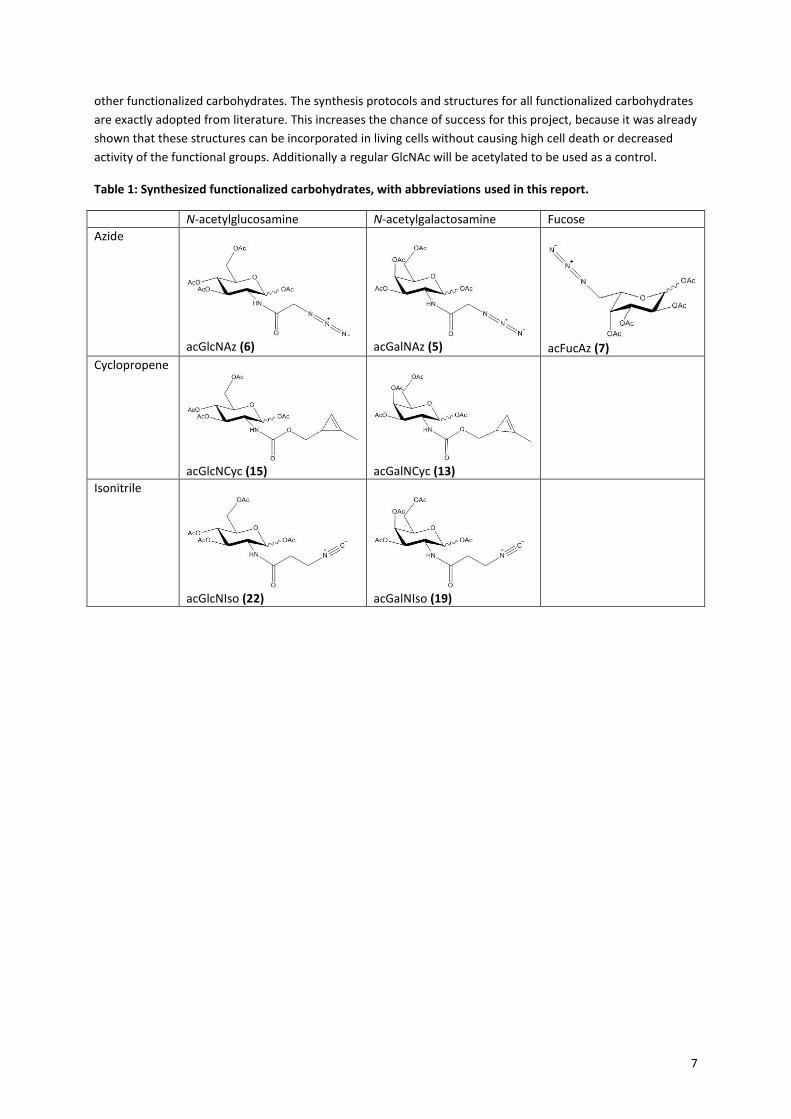
The acGlcNAc and acGalNAc will be functionalized with the three different reactive groups that can engage in
click chemistry: azide, isonitrile and cyclopropene (see section 1.3). The hydroxyl groups of the carbohydrates
will be acetylated to promote the uptake by the cells. The functionalized carbohydrates that will be synthesized
are represented in Table 1. Also a 6-azidofucose will be acetylated, so it can be tested simultaneously with the
7
other functionalized carbohydrates. The synthesis protocols and structures for all functionalized carbohydrates
are exactly adopted from literature. This increases the chance of success for this project, because it was already
shown that these structures can be incorporated in living cells without causing high cell death or decreased
activity of the functional groups. Additionally a regular GlcNAc will be acetylated to be used as a control.
Table 1: Synthesized functionalized carbohydrates, with abbreviations used in this report.
N-acetylglucosamine N-acetylgalactosamine Fucose
Azide
acGlcNAz (6)
acGalNAz (5)
acFucAz (7)
Cyclopropene
acGlcNCyc (15)
acGalNCyc (13)
Isonitrile
acGlcNIso (22)
acGalNIso (19)
8
2. Results and discussion The start of this project involved the chemical synthesis of the 8 different functionalized carbohydrates. All
carbohydrates where synthesized according to previously reported protocols (see section 5.1). However
sometimes adjustments had to be made, indicating that not all protocols found in literature are as reliable as
would be expected. Subsequently the acGalNAz was fed to antibody producing CHO cells. Via fluorescent cell
surface labeling it was investigated whether the acGalNAz was incorporated in the glycocalyx of the cell. The
produced antibodies were purified and analyzed with SDS-PAGE whether the acGalNAz was incorporated into
the N-glycan of the antibodies by making use of fluorescent labeling of the azide. Additionally, UPLC analysis
can be performed to determine the influence of the addition of acGalNAz on the N-glycan composition.
2.1 Chemical synthesis
The synthesis of the GalNAc and GlcNAc derivatives is almost the same for the three kinds of click chemistry
methods. A precursor molecule containing a carboxylic acid and the click chemistry reactive group is
constructed and then reacted with the amine of glucosamine or galactosamine in a condensation reaction, to
form a stable amide bond between the sugar and the functional group. In order to promote the uptake of the
sugar by the cells, the hydroxyl groups of the sugars are acetylated.
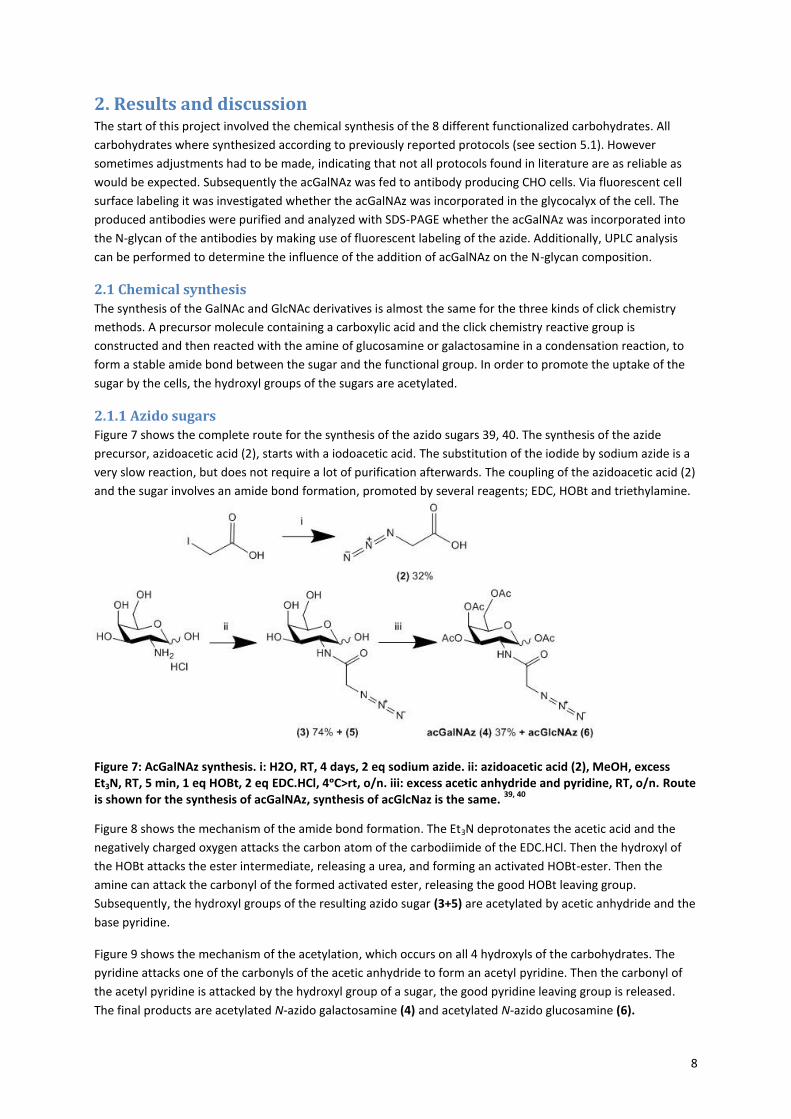
2.1.1 Azido sugars Figure 7 shows the complete route for the synthesis of the azido sugars 39, 40. The synthesis of the azide
precursor, azidoacetic acid (2), starts with a iodoacetic acid. The substitution of the iodide by sodium azide is a
very slow reaction, but does not require a lot of purification afterwards. The coupling of the azidoacetic acid (2)
and the sugar involves an amide bond formation, promoted by several reagents; EDC, HOBt and triethylamine.
Figure 7: AcGalNAz synthesis. i: H2O, RT, 4 days, 2 eq sodium azide. ii: azidoacetic acid (2), MeOH, excess Et3N, RT, 5 min, 1 eq HOBt, 2 eq EDC.HCl, 4ᵒC>rt, o/n. iii: excess acetic anhydride and pyridine, RT, o/n. Route is shown for the synthesis of acGalNAz, synthesis of acGlcNaz is the same.
39, 40
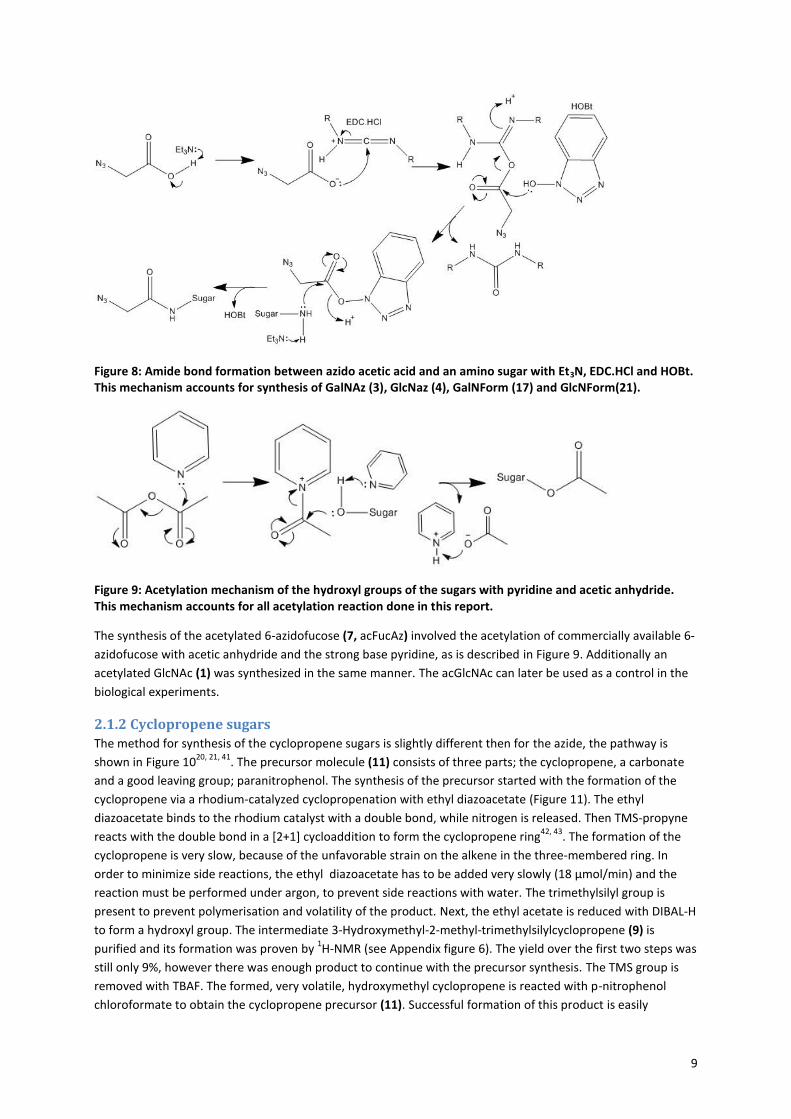
Figure 8 shows the mechanism of the amide bond formation. The Et3N deprotonates the acetic acid and the
negatively charged oxygen attacks the carbon atom of the carbodiimide of the EDC.HCl. Then the hydroxyl of
the HOBt attacks the ester intermediate, releasing a urea, and forming an activated HOBt-ester. Then the
amine can attack the carbonyl of the formed activated ester, releasing the good HOBt leaving group.
Subsequently, the hydroxyl groups of the resulting azido sugar (3+5) are acetylated by acetic anhydride and the
base pyridine.
Figure 9 shows the mechanism of the acetylation, which occurs on all 4 hydroxyls of the carbohydrates. The
pyridine attacks one of the carbonyls of the acetic anhydride to form an acetyl pyridine. Then the carbonyl of
the acetyl pyridine is attacked by the hydroxyl group of a sugar, the good pyridine leaving group is released.
The final products are acetylated N-azido galactosamine (4) and acetylated N-azido glucosamine (6).
9
Figure 8: Amide bond formation between azido acetic acid and an amino sugar with Et3N, EDC.HCl and HOBt. This mechanism accounts for synthesis of GalNAz (3), GlcNaz (4), GalNForm (17) and GlcNForm(21).
Figure 9: Acetylation mechanism of the hydroxyl groups of the sugars with pyridine and acetic anhydride. This mechanism accounts for all acetylation reaction done in this report.
The synthesis of the acetylated 6-azidofucose (7, acFucAz) involved the acetylation of commercially available 6-
azidofucose with acetic anhydride and the strong base pyridine, as is described in Figure 9. Additionally an
acetylated GlcNAc (1) was synthesized in the same manner. The acGlcNAc can later be used as a control in the
biological experiments.
2.1.2 Cyclopropene sugars
The method for synthesis of the cyclopropene sugars is slightly different then for the azide, the pathway is
shown in Figure 1020, 21, 41
. The precursor molecule (11) consists of three parts; the cyclopropene, a carbonate
and a good leaving group; paranitrophenol. The synthesis of the precursor started with the formation of the
cyclopropene via a rhodium-catalyzed cyclopropenation with ethyl diazoacetate (Figure 11). The ethyl
diazoacetate binds to the rhodium catalyst with a double bond, while nitrogen is released. Then TMS-propyne
reacts with the double bond in a [2+1] cycloaddition to form the cyclopropene ring42, 43
. The formation of the
cyclopropene is very slow, because of the unfavorable strain on the alkene in the three-membered ring. In
order to minimize side reactions, the ethyl diazoacetate has to be added very slowly (18 µmol/min) and the
reaction must be performed under argon, to prevent side reactions with water. The trimethylsilyl group is
present to prevent polymerisation and volatility of the product. Next, the ethyl acetate is reduced with DIBAL-H
to form a hydroxyl group. The intermediate 3-Hydroxymethyl-2-methyl-trimethylsilylcyclopropene (9) is
purified and its formation was proven by 1H-NMR (see Appendix figure 6). The yield over the first two steps was
still only 9%, however there was enough product to continue with the precursor synthesis. The TMS group is
removed with TBAF. The formed, very volatile, hydroxymethyl cyclopropene is reacted with p-nitrophenol
chloroformate to obtain the cyclopropene precursor (11). Successful formation of this product is easily
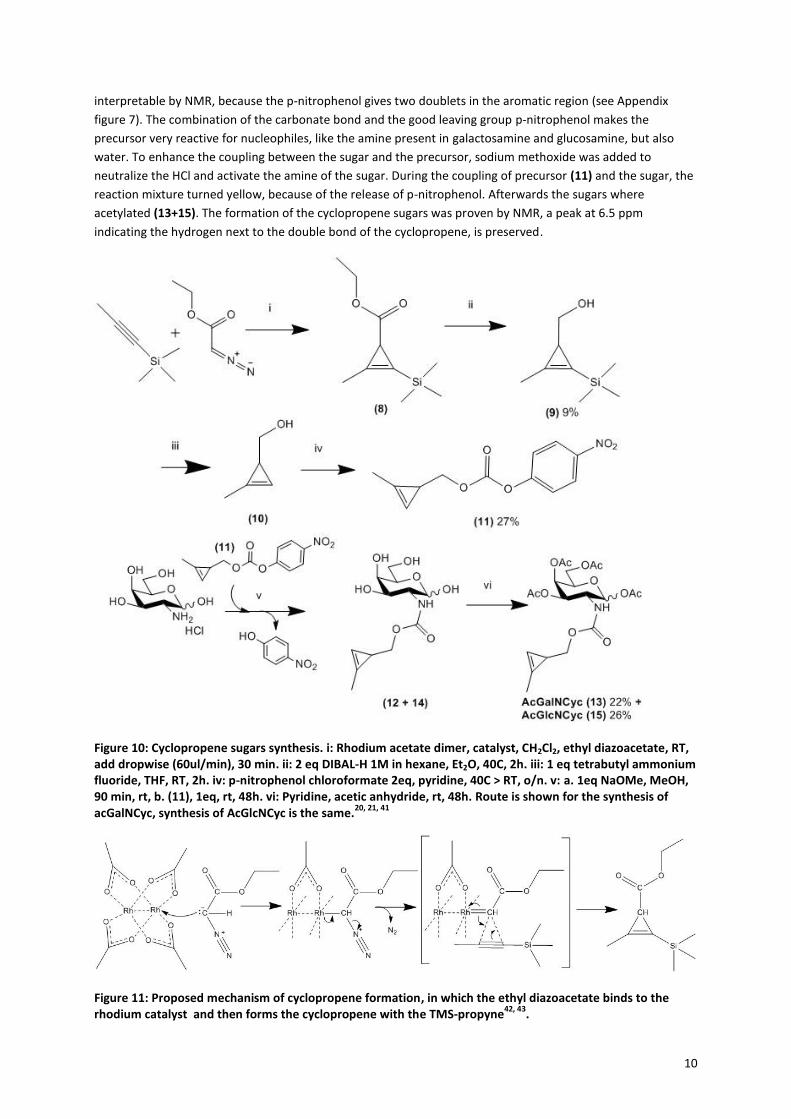
10
interpretable by NMR, because the p-nitrophenol gives two doublets in the aromatic region (see Appendix
figure 7). The combination of the carbonate bond and the good leaving group p-nitrophenol makes the
precursor very reactive for nucleophiles, like the amine present in galactosamine and glucosamine, but also
water. To enhance the coupling between the sugar and the precursor, sodium methoxide was added to
neutralize the HCl and activate the amine of the sugar. During the coupling of precursor (11) and the sugar, the
reaction mixture turned yellow, because of the release of p-nitrophenol. Afterwards the sugars where
acetylated (13+15). The formation of the cyclopropene sugars was proven by NMR, a peak at 6.5 ppm
indicating the hydrogen next to the double bond of the cyclopropene, is preserved.
Figure 10: Cyclopropene sugars synthesis. i: Rhodium acetate dimer, catalyst, CH2Cl2, ethyl diazoacetate, RT, add dropwise (60ul/min), 30 min. ii: 2 eq DIBAL-H 1M in hexane, Et2O, 40C, 2h. iii: 1 eq tetrabutyl ammonium fluoride, THF, RT, 2h. iv: p-nitrophenol chloroformate 2eq, pyridine, 40C > RT, o/n. v: a. 1eq NaOMe, MeOH, 90 min, rt, b. (11), 1eq, rt, 48h. vi: Pyridine, acetic anhydride, rt, 48h. Route is shown for the synthesis of acGalNCyc, synthesis of AcGlcNCyc is the same.
20, 21, 41
Figure 11: Proposed mechanism of cyclopropene formation, in which the ethyl diazoacetate binds to the rhodium catalyst and then forms the cyclopropene with the TMS-propyne
42, 43.
11
Overall the yields for this reaction are very low. In order to increase this yield more adjustments to the protocol
should be made, such as further decreasing the addition rate of the ethyl diazoacetate. However, it could be
that this reaction is just too prone to side-reaction, because of the reactivity of the cyclopropene and the
carbonate. Nevertheless, the amount of cyclopropene sugars that was synthesized will be sufficient to use in
the biological experiments.
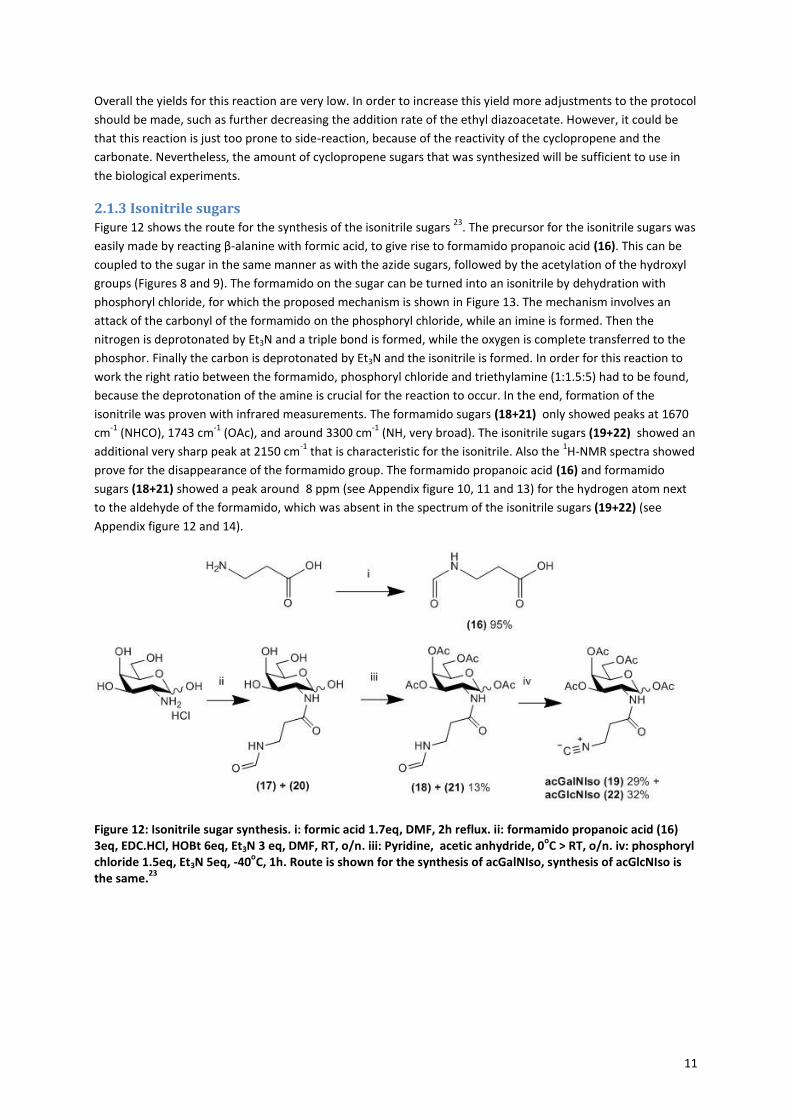
2.1.3 Isonitrile sugars Figure 12 shows the route for the synthesis of the isonitrile sugars
23. The precursor for the isonitrile sugars was
easily made by reacting β-alanine with formic acid, to give rise to formamido propanoic acid (16). This can be
coupled to the sugar in the same manner as with the azide sugars, followed by the acetylation of the hydroxyl
groups (Figures 8 and 9). The formamido on the sugar can be turned into an isonitrile by dehydration with
phosphoryl chloride, for which the proposed mechanism is shown in Figure 13. The mechanism involves an
attack of the carbonyl of the formamido on the phosphoryl chloride, while an imine is formed. Then the
nitrogen is deprotonated by Et3N and a triple bond is formed, while the oxygen is complete transferred to the
phosphor. Finally the carbon is deprotonated by Et3N and the isonitrile is formed. In order for this reaction to
work the right ratio between the formamido, phosphoryl chloride and triethylamine (1:1.5:5) had to be found,
because the deprotonation of the amine is crucial for the reaction to occur. In the end, formation of the
isonitrile was proven with infrared measurements. The formamido sugars (18+21) only showed peaks at 1670
cm-1
(NHCO), 1743 cm-1
(OAc), and around 3300 cm-1
(NH, very broad). The isonitrile sugars (19+22) showed an
additional very sharp peak at 2150 cm-1
that is characteristic for the isonitrile. Also the 1H-NMR spectra showed
prove for the disappearance of the formamido group. The formamido propanoic acid (16) and formamido
sugars (18+21) showed a peak around 8 ppm (see Appendix figure 10, 11 and 13) for the hydrogen atom next
to the aldehyde of the formamido, which was absent in the spectrum of the isonitrile sugars (19+22) (see
Appendix figure 12 and 14).
Figure 12: Isonitrile sugar synthesis. i: formic acid 1.7eq, DMF, 2h reflux. ii: formamido propanoic acid (16) 3eq, EDC.HCl, HOBt 6eq, Et3N 3 eq, DMF, RT, o/n. iii: Pyridine, acetic anhydride, 0
oC > RT, o/n. iv: phosphoryl
chloride 1.5eq, Et3N 5eq, -40oC, 1h. Route is shown for the synthesis of acGalNIso, synthesis of acGlcNIso is
the same.23
12
Figure 13: Proposed mechanism of isonitrile formation.
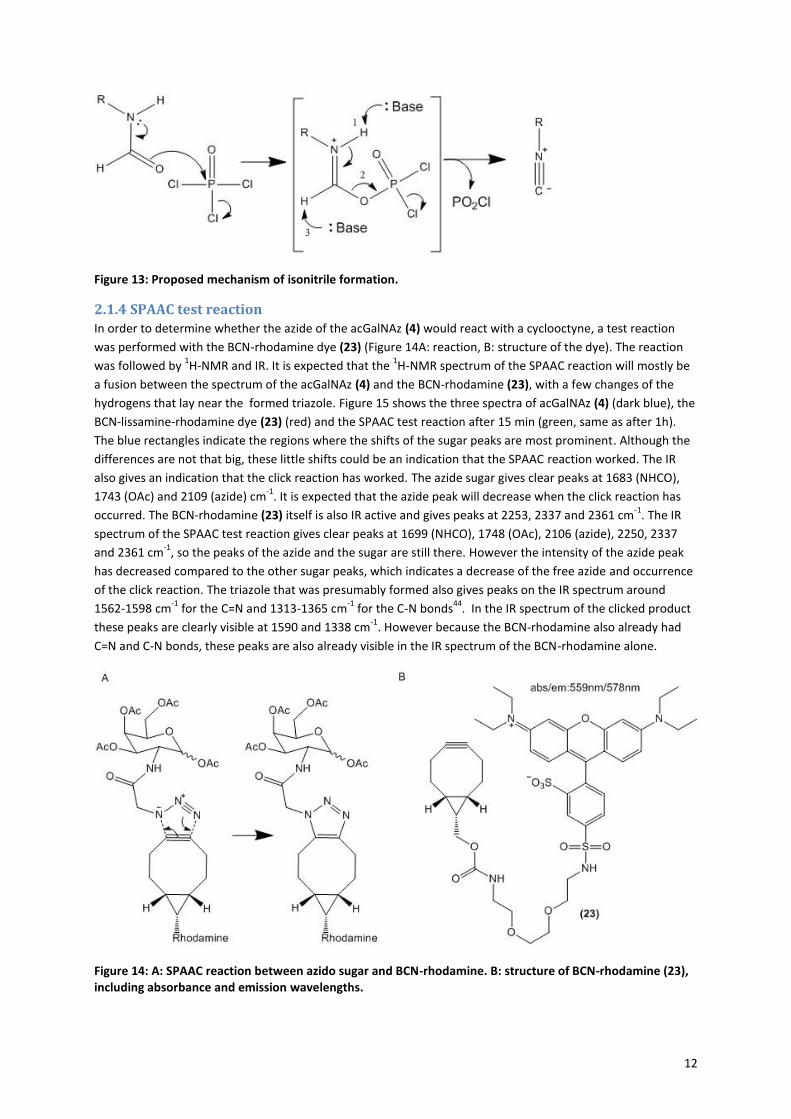
2.1.4 SPAAC test reaction In order to determine whether the azide of the acGalNAz (4) would react with a cyclooctyne, a test reaction
was performed with the BCN-rhodamine dye (23) (Figure 14A: reaction, B: structure of the dye). The reaction
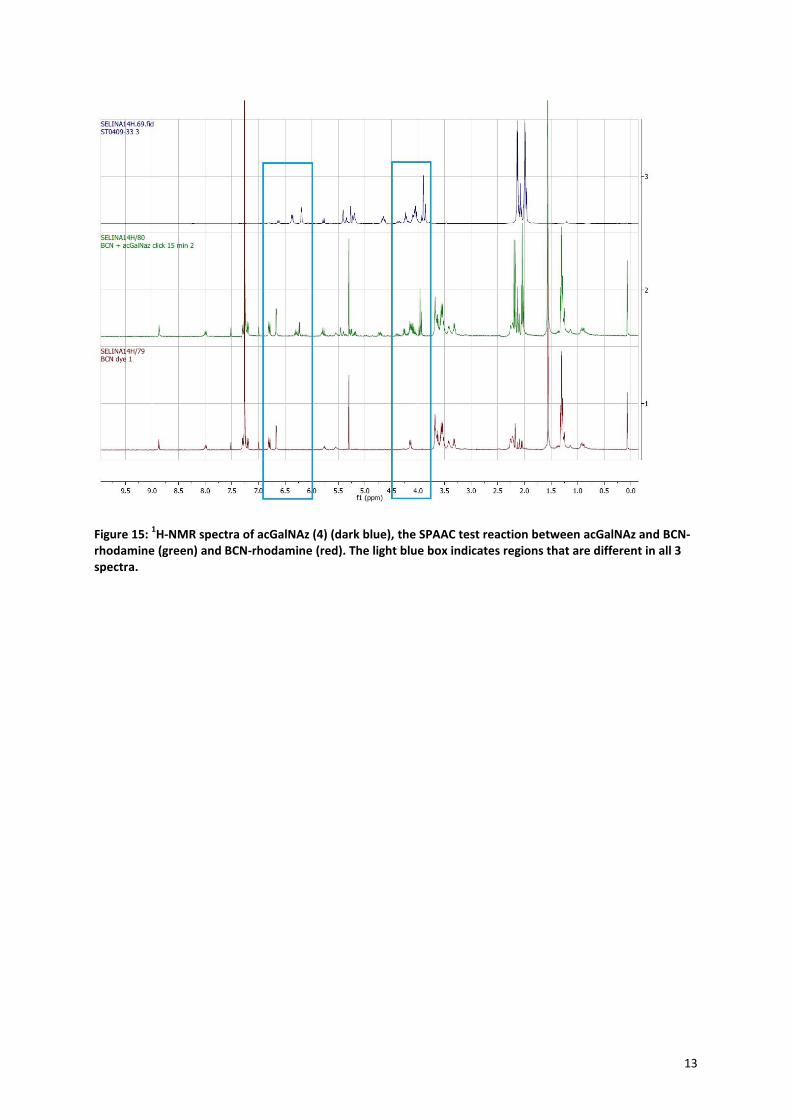
was followed by 1H-NMR and IR. It is expected that the
1H-NMR spectrum of the SPAAC reaction will mostly be
a fusion between the spectrum of the acGalNAz (4) and the BCN-rhodamine (23), with a few changes of the
hydrogens that lay near the formed triazole. Figure 15 shows the three spectra of acGalNAz (4) (dark blue), the
BCN-lissamine-rhodamine dye (23) (red) and the SPAAC test reaction after 15 min (green, same as after 1h).
The blue rectangles indicate the regions where the shifts of the sugar peaks are most prominent. Although the
differences are not that big, these little shifts could be an indication that the SPAAC reaction worked. The IR
also gives an indication that the click reaction has worked. The azide sugar gives clear peaks at 1683 (NHCO),
1743 (OAc) and 2109 (azide) cm-1
. It is expected that the azide peak will decrease when the click reaction has
occurred. The BCN-rhodamine (23) itself is also IR active and gives peaks at 2253, 2337 and 2361 cm-1
. The IR
spectrum of the SPAAC test reaction gives clear peaks at 1699 (NHCO), 1748 (OAc), 2106 (azide), 2250, 2337
and 2361 cm-1
, so the peaks of the azide and the sugar are still there. However the intensity of the azide peak
has decreased compared to the other sugar peaks, which indicates a decrease of the free azide and occurrence
of the click reaction. The triazole that was presumably formed also gives peaks on the IR spectrum around
1562-1598 cm-1
for the C=N and 1313-1365 cm-1
for the C-N bonds44
. In the IR spectrum of the clicked product
these peaks are clearly visible at 1590 and 1338 cm-1
. However because the BCN-rhodamine also already had
C=N and C-N bonds, these peaks are also already visible in the IR spectrum of the BCN-rhodamine alone.
Figure 14: A: SPAAC reaction between azido sugar and BCN-rhodamine. B: structure of BCN-rhodamine (23), including absorbance and emission wavelengths.
13
Figure 15: 1H-NMR spectra of acGalNAz (4) (dark blue), the SPAAC test reaction between acGalNAz and BCN-
rhodamine (green) and BCN-rhodamine (red). The light blue box indicates regions that are different in all 3 spectra.
14
2.2 Biological experiments
Once the complete library of functionalized carbohydrates was synthesized, the biological experiments could
be started in the bioprocess engineering (BPE) department. This part of the project was started with an azido
sugar because the SPAAC reaction is the best studied click reaction in biological systems. So it is the most
reliable method to start with, although the formation of the clicked product between BCN-rhodamine and the
azido sugar was not completely confirmed yet (section 2.1.4). Also, according to literature38
, the best way to
obtain an azide functionalized glucosamine in glycan structures, is by feeding acGalNAz to the antibody
producing CHO cells. So the initial tests to determine suitable concentrations and protocols were performed
with acGalNAz (4).
2.2.1 Growth analysis
To verify the results, the experiment was carried out in triplicate and 4 different variations of the FortiCHO
media were compared: a regular media control, a DMSO control (0.5%), low (50 µM) concentration acGalNAz
and high (1 mM) concentration acGalNAz. The DMSO control was to assess whether the addition of DMSO had
an influence on the behavior and growth of the CHO cells. DMSO is needed as a vehicle to keep the
functionalized sugar solubilized in the media 23, 38, 45
. The final concentration of DMSO used here was 0.5%,
which proved sufficient to keep the acGalNAz solubilized, but limited the negative effects on cell behavior. The
here used high concentration acGalNAz of 1 mM was derived from the paper of Okeley et al. in 2013, in which
they produced ADC’s with fucose derivatives. The low concentration acGalNAz of 50 µM was derived from
several papers in which fluorescent cell surface labeling was performed with several different functionalized
sugars23, 33, 38, 41
, but also in the paper of Rochefort et al. in 2013 in which they made an ADC with acManNAz26
.
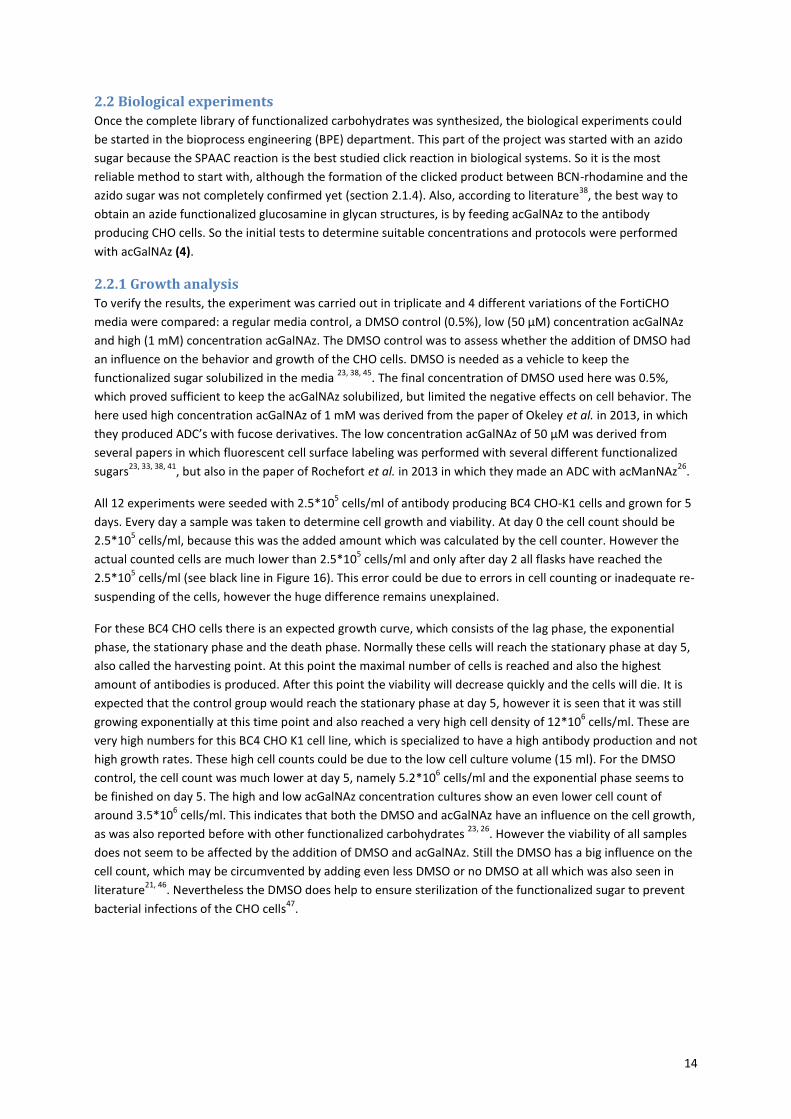
All 12 experiments were seeded with 2.5*105 cells/ml of antibody producing BC4 CHO-K1 cells and grown for 5
days. Every day a sample was taken to determine cell growth and viability. At day 0 the cell count should be
2.5*105 cells/ml, because this was the added amount which was calculated by the cell counter. However the
actual counted cells are much lower than 2.5*105 cells/ml and only after day 2 all flasks have reached the
2.5*105 cells/ml (see black line in Figure 16). This error could be due to errors in cell counting or inadequate re-
suspending of the cells, however the huge difference remains unexplained.
For these BC4 CHO cells there is an expected growth curve, which consists of the lag phase, the exponential
phase, the stationary phase and the death phase. Normally these cells will reach the stationary phase at day 5,
also called the harvesting point. At this point the maximal number of cells is reached and also the highest
amount of antibodies is produced. After this point the viability will decrease quickly and the cells will die. It is
expected that the control group would reach the stationary phase at day 5, however it is seen that it was still
growing exponentially at this time point and also reached a very high cell density of 12*106 cells/ml. These are
very high numbers for this BC4 CHO K1 cell line, which is specialized to have a high antibody production and not
high growth rates. These high cell counts could be due to the low cell culture volume (15 ml). For the DMSO
control, the cell count was much lower at day 5, namely 5.2*106 cells/ml and the exponential phase seems to
be finished on day 5. The high and low acGalNAz concentration cultures show an even lower cell count of
around 3.5*106 cells/ml. This indicates that both the DMSO and acGalNAz have an influence on the cell growth,
as was also reported before with other functionalized carbohydrates 23, 26
. However the viability of all samples
does not seem to be affected by the addition of DMSO and acGalNAz. Still the DMSO has a big influence on the
cell count, which may be circumvented by adding even less DMSO or no DMSO at all which was also seen in
literature21, 46
. Nevertheless the DMSO does help to ensure sterilization of the functionalized sugar to prevent
bacterial infections of the CHO cells47
.
15
Figure 16: Cell count and viability of the cell cultures in the 4 different media. Data points are averages of the 3 triplicates per medium type, error bars indicate the standard deviations per data point. Diamonds: control, squares: DMSO control, triangle: low acGalNAz conc., circle: high acGalNAz conc. and black line: 2.5E5 cells/ml limit. (On day 5 the cells are counted by the cell counter, on the other days the cells are counted manually by microscope)
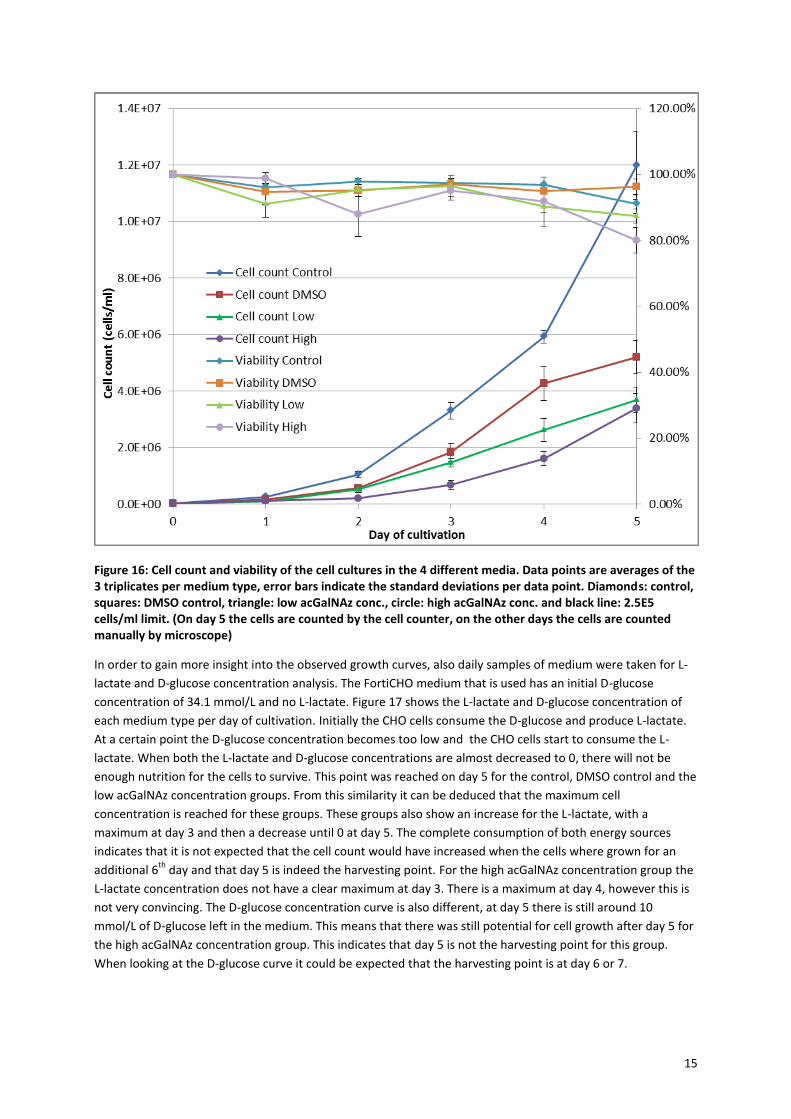
In order to gain more insight into the observed growth curves, also daily samples of medium were taken for L-
lactate and D-glucose concentration analysis. The FortiCHO medium that is used has an initial D-glucose
concentration of 34.1 mmol/L and no L-lactate. Figure 17 shows the L-lactate and D-glucose concentration of
each medium type per day of cultivation. Initially the CHO cells consume the D-glucose and produce L-lactate.
At a certain point the D-glucose concentration becomes too low and the CHO cells start to consume the L-
lactate. When both the L-lactate and D-glucose concentrations are almost decreased to 0, there will not be
enough nutrition for the cells to survive. This point was reached on day 5 for the control, DMSO control and the
low acGalNAz concentration groups. From this similarity it can be deduced that the maximum cell
concentration is reached for these groups. These groups also show an increase for the L-lactate, with a
maximum at day 3 and then a decrease until 0 at day 5. The complete consumption of both energy sources
indicates that it is not expected that the cell count would have increased when the cells where grown for an
additional 6th
day and that day 5 is indeed the harvesting point. For the high acGalNAz concentration group the
L-lactate concentration does not have a clear maximum at day 3. There is a maximum at day 4, however this is
not very convincing. The D-glucose concentration curve is also different, at day 5 there is still around 10
mmol/L of D-glucose left in the medium. This means that there was still potential for cell growth after day 5 for
the high acGalNAz concentration group. This indicates that day 5 is not the harvesting point for this group.
When looking at the D-glucose curve it could be expected that the harvesting point is at day 6 or 7.
16
So from these results it can be concluded that the addition of 0.5% DMSO and acGalNAz has an influence on
the cell count, but not on the viability of the CHO cells. The glucose consumption and lactate production is also
influenced when the high concentration of acGalNAz, which leads to growth retardation in these cell cultures.
Figure 17: Lactate and glucose concentrations in the 4 different media per day. Data points are averages of the 3 triplicates per medium type, error bars indicate the standard deviations per data point. Diamonds: control, squares: DMSO control, triangle: low acGalNAz conc., circle: high acGalNAz conc.
In order to determine the harvesting point of all 4 media types, the experiment would have to be repeated.
However the cell cultures will not be stopped at day 5, but will be stopped individually when the viability for
each cell culture clearly decreases and the glucose and lactate concentrations are at 0 mmol/L. Only when the
harvesting point is reached, the maximum amount of antibody will be produced.
17
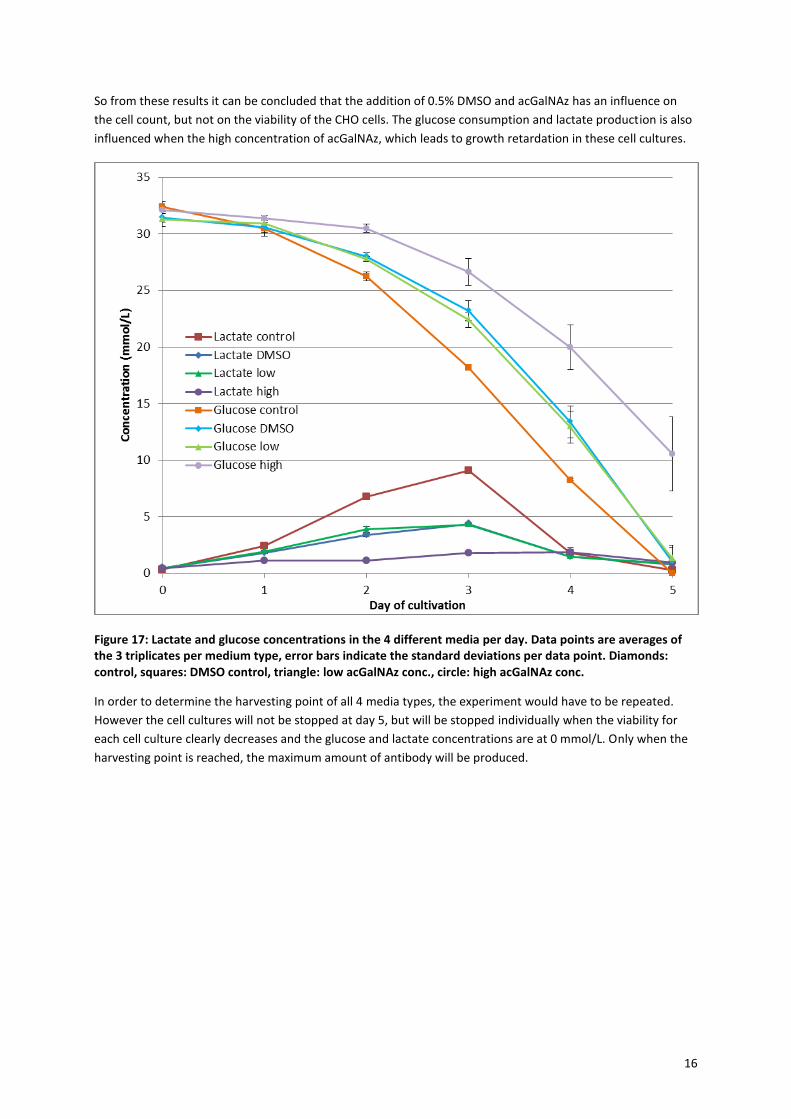
2.2.2 Microscopy
N-acetyl glucosamine is not only present in the N-glycan structure on antibodies, but also in other glycans and
glycoproteins of the CHO cell, therefore it is also interesting to investigate whether the cell surface glycans can
be fluorescently stained just as the group of Bertozzi did48
. By adding a dye that is linked to a reactive group
that can specifically react with the functionalized sugar, these glycans can be visualized using a fluorescent
microscope. In this case in which acGalNAz is used, the azide can react with a bicyclononyne (BCN) in a SPAAC
reaction. The dye that was used is a BCN-POE3-NH-lissamine rhodamine B conjugate (BCN-rhodamine, see
figure 14B).
Figure 18: Test experiment. Two cell cultures were inoculated with 0 mM (G-L) or 0.5 mM (A-F) acGalNAz in 0.5% DMSO for 2 days and then stained with 0 (E, F, K and L), 50 µM (C, D, I and J) and 100 µM (A, B, G and H) dye for 1 h at rt. Upper row: fluorescence, lower row: bright field through filter.
In order to test the conditions for the microscopic imaging, a test experiment was done with 0, 50 or 100 µM
dye on cells that where incubated with 0 or 0.5 mM acGalNAz (Figure 18). First of all it can be seen that as
expected the cells that have no fluorescent label added are not fluorescent (Figure 18E-F and K-L). This
indicates that the cells are not fluorescent by themselves with this filter (excitation: 530-550 nm and emission:
575-625 nm) and will not give background signal to the fluorescence of the rhodamine. The samples with
acGalNAz and BCN-rhodamine added (A-D) show fluorescence all over the cell’s surface and a very bright spot
at one side of the cell. Also there is not much difference in fluorescence visible between the two
concentrations of dye, which indicates that the ratio between the amount of cells and the dye does not matter
at these amount. For the samples incubated without acGalNAz it would be expected that there is no
18
fluorescence visible even when the dye is added, because the BCN should only react with incorporated azides
and not with the bare cell’s surface. However both the samples with 50 and 100 µM of dye (G-J) showed some
fluorescence, which indicates that the hydrophobic BCN-rhodamine aspecifically sticks to the cell surface
membrane. However the cells with acGalNAz still show more staining then the control, which indicates that the
azides of the acGalNAz may have been incorporated into the glycocalyx and have reacted with the BCN-
rhodamine. Nevertheless, the non-specific background staining must be taken into account in the following
experiments.
During the acGalNAz experiment described before in section 2.2.1, one sample of each medium type was taken
on day 2 and day 4 of cultivation. All samples were treated as described in the experimental section 5.2 with
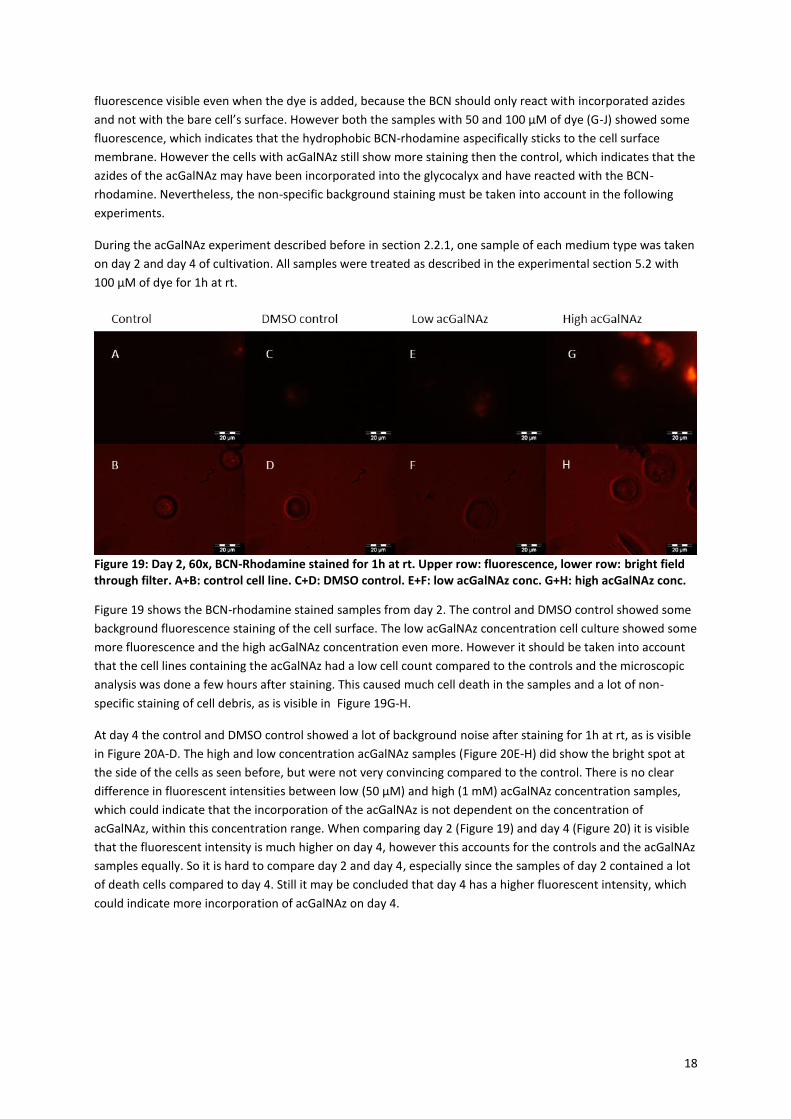
100 µM of dye for 1h at rt.
Figure 19: Day 2, 60x, BCN-Rhodamine stained for 1h at rt. Upper row: fluorescence, lower row: bright field through filter. A+B: control cell line. C+D: DMSO control. E+F: low acGalNAz conc. G+H: high acGalNAz conc.
Figure 19 shows the BCN-rhodamine stained samples from day 2. The control and DMSO control showed some
background fluorescence staining of the cell surface. The low acGalNAz concentration cell culture showed some
more fluorescence and the high acGalNAz concentration even more. However it should be taken into account
that the cell lines containing the acGalNAz had a low cell count compared to the controls and the microscopic
analysis was done a few hours after staining. This caused much cell death in the samples and a lot of non-
specific staining of cell debris, as is visible in Figure 19G-H.
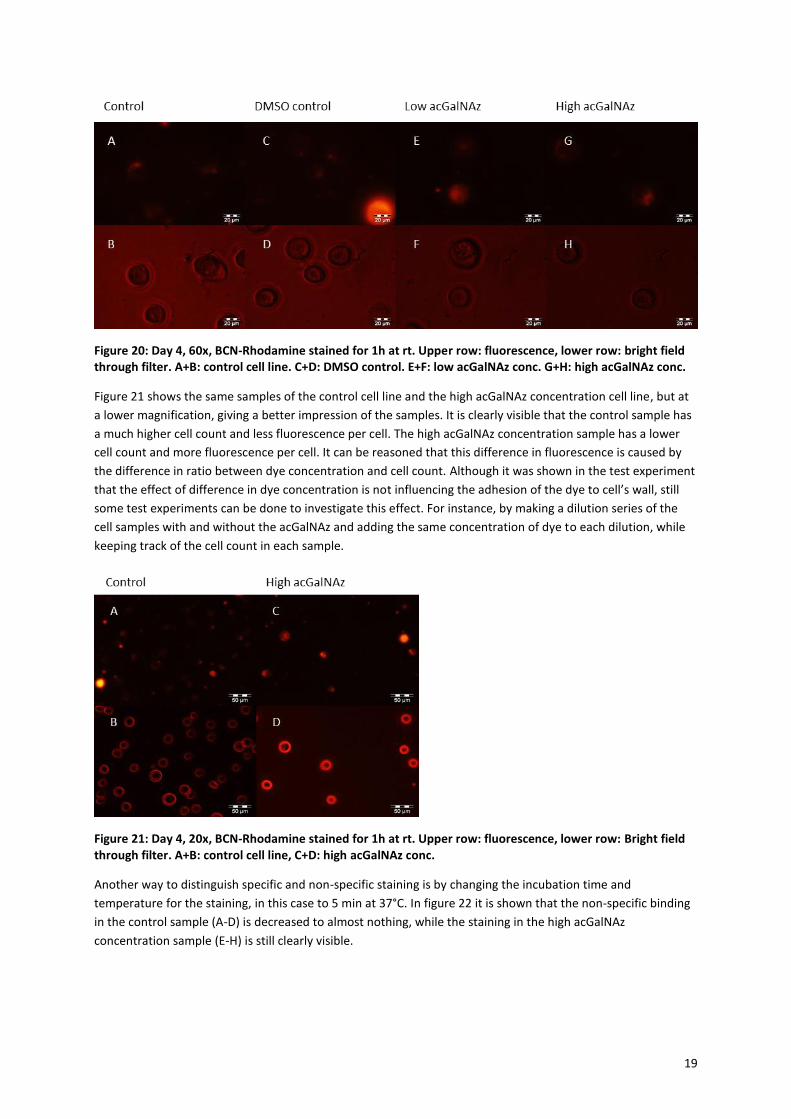
At day 4 the control and DMSO control showed a lot of background noise after staining for 1h at rt, as is visible
in Figure 20A-D. The high and low concentration acGalNAz samples (Figure 20E-H) did show the bright spot at
the side of the cells as seen before, but were not very convincing compared to the control. There is no clear
difference in fluorescent intensities between low (50 µM) and high (1 mM) acGalNAz concentration samples,
which could indicate that the incorporation of the acGalNAz is not dependent on the concentration of
acGalNAz, within this concentration range. When comparing day 2 (Figure 19) and day 4 (Figure 20) it is visible
that the fluorescent intensity is much higher on day 4, however this accounts for the controls and the acGalNAz
samples equally. So it is hard to compare day 2 and day 4, especially since the samples of day 2 contained a lot
of death cells compared to day 4. Still it may be concluded that day 4 has a higher fluorescent intensity, which
could indicate more incorporation of acGalNAz on day 4.
19
Figure 20: Day 4, 60x, BCN-Rhodamine stained for 1h at rt. Upper row: fluorescence, lower row: bright field through filter. A+B: control cell line. C+D: DMSO control. E+F: low acGalNAz conc. G+H: high acGalNAz conc.
Figure 21 shows the same samples of the control cell line and the high acGalNAz concentration cell line, but at
a lower magnification, giving a better impression of the samples. It is clearly visible that the control sample has
a much higher cell count and less fluorescence per cell. The high acGalNAz concentration sample has a lower
cell count and more fluorescence per cell. It can be reasoned that this difference in fluorescence is caused by
the difference in ratio between dye concentration and cell count. Although it was shown in the test experiment
that the effect of difference in dye concentration is not influencing the adhesion of the dye to cell’s wall, still
some test experiments can be done to investigate this effect. For instance, by making a dilution series of the
cell samples with and without the acGalNAz and adding the same concentration of dye to each dilution, while
keeping track of the cell count in each sample.
Figure 21: Day 4, 20x, BCN-Rhodamine stained for 1h at rt. Upper row: fluorescence, lower row: Bright field through filter. A+B: control cell line, C+D: high acGalNAz conc.
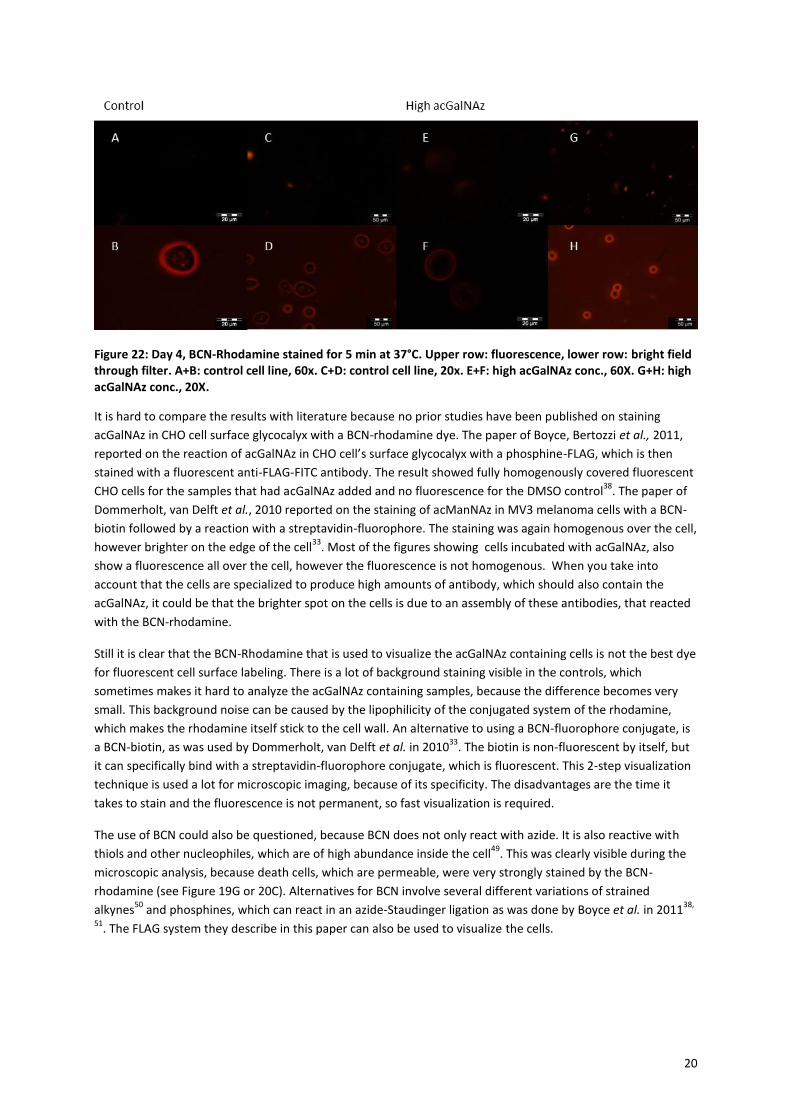
Another way to distinguish specific and non-specific staining is by changing the incubation time and
temperature for the staining, in this case to 5 min at 37°C. In figure 22 it is shown that the non-specific binding
in the control sample (A-D) is decreased to almost nothing, while the staining in the high acGalNAz
concentration sample (E-H) is still clearly visible.
20
Figure 22: Day 4, BCN-Rhodamine stained for 5 min at 37°C. Upper row: fluorescence, lower row: bright field through filter. A+B: control cell line, 60x. C+D: control cell line, 20x. E+F: high acGalNAz conc., 60X. G+H: high acGalNAz conc., 20X.
It is hard to compare the results with literature because no prior studies have been published on staining
acGalNAz in CHO cell surface glycocalyx with a BCN-rhodamine dye. The paper of Boyce, Bertozzi et al., 2011,
reported on the reaction of acGalNAz in CHO cell’s surface glycocalyx with a phosphine-FLAG, which is then
stained with a fluorescent anti-FLAG-FITC antibody. The result showed fully homogenously covered fluorescent
CHO cells for the samples that had acGalNAz added and no fluorescence for the DMSO control38
. The paper of
Dommerholt, van Delft et al., 2010 reported on the staining of acManNAz in MV3 melanoma cells with a BCN-
biotin followed by a reaction with a streptavidin-fluorophore. The staining was again homogenous over the cell,
however brighter on the edge of the cell33
. Most of the figures showing cells incubated with acGalNAz, also
show a fluorescence all over the cell, however the fluorescence is not homogenous. When you take into
account that the cells are specialized to produce high amounts of antibody, which should also contain the
acGalNAz, it could be that the brighter spot on the cells is due to an assembly of these antibodies, that reacted
with the BCN-rhodamine.
Still it is clear that the BCN-Rhodamine that is used to visualize the acGalNAz containing cells is not the best dye
for fluorescent cell surface labeling. There is a lot of background staining visible in the controls, which
sometimes makes it hard to analyze the acGalNAz containing samples, because the difference becomes very
small. This background noise can be caused by the lipophilicity of the conjugated system of the rhodamine,
which makes the rhodamine itself stick to the cell wall. An alternative to using a BCN-fluorophore conjugate, is
a BCN-biotin, as was used by Dommerholt, van Delft et al. in 201033
. The biotin is non-fluorescent by itself, but
it can specifically bind with a streptavidin-fluorophore conjugate, which is fluorescent. This 2-step visualization
technique is used a lot for microscopic imaging, because of its specificity. The disadvantages are the time it
takes to stain and the fluorescence is not permanent, so fast visualization is required.
The use of BCN could also be questioned, because BCN does not only react with azide. It is also reactive with
thiols and other nucleophiles, which are of high abundance inside the cell49
. This was clearly visible during the
microscopic analysis, because death cells, which are permeable, were very strongly stained by the BCN-
rhodamine (see Figure 19G or 20C). Alternatives for BCN involve several different variations of strained
alkynes50
and phosphines, which can react in an azide-Staudinger ligation as was done by Boyce et al. in 201138,
51. The FLAG system they describe in this paper can also be used to visualize the cells.
21
2.3 Antibody purification and analysis
The difference in fluorescence with the cell surface labeling between the controls and the acGalNAz samples,
does give a positive indication towards the incorporation of the acGalNAz in the cell’s glycan structures. When
the acGalNAz is incorporated into the cell surface glycan structures, they could also be incorporated in the N-
glycan structures of the antibodies. So on day 5 after cultivation, the antibodies of all 12 cell cultures were
harvested. In order to perform a good analysis of the N-glycan structures present on the antibodies, the
antibodies are purified with an AKTA purification system. Then the antibodies were stained with BCN-
rhodamine and analyzed with SDS-PAGE, in order to see whether the acGalNAz was incorporated into the N-
glycan of the antibody. Additionally, the influence of the acGalNAz on the composition of the N-glycan
structures can be investigated. The N-glycan structures can be cleaved from the antibody with the enzyme
PNGase and the resulting pool of N-glycan structures can be analyzed with UPLC.
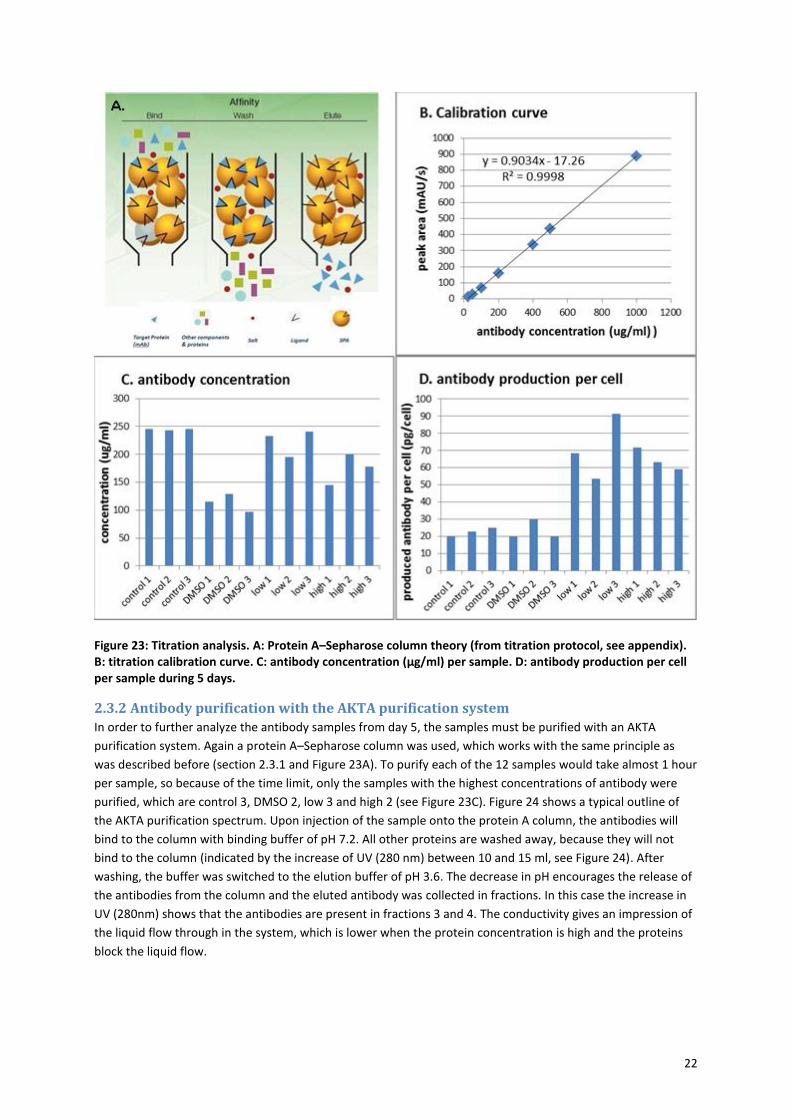
2.3.1 Titration analysis
However before continuing with the purification and analysis of the antibodies, the antibody concentrations
were determined. This was necessary, because the low growth rate for the high and low acGalNAz
concentration samples could also indicate low antibody production. The analysis was performed with the UPLC,
making use of a protein A–Sepharose column. The protein A–Sepharose column specifically binds IgG
antibodies. The sample is brought onto the column at pH 7-8, the antibodies stick to the protein A-Sepharose
beads in the column and the rest of the proteins is washed away. The antibodies are released when the pH is
lowered to 2-3 (Figure 23A). Proteins can be detected by UV at 280 nm. So the release of the antibodies is
visible as a peak at a specific time point on the UV spectrum. The area of this peak is dependent on the
antibody concentration in the sample. In order to determine the right ratio of peak area versus IgG antibody
concentration, a calibration measurement was performed with several different IgG concentration.
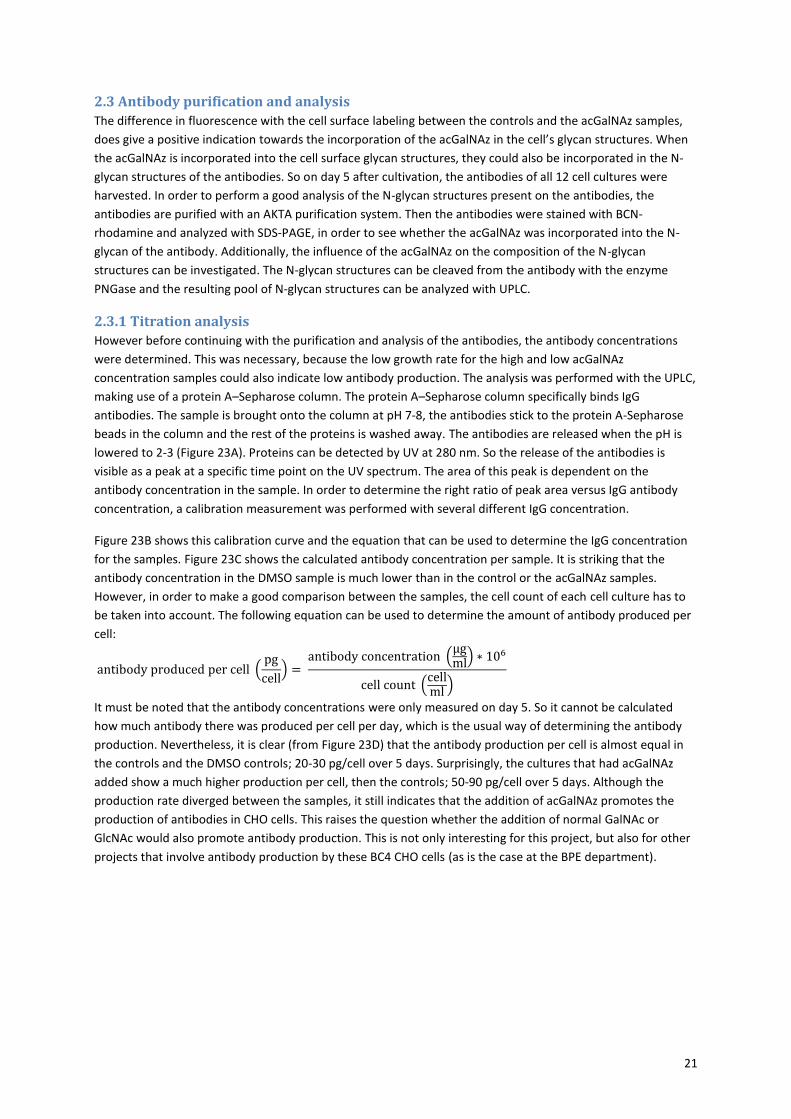
Figure 23B shows this calibration curve and the equation that can be used to determine the IgG concentration
for the samples. Figure 23C shows the calculated antibody concentration per sample. It is striking that the
antibody concentration in the DMSO sample is much lower than in the control or the acGalNAz samples.
However, in order to make a good comparison between the samples, the cell count of each cell culture has to
be taken into account. The following equation can be used to determine the amount of antibody produced per
cell:
antibody produced per cell (pg
cell) =
antibody concentration (μgml
) ∗ 106
cell count (cellml
)
It must be noted that the antibody concentrations were only measured on day 5. So it cannot be calculated
how much antibody there was produced per cell per day, which is the usual way of determining the antibody
production. Nevertheless, it is clear (from Figure 23D) that the antibody production per cell is almost equal in
the controls and the DMSO controls; 20-30 pg/cell over 5 days. Surprisingly, the cultures that had acGalNAz
added show a much higher production per cell, then the controls; 50-90 pg/cell over 5 days. Although the
production rate diverged between the samples, it still indicates that the addition of acGalNAz promotes the
production of antibodies in CHO cells. This raises the question whether the addition of normal GalNAc or
GlcNAc would also promote antibody production. This is not only interesting for this project, but also for other
projects that involve antibody production by these BC4 CHO cells (as is the case at the BPE department).
22
Figure 23: Titration analysis. A: Protein A–Sepharose column theory (from titration protocol, see appendix). B: titration calibration curve. C: antibody concentration (µg/ml) per sample. D: antibody production per cell per sample during 5 days.
2.3.2 Antibody purification with the AKTA purification system In order to further analyze the antibody samples from day 5, the samples must be purified with an AKTA
purification system. Again a protein A–Sepharose column was used, which works with the same principle as
was described before (section 2.3.1 and Figure 23A). To purify each of the 12 samples would take almost 1 hour
per sample, so because of the time limit, only the samples with the highest concentrations of antibody were
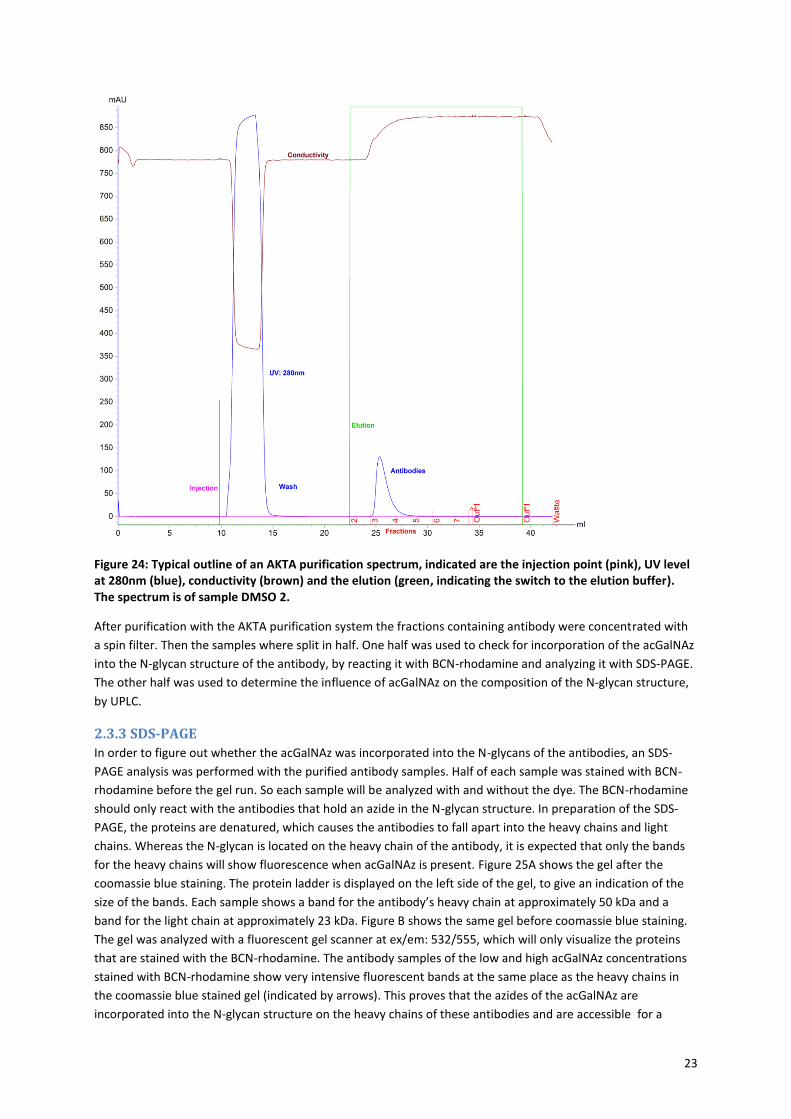
purified, which are control 3, DMSO 2, low 3 and high 2 (see Figure 23C). Figure 24 shows a typical outline of
the AKTA purification spectrum. Upon injection of the sample onto the protein A column, the antibodies will
bind to the column with binding buffer of pH 7.2. All other proteins are washed away, because they will not
bind to the column (indicated by the increase of UV (280 nm) between 10 and 15 ml, see Figure 24). After
washing, the buffer was switched to the elution buffer of pH 3.6. The decrease in pH encourages the release of
the antibodies from the column and the eluted antibody was collected in fractions. In this case the increase in
UV (280nm) shows that the antibodies are present in fractions 3 and 4. The conductivity gives an impression of
the liquid flow through in the system, which is lower when the protein concentration is high and the proteins
block the liquid flow.
23
Figure 24: Typical outline of an AKTA purification spectrum, indicated are the injection point (pink), UV level at 280nm (blue), conductivity (brown) and the elution (green, indicating the switch to the elution buffer). The spectrum is of sample DMSO 2.
After purification with the AKTA purification system the fractions containing antibody were concentrated with
a spin filter. Then the samples where split in half. One half was used to check for incorporation of the acGalNAz
into the N-glycan structure of the antibody, by reacting it with BCN-rhodamine and analyzing it with SDS-PAGE.
The other half was used to determine the influence of acGalNAz on the composition of the N-glycan structure,
by UPLC.
2.3.3 SDS-PAGE
In order to figure out whether the acGalNAz was incorporated into the N-glycans of the antibodies, an SDS-
PAGE analysis was performed with the purified antibody samples. Half of each sample was stained with BCN-
rhodamine before the gel run. So each sample will be analyzed with and without the dye. The BCN-rhodamine
should only react with the antibodies that hold an azide in the N-glycan structure. In preparation of the SDS-
PAGE, the proteins are denatured, which causes the antibodies to fall apart into the heavy chains and light
chains. Whereas the N-glycan is located on the heavy chain of the antibody, it is expected that only the bands
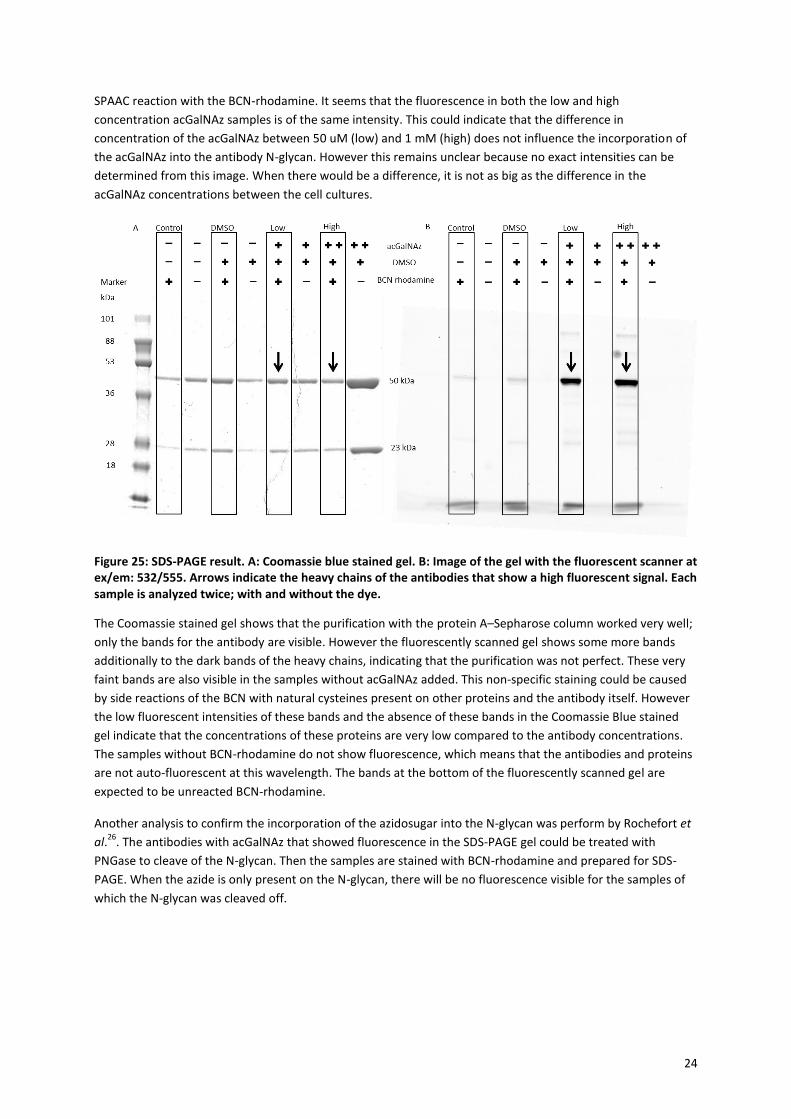
for the heavy chains will show fluorescence when acGalNAz is present. Figure 25A shows the gel after the
coomassie blue staining. The protein ladder is displayed on the left side of the gel, to give an indication of the
size of the bands. Each sample shows a band for the antibody’s heavy chain at approximately 50 kDa and a
band for the light chain at approximately 23 kDa. Figure B shows the same gel before coomassie blue staining.
The gel was analyzed with a fluorescent gel scanner at ex/em: 532/555, which will only visualize the proteins
that are stained with the BCN-rhodamine. The antibody samples of the low and high acGalNAz concentrations
stained with BCN-rhodamine show very intensive fluorescent bands at the same place as the heavy chains in
the coomassie blue stained gel (indicated by arrows). This proves that the azides of the acGalNAz are
incorporated into the N-glycan structure on the heavy chains of these antibodies and are accessible for a
24
SPAAC reaction with the BCN-rhodamine. It seems that the fluorescence in both the low and high
concentration acGalNAz samples is of the same intensity. This could indicate that the difference in
concentration of the acGalNAz between 50 uM (low) and 1 mM (high) does not influence the incorporation of
the acGalNAz into the antibody N-glycan. However this remains unclear because no exact intensities can be
determined from this image. When there would be a difference, it is not as big as the difference in the
acGalNAz concentrations between the cell cultures.
Figure 25: SDS-PAGE result. A: Coomassie blue stained gel. B: Image of the gel with the fluorescent scanner at ex/em: 532/555. Arrows indicate the heavy chains of the antibodies that show a high fluorescent signal. Each sample is analyzed twice; with and without the dye.
The Coomassie stained gel shows that the purification with the protein A–Sepharose column worked very well;
only the bands for the antibody are visible. However the fluorescently scanned gel shows some more bands
additionally to the dark bands of the heavy chains, indicating that the purification was not perfect. These very
faint bands are also visible in the samples without acGalNAz added. This non-specific staining could be caused
by side reactions of the BCN with natural cysteines present on other proteins and the antibody itself. However
the low fluorescent intensities of these bands and the absence of these bands in the Coomassie Blue stained
gel indicate that the concentrations of these proteins are very low compared to the antibody concentrations.
The samples without BCN-rhodamine do not show fluorescence, which means that the antibodies and proteins
are not auto-fluorescent at this wavelength. The bands at the bottom of the fluorescently scanned gel are
expected to be unreacted BCN-rhodamine.
Another analysis to confirm the incorporation of the azidosugar into the N-glycan was perform by Rochefort et
al.26
. The antibodies with acGalNAz that showed fluorescence in the SDS-PAGE gel could be treated with
PNGase to cleave of the N-glycan. Then the samples are stained with BCN-rhodamine and prepared for SDS-
PAGE. When the azide is only present on the N-glycan, there will be no fluorescence visible for the samples of
which the N-glycan was cleaved off.
25
2.3.4 HILIC-UPLC analysis on N-glycans
In order to determine the composition of the N-glycans present on the antibodies, HILIC-UPLC analysis can be
performed. Ultra Performance Liquid Chromatography (UPLC) is a method that resembles HPLC, with the only
difference that it can handle higher pressures and smaller porous packing material in the separation column.
This results in more effective separation of the injected mixtures compared to HPLC and thus a better
distinguishing between the different components52
. Hydrophilic interaction chromatography (HILIC) is a
chromatography method that is especially suited for the separation of very hydrophilic compounds, such as
glycan structures. The ratio between the aqueous eluent, ammonium formate, and the organic eluent,
acetonitrile, can influence the hydrophilic interactions between the stationary phase and the hydrophilic
compounds in the mixture, in this case different glycan structures. The ionic interaction of the ammonium salts
in the aqueous eluent with the stationary phase will prevent interaction of the glycans with the stationary
phase, which forces the glycans into the mobile phase. Whereas the decrease of aqueous eluent will increase
the hydrophilic interactions of the glycans with the stationary phase. The ratio of aqueous and organic eluent
and the hydrophilicity of the glycan will determine the retention time of each glycan structure53
. By using an
eluent gradient by which the aqueous eluent increases and the organic eluent decreases, the retention times
can be shortened, resulting in a decreased duration of the total analysis. Another advantage of the eluent
gradient is that it will give sharper peaks on your spectrum and thus a better distinction between the peaks.
The column that will be used, is the Acquity UPLC BEH (ethylene bridged hybrid) Glycan column with a particle
size of 1.7 μm (from Waters), which is specifically constructed for glycan separation.
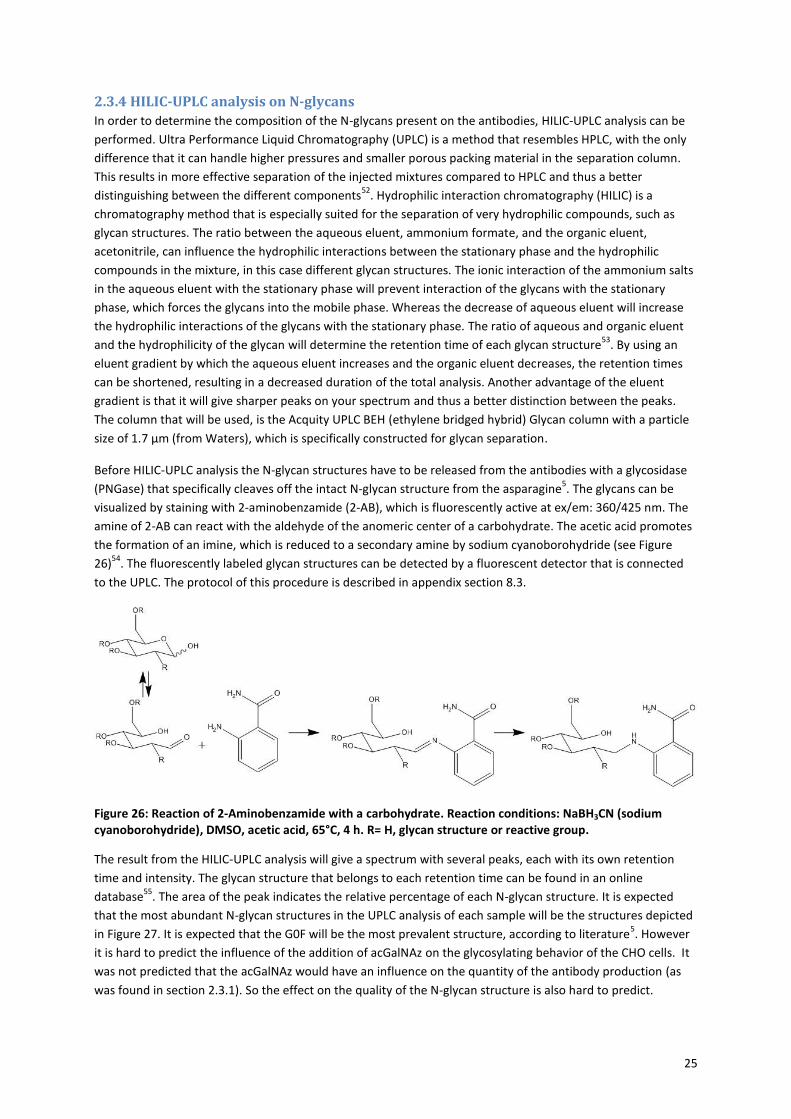
Before HILIC-UPLC analysis the N-glycan structures have to be released from the antibodies with a glycosidase
(PNGase) that specifically cleaves off the intact N-glycan structure from the asparagine5. The glycans can be
visualized by staining with 2-aminobenzamide (2-AB), which is fluorescently active at ex/em: 360/425 nm. The
amine of 2-AB can react with the aldehyde of the anomeric center of a carbohydrate. The acetic acid promotes
the formation of an imine, which is reduced to a secondary amine by sodium cyanoborohydride (see Figure
26)54
. The fluorescently labeled glycan structures can be detected by a fluorescent detector that is connected
to the UPLC. The protocol of this procedure is described in appendix section 8.3.
Figure 26: Reaction of 2-Aminobenzamide with a carbohydrate. Reaction conditions: NaBH3CN (sodium cyanoborohydride), DMSO, acetic acid, 65°C, 4 h. R= H, glycan structure or reactive group.
The result from the HILIC-UPLC analysis will give a spectrum with several peaks, each with its own retention
time and intensity. The glycan structure that belongs to each retention time can be found in an online
database55
. The area of the peak indicates the relative percentage of each N-glycan structure. It is expected
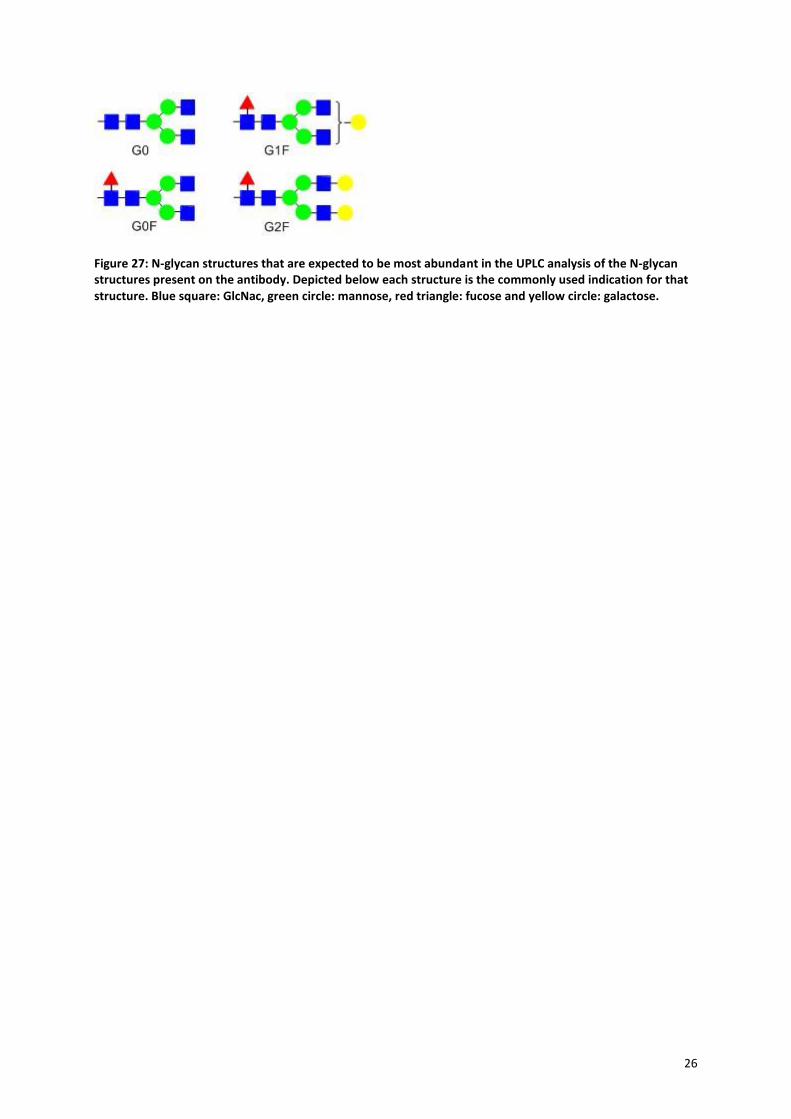
that the most abundant N-glycan structures in the UPLC analysis of each sample will be the structures depicted
in Figure 27. It is expected that the G0F will be the most prevalent structure, according to literature5. However
it is hard to predict the influence of the addition of acGalNAz on the glycosylating behavior of the CHO cells. It
was not predicted that the acGalNAz would have an influence on the quantity of the antibody production (as
was found in section 2.3.1). So the effect on the quality of the N-glycan structure is also hard to predict.
26
Figure 27: N-glycan structures that are expected to be most abundant in the UPLC analysis of the N-glycan structures present on the antibody. Depicted below each structure is the commonly used indication for that structure. Blue square: GlcNac, green circle: mannose, red triangle: fucose and yellow circle: galactose.
27
3. Conclusion This section will summarize the methods, results and conclusions that were obtained during this project. In
order to explore the possibilities of constructing ADC’s with MOE, a library of functionalized carbohydrates was
synthesized. Subsequently, the most promising derivative according to literature, acGalNAz, was fed to
antibody producing CHO cells. The incorporation of the acGalNAz into the cell’s glycocalyx was tested by
staining live cells with a fluorescent BCN-rhodamine and analyzing them with fluorescent microscopy. The
incorporation of the acGalNAz into the antibody’s N-glycan structure was tested by staining with a fluorescent
BCN-rhodamine and analyzed with SDS-PAGE, visualized by a fluorescent gel scanner. Additionally the N-glycan
structures can be analyzed by UPLC, to determine the effect of the addition of acGalNAz on the composition of
the N-glycans.
3.1 Chemical synthesis All proposed functionalized carbohydrates were synthesized according to protocols found in literature. All
functionalized carbohydrates were acetylated to improve uptake into the CHO cells. acGlcNAc (1), acGalNAz
(4), acGlcNAz (6) and acFucAz (7) were synthesized according to literature39, 40
and did not provide any
difficulties. The synthesis of the acGalNCyc (13) and acGlcNCyc (15)20, 21, 41
did provide difficulties, especially
involving the formation of the strained cyclopropene. By decreasing the addition rate of the ethyl diazoacetate
to the TMS-propyne and rhodium catalyst until 18 µmol/min, the yield of the cyclopropene formation was high
enough to continue the synthesis of the precursor. However there is still room for improvement in this
reaction, whereas the final yields and amounts of the acGalNCyc (13) and acGlcNCyc (15) were still very low.
The synthesis of the acGalNIso (19) and acGlcNIso (22)23
only gave some problems in the isonitrile formation. In
the end the right ratio between the formamido, phosphoryl chloride and triethylamine (1:1.5:5) was found in
order to produce an isonitrile, that was visualized with IR.
Whereas the acGalNAz (4) was further used in the biological experiments, a click test reaction with BCN-
rhodamine was done. Although the results proved inconclusive, later results with SDS-PAGE analysis of labeled
antibodies proved the reaction does work, as expected.
3.2 Biological experiments
acGalNAz (4) was fed to antibody producing CHO cells. In order to verify the results 4 different media were
prepared: normal control, 0.5% DMSO control, low acGalNAz concentration (50 µM in 0.5% DMSO) and high
acGalNAz concentration (1 mM in 0.5% DMSO). All media types were done in triplet, inoculated with the same
amount of cells and grown over 5 days. The cell count, viability, lactate concentration and glucose
concentration where determined daily for all cell cultures. The viability was stable (80%-100%) for all samples
during the 5 days. Nevertheless the addition of DMSO and acGalNAz did have an effect on the cell count,
whereas the normal control had an average final cell count that was more than twice as high (12 million
cells/ml) as for the other cell cultures (3 to 5 million cells/ml). The glucose concentrations at day 5 showed that
the cell growth of the high acGalNAz concentration cell cultures was not finished yet, whereas for the other
cultures it was. So it can be concluded that the addition of DMSO and acGalNAz in the media of CHO cells
decreases the cell count and retards the growth rate of the cell culture.
On day 2 and 4 after cultivation samples were taken from each media type to stain for fluorescent imaging. It
was expected that only the cell cultures that contained acGalNAz could be fluorescently stained with BCN-
rhodamine. However the fluorescent microscope also detected fluorescent background staining in the control
and DMSO control. Nevertheless, the low and high acGalNAz concentration samples showed a higher intensity
of fluorescent staining, which points towards specific staining with BCN-Rhodamine. Although it cannot yet be
confirmed that acGalNAz was actually incorporated into the cell’s glycocalyx, it can be concluded that the
acGalNAz does increase staining of the surface of the CHO cells with BCN-rhodamine. Interestingly, there was
no difference in intensity visible between the high and low acGalNAz concentration samples, which could mean
that the limit of incorporation was already reached with 50 µM or that the BCN-Rhodamine is not suitable to
28
visualize this difference. When comparing the samples of day 2 and day 4 it may be concluded that there was
more incorporation at day 4, however no firm statements can be made because of the high background
staining.
3.3 Antibody purification and analysis
In order to control the antibody production, the antibody concentration of each cell culture was determined at
day 5 with a protein A-sepharose column on a UPLC. The normal control and DMSO control had an antibody
production of 20-30 pg/cell over 5 days. The low and high acGalNAz concentration samples had an antibody
production of 50-90 pg/cell over 5 days. So although the antibody production in the samples with acGalNAz
was less stable, there was a significant increase in antibody production compared to the controls. This may
indicate that the addition of a donor sugar for the antibody N-glycan structure, promotes the antibody
production.
On day 5 the antibodies from each cell culture were harvested and purified with a protein A-Sepharose column
on an AKTA purification system. The purified antibodies were stained with BCN-rhodamine and analyzed with
SDS-PAGE. The Coomassie Blue stained gel showed a band for the antibody’s heavy chain at 50 kDa and a band
for the antibody’s light chain at 23 kDa for every sample. The same gel was visualized with a fluorescent gel
scanner. It is visible that only the antibody’s heavy chains of the samples of the low and high acGalNAz
concentration cell cultures have an high and equal intensity of fluorescence. This indicates that the acGalNAz is
incorporated into the N-glycan structure of the antibody and that it is still available for reacting with the BCN-
rhodamine. So it can be concluded that Metabolic Oligosaccharide Engineering with acGalNAz on antibody N-
glycans may be a suitable method for an antibody-drug conjugation with a BCN-functionalized drug.
There are no results for the UPLC analysis yet, so also no conclusion can be drawn. However it can be expected
that the addition of acGaNAz has an effect on the N-glycan composition, whereas there was also an effect on
the antibody production itself. What this effect may be cannot be predicted.
29
4. Future prospects In this section the future prospects for this project are described. Whereas this project was started by me,
there is still a lot of work to do to obtain more conclusive results.
The analysis on the acGalNAz antibodies is not ready yet. The current samples still have to be analyzed with
UPLC to determine the influence of the acGalNAz on the N-glycan composition. It is hard to predict what the
effect would be, because it has never been reported. It would be interesting if the presence of the azide would
actually cause a shift in retention time, however this will remain unknown until the actual UPLC analysis. Still
the main thing that must be checked, is whether all antibodies that are produced have at least 1 incorporated
acGalNAz. This can be examined by performing ESI-MS on the N-glycan structures of the antibodies. After
cleaving of the N-glycans from the antibodies with PNGase the molecular weight of each N-glycan can be
determined. The total mass of an G0F glycan structure without azides (see Figure 27) would be around 1463
g/mol56
. It is expected that for every azide that is present on the N-glycan structure an additional mass of 42.01
g/mol will be added to the total mass of the N-glycan. When this does not give conclusive results, the N-glycan
can be reacted with BCN or BCN-rhodamine. With BCN-rhodamine there would be an additional mass of 907.09
g/mol for every azide present on the N-glycan or when only BCN is used 178.09 g/mol will be added per
available azide.
An interesting alternative for the release and tagging of N-glycans was reported by Song et al. in 201457
. It
involved the “threshing and trimming” method, in which the glycoprotein is digested by Pronase and the N-
glycans are trimmed with N-bromosuccinimide to obtain nitriles. Subsequently the nitriles on the N-glycans can
be reacted with 2-Aminobenzamide. The advantage of this method is that it is less expensive than the PNGase F
method and still chemically mild to preserve the N-glycan structures.
Whereas there was no clear difference visible between the high and low concentration acGalNAz, the acGalNAz
experiment can be repeated with more different concentration. Especially lower concentrations should tested,
because it is expected that higher concentrations will negatively influence the cell count and viability. The
perfect concentration would be when maximum incorporation is reached, but still minimal functionalized sugar
is needed. During these experiments also the harvesting point of each cell culture can be determined and the
effect of acGalNAz on growth retardation can be examined.
When the experiment would be repeated it is advisable to take an different dye for the fluorescent microscopy
experiments, instead of the BCN-rhodamine. Because the rhodamine is very lipophilic, it sticks to the
membrane of the cells, causing a lot of background staining. The rhodamine can be replaced by another dye
that is less sticky or a 2-step fluorescence mechanism, like the biotin-Straptavidin system or FLAG antibody FITC
system, as was described in section 2.2. The BCN is very reactive with azides, but also with for instance thiols,
which also causes background staining in the fluorescent microscopy and the SDS-PAGE analysis. Alternatives
would be other less reactive strained alkynes or a single alkyne, to perform a CuAAC reaction, which is of
course less preferable because of the toxic copper catalyst. Another much used method is making use of
phosphine derivative, which can react with the azide in a Staudinger ligation.
The biggest task would be to test all other synthesized carbohydrates in the CHO cells and perform a
comparative analysis to determine which carbohydrate and click chemistry method is most suitable for
antibody-drug conjugation. Also normal acGalNAc and acGlcNAc can be fed to the CHO cells as extra controls,
to examine the effect of the addition of the natural carbohydrates in the media on antibody production and N-
glycan composition. In the end an anticancer drug has to be found and connected to the antibodies that
contain a functional group. Some of these drugs are described in several review articles1, 3, 58
.
Besides ADC’s, the produced functionalized antibodies can of course be used for other purposes that involve
oriented antibody attachment. The incorporated azide is very reactive and the triazole linkage that arises is
very stable. Examples are oriented antibody immobilization on surfaces for biological assays59-61
, antibody
30
conjugations with nanoparticles 62-64
, quantum dots 65
and drug delivering liposomes 66
and specific staining
with antibody-fluorophore conjugates67, 68
. These techniques were all already used and described before,
however the site-specificity remains a problem in all of them, which is resolved with the use of MOE
functionalized antibodies.
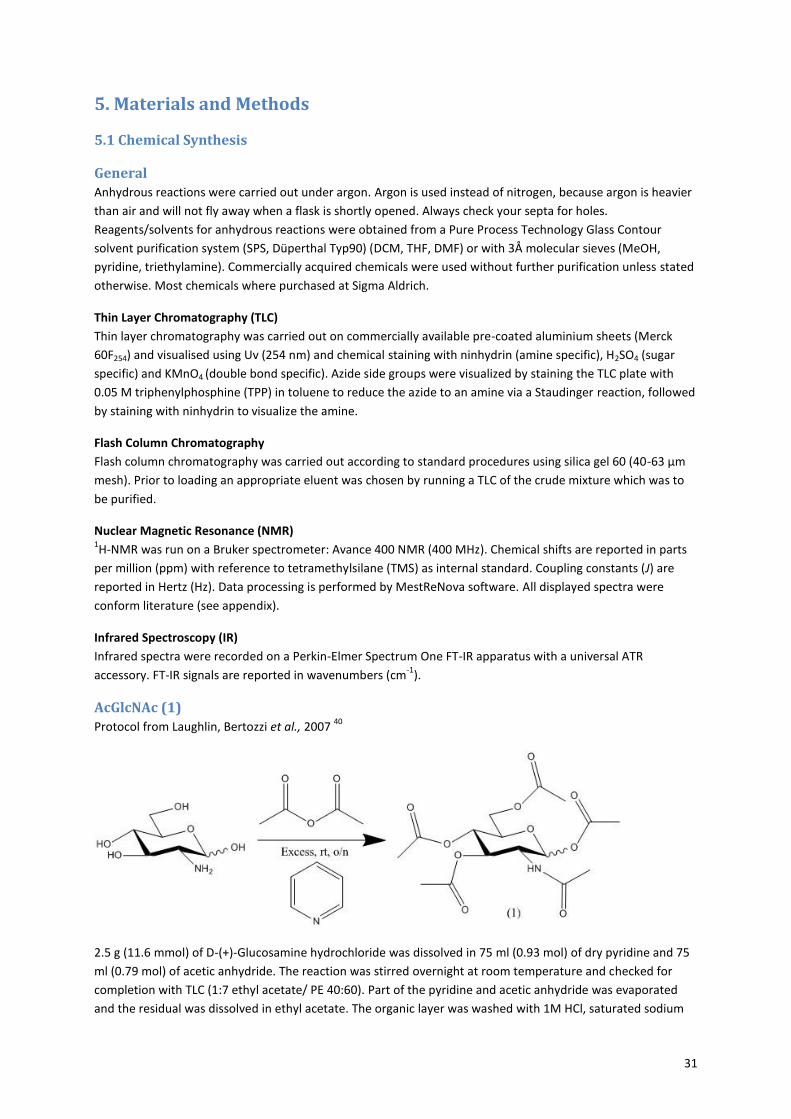
31
5. Materials and Methods
5.1 Chemical Synthesis
General
Anhydrous reactions were carried out under argon. Argon is used instead of nitrogen, because argon is heavier
than air and will not fly away when a flask is shortly opened. Always check your septa for holes.
Reagents/solvents for anhydrous reactions were obtained from a Pure Process Technology Glass Contour
solvent purification system (SPS, Düperthal Typ90) (DCM, THF, DMF) or with 3Å molecular sieves (MeOH,
pyridine, triethylamine). Commercially acquired chemicals were used without further purification unless stated
otherwise. Most chemicals where purchased at Sigma Aldrich.
Thin Layer Chromatography (TLC)
Thin layer chromatography was carried out on commercially available pre-coated aluminium sheets (Merck
60F254) and visualised using Uv (254 nm) and chemical staining with ninhydrin (amine specific), H2SO4 (sugar
specific) and KMnO4 (double bond specific). Azide side groups were visualized by staining the TLC plate with
0.05 M triphenylphosphine (TPP) in toluene to reduce the azide to an amine via a Staudinger reaction, followed
by staining with ninhydrin to visualize the amine.
Flash Column Chromatography
Flash column chromatography was carried out according to standard procedures using silica gel 60 (40-63 µm
mesh). Prior to loading an appropriate eluent was chosen by running a TLC of the crude mixture which was to
be purified.
Nuclear Magnetic Resonance (NMR) 1H-NMR was run on a Bruker spectrometer: Avance 400 NMR (400 MHz). Chemical shifts are reported in parts
per million (ppm) with reference to tetramethylsilane (TMS) as internal standard. Coupling constants (J) are
reported in Hertz (Hz). Data processing is performed by MestReNova software. All displayed spectra were
conform literature (see appendix).
Infrared Spectroscopy (IR)
Infrared spectra were recorded on a Perkin-Elmer Spectrum One FT-IR apparatus with a universal ATR
accessory. FT-IR signals are reported in wavenumbers (cm-1
).
AcGlcNAc (1)
Protocol from Laughlin, Bertozzi et al., 2007 40
2.5 g (11.6 mmol) of D-(+)-Glucosamine hydrochloride was dissolved in 75 ml (0.93 mol) of dry pyridine and 75
ml (0.79 mol) of acetic anhydride. The reaction was stirred overnight at room temperature and checked for
completion with TLC (1:7 ethyl acetate/ PE 40:60). Part of the pyridine and acetic anhydride was evaporated
and the residual was dissolved in ethyl acetate. The organic layer was washed with 1M HCl, saturated sodium
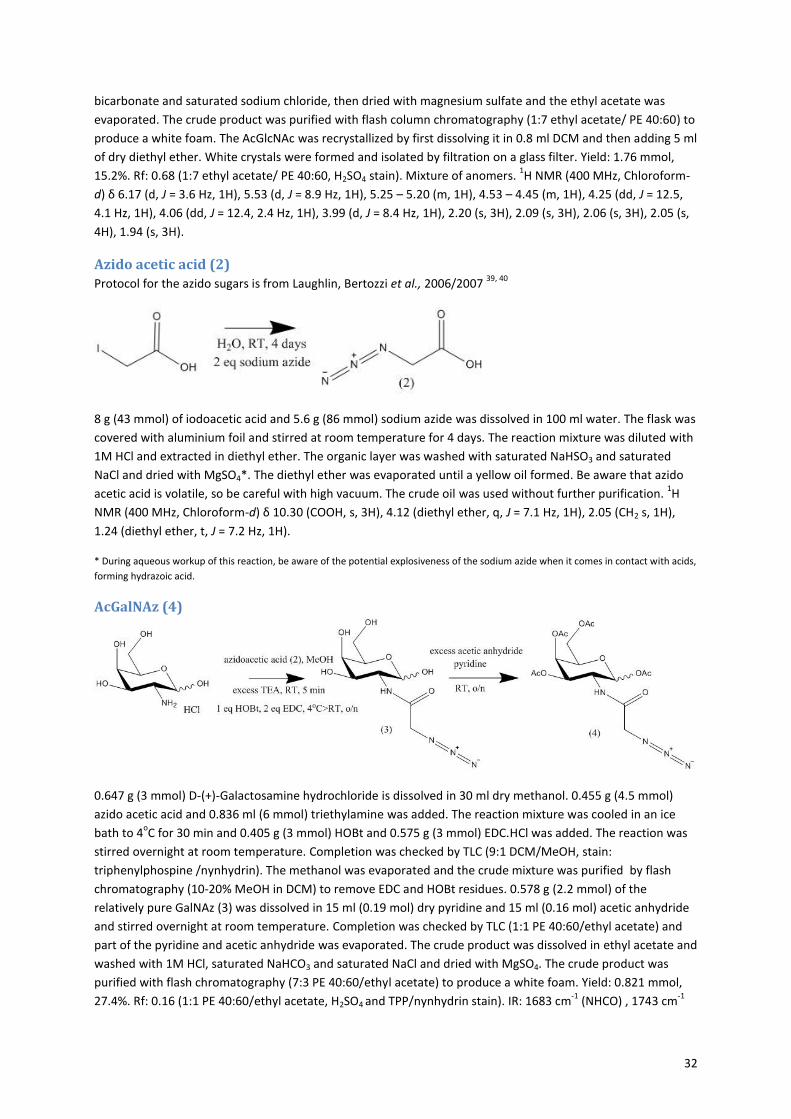
32
bicarbonate and saturated sodium chloride, then dried with magnesium sulfate and the ethyl acetate was
evaporated. The crude product was purified with flash column chromatography (1:7 ethyl acetate/ PE 40:60) to
produce a white foam. The AcGlcNAc was recrystallized by first dissolving it in 0.8 ml DCM and then adding 5 ml
of dry diethyl ether. White crystals were formed and isolated by filtration on a glass filter. Yield: 1.76 mmol,
15.2%. Rf: 0.68 (1:7 ethyl acetate/ PE 40:60, H2SO4 stain). Mixture of anomers. 1H NMR (400 MHz, Chloroform-
d) δ 6.17 (d, J = 3.6 Hz, 1H), 5.53 (d, J = 8.9 Hz, 1H), 5.25 – 5.20 (m, 1H), 4.53 – 4.45 (m, 1H), 4.25 (dd, J = 12.5,
4.1 Hz, 1H), 4.06 (dd, J = 12.4, 2.4 Hz, 1H), 3.99 (d, J = 8.4 Hz, 1H), 2.20 (s, 3H), 2.09 (s, 3H), 2.06 (s, 3H), 2.05 (s,
4H), 1.94 (s, 3H).
Azido acetic acid (2)
Protocol for the azido sugars is from Laughlin, Bertozzi et al., 2006/2007 39, 40
8 g (43 mmol) of iodoacetic acid and 5.6 g (86 mmol) sodium azide was dissolved in 100 ml water. The flask was
covered with aluminium foil and stirred at room temperature for 4 days. The reaction mixture was diluted with
1M HCl and extracted in diethyl ether. The organic layer was washed with saturated NaHSO3 and saturated
NaCl and dried with MgSO4*. The diethyl ether was evaporated until a yellow oil formed. Be aware that azido
acetic acid is volatile, so be careful with high vacuum. The crude oil was used without further purification. 1H
NMR (400 MHz, Chloroform-d) δ 10.30 (COOH, s, 3H), 4.12 (diethyl ether, q, J = 7.1 Hz, 1H), 2.05 (CH2 s, 1H),
1.24 (diethyl ether, t, J = 7.2 Hz, 1H).
* During aqueous workup of this reaction, be aware of the potential explosiveness of the sodium azide when it comes in contact with acids,
forming hydrazoic acid.
AcGalNAz (4)
0.647 g (3 mmol) D-(+)-Galactosamine hydrochloride is dissolved in 30 ml dry methanol. 0.455 g (4.5 mmol)
azido acetic acid and 0.836 ml (6 mmol) triethylamine was added. The reaction mixture was cooled in an ice
bath to 4oC for 30 min and 0.405 g (3 mmol) HOBt and 0.575 g (3 mmol) EDC.HCl was added. The reaction was
stirred overnight at room temperature. Completion was checked by TLC (9:1 DCM/MeOH, stain:
triphenylphospine /nynhydrin). The methanol was evaporated and the crude mixture was purified by flash
chromatography (10-20% MeOH in DCM) to remove EDC and HOBt residues. 0.578 g (2.2 mmol) of the
relatively pure GalNAz (3) was dissolved in 15 ml (0.19 mol) dry pyridine and 15 ml (0.16 mol) acetic anhydride
and stirred overnight at room temperature. Completion was checked by TLC (1:1 PE 40:60/ethyl acetate) and
part of the pyridine and acetic anhydride was evaporated. The crude product was dissolved in ethyl acetate and
washed with 1M HCl, saturated NaHCO3 and saturated NaCl and dried with MgSO4. The crude product was
purified with flash chromatography (7:3 PE 40:60/ethyl acetate) to produce a white foam. Yield: 0.821 mmol,
27.4%. Rf: 0.16 (1:1 PE 40:60/ethyl acetate, H2SO4 and TPP/nynhydrin stain). IR: 1683 cm-1
(NHCO) , 1743 cm-1
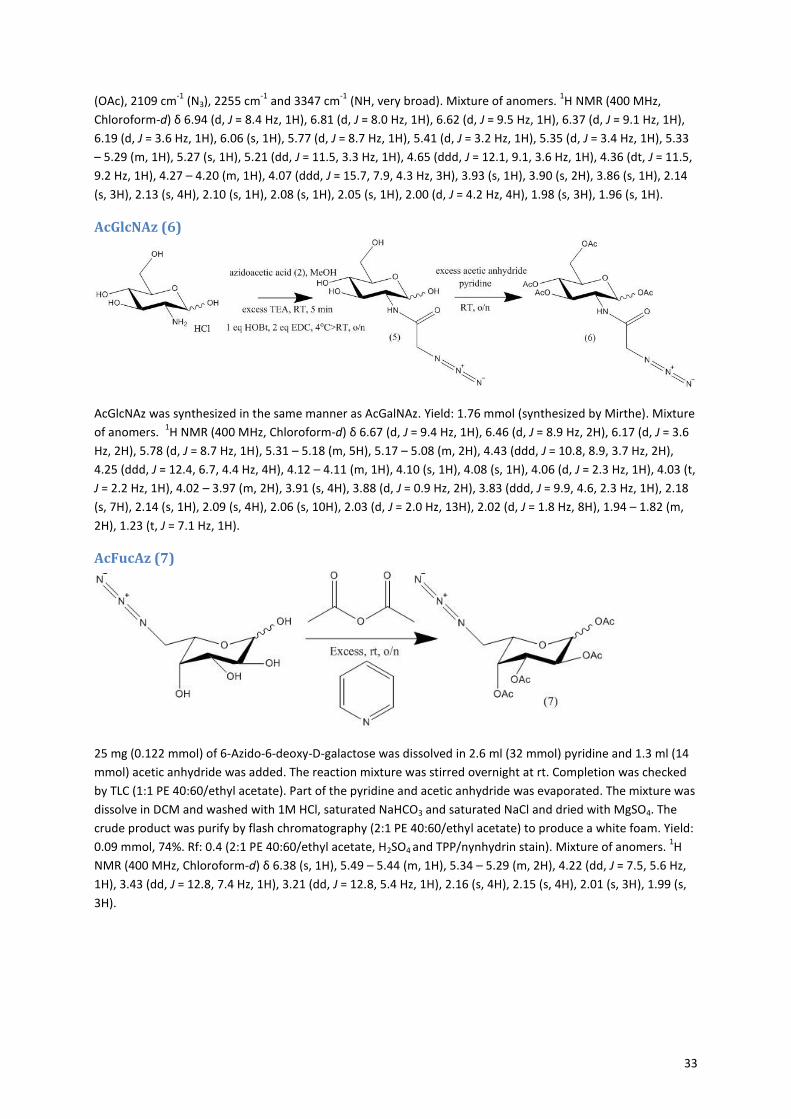
33
(OAc), 2109 cm-1
(N3), 2255 cm-1
and 3347 cm-1
(NH, very broad). Mixture of anomers. 1H NMR (400 MHz,
Chloroform-d) δ 6.94 (d, J = 8.4 Hz, 1H), 6.81 (d, J = 8.0 Hz, 1H), 6.62 (d, J = 9.5 Hz, 1H), 6.37 (d, J = 9.1 Hz, 1H),
6.19 (d, J = 3.6 Hz, 1H), 6.06 (s, 1H), 5.77 (d, J = 8.7 Hz, 1H), 5.41 (d, J = 3.2 Hz, 1H), 5.35 (d, J = 3.4 Hz, 1H), 5.33
– 5.29 (m, 1H), 5.27 (s, 1H), 5.21 (dd, J = 11.5, 3.3 Hz, 1H), 4.65 (ddd, J = 12.1, 9.1, 3.6 Hz, 1H), 4.36 (dt, J = 11.5,
9.2 Hz, 1H), 4.27 – 4.20 (m, 1H), 4.07 (ddd, J = 15.7, 7.9, 4.3 Hz, 3H), 3.93 (s, 1H), 3.90 (s, 2H), 3.86 (s, 1H), 2.14
(s, 3H), 2.13 (s, 4H), 2.10 (s, 1H), 2.08 (s, 1H), 2.05 (s, 1H), 2.00 (d, J = 4.2 Hz, 4H), 1.98 (s, 3H), 1.96 (s, 1H).
AcGlcNAz (6)
AcGlcNAz was synthesized in the same manner as AcGalNAz. Yield: 1.76 mmol (synthesized by Mirthe). Mixture
of anomers. 1H NMR (400 MHz, Chloroform-d) δ 6.67 (d, J = 9.4 Hz, 1H), 6.46 (d, J = 8.9 Hz, 2H), 6.17 (d, J = 3.6
Hz, 2H), 5.78 (d, J = 8.7 Hz, 1H), 5.31 – 5.18 (m, 5H), 5.17 – 5.08 (m, 2H), 4.43 (ddd, J = 10.8, 8.9, 3.7 Hz, 2H),
4.25 (ddd, J = 12.4, 6.7, 4.4 Hz, 4H), 4.12 – 4.11 (m, 1H), 4.10 (s, 1H), 4.08 (s, 1H), 4.06 (d, J = 2.3 Hz, 1H), 4.03 (t,
J = 2.2 Hz, 1H), 4.02 – 3.97 (m, 2H), 3.91 (s, 4H), 3.88 (d, J = 0.9 Hz, 2H), 3.83 (ddd, J = 9.9, 4.6, 2.3 Hz, 1H), 2.18
(s, 7H), 2.14 (s, 1H), 2.09 (s, 4H), 2.06 (s, 10H), 2.03 (d, J = 2.0 Hz, 13H), 2.02 (d, J = 1.8 Hz, 8H), 1.94 – 1.82 (m,
2H), 1.23 (t, J = 7.1 Hz, 1H).
AcFucAz (7)
25 mg (0.122 mmol) of 6-Azido-6-deoxy-D-galactose was dissolved in 2.6 ml (32 mmol) pyridine and 1.3 ml (14
mmol) acetic anhydride was added. The reaction mixture was stirred overnight at rt. Completion was checked
by TLC (1:1 PE 40:60/ethyl acetate). Part of the pyridine and acetic anhydride was evaporated. The mixture was
dissolve in DCM and washed with 1M HCl, saturated NaHCO3 and saturated NaCl and dried with MgSO4. The
crude product was purify by flash chromatography (2:1 PE 40:60/ethyl acetate) to produce a white foam. Yield:
0.09 mmol, 74%. Rf: 0.4 (2:1 PE 40:60/ethyl acetate, H2SO4 and TPP/nynhydrin stain). Mixture of anomers. 1H
NMR (400 MHz, Chloroform-d) δ 6.38 (s, 1H), 5.49 – 5.44 (m, 1H), 5.34 – 5.29 (m, 2H), 4.22 (dd, J = 7.5, 5.6 Hz,
1H), 3.43 (dd, J = 12.8, 7.4 Hz, 1H), 3.21 (dd, J = 12.8, 5.4 Hz, 1H), 2.16 (s, 4H), 2.15 (s, 4H), 2.01 (s, 3H), 1.99 (s,
3H).
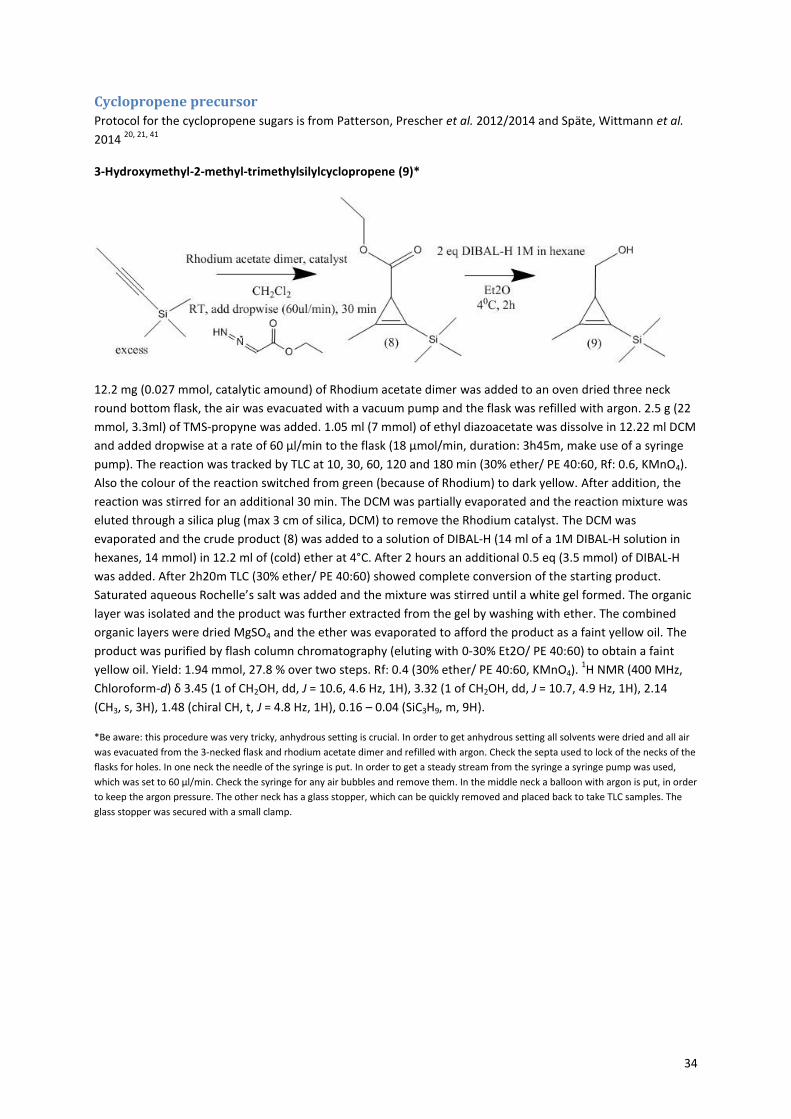
34
Cyclopropene precursor
Protocol for the cyclopropene sugars is from Patterson, Prescher et al. 2012/2014 and Späte, Wittmann et al.
2014 20, 21, 41
3-Hydroxymethyl-2-methyl-trimethylsilylcyclopropene (9)*
12.2 mg (0.027 mmol, catalytic amound) of Rhodium acetate dimer was added to an oven dried three neck
round bottom flask, the air was evacuated with a vacuum pump and the flask was refilled with argon. 2.5 g (22
mmol, 3.3ml) of TMS-propyne was added. 1.05 ml (7 mmol) of ethyl diazoacetate was dissolve in 12.22 ml DCM
and added dropwise at a rate of 60 µl/min to the flask (18 µmol/min, duration: 3h45m, make use of a syringe
pump). The reaction was tracked by TLC at 10, 30, 60, 120 and 180 min (30% ether/ PE 40:60, Rf: 0.6, KMnO4).
Also the colour of the reaction switched from green (because of Rhodium) to dark yellow. After addition, the
reaction was stirred for an additional 30 min. The DCM was partially evaporated and the reaction mixture was
eluted through a silica plug (max 3 cm of silica, DCM) to remove the Rhodium catalyst. The DCM was
evaporated and the crude product (8) was added to a solution of DIBAL-H (14 ml of a 1M DIBAL-H solution in
hexanes, 14 mmol) in 12.2 ml of (cold) ether at 4°C. After 2 hours an additional 0.5 eq (3.5 mmol) of DIBAL-H
was added. After 2h20m TLC (30% ether/ PE 40:60) showed complete conversion of the starting product.
Saturated aqueous Rochelle’s salt was added and the mixture was stirred until a white gel formed. The organic
layer was isolated and the product was further extracted from the gel by washing with ether. The combined
organic layers were dried MgSO4 and the ether was evaporated to afford the product as a faint yellow oil. The
product was purified by flash column chromatography (eluting with 0-30% Et2O/ PE 40:60) to obtain a faint
yellow oil. Yield: 1.94 mmol, 27.8 % over two steps. Rf: 0.4 (30% ether/ PE 40:60, KMnO4). 1H NMR (400 MHz,
Chloroform-d) δ 3.45 (1 of CH2OH, dd, J = 10.6, 4.6 Hz, 1H), 3.32 (1 of CH2OH, dd, J = 10.7, 4.9 Hz, 1H), 2.14
(CH3, s, 3H), 1.48 (chiral CH, t, J = 4.8 Hz, 1H), 0.16 – 0.04 (SiC3H9, m, 9H).
*Be aware: this procedure was very tricky, anhydrous setting is crucial. In order to get anhydrous setting all solvents were dried and all air
was evacuated from the 3-necked flask and rhodium acetate dimer and refilled with argon. Check the septa used to lock of the necks of the
flasks for holes. In one neck the needle of the syringe is put. In order to get a steady stream from the syringe a syringe pump was used,
which was set to 60 µl/min. Check the syringe for any air bubbles and remove them. In the middle neck a balloon with argon is put, in order
to keep the argon pressure. The other neck has a glass stopper, which can be quickly removed and placed back to take TLC samples. The
glass stopper was secured with a small clamp.
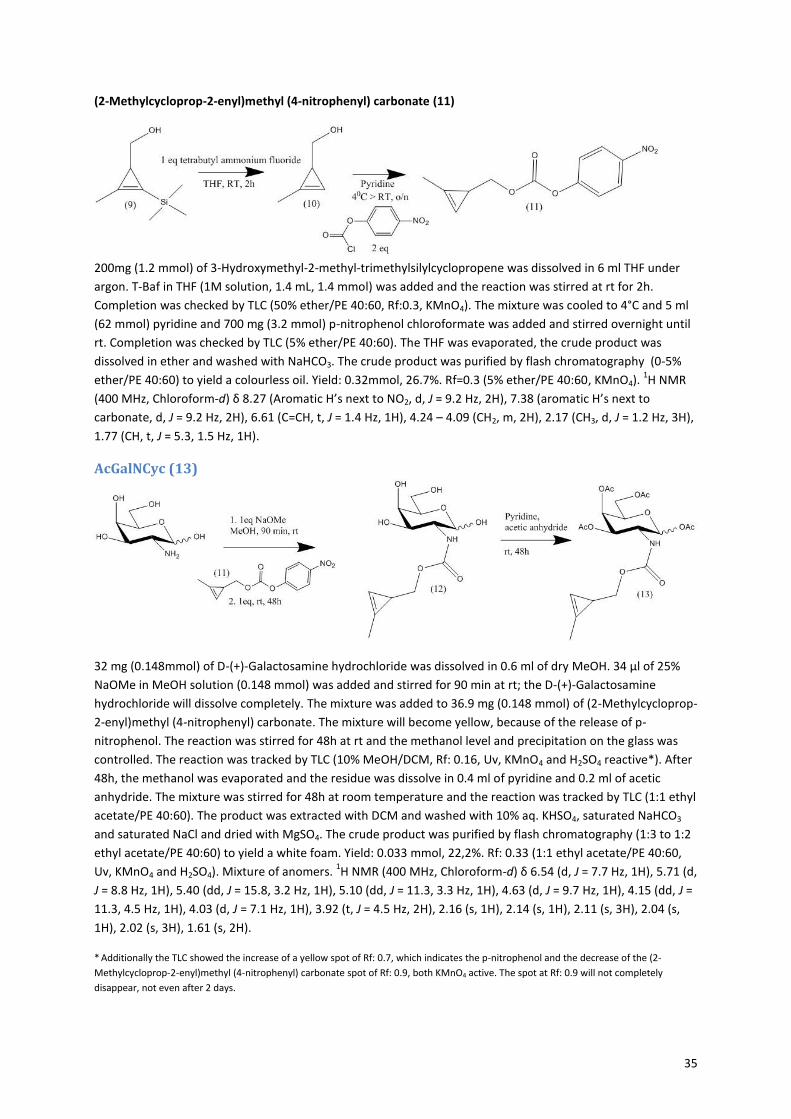
35
(2-Methylcycloprop-2-enyl)methyl (4-nitrophenyl) carbonate (11)
200mg (1.2 mmol) of 3-Hydroxymethyl-2-methyl-trimethylsilylcyclopropene was dissolved in 6 ml THF under
argon. T-Baf in THF (1M solution, 1.4 mL, 1.4 mmol) was added and the reaction was stirred at rt for 2h.
Completion was checked by TLC (50% ether/PE 40:60, Rf:0.3, KMnO4). The mixture was cooled to 4°C and 5 ml
(62 mmol) pyridine and 700 mg (3.2 mmol) p-nitrophenol chloroformate was added and stirred overnight until
rt. Completion was checked by TLC (5% ether/PE 40:60). The THF was evaporated, the crude product was
dissolved in ether and washed with NaHCO3. The crude product was purified by flash chromatography (0-5%
ether/PE 40:60) to yield a colourless oil. Yield: 0.32mmol, 26.7%. Rf=0.3 (5% ether/PE 40:60, KMnO4). 1H NMR
(400 MHz, Chloroform-d) δ 8.27 (Aromatic H’s next to NO2, d, J = 9.2 Hz, 2H), 7.38 (aromatic H’s next to
carbonate, d, J = 9.2 Hz, 2H), 6.61 (C=CH, t, J = 1.4 Hz, 1H), 4.24 – 4.09 (CH2, m, 2H), 2.17 (CH3, d, J = 1.2 Hz, 3H),
1.77 (CH, t, J = 5.3, 1.5 Hz, 1H).
AcGalNCyc (13)
32 mg (0.148mmol) of D-(+)-Galactosamine hydrochloride was dissolved in 0.6 ml of dry MeOH. 34 µl of 25%
NaOMe in MeOH solution (0.148 mmol) was added and stirred for 90 min at rt; the D-(+)-Galactosamine
hydrochloride will dissolve completely. The mixture was added to 36.9 mg (0.148 mmol) of (2-Methylcycloprop-
2-enyl)methyl (4-nitrophenyl) carbonate. The mixture will become yellow, because of the release of p-
nitrophenol. The reaction was stirred for 48h at rt and the methanol level and precipitation on the glass was
controlled. The reaction was tracked by TLC (10% MeOH/DCM, Rf: 0.16, Uv, KMnO4 and H2SO4 reactive*). After
48h, the methanol was evaporated and the residue was dissolve in 0.4 ml of pyridine and 0.2 ml of acetic
anhydride. The mixture was stirred for 48h at room temperature and the reaction was tracked by TLC (1:1 ethyl
acetate/PE 40:60). The product was extracted with DCM and washed with 10% aq. KHSO4, saturated NaHCO3
and saturated NaCl and dried with MgSO4. The crude product was purified by flash chromatography (1:3 to 1:2
ethyl acetate/PE 40:60) to yield a white foam. Yield: 0.033 mmol, 22,2%. Rf: 0.33 (1:1 ethyl acetate/PE 40:60,
Uv, KMnO4 and H2SO4). Mixture of anomers. 1H NMR (400 MHz, Chloroform-d) δ 6.54 (d, J = 7.7 Hz, 1H), 5.71 (d,
J = 8.8 Hz, 1H), 5.40 (dd, J = 15.8, 3.2 Hz, 1H), 5.10 (dd, J = 11.3, 3.3 Hz, 1H), 4.63 (d, J = 9.7 Hz, 1H), 4.15 (dd, J =
11.3, 4.5 Hz, 1H), 4.03 (d, J = 7.1 Hz, 1H), 3.92 (t, J = 4.5 Hz, 2H), 2.16 (s, 1H), 2.14 (s, 1H), 2.11 (s, 3H), 2.04 (s,
1H), 2.02 (s, 3H), 1.61 (s, 2H).
* Additionally the TLC showed the increase of a yellow spot of Rf: 0.7, which indicates the p-nitrophenol and the decrease of the (2-
Methylcycloprop-2-enyl)methyl (4-nitrophenyl) carbonate spot of Rf: 0.9, both KMnO4 active. The spot at Rf: 0.9 will not completely
disappear, not even after 2 days.
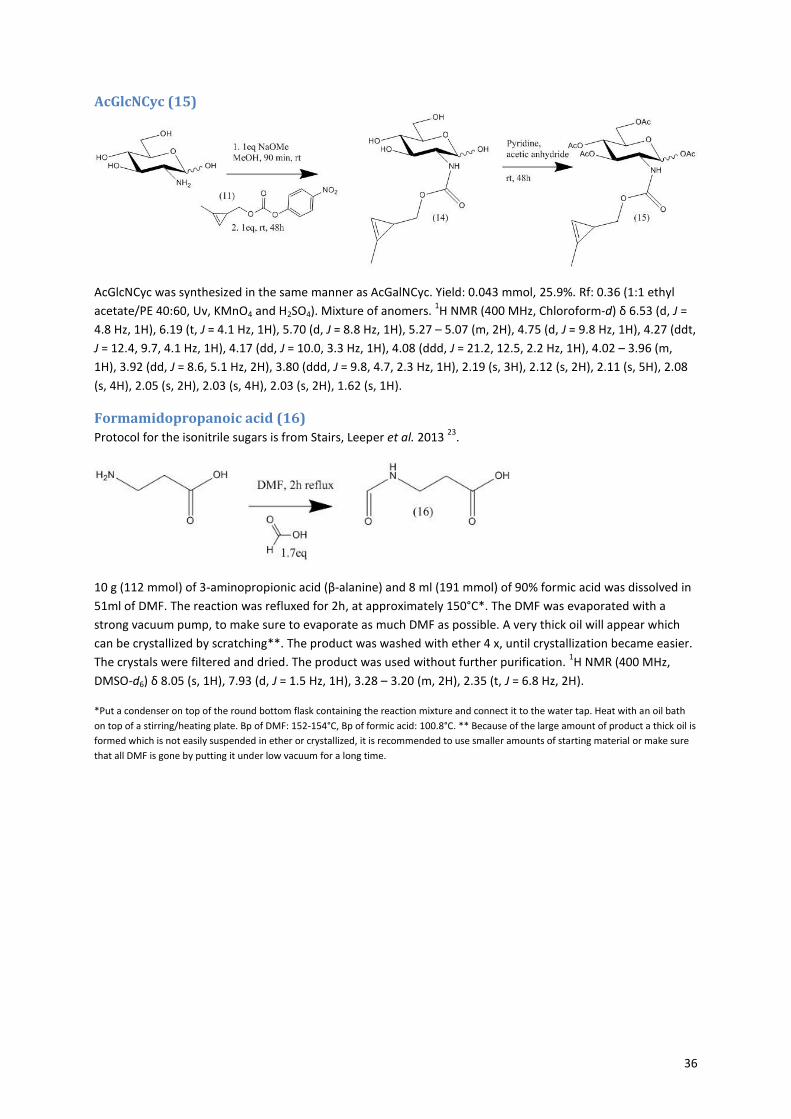
36
AcGlcNCyc (15)
AcGlcNCyc was synthesized in the same manner as AcGalNCyc. Yield: 0.043 mmol, 25.9%. Rf: 0.36 (1:1 ethyl
acetate/PE 40:60, Uv, KMnO4 and H2SO4). Mixture of anomers. 1H NMR (400 MHz, Chloroform-d) δ 6.53 (d, J =
4.8 Hz, 1H), 6.19 (t, J = 4.1 Hz, 1H), 5.70 (d, J = 8.8 Hz, 1H), 5.27 – 5.07 (m, 2H), 4.75 (d, J = 9.8 Hz, 1H), 4.27 (ddt,
J = 12.4, 9.7, 4.1 Hz, 1H), 4.17 (dd, J = 10.0, 3.3 Hz, 1H), 4.08 (ddd, J = 21.2, 12.5, 2.2 Hz, 1H), 4.02 – 3.96 (m,
1H), 3.92 (dd, J = 8.6, 5.1 Hz, 2H), 3.80 (ddd, J = 9.8, 4.7, 2.3 Hz, 1H), 2.19 (s, 3H), 2.12 (s, 2H), 2.11 (s, 5H), 2.08
(s, 4H), 2.05 (s, 2H), 2.03 (s, 4H), 2.03 (s, 2H), 1.62 (s, 1H).
Formamidopropanoic acid (16)
Protocol for the isonitrile sugars is from Stairs, Leeper et al. 2013 23
.
10 g (112 mmol) of 3-aminopropionic acid (β-alanine) and 8 ml (191 mmol) of 90% formic acid was dissolved in
51ml of DMF. The reaction was refluxed for 2h, at approximately 150°C*. The DMF was evaporated with a
strong vacuum pump, to make sure to evaporate as much DMF as possible. A very thick oil will appear which
can be crystallized by scratching**. The product was washed with ether 4 x, until crystallization became easier.
The crystals were filtered and dried. The product was used without further purification. 1H NMR (400 MHz,
DMSO-d6) δ 8.05 (s, 1H), 7.93 (d, J = 1.5 Hz, 1H), 3.28 – 3.20 (m, 2H), 2.35 (t, J = 6.8 Hz, 2H).
*Put a condenser on top of the round bottom flask containing the reaction mixture and connect it to the water tap. Heat with an oil bath
on top of a stirring/heating plate. Bp of DMF: 152-154°C, Bp of formic acid: 100.8°C. ** Because of the large amount of product a thick oil is
formed which is not easily suspended in ether or crystallized, it is recommended to use smaller amounts of starting material or make sure
that all DMF is gone by putting it under low vacuum for a long time.
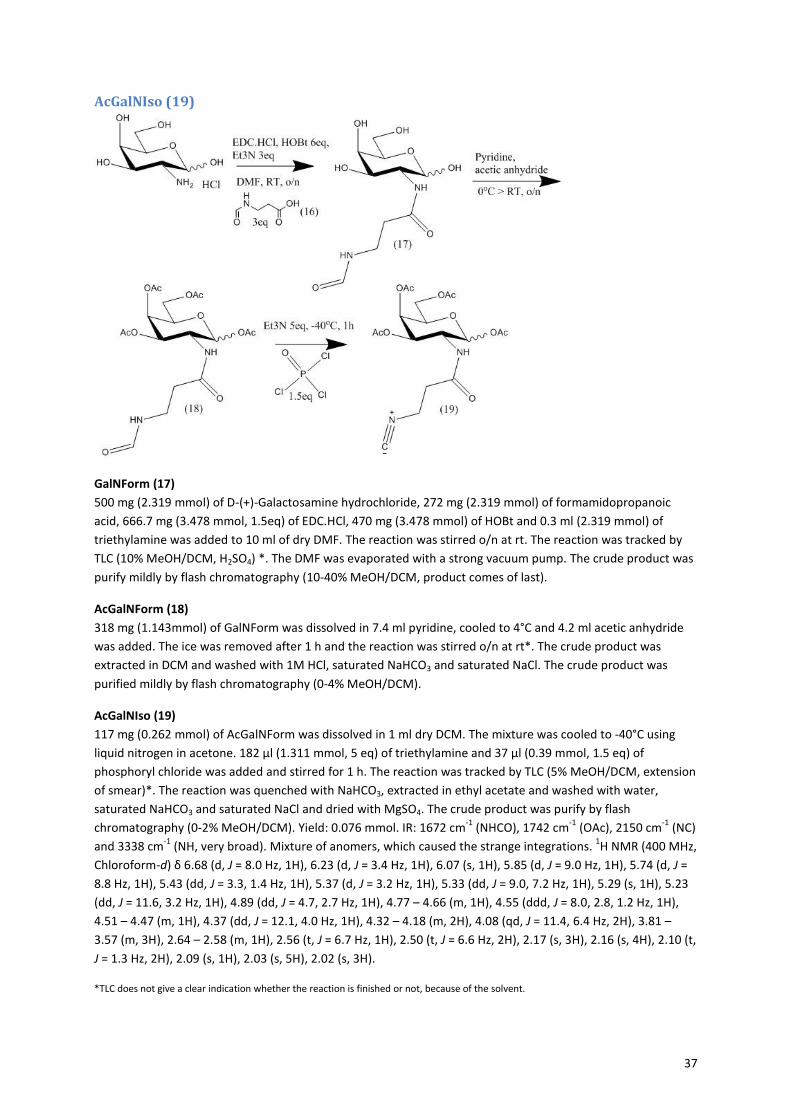
37
AcGalNIso (19)
GalNForm (17)
500 mg (2.319 mmol) of D-(+)-Galactosamine hydrochloride, 272 mg (2.319 mmol) of formamidopropanoic
acid, 666.7 mg (3.478 mmol, 1.5eq) of EDC.HCl, 470 mg (3.478 mmol) of HOBt and 0.3 ml (2.319 mmol) of
triethylamine was added to 10 ml of dry DMF. The reaction was stirred o/n at rt. The reaction was tracked by
TLC (10% MeOH/DCM, H2SO4) *. The DMF was evaporated with a strong vacuum pump. The crude product was
purify mildly by flash chromatography (10-40% MeOH/DCM, product comes of last).
AcGalNForm (18)
318 mg (1.143mmol) of GalNForm was dissolved in 7.4 ml pyridine, cooled to 4°C and 4.2 ml acetic anhydride
was added. The ice was removed after 1 h and the reaction was stirred o/n at rt*. The crude product was
extracted in DCM and washed with 1M HCl, saturated NaHCO3 and saturated NaCl. The crude product was
purified mildly by flash chromatography (0-4% MeOH/DCM).
AcGalNIso (19)
117 mg (0.262 mmol) of AcGalNForm was dissolved in 1 ml dry DCM. The mixture was cooled to -40°C using
liquid nitrogen in acetone. 182 µl (1.311 mmol, 5 eq) of triethylamine and 37 µl (0.39 mmol, 1.5 eq) of
phosphoryl chloride was added and stirred for 1 h. The reaction was tracked by TLC (5% MeOH/DCM, extension
of smear)*. The reaction was quenched with NaHCO3, extracted in ethyl acetate and washed with water,
saturated NaHCO3 and saturated NaCl and dried with MgSO4. The crude product was purify by flash
chromatography (0-2% MeOH/DCM). Yield: 0.076 mmol. IR: 1672 cm-1
(NHCO), 1742 cm-1
(OAc), 2150 cm-1
(NC)
and 3338 cm-1
(NH, very broad). Mixture of anomers, which caused the strange integrations. 1H NMR (400 MHz,
Chloroform-d) δ 6.68 (d, J = 8.0 Hz, 1H), 6.23 (d, J = 3.4 Hz, 1H), 6.07 (s, 1H), 5.85 (d, J = 9.0 Hz, 1H), 5.74 (d, J =
8.8 Hz, 1H), 5.43 (dd, J = 3.3, 1.4 Hz, 1H), 5.37 (d, J = 3.2 Hz, 1H), 5.33 (dd, J = 9.0, 7.2 Hz, 1H), 5.29 (s, 1H), 5.23
(dd, J = 11.6, 3.2 Hz, 1H), 4.89 (dd, J = 4.7, 2.7 Hz, 1H), 4.77 – 4.66 (m, 1H), 4.55 (ddd, J = 8.0, 2.8, 1.2 Hz, 1H),
4.51 – 4.47 (m, 1H), 4.37 (dd, J = 12.1, 4.0 Hz, 1H), 4.32 – 4.18 (m, 2H), 4.08 (qd, J = 11.4, 6.4 Hz, 2H), 3.81 –
3.57 (m, 3H), 2.64 – 2.58 (m, 1H), 2.56 (t, J = 6.7 Hz, 1H), 2.50 (t, J = 6.6 Hz, 2H), 2.17 (s, 3H), 2.16 (s, 4H), 2.10 (t,
J = 1.3 Hz, 2H), 2.09 (s, 1H), 2.03 (s, 5H), 2.02 (s, 3H).
*TLC does not give a clear indication whether the reaction is finished or not, because of the solvent.
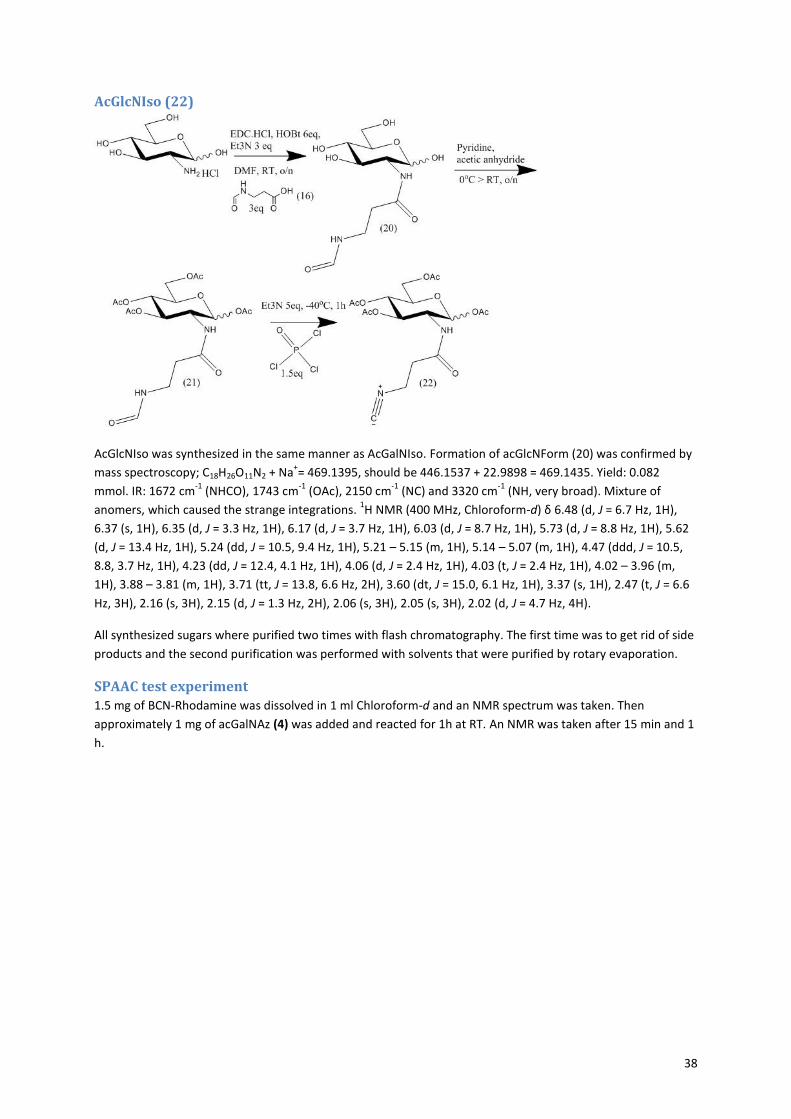
38
AcGlcNIso (22)
AcGlcNIso was synthesized in the same manner as AcGalNIso. Formation of acGlcNForm (20) was confirmed by
mass spectroscopy; C18H26O11N2 + Na+= 469.1395, should be 446.1537 + 22.9898 = 469.1435. Yield: 0.082
mmol. IR: 1672 cm-1
(NHCO), 1743 cm-1
(OAc), 2150 cm-1
(NC) and 3320 cm-1
(NH, very broad). Mixture of
anomers, which caused the strange integrations. 1H NMR (400 MHz, Chloroform-d) δ 6.48 (d, J = 6.7 Hz, 1H),
6.37 (s, 1H), 6.35 (d, J = 3.3 Hz, 1H), 6.17 (d, J = 3.7 Hz, 1H), 6.03 (d, J = 8.7 Hz, 1H), 5.73 (d, J = 8.8 Hz, 1H), 5.62
(d, J = 13.4 Hz, 1H), 5.24 (dd, J = 10.5, 9.4 Hz, 1H), 5.21 – 5.15 (m, 1H), 5.14 – 5.07 (m, 1H), 4.47 (ddd, J = 10.5,
8.8, 3.7 Hz, 1H), 4.23 (dd, J = 12.4, 4.1 Hz, 1H), 4.06 (d, J = 2.4 Hz, 1H), 4.03 (t, J = 2.4 Hz, 1H), 4.02 – 3.96 (m,
1H), 3.88 – 3.81 (m, 1H), 3.71 (tt, J = 13.8, 6.6 Hz, 2H), 3.60 (dt, J = 15.0, 6.1 Hz, 1H), 3.37 (s, 1H), 2.47 (t, J = 6.6
Hz, 3H), 2.16 (s, 3H), 2.15 (d, J = 1.3 Hz, 2H), 2.06 (s, 3H), 2.05 (s, 3H), 2.02 (d, J = 4.7 Hz, 4H).
All synthesized sugars where purified two times with flash chromatography. The first time was to get rid of side
products and the second purification was performed with solvents that were purified by rotary evaporation.
SPAAC test experiment 1.5 mg of BCN-Rhodamine was dissolved in 1 ml Chloroform-d and an NMR spectrum was taken. Then
approximately 1 mg of acGalNAz (4) was added and reacted for 1h at RT. An NMR was taken after 15 min and 1
h.
39
5.2 Biological experiments
General
Cell line: BC4 CHO-K1
Medium: FortiCHO medium, supplemented by 4 mM L-glutamine, 0.05% anticlump (hereafter referred to as
medium)
Selection agents: 200 μg/ml zeocin, 5 μg/ml blasticidin
Supplements: 0.5% DMSO and acGalNAz (4, synthesized as described in section 5.1)
Shaker platform: shaker speed: 100 rpm (discrepancy intolerance 70-130 rpm), 5% CO2 (discrepancy
intolerance 4-6% CO2), 36.5 °C (discrepancy intolerance 35.5-37.5 °C) and 80% humidity (discrepancy
intolerance 75-85% humidity).
Cell counting: Samples were 1:1 diluted with Trypan Blue and pipeted into the slot of the counting slides (from
BIORAD). Counting slide are inserted into and the counting is performed by TC20™ Automated Cell Counter
from BIORAD. The Cell Counter can calculate the dilutions that have to be made for a new cell culture.
Glucose and Lactate analysis: Cell culture samples are spun down and the supernatant is filtered with 0.2 µm
PES filters (from Sartorius Stedim, minisart). Samples are analyzed with YSI 2300 STAT Plus™
Glucose & Lactate
Analyzer.
Fluorescent dye: BCN-POE3-NH-lissamine rhodamine B conjugate, abs/em= 559/578 nm (from Synaffix,
Nijmegen).
Microscope: Olympus IX71, with a filter with excitation wavelength of 530-550 nm and emission wavelength of
575-625 nm. Fluorescent pictures were taken with the background light completely off.
Antibody purification: Äkta Pure system using a HiTrap MabSelect SuRe column.
Fluorescent scanner: Molecular Imager Fx ProPlus with an external fluorescent laser (from BioRad). Ex/em =
532/555 nm, exposure: 50 ms.
UPLC: Agilent 1290 Infinity Binary LC system with a Agilent 1260 Infinity Fluorescence Detector (for N-glycan
analysis).
For additional materials see protocols in appendix
Cell maintenance
The culture was observed and the cell condition evaluated, cells were checked microscopically for cell condition
(cell structure, clumping, viability, density, the absence of infection). The cells were re-suspended gently by
swirling the cell-culture flask to achieve a homogeneous cell suspension. A 200 µl sample was taken to
determine the cell concentration and viability according to cell counting procedure. Based on the viability
counting the cells were re-seeded by dilution to 2E5 cells/ml if left for 3 days, or 3E5 cells/ml if left for 2 days in
a volume of 15 ml medium supplemented with selection agents and 0.5% DMSO. The cells were incubated on a
shaker platform.
acGalNAz experiment A maintenance cell line was maintained for 1 week with an addition of 0.5% DMSO in FortiCHO medium, in
order to let the cells adapt to the presence of DMSO. Prepare 2 acGalNAz stock solutions of 200 mM and 10
mM in DMSO. 4 different media (50ml) are made: control, 5% DMSO control, low (50 µM) concentration and
high (1 mM) concentration acGalNAz. The control medium has no supplements. The DMSO medium is
supplemented with 0.5% DMSO. The low concentration medium is supplemented with 0.25 ml of 10 mM
acGalNAz stock solution resulting in a final concentration of 50 µM acGalNAz and 0.5% DMSO. The high
40
concentration medium is supplemented with 0.25 ml of 200 mM acGalNAz stock solution resulting in a final
concentration of 1 mM acGalNAz and 0.5% DMSO. The DMSO maintenance cell line was centrifuged, re-
suspended in media and counted. Each media type was inoculated with 2.5E5 cells/ml from the DMSO
maintenance cell line in triplet. The cells were grown for 5 days until viability drops. 500 µl samples were taken
daily for cell counting and glucose and lactate analysis. On day 5 all cell cultures were centrifuged, filtered and
stored at -20°C for antibody glycosylation analysis.
Microscopic analysis
At day 2 and 4 100 µl samples were taken from the best performing triplicate of each medium type, they were
centrifuged and washed with medium (containing 1% DMSO). The cells were re-suspended in 90 µl medium
and 10 µl of 1 mM BCN-rhodamine stock in DMSO was added. The samples were incubated for 1 h at room
temperature or 5 min at 37°C and washed 3 times with 100 µl medium. Then the cells were visualized under
the microscope.
5.3 Antibody purification and analysis
Titration
To determine the antibody concentration per sample, the protocol: “IgG quantification on Bio-Monolith Protein
A column in a UPLC system” by Xiao Pan, was followed exactly (find the protocol in the appendix).
Glycan characterization
For the glycan purification and analysis the protocol: “Glycan analysis protocol” by Jarmo Hoogendoorn is
followed exactly (find the protocol in the appendix). For the desalting (section A) the option “PD-10 columns
(gravity protocol)” was chosen.
The samples are desalted before purifying them with a HiTrap MabSelect SuRe column on an Akta pure
machine. Then the sample is concentrated on a spin filter. Then the N-glycan structure of the antibodies are
released with Peptide-N-Glycosidase F (PNGase F from Roche). In order to detect them with the UPLC
fluorescent scanner, the N-glycans are stained with 2-AB dye. The samples are filtered through GlykoPrep®
Cleanup module cartridges (from Prozyme, Hayward, CA, USA) to get rid of the excess of dye. The samples are
analysed with a ACQUITY UPLC BEH Glycan, 1.7 µm Column on the UPLC (Agilent).
SDS-PAGE
SDS-PAGE was performed according to “Protein measurement, SDS-PAGE, gel staining, Western blotting,
Protein detection Protocols” by Wendy Evers (find the protocol in the appendix). Prior to this protocol, 5 µl of
each sample was stained with 5 µl of 1 mM BCN-rhodamine stock in DMSO for 1h at rt. The samples were put
into spin filters in vials, washed with 450 µl PBS buffer for 3 times and spun after every wash. Then the filter
was put upside-down into a new vial and the vials were spun again for 8 min.
For visualization of the fluorescently labelled antibodies, a Molecular Imager Fx ProPlus with an external
fluorescent laser (from BioRad) was used. The excitation pulse was 532 nm and the emission filter was 555 nm,
with 50 ms exposure.
41
6. Acknowledgements Thanks to Tom Wennekes for the opportunity and trust you gave me to start up this project, you are an
amazing teacher and person. Every time I stormed into your office with a problem, you could always find a
solution and cheer me up again. Thanks to Jorin Hoogenboom for helping me in the organic lab, although I was
not your official student, you were always available for questions. Thanks to Abdulaziz Al Sayyari and Mathieu
Streefland for the supervision and guidance in the BPE lab and the useful meetings. Special thanks to Wendy
Evers, Xiao Pan and Stefanie Laake for the help with the antibody purification and analysis at BPE. Thanks to
Connie de Kock for the nice time and the support for each other. Also thanks to my ORC lab mates: Bas van den
Berg and Stefanie Lange, for all answers to my questions and amusing conversations. Thanks to my office
mates: Satesh Gangarappu, Umesh Chinnaswamy Panchatcharam and Wouter Biesta, for the nice atmosphere.
Thanks to Aline Debrassi and Tjerk Sminia. Also thanks to all the other ORC members. Thanks to all nice people
in the animal cell lab at BPE. Thanks to Myrthe Walhout for the synthesis of acGalNAz and acGlcNAz.
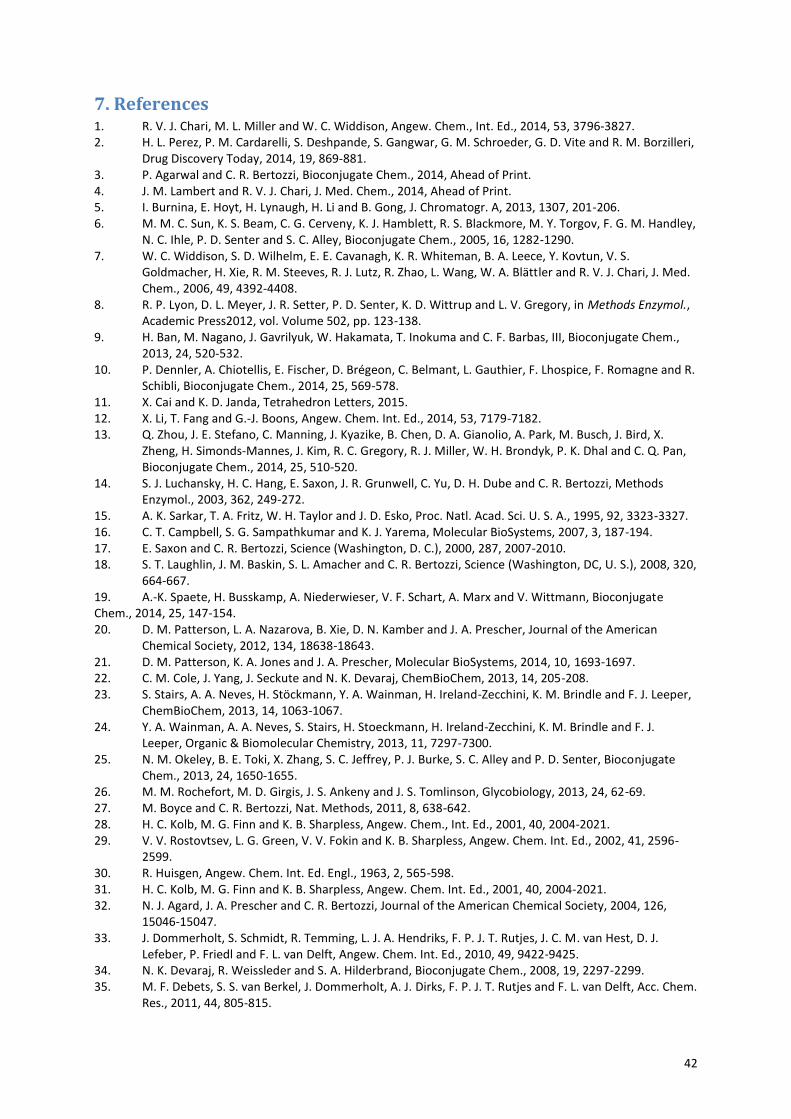
42
7. References 1. R. V. J. Chari, M. L. Miller and W. C. Widdison, Angew. Chem., Int. Ed., 2014, 53, 3796-3827. 2. H. L. Perez, P. M. Cardarelli, S. Deshpande, S. Gangwar, G. M. Schroeder, G. D. Vite and R. M. Borzilleri,
Drug Discovery Today, 2014, 19, 869-881. 3. P. Agarwal and C. R. Bertozzi, Bioconjugate Chem., 2014, Ahead of Print. 4. J. M. Lambert and R. V. J. Chari, J. Med. Chem., 2014, Ahead of Print. 5. I. Burnina, E. Hoyt, H. Lynaugh, H. Li and B. Gong, J. Chromatogr. A, 2013, 1307, 201-206. 6. M. M. C. Sun, K. S. Beam, C. G. Cerveny, K. J. Hamblett, R. S. Blackmore, M. Y. Torgov, F. G. M. Handley,
N. C. Ihle, P. D. Senter and S. C. Alley, Bioconjugate Chem., 2005, 16, 1282-1290. 7. W. C. Widdison, S. D. Wilhelm, E. E. Cavanagh, K. R. Whiteman, B. A. Leece, Y. Kovtun, V. S.
Goldmacher, H. Xie, R. M. Steeves, R. J. Lutz, R. Zhao, L. Wang, W. A. Blättler and R. V. J. Chari, J. Med. Chem., 2006, 49, 4392-4408.
8. R. P. Lyon, D. L. Meyer, J. R. Setter, P. D. Senter, K. D. Wittrup and L. V. Gregory, in Methods Enzymol., Academic Press2012, vol. Volume 502, pp. 123-138.
9. H. Ban, M. Nagano, J. Gavrilyuk, W. Hakamata, T. Inokuma and C. F. Barbas, III, Bioconjugate Chem., 2013, 24, 520-532.
10. P. Dennler, A. Chiotellis, E. Fischer, D. Brégeon, C. Belmant, L. Gauthier, F. Lhospice, F. Romagne and R. Schibli, Bioconjugate Chem., 2014, 25, 569-578.
11. X. Cai and K. D. Janda, Tetrahedron Letters, 2015. 12. X. Li, T. Fang and G.-J. Boons, Angew. Chem. Int. Ed., 2014, 53, 7179-7182. 13. Q. Zhou, J. E. Stefano, C. Manning, J. Kyazike, B. Chen, D. A. Gianolio, A. Park, M. Busch, J. Bird, X.
Zheng, H. Simonds-Mannes, J. Kim, R. C. Gregory, R. J. Miller, W. H. Brondyk, P. K. Dhal and C. Q. Pan, Bioconjugate Chem., 2014, 25, 510-520.
14. S. J. Luchansky, H. C. Hang, E. Saxon, J. R. Grunwell, C. Yu, D. H. Dube and C. R. Bertozzi, Methods Enzymol., 2003, 362, 249-272.
15. A. K. Sarkar, T. A. Fritz, W. H. Taylor and J. D. Esko, Proc. Natl. Acad. Sci. U. S. A., 1995, 92, 3323-3327. 16. C. T. Campbell, S. G. Sampathkumar and K. J. Yarema, Molecular BioSystems, 2007, 3, 187-194. 17. E. Saxon and C. R. Bertozzi, Science (Washington, D. C.), 2000, 287, 2007-2010. 18. S. T. Laughlin, J. M. Baskin, S. L. Amacher and C. R. Bertozzi, Science (Washington, DC, U. S.), 2008, 320,
664-667. 19. A.-K. Spaete, H. Busskamp, A. Niederwieser, V. F. Schart, A. Marx and V. Wittmann, Bioconjugate Chem., 2014, 25, 147-154. 20. D. M. Patterson, L. A. Nazarova, B. Xie, D. N. Kamber and J. A. Prescher, Journal of the American
Chemical Society, 2012, 134, 18638-18643. 21. D. M. Patterson, K. A. Jones and J. A. Prescher, Molecular BioSystems, 2014, 10, 1693-1697. 22. C. M. Cole, J. Yang, J. Seckute and N. K. Devaraj, ChemBioChem, 2013, 14, 205-208. 23. S. Stairs, A. A. Neves, H. Stöckmann, Y. A. Wainman, H. Ireland-Zecchini, K. M. Brindle and F. J. Leeper,
ChemBioChem, 2013, 14, 1063-1067. 24. Y. A. Wainman, A. A. Neves, S. Stairs, H. Stoeckmann, H. Ireland-Zecchini, K. M. Brindle and F. J.
Leeper, Organic & Biomolecular Chemistry, 2013, 11, 7297-7300. 25. N. M. Okeley, B. E. Toki, X. Zhang, S. C. Jeffrey, P. J. Burke, S. C. Alley and P. D. Senter, Bioconjugate
Chem., 2013, 24, 1650-1655. 26. M. M. Rochefort, M. D. Girgis, J. S. Ankeny and J. S. Tomlinson, Glycobiology, 2013, 24, 62-69. 27. M. Boyce and C. R. Bertozzi, Nat. Methods, 2011, 8, 638-642. 28. H. C. Kolb, M. G. Finn and K. B. Sharpless, Angew. Chem., Int. Ed., 2001, 40, 2004-2021. 29. V. V. Rostovtsev, L. G. Green, V. V. Fokin and K. B. Sharpless, Angew. Chem. Int. Ed., 2002, 41, 2596-
2599. 30. R. Huisgen, Angew. Chem. Int. Ed. Engl., 1963, 2, 565-598. 31. H. C. Kolb, M. G. Finn and K. B. Sharpless, Angew. Chem. Int. Ed., 2001, 40, 2004-2021. 32. N. J. Agard, J. A. Prescher and C. R. Bertozzi, Journal of the American Chemical Society, 2004, 126,
15046-15047. 33. J. Dommerholt, S. Schmidt, R. Temming, L. J. A. Hendriks, F. P. J. T. Rutjes, J. C. M. van Hest, D. J.
Lefeber, P. Friedl and F. L. van Delft, Angew. Chem. Int. Ed., 2010, 49, 9422-9425. 34. N. K. Devaraj, R. Weissleder and S. A. Hilderbrand, Bioconjugate Chem., 2008, 19, 2297-2299. 35. M. F. Debets, S. S. van Berkel, J. Dommerholt, A. J. Dirks, F. P. J. T. Rutjes and F. L. van Delft, Acc. Chem.
Res., 2011, 44, 805-815.
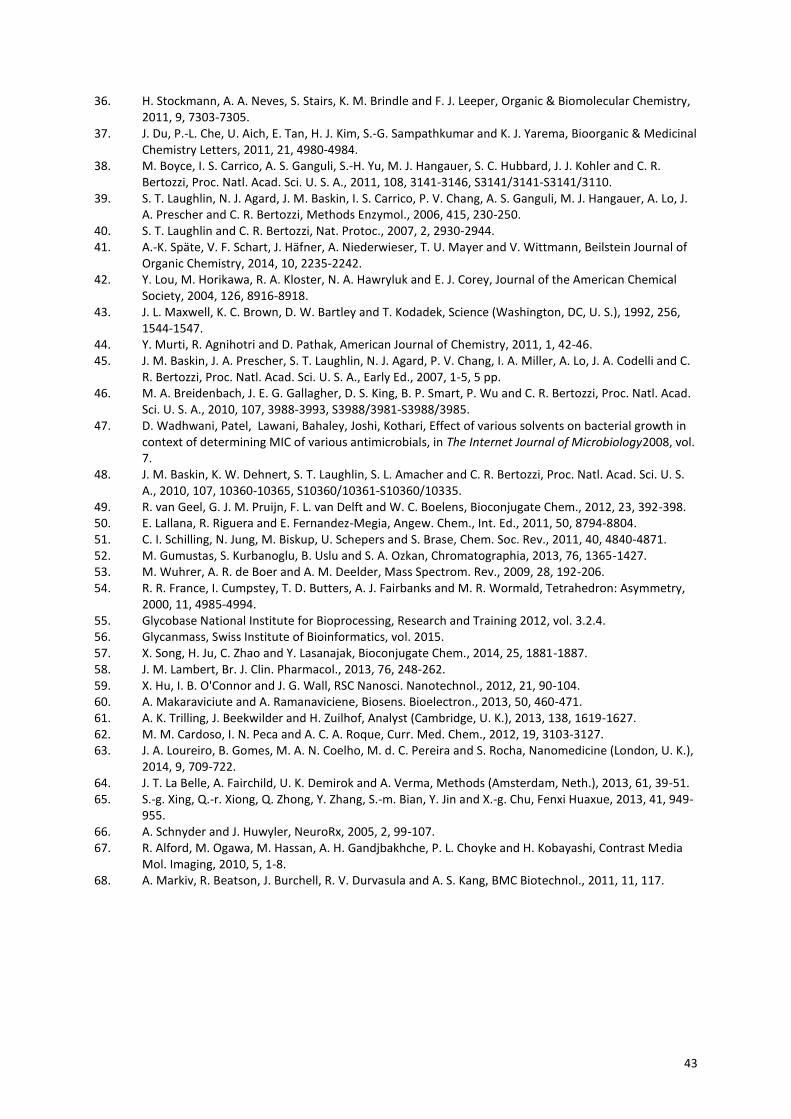
43
36. H. Stockmann, A. A. Neves, S. Stairs, K. M. Brindle and F. J. Leeper, Organic & Biomolecular Chemistry, 2011, 9, 7303-7305.
37. J. Du, P.-L. Che, U. Aich, E. Tan, H. J. Kim, S.-G. Sampathkumar and K. J. Yarema, Bioorganic & Medicinal Chemistry Letters, 2011, 21, 4980-4984.
38. M. Boyce, I. S. Carrico, A. S. Ganguli, S.-H. Yu, M. J. Hangauer, S. C. Hubbard, J. J. Kohler and C. R. Bertozzi, Proc. Natl. Acad. Sci. U. S. A., 2011, 108, 3141-3146, S3141/3141-S3141/3110.
39. S. T. Laughlin, N. J. Agard, J. M. Baskin, I. S. Carrico, P. V. Chang, A. S. Ganguli, M. J. Hangauer, A. Lo, J. A. Prescher and C. R. Bertozzi, Methods Enzymol., 2006, 415, 230-250.
40. S. T. Laughlin and C. R. Bertozzi, Nat. Protoc., 2007, 2, 2930-2944. 41. A.-K. Späte, V. F. Schart, J. Häfner, A. Niederwieser, T. U. Mayer and V. Wittmann, Beilstein Journal of
Organic Chemistry, 2014, 10, 2235-2242. 42. Y. Lou, M. Horikawa, R. A. Kloster, N. A. Hawryluk and E. J. Corey, Journal of the American Chemical
Society, 2004, 126, 8916-8918. 43. J. L. Maxwell, K. C. Brown, D. W. Bartley and T. Kodadek, Science (Washington, DC, U. S.), 1992, 256,
1544-1547. 44. Y. Murti, R. Agnihotri and D. Pathak, American Journal of Chemistry, 2011, 1, 42-46. 45. J. M. Baskin, J. A. Prescher, S. T. Laughlin, N. J. Agard, P. V. Chang, I. A. Miller, A. Lo, J. A. Codelli and C.
R. Bertozzi, Proc. Natl. Acad. Sci. U. S. A., Early Ed., 2007, 1-5, 5 pp. 46. M. A. Breidenbach, J. E. G. Gallagher, D. S. King, B. P. Smart, P. Wu and C. R. Bertozzi, Proc. Natl. Acad.
Sci. U. S. A., 2010, 107, 3988-3993, S3988/3981-S3988/3985. 47. D. Wadhwani, Patel, Lawani, Bahaley, Joshi, Kothari, Effect of various solvents on bacterial growth in
context of determining MIC of various antimicrobials, in The Internet Journal of Microbiology2008, vol. 7.
48. J. M. Baskin, K. W. Dehnert, S. T. Laughlin, S. L. Amacher and C. R. Bertozzi, Proc. Natl. Acad. Sci. U. S. A., 2010, 107, 10360-10365, S10360/10361-S10360/10335.
49. R. van Geel, G. J. M. Pruijn, F. L. van Delft and W. C. Boelens, Bioconjugate Chem., 2012, 23, 392-398. 50. E. Lallana, R. Riguera and E. Fernandez-Megia, Angew. Chem., Int. Ed., 2011, 50, 8794-8804. 51. C. I. Schilling, N. Jung, M. Biskup, U. Schepers and S. Brase, Chem. Soc. Rev., 2011, 40, 4840-4871. 52. M. Gumustas, S. Kurbanoglu, B. Uslu and S. A. Ozkan, Chromatographia, 2013, 76, 1365-1427. 53. M. Wuhrer, A. R. de Boer and A. M. Deelder, Mass Spectrom. Rev., 2009, 28, 192-206. 54. R. R. France, I. Cumpstey, T. D. Butters, A. J. Fairbanks and M. R. Wormald, Tetrahedron: Asymmetry,
2000, 11, 4985-4994. 55. Glycobase National Institute for Bioprocessing, Research and Training 2012, vol. 3.2.4. 56. Glycanmass, Swiss Institute of Bioinformatics, vol. 2015. 57. X. Song, H. Ju, C. Zhao and Y. Lasanajak, Bioconjugate Chem., 2014, 25, 1881-1887. 58. J. M. Lambert, Br. J. Clin. Pharmacol., 2013, 76, 248-262. 59. X. Hu, I. B. O'Connor and J. G. Wall, RSC Nanosci. Nanotechnol., 2012, 21, 90-104. 60. A. Makaraviciute and A. Ramanaviciene, Biosens. Bioelectron., 2013, 50, 460-471. 61. A. K. Trilling, J. Beekwilder and H. Zuilhof, Analyst (Cambridge, U. K.), 2013, 138, 1619-1627. 62. M. M. Cardoso, I. N. Peca and A. C. A. Roque, Curr. Med. Chem., 2012, 19, 3103-3127. 63. J. A. Loureiro, B. Gomes, M. A. N. Coelho, M. d. C. Pereira and S. Rocha, Nanomedicine (London, U. K.),
2014, 9, 709-722. 64. J. T. La Belle, A. Fairchild, U. K. Demirok and A. Verma, Methods (Amsterdam, Neth.), 2013, 61, 39-51. 65. S.-g. Xing, Q.-r. Xiong, Q. Zhong, Y. Zhang, S.-m. Bian, Y. Jin and X.-g. Chu, Fenxi Huaxue, 2013, 41, 949-
955. 66. A. Schnyder and J. Huwyler, NeuroRx, 2005, 2, 99-107. 67. R. Alford, M. Ogawa, M. Hassan, A. H. Gandjbakhche, P. L. Choyke and H. Kobayashi, Contrast Media
Mol. Imaging, 2010, 5, 1-8. 68. A. Markiv, R. Beatson, J. Burchell, R. V. Durvasula and A. S. Kang, BMC Biotechnol., 2011, 11, 117.
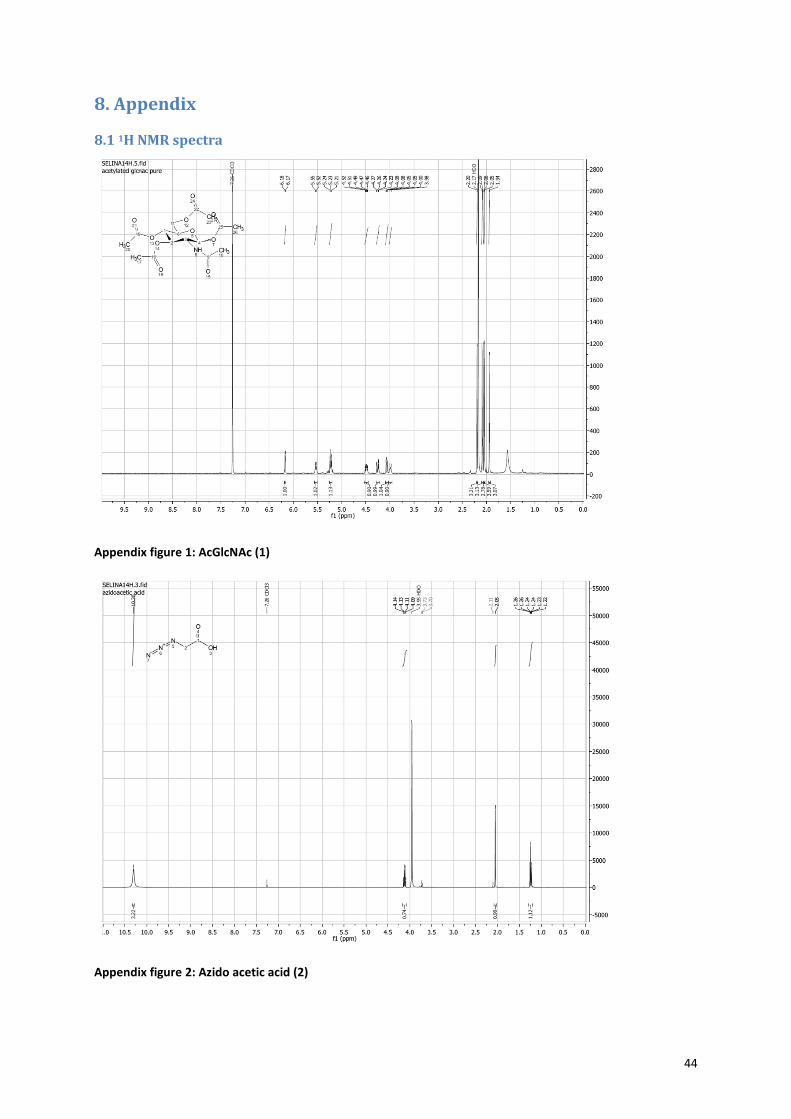
44
8. Appendix
8.1 1H NMR spectra
Appendix figure 1: AcGlcNAc (1)
Appendix figure 2: Azido acetic acid (2)
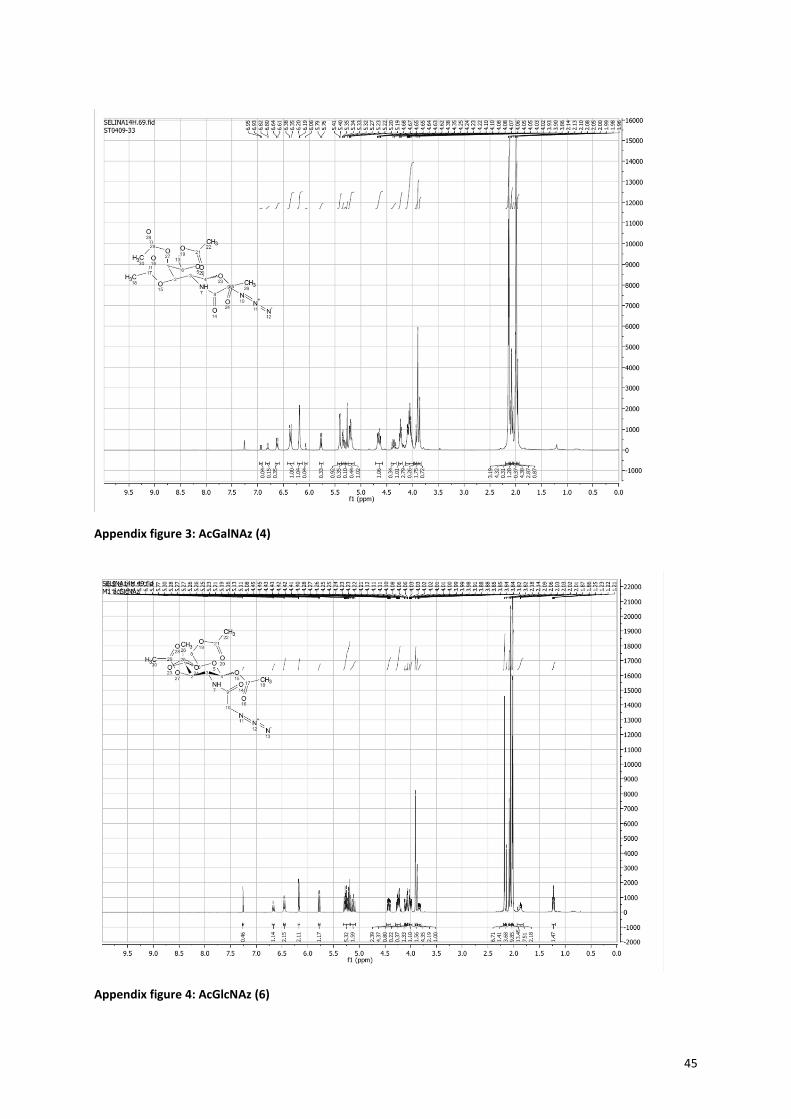
45
Appendix figure 3: AcGalNAz (4)
Appendix figure 4: AcGlcNAz (6)
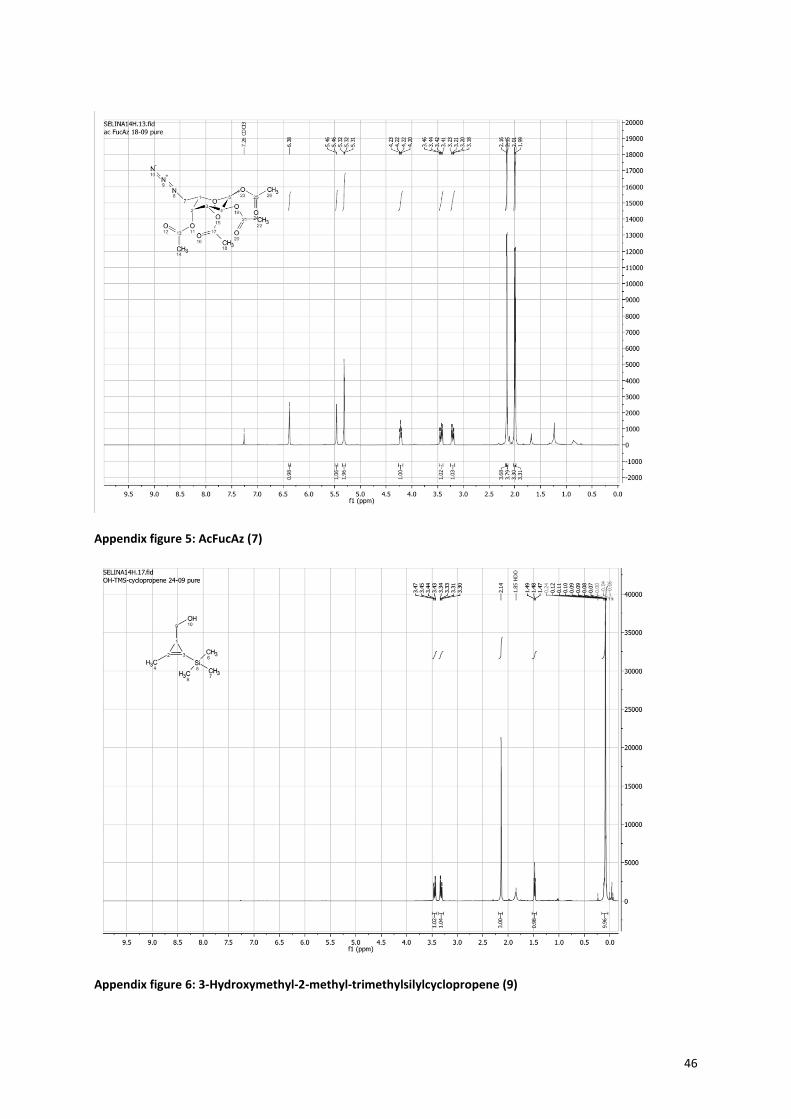
46
Appendix figure 5: AcFucAz (7)
Appendix figure 6: 3-Hydroxymethyl-2-methyl-trimethylsilylcyclopropene (9)

47
Appendix figure 7: (2-methylcycloprop-2-en-1-yl)methyl (4-nitrophenyl) carbonate (11)
Appendix figure 8: AcGalNCyc (13)
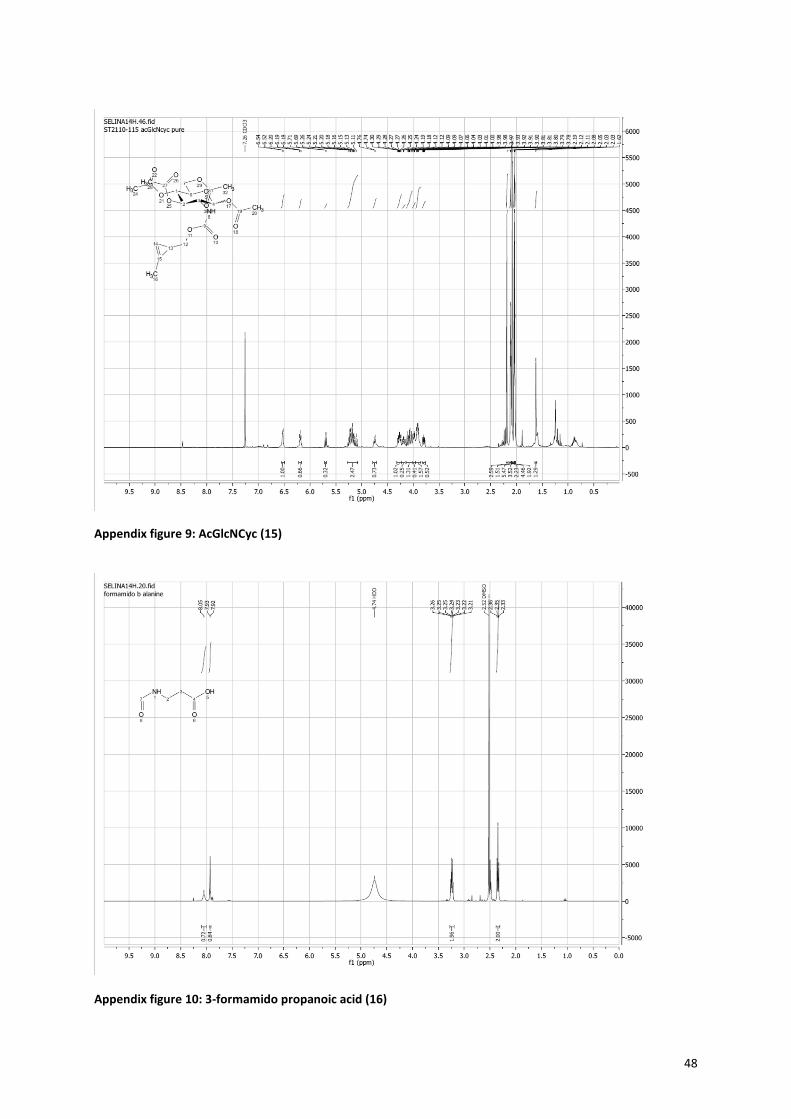
48
Appendix figure 9: AcGlcNCyc (15)
Appendix figure 10: 3-formamido propanoic acid (16)
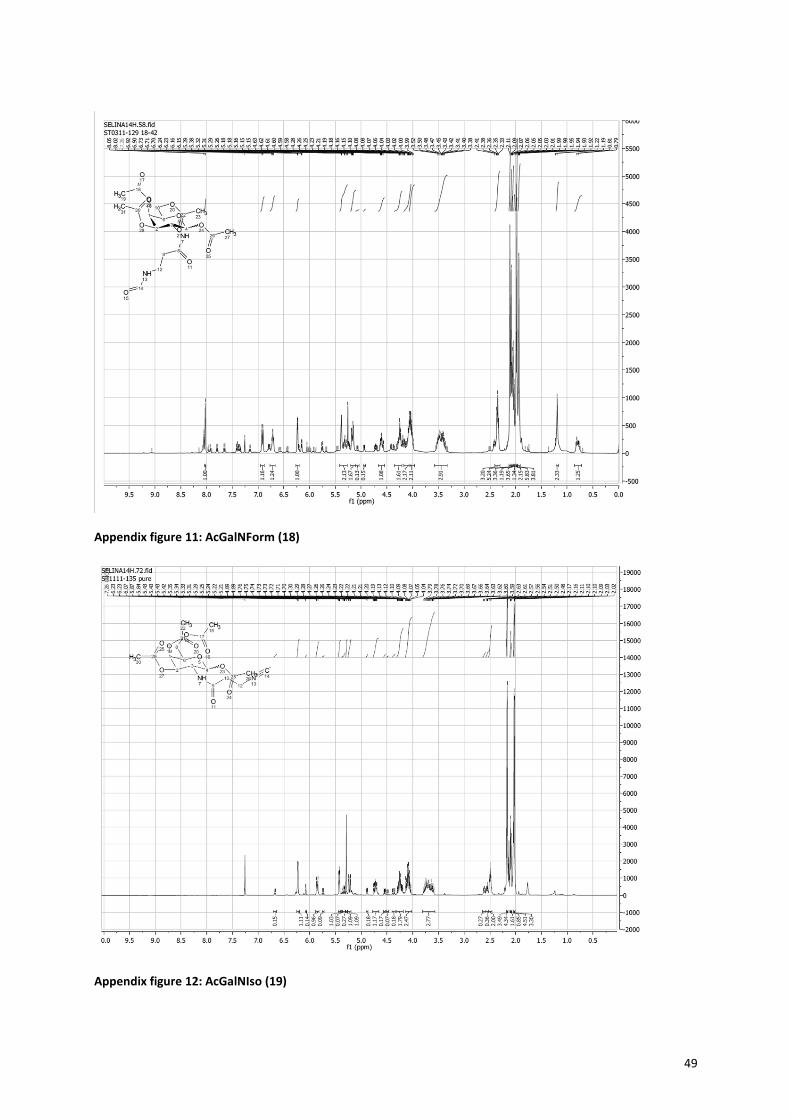
49
Appendix figure 11: AcGalNForm (18)
Appendix figure 12: AcGalNIso (19)
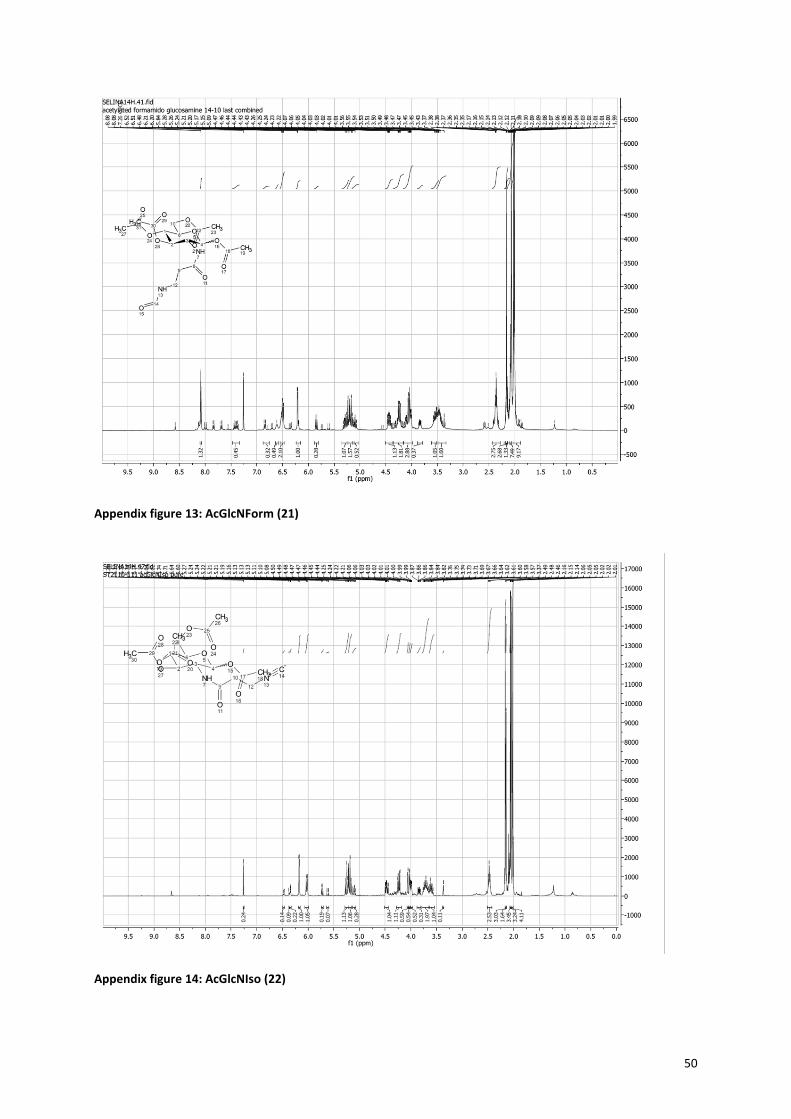
50
Appendix figure 13: AcGlcNForm (21)
Appendix figure 14: AcGlcNIso (22)
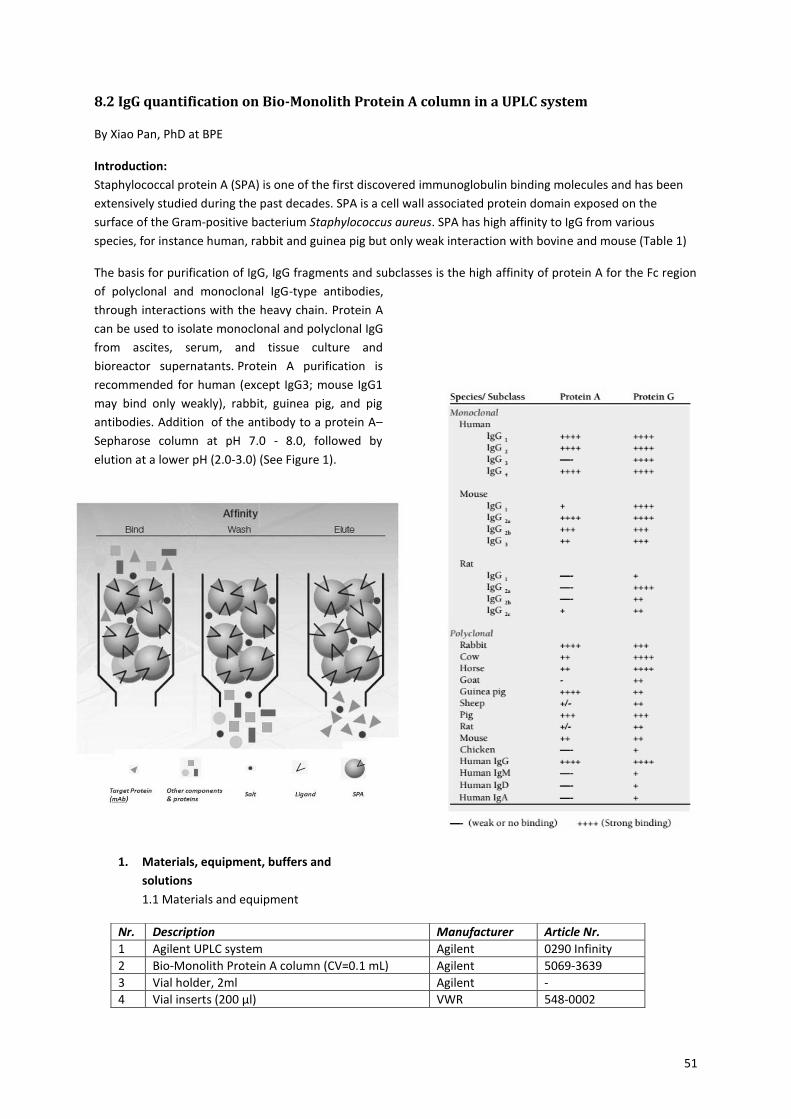
51
8.2 IgG quantification on Bio-Monolith Protein A column in a UPLC system
By Xiao Pan, PhD at BPE
Introduction:
Staphylococcal protein A (SPA) is one of the first discovered immunoglobulin binding molecules and has been
extensively studied during the past decades. SPA is a cell wall associated protein domain exposed on the
surface of the Gram-positive bacterium Staphylococcus aureus. SPA has high affinity to IgG from various
species, for instance human, rabbit and guinea pig but only weak interaction with bovine and mouse (Table 1)
The basis for purification of IgG, IgG fragments and subclasses is the high affinity of protein A for the Fc region
of polyclonal and monoclonal IgG-type antibodies,
through interactions with the heavy chain. Protein A
can be used to isolate monoclonal and polyclonal IgG
from ascites, serum, and tissue culture and
bioreactor supernatants. Protein A purification is
recommended for human (except IgG3; mouse IgG1
may bind only weakly), rabbit, guinea pig, and pig
antibodies. Addition of the antibody to a protein A–
Sepharose column at pH 7.0 - 8.0, followed by
elution at a lower pH (2.0-3.0) (See Figure 1).
1. Materials, equipment, buffers and
solutions
1.1 Materials and equipment
Nr. Description Manufacturer Article Nr.
1 Agilent UPLC system Agilent 0290 Infinity
2 Bio-Monolith Protein A column (CV=0.1 mL) Agilent 5069-3639
3 Vial holder, 2ml Agilent -
4 Vial inserts (200 µl) VWR 548-0002
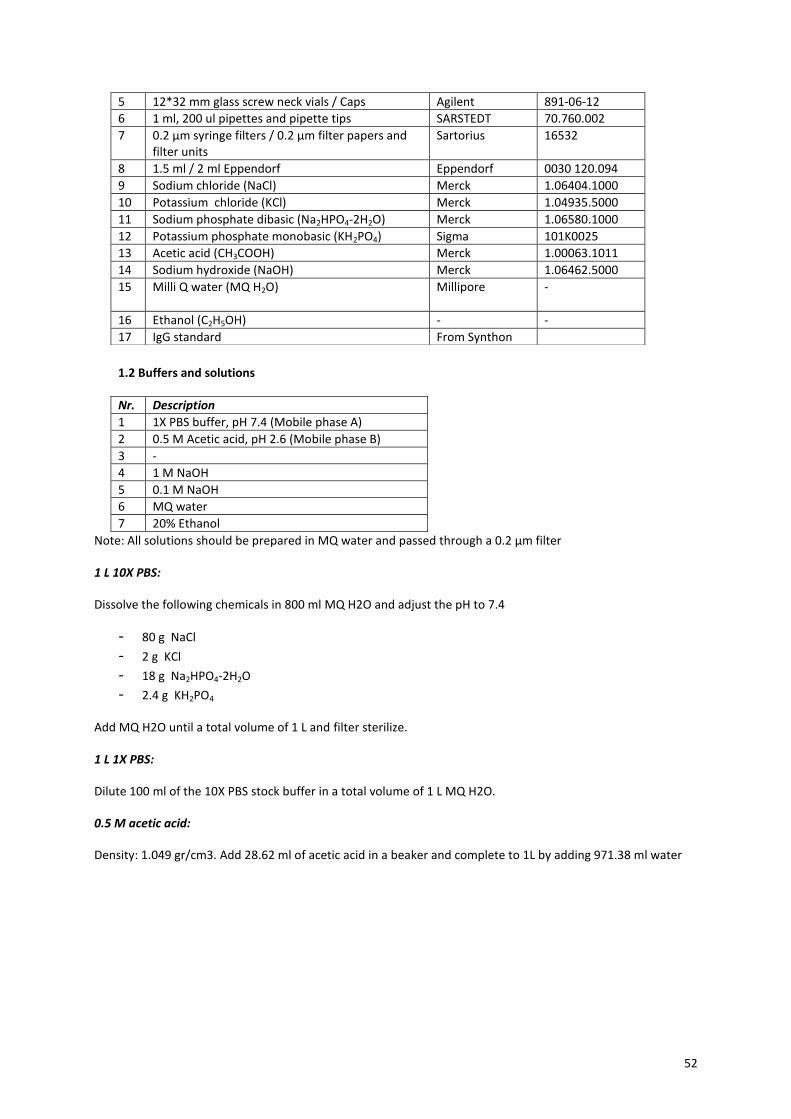
52
1.2 Buffers and solutions
Nr. Description
1 1X PBS buffer, pH 7.4 (Mobile phase A)
2 0.5 M Acetic acid, pH 2.6 (Mobile phase B)
3 -
4 1 M NaOH
5 0.1 M NaOH
6 MQ water
7 20% Ethanol
Note: All solutions should be prepared in MQ water and passed through a 0.2 µm filter
1 L 10X PBS:
Dissolve the following chemicals in 800 ml MQ H2O and adjust the pH to 7.4
- 80 g NaCl
- 2 g KCl
- 18 g Na2HPO4-2H2O
- 2.4 g KH2PO4
Add MQ H2O until a total volume of 1 L and filter sterilize.
1 L 1X PBS:
Dilute 100 ml of the 10X PBS stock buffer in a total volume of 1 L MQ H2O.
0.5 M acetic acid:
Density: 1.049 gr/cm3. Add 28.62 ml of acetic acid in a beaker and complete to 1L by adding 971.38 ml water
5 12*32 mm glass screw neck vials / Caps Agilent 891-06-12
6 1 ml, 200 ul pipettes and pipette tips SARSTEDT 70.760.002
7 0.2 µm syringe filters / 0.2 µm filter papers and filter units
Sartorius 16532
8 1.5 ml / 2 ml Eppendorf Eppendorf 0030 120.094
9 Sodium chloride (NaCl) Merck 1.06404.1000
10 Potassium chloride (KCl) Merck 1.04935.5000
11 Sodium phosphate dibasic (Na2HPO4-2H2O) Merck 1.06580.1000
12 Potassium phosphate monobasic (KH2PO4) Sigma 101K0025
13 Acetic acid (CH3COOH) Merck 1.00063.1011
14 Sodium hydroxide (NaOH) Merck 1.06462.5000
15 Milli Q water (MQ H2O) Millipore
-
16 Ethanol (C2H5OH) - -
17 IgG standard From Synthon
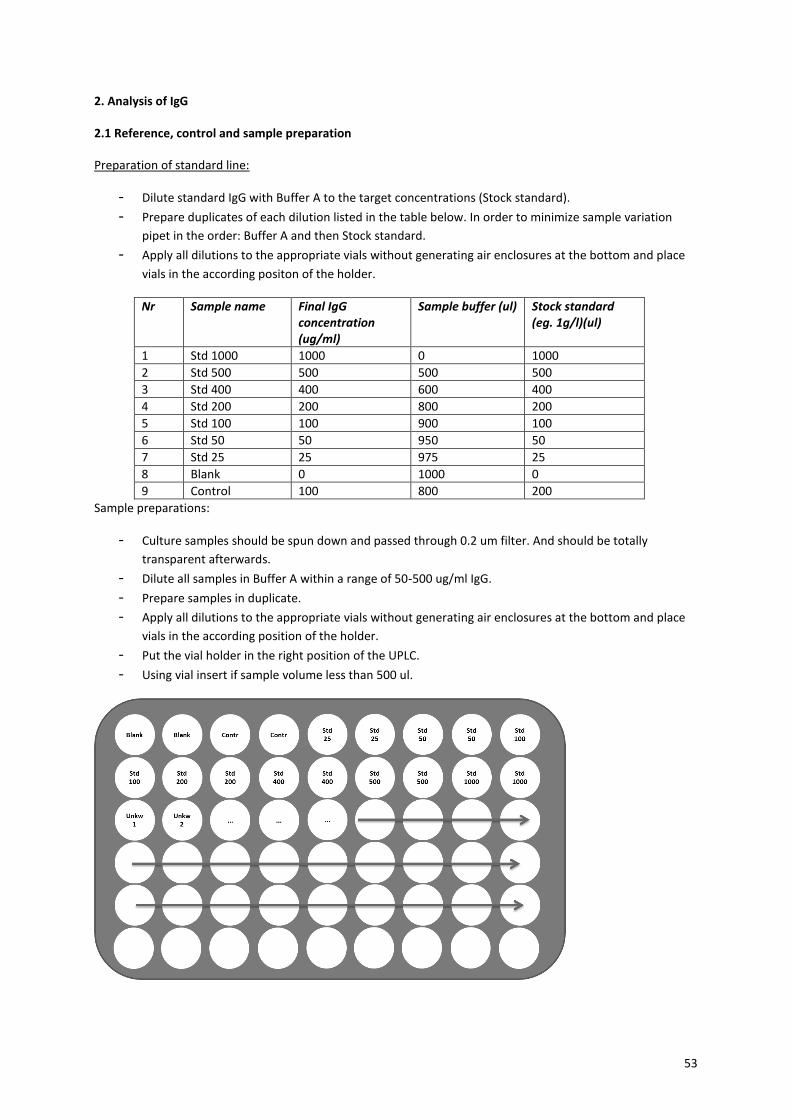
53
2. Analysis of IgG
2.1 Reference, control and sample preparation
Preparation of standard line:
- Dilute standard IgG with Buffer A to the target concentrations (Stock standard).
- Prepare duplicates of each dilution listed in the table below. In order to minimize sample variation
pipet in the order: Buffer A and then Stock standard.
- Apply all dilutions to the appropriate vials without generating air enclosures at the bottom and place
vials in the according positon of the holder.
Nr Sample name Final IgG concentration (ug/ml)
Sample buffer (ul) Stock standard (eg. 1g/l)(ul)
1 Std 1000 1000 0 1000
2 Std 500 500 500 500
3 Std 400 400 600 400
4 Std 200 200 800 200
5 Std 100 100 900 100
6 Std 50 50 950 50
7 Std 25 25 975 25
8 Blank 0 1000 0
9 Control 100 800 200
Sample preparations:
- Culture samples should be spun down and passed through 0.2 um filter. And should be totally
transparent afterwards.
- Dilute all samples in Buffer A within a range of 50-500 ug/ml IgG.
- Prepare samples in duplicate.
- Apply all dilutions to the appropriate vials without generating air enclosures at the bottom and place
vials in the according position of the holder.
- Put the vial holder in the right position of the UPLC.
- Using vial insert if sample volume less than 500 ul.
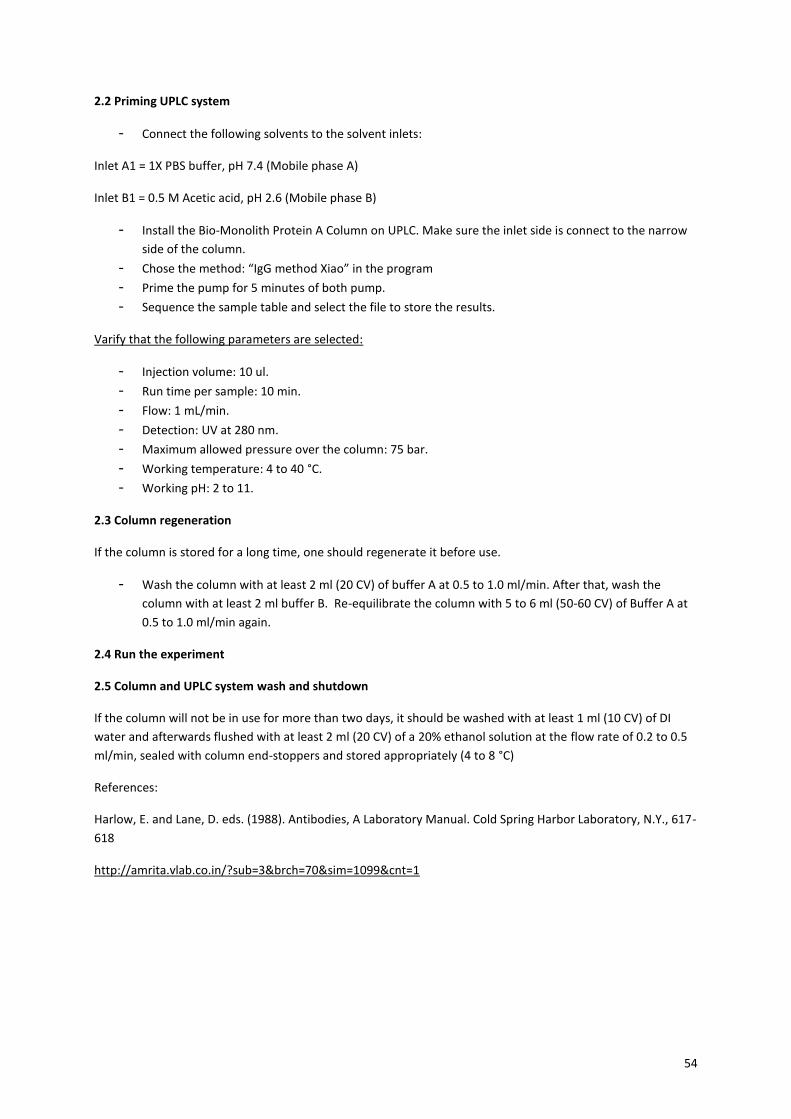
54
2.2 Priming UPLC system
- Connect the following solvents to the solvent inlets:
Inlet A1 = 1X PBS buffer, pH 7.4 (Mobile phase A)
Inlet B1 = 0.5 M Acetic acid, pH 2.6 (Mobile phase B)
- Install the Bio-Monolith Protein A Column on UPLC. Make sure the inlet side is connect to the narrow
side of the column.
- Chose the method: “IgG method Xiao” in the program
- Prime the pump for 5 minutes of both pump.
- Sequence the sample table and select the file to store the results.
Varify that the following parameters are selected:
- Injection volume: 10 ul.
- Run time per sample: 10 min.
- Flow: 1 mL/min.
- Detection: UV at 280 nm.
- Maximum allowed pressure over the column: 75 bar.
- Working temperature: 4 to 40 °C.
- Working pH: 2 to 11.
2.3 Column regeneration
If the column is stored for a long time, one should regenerate it before use.
- Wash the column with at least 2 ml (20 CV) of buffer A at 0.5 to 1.0 ml/min. After that, wash the
column with at least 2 ml buffer B. Re-equilibrate the column with 5 to 6 ml (50-60 CV) of Buffer A at
0.5 to 1.0 ml/min again.
2.4 Run the experiment
2.5 Column and UPLC system wash and shutdown
If the column will not be in use for more than two days, it should be washed with at least 1 ml (10 CV) of DI
water and afterwards flushed with at least 2 ml (20 CV) of a 20% ethanol solution at the flow rate of 0.2 to 0.5
ml/min, sealed with column end-stoppers and stored appropriately (4 to 8 °C)
References:
Harlow, E. and Lane, D. eds. (1988). Antibodies, A Laboratory Manual. Cold Spring Harbor Laboratory, N.Y., 617-
618
http://amrita.vlab.co.in/?sub=3&brch=70&sim=1099&cnt=1
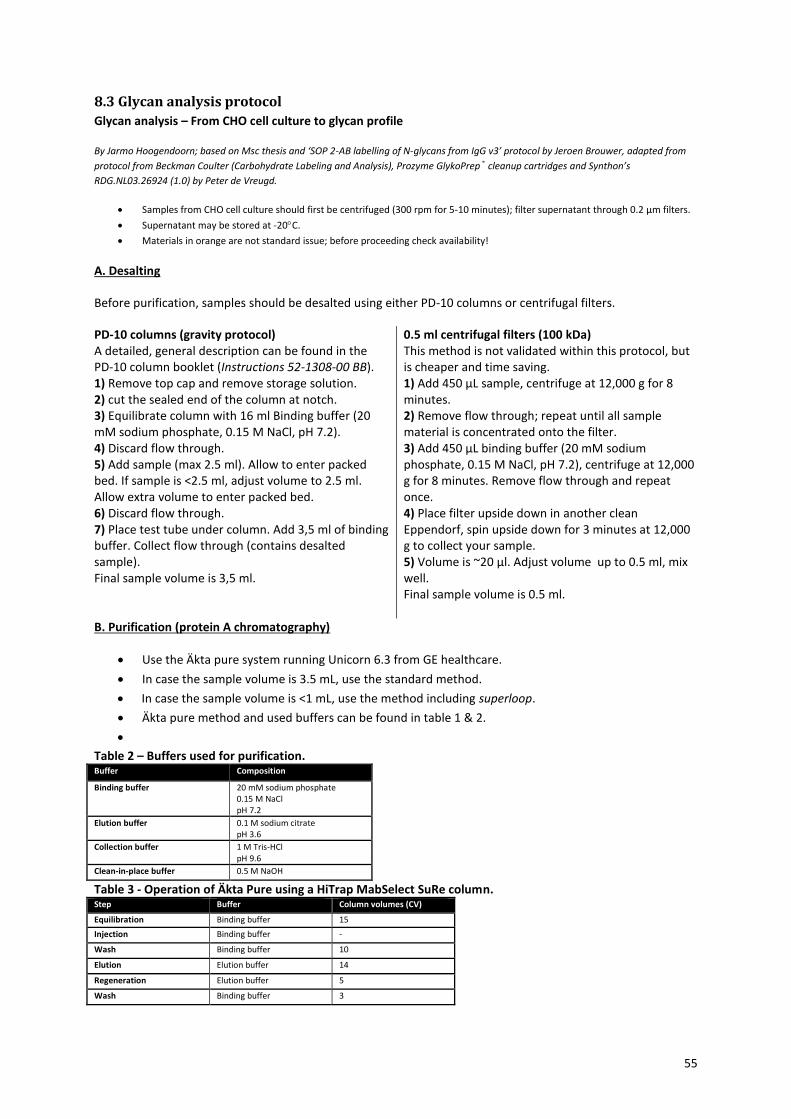
55
8.3 Glycan analysis protocol
Glycan analysis – From CHO cell culture to glycan profile
By Jarmo Hoogendoorn; based on Msc thesis and ‘SOP 2-AB labelling of N-glycans from IgG v3’ protocol by Jeroen Brouwer, adapted from
protocol from Beckman Coulter (Carbohydrate Labeling and Analysis), Prozyme GlykoPrep® cleanup cartridges and Synthon’s
RDG.NL03.26924 (1.0) by Peter de Vreugd.
Samples from CHO cell culture should first be centrifuged (300 rpm for 5-10 minutes); filter supernatant through 0.2 µm filters.
Supernatant may be stored at -20C.
Materials in orange are not standard issue; before proceeding check availability!
A. Desalting
Before purification, samples should be desalted using either PD-10 columns or centrifugal filters.
PD-10 columns (gravity protocol) A detailed, general description can be found in the PD-10 column booklet (Instructions 52-1308-00 BB). 1) Remove top cap and remove storage solution. 2) cut the sealed end of the column at notch. 3) Equilibrate column with 16 ml Binding buffer (20 mM sodium phosphate, 0.15 M NaCl, pH 7.2). 4) Discard flow through. 5) Add sample (max 2.5 ml). Allow to enter packed bed. If sample is <2.5 ml, adjust volume to 2.5 ml. Allow extra volume to enter packed bed. 6) Discard flow through. 7) Place test tube under column. Add 3,5 ml of binding buffer. Collect flow through (contains desalted sample). Final sample volume is 3,5 ml.
0.5 ml centrifugal filters (100 kDa) This method is not validated within this protocol, but is cheaper and time saving. 1) Add 450 μL sample, centrifuge at 12,000 g for 8 minutes. 2) Remove flow through; repeat until all sample material is concentrated onto the filter. 3) Add 450 μL binding buffer (20 mM sodium phosphate, 0.15 M NaCl, pH 7.2), centrifuge at 12,000 g for 8 minutes. Remove flow through and repeat once. 4) Place filter upside down in another clean Eppendorf, spin upside down for 3 minutes at 12,000 g to collect your sample. 5) Volume is ~20 µl. Adjust volume up to 0.5 ml, mix well. Final sample volume is 0.5 ml.
B. Purification (protein A chromatography)
Use the Äkta pure system running Unicorn 6.3 from GE healthcare.
In case the sample volume is 3.5 mL, use the standard method.
In case the sample volume is <1 mL, use the method including superloop.
Äkta pure method and used buffers can be found in table 1 & 2.
Table 2 – Buffers used for purification. Buffer Composition
Binding buffer 20 mM sodium phosphate 0.15 M NaCl pH 7.2
Elution buffer 0.1 M sodium citrate pH 3.6
Collection buffer 1 M Tris-HCl pH 9.6
Clean-in-place buffer 0.5 M NaOH
Table 3 - Operation of Äkta Pure using a HiTrap MabSelect SuRe column. Step Buffer Column volumes (CV)
Equilibration Binding buffer 15
Injection Binding buffer -
Wash Binding buffer 10
Elution Elution buffer 14
Regeneration Elution buffer 5
Wash Binding buffer 3
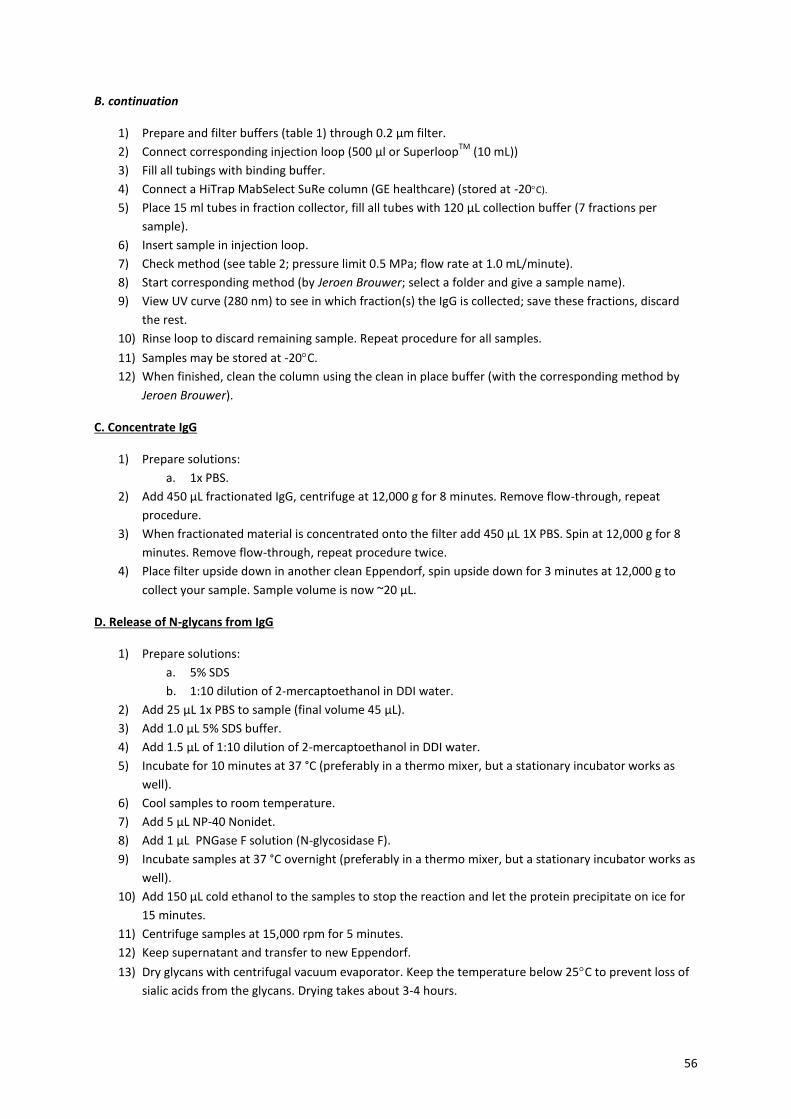
56
B. continuation
1) Prepare and filter buffers (table 1) through 0.2 µm filter.
2) Connect corresponding injection loop (500 µl or SuperloopTM
(10 mL))
3) Fill all tubings with binding buffer.
4) Connect a HiTrap MabSelect SuRe column (GE healthcare) (stored at -20C).
5) Place 15 ml tubes in fraction collector, fill all tubes with 120 µL collection buffer (7 fractions per
sample).
6) Insert sample in injection loop.
7) Check method (see table 2; pressure limit 0.5 MPa; flow rate at 1.0 mL/minute).
8) Start corresponding method (by Jeroen Brouwer; select a folder and give a sample name).
9) View UV curve (280 nm) to see in which fraction(s) the IgG is collected; save these fractions, discard
the rest.
10) Rinse loop to discard remaining sample. Repeat procedure for all samples.
11) Samples may be stored at -20C.
12) When finished, clean the column using the clean in place buffer (with the corresponding method by
Jeroen Brouwer).
C. Concentrate IgG
1) Prepare solutions:
a. 1x PBS.
2) Add 450 μL fractionated IgG, centrifuge at 12,000 g for 8 minutes. Remove flow-through, repeat
procedure.
3) When fractionated material is concentrated onto the filter add 450 μL 1X PBS. Spin at 12,000 g for 8
minutes. Remove flow-through, repeat procedure twice.
4) Place filter upside down in another clean Eppendorf, spin upside down for 3 minutes at 12,000 g to
collect your sample. Sample volume is now ~20 µL.
D. Release of N-glycans from IgG
1) Prepare solutions:
a. 5% SDS
b. 1:10 dilution of 2-mercaptoethanol in DDI water.
2) Add 25 µL 1x PBS to sample (final volume 45 µL).
3) Add 1.0 μL 5% SDS buffer.
4) Add 1.5 μL of 1:10 dilution of 2-mercaptoethanol in DDI water.
5) Incubate for 10 minutes at 37 °C (preferably in a thermo mixer, but a stationary incubator works as
well).
6) Cool samples to room temperature.
7) Add 5 μL NP-40 Nonidet.
8) Add 1 μL PNGase F solution (N-glycosidase F).
9) Incubate samples at 37 °C overnight (preferably in a thermo mixer, but a stationary incubator works as
well).
10) Add 150 μL cold ethanol to the samples to stop the reaction and let the protein precipitate on ice for
15 minutes.
11) Centrifuge samples at 15,000 rpm for 5 minutes.
12) Keep supernatant and transfer to new Eppendorf.
13) Dry glycans with centrifugal vacuum evaporator. Keep the temperature below 25C to prevent loss of
sialic acids from the glycans. Drying takes about 3-4 hours.
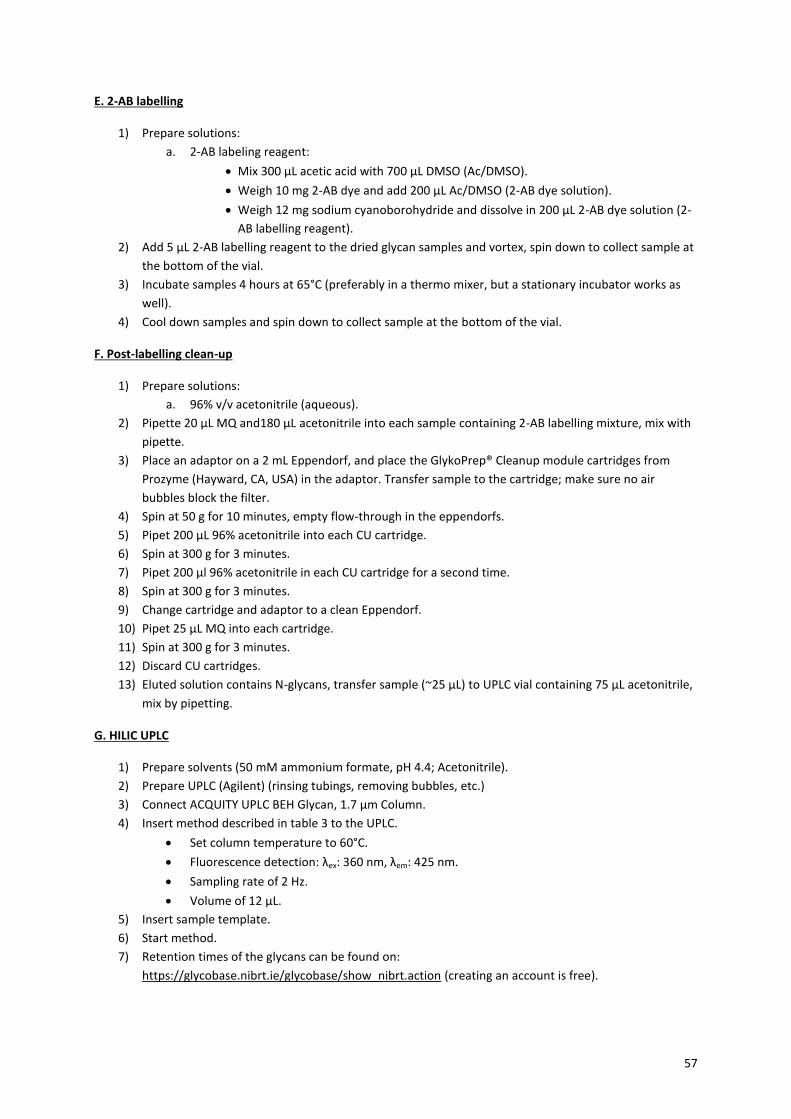
57
E. 2-AB labelling
1) Prepare solutions:
a. 2-AB labeling reagent:
Mix 300 μL acetic acid with 700 μL DMSO (Ac/DMSO).
Weigh 10 mg 2-AB dye and add 200 μL Ac/DMSO (2-AB dye solution).
Weigh 12 mg sodium cyanoborohydride and dissolve in 200 μL 2-AB dye solution (2-
AB labelling reagent).
2) Add 5 μL 2-AB labelling reagent to the dried glycan samples and vortex, spin down to collect sample at
the bottom of the vial.
3) Incubate samples 4 hours at 65°C (preferably in a thermo mixer, but a stationary incubator works as
well).
4) Cool down samples and spin down to collect sample at the bottom of the vial.
F. Post-labelling clean-up
1) Prepare solutions:
a. 96% v/v acetonitrile (aqueous).
2) Pipette 20 μL MQ and180 μL acetonitrile into each sample containing 2-AB labelling mixture, mix with
pipette.
3) Place an adaptor on a 2 mL Eppendorf, and place the GlykoPrep® Cleanup module cartridges from
Prozyme (Hayward, CA, USA) in the adaptor. Transfer sample to the cartridge; make sure no air
bubbles block the filter.
4) Spin at 50 g for 10 minutes, empty flow-through in the eppendorfs.
5) Pipet 200 μL 96% acetonitrile into each CU cartridge.
6) Spin at 300 g for 3 minutes.
7) Pipet 200 μl 96% acetonitrile in each CU cartridge for a second time.
8) Spin at 300 g for 3 minutes.
9) Change cartridge and adaptor to a clean Eppendorf.
10) Pipet 25 μL MQ into each cartridge.
11) Spin at 300 g for 3 minutes.
12) Discard CU cartridges.
13) Eluted solution contains N-glycans, transfer sample (~25 μL) to UPLC vial containing 75 μL acetonitrile,
mix by pipetting.
G. HILIC UPLC
1) Prepare solvents (50 mM ammonium formate, pH 4.4; Acetonitrile).
2) Prepare UPLC (Agilent) (rinsing tubings, removing bubbles, etc.)
3) Connect ACQUITY UPLC BEH Glycan, 1.7 µm Column.
4) Insert method described in table 3 to the UPLC.
Set column temperature to 60°C.
Fluorescence detection: λex: 360 nm, λem: 425 nm.
Sampling rate of 2 Hz.
Volume of 12 µL.
5) Insert sample template.
6) Start method.
7) Retention times of the glycans can be found on:
https://glycobase.nibrt.ie/glycobase/show_nibrt.action (creating an account is free).
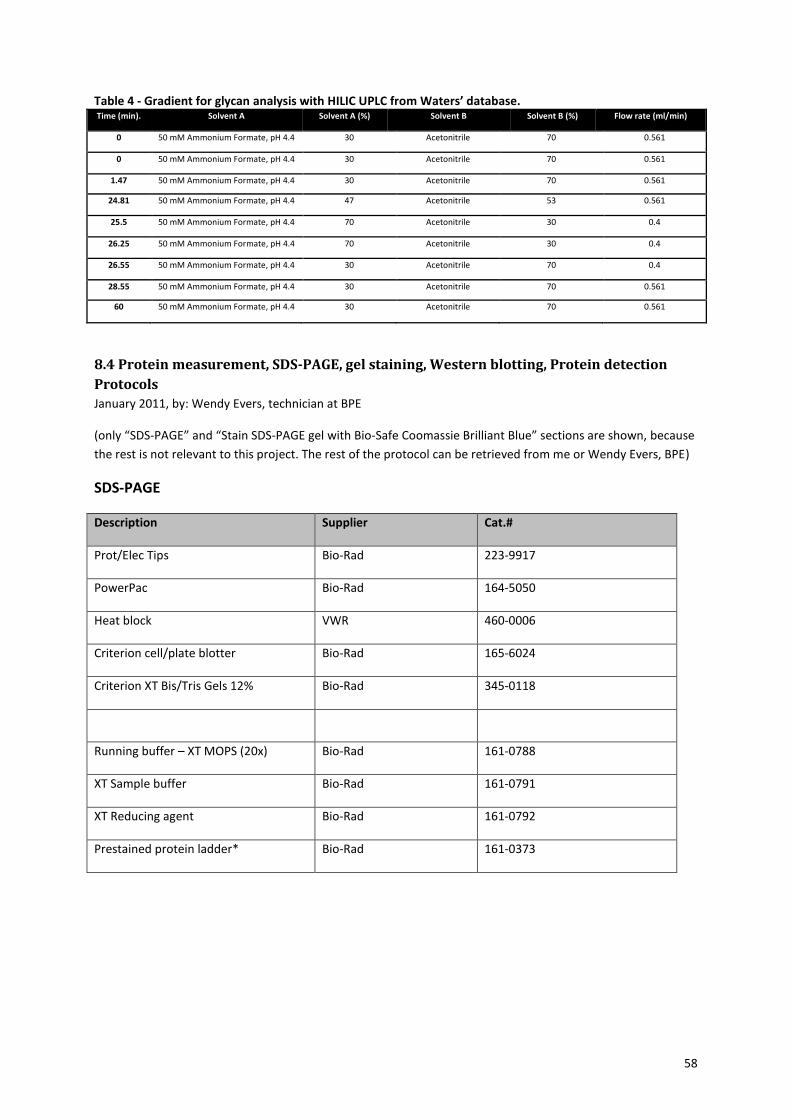
58
Table 4 - Gradient for glycan analysis with HILIC UPLC from Waters’ database. Time (min). Solvent A Solvent A (%) Solvent B Solvent B (%) Flow rate (ml/min)
0 50 mM Ammonium Formate, pH 4.4 30 Acetonitrile 70 0.561
0 50 mM Ammonium Formate, pH 4.4 30 Acetonitrile 70 0.561
1.47 50 mM Ammonium Formate, pH 4.4 30 Acetonitrile 70 0.561
24.81 50 mM Ammonium Formate, pH 4.4 47 Acetonitrile 53 0.561
25.5 50 mM Ammonium Formate, pH 4.4 70 Acetonitrile 30 0.4
26.25 50 mM Ammonium Formate, pH 4.4 70 Acetonitrile 30 0.4
26.55 50 mM Ammonium Formate, pH 4.4 30 Acetonitrile 70 0.4
28.55 50 mM Ammonium Formate, pH 4.4 30 Acetonitrile 70 0.561
60 50 mM Ammonium Formate, pH 4.4 30 Acetonitrile 70 0.561
8.4 Protein measurement, SDS-PAGE, gel staining, Western blotting, Protein detection
Protocols
January 2011, by: Wendy Evers, technician at BPE
(only “SDS-PAGE” and “Stain SDS-PAGE gel with Bio-Safe Coomassie Brilliant Blue” sections are shown, because
the rest is not relevant to this project. The rest of the protocol can be retrieved from me or Wendy Evers, BPE)
SDS-PAGE
Description Supplier Cat.#
Prot/Elec Tips Bio-Rad 223-9917
PowerPac Bio-Rad 164-5050
Heat block VWR 460-0006
Criterion cell/plate blotter Bio-Rad 165-6024
Criterion XT Bis/Tris Gels 12% Bio-Rad 345-0118
Running buffer – XT MOPS (20x) Bio-Rad 161-0788
XT Sample buffer Bio-Rad 161-0791
XT Reducing agent Bio-Rad 161-0792
Prestained protein ladder* Bio-Rad 161-0373
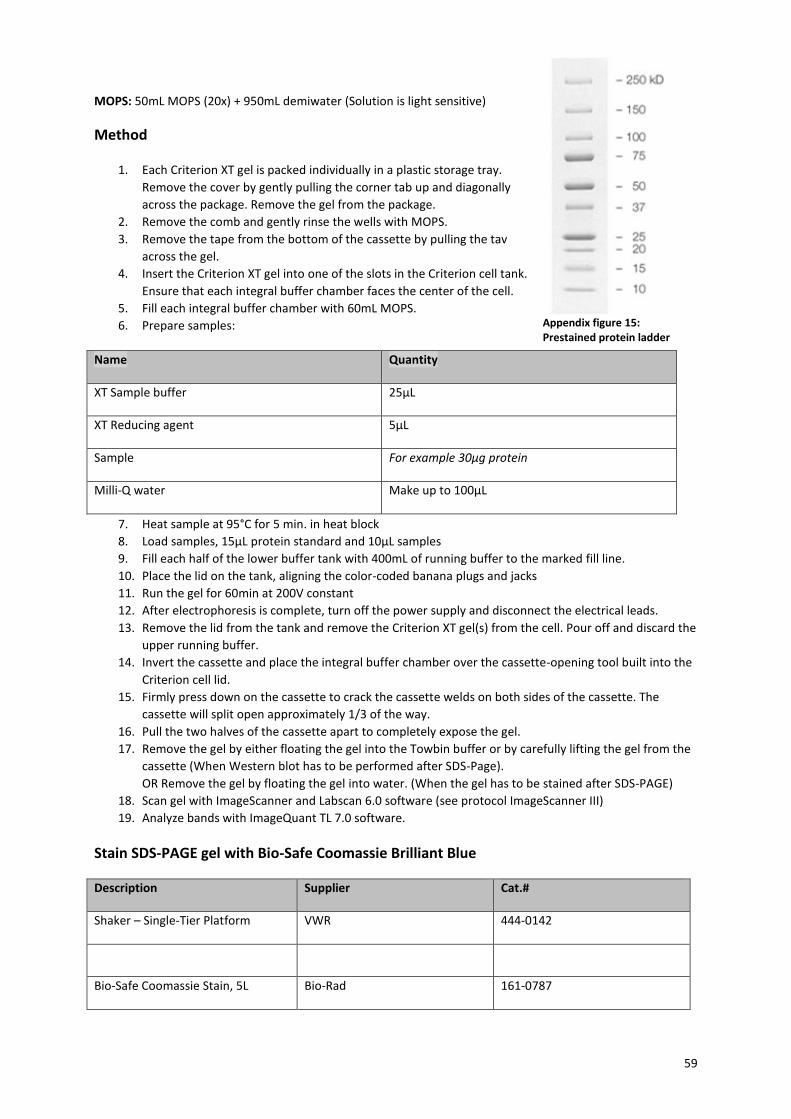
59
MOPS: 50mL MOPS (20x) + 950mL demiwater (Solution is light sensitive)
Method
1. Each Criterion XT gel is packed individually in a plastic storage tray.
Remove the cover by gently pulling the corner tab up and diagonally
across the package. Remove the gel from the package.
2. Remove the comb and gently rinse the wells with MOPS.
3. Remove the tape from the bottom of the cassette by pulling the tav
across the gel.
4. Insert the Criterion XT gel into one of the slots in the Criterion cell tank.
Ensure that each integral buffer chamber faces the center of the cell.
5. Fill each integral buffer chamber with 60mL MOPS.
6. Prepare samples:
Name Quantity
XT Sample buffer 25µL
XT Reducing agent 5µL
Sample For example 30µg protein
Milli-Q water Make up to 100µL
7. Heat sample at 95°C for 5 min. in heat block
8. Load samples, 15µL protein standard and 10µL samples
9. Fill each half of the lower buffer tank with 400mL of running buffer to the marked fill line.
10. Place the lid on the tank, aligning the color-coded banana plugs and jacks
11. Run the gel for 60min at 200V constant
12. After electrophoresis is complete, turn off the power supply and disconnect the electrical leads.
13. Remove the lid from the tank and remove the Criterion XT gel(s) from the cell. Pour off and discard the
upper running buffer.
14. Invert the cassette and place the integral buffer chamber over the cassette-opening tool built into the
Criterion cell lid.
15. Firmly press down on the cassette to crack the cassette welds on both sides of the cassette. The
cassette will split open approximately 1/3 of the way.
16. Pull the two halves of the cassette apart to completely expose the gel.
17. Remove the gel by either floating the gel into the Towbin buffer or by carefully lifting the gel from the
cassette (When Western blot has to be performed after SDS-Page).
OR Remove the gel by floating the gel into water. (When the gel has to be stained after SDS-PAGE)
18. Scan gel with ImageScanner and Labscan 6.0 software (see protocol ImageScanner III)
19. Analyze bands with ImageQuant TL 7.0 software.
Stain SDS-PAGE gel with Bio-Safe Coomassie Brilliant Blue
Description Supplier Cat.#
Shaker – Single-Tier Platform VWR 444-0142
Bio-Safe Coomassie Stain, 5L Bio-Rad 161-0787
Appendix figure 15: Prestained protein ladder
60
Method
1. Wash your gel for 10 minutes in water to remove SDS and dyes before adding the Bio-Safe Coomassie.
This does help resolution.
2. Stain for 1 hour
3. After staining, you can decant the used Bio-Safe Coomassie into a bottle on the same shelf. It can be
re-used once or twice, but only if you are staining a gel with a lot of protein, as it is not quite as
sensitive on re-use.
4. De-stain in water for an extended period (overnight, or even over a couple of days). It might not help
much, but it will not hurt either.