Embed Size (px)
Citation preview
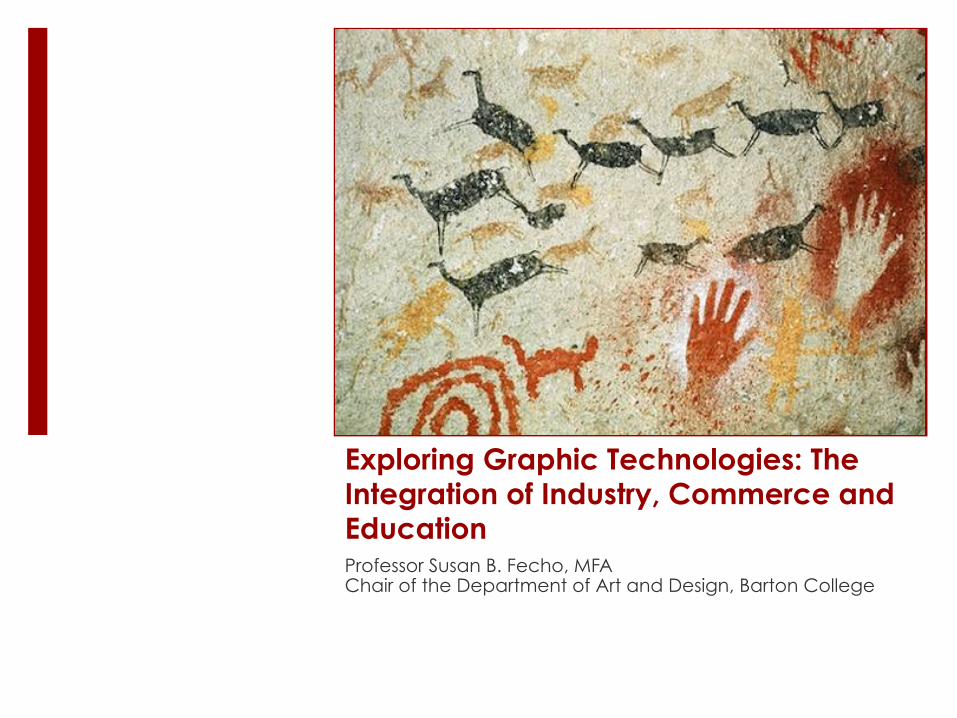
Exploring Graphic Technologies: The Integration of Industry, Commerce and Education Professor Susan B. Fecho, MFA Chair of the Department of Art and Design, Barton College
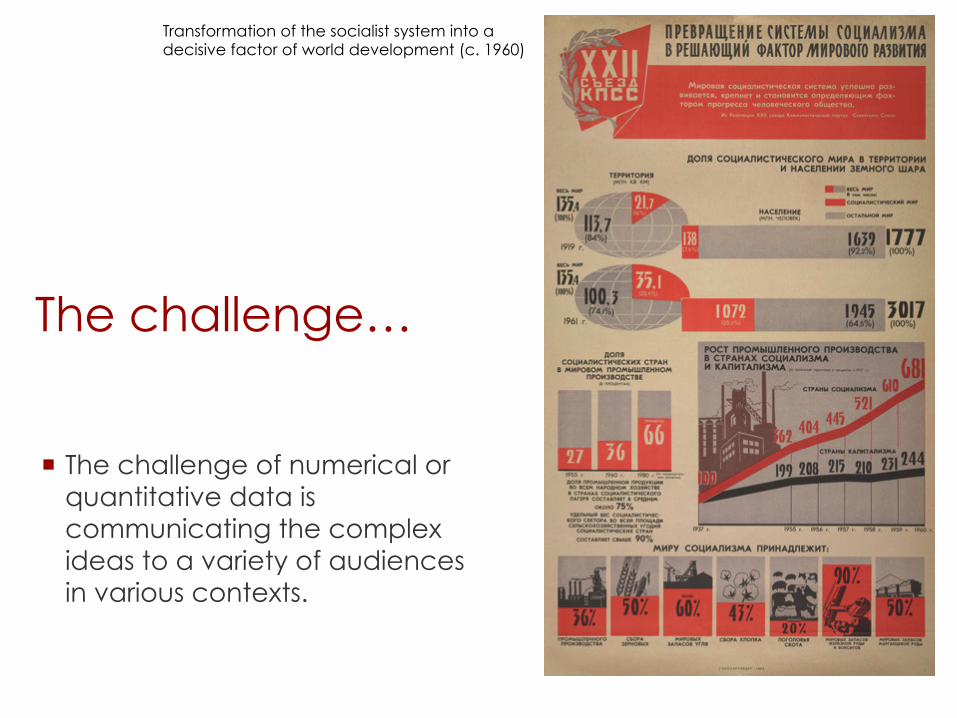
The challenge…
¡ The challenge of numerical or quantitative data is communicating the complex ideas to a variety of audiences in various contexts.
Transformation of the socialist system into a decisive factor of world development (c. 1960)
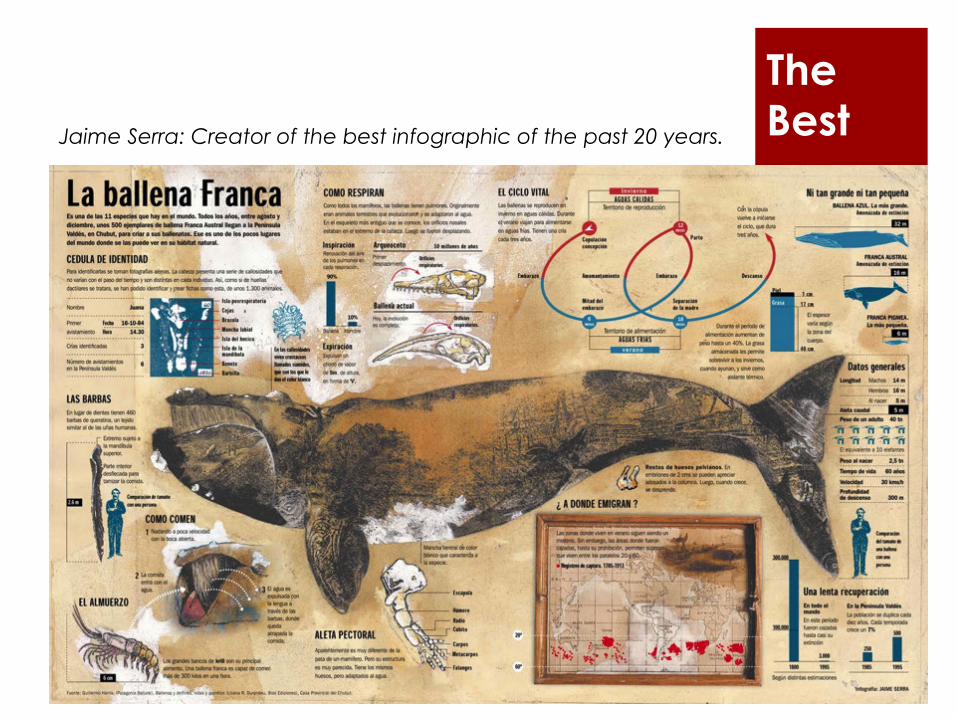
The Best Jaime Serra: Creator of the best infographic of the past 20 years.
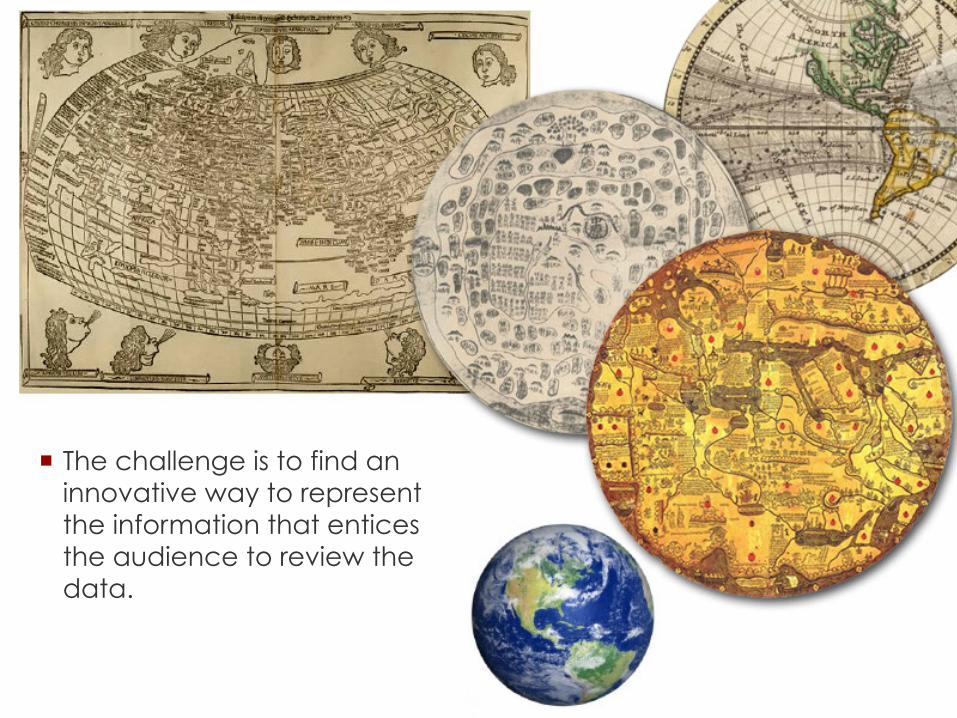
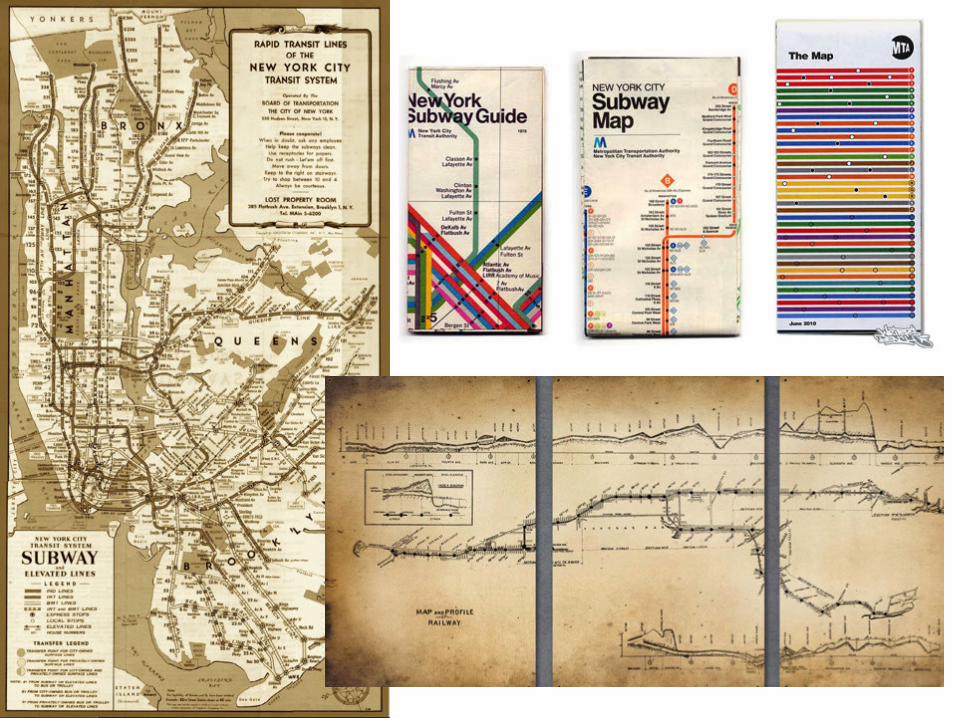
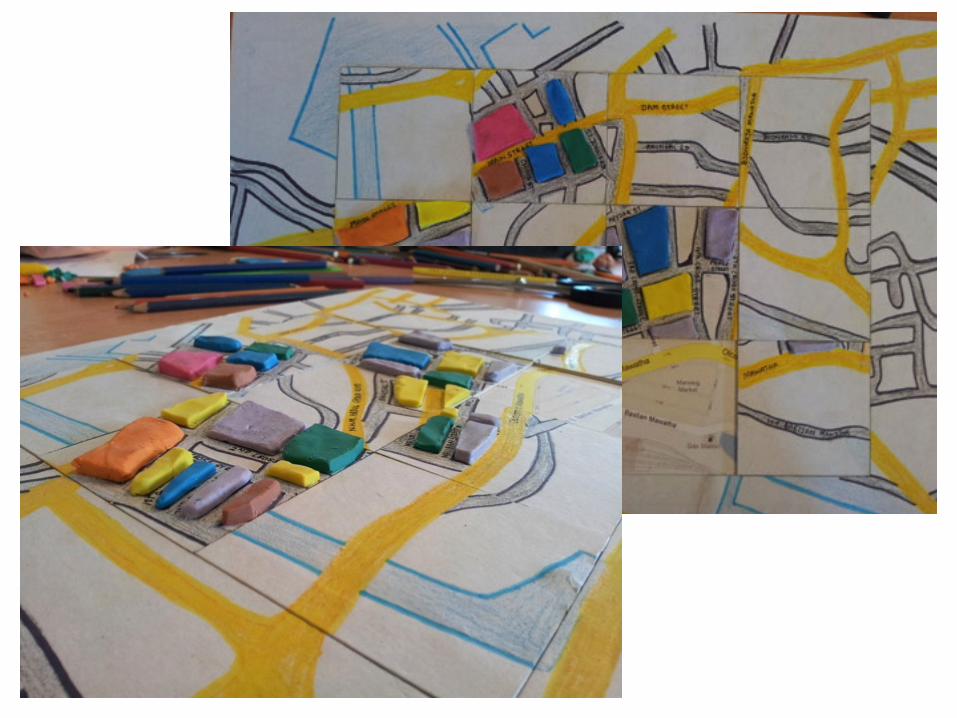
¡ The challenge is to find an innovative way to represent the information that entices the audience to review the data.
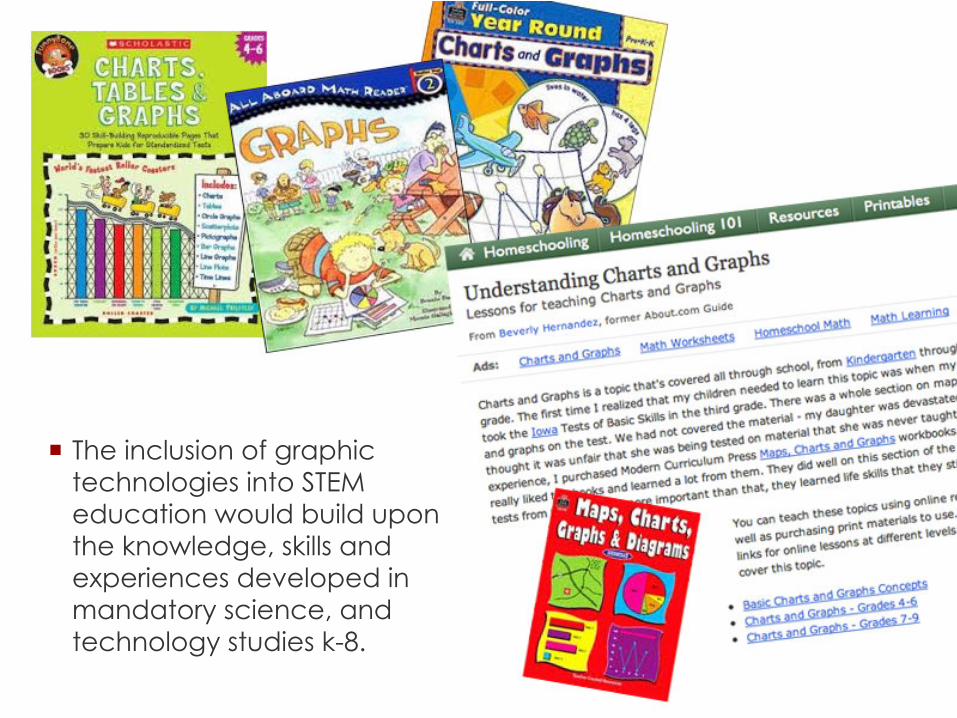
¡ The inclusion of graphic technologies into STEM education would build upon the knowledge, skills and experiences developed in mandatory science, and technology studies k-8.
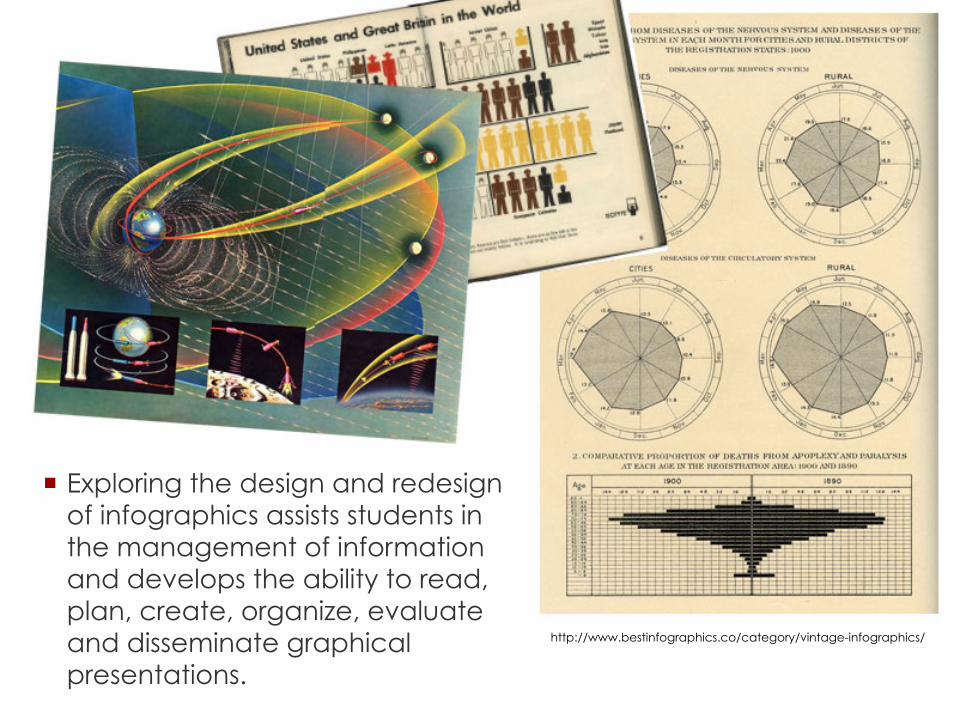
¡ Exploring the design and redesign of infographics assists students in the management of information and develops the ability to read, plan, create, organize, evaluate and disseminate graphical presentations.
http://www.bestinfographics.co/category/vintage-infographics/
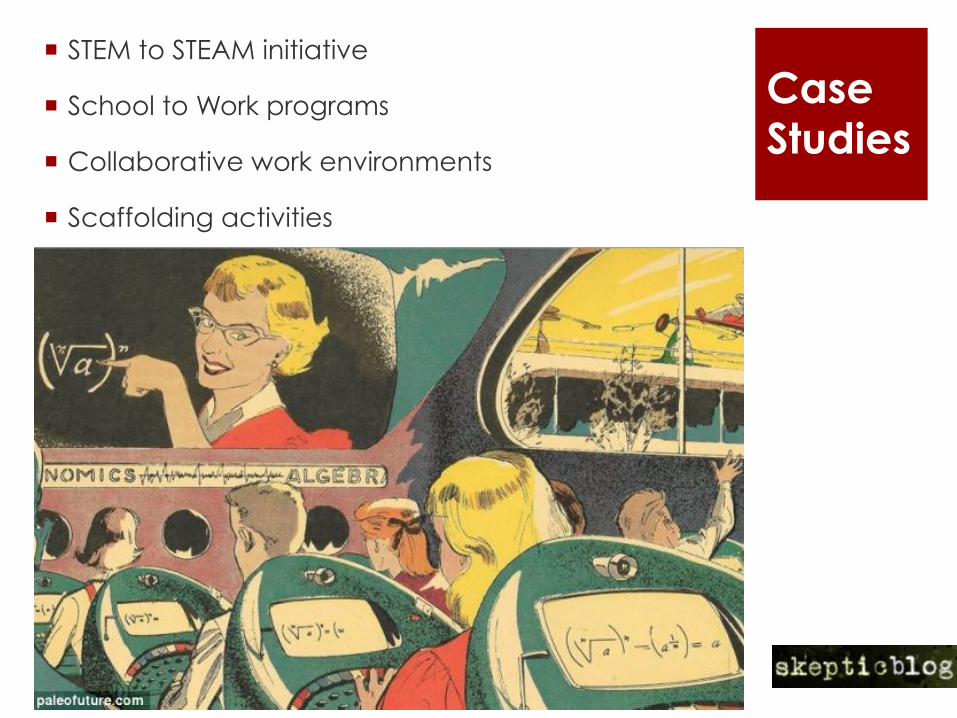
¡ STEM to STEAM initiative
¡ School to Work programs
¡ Collaborative work environments
¡ Scaffolding activities
Case Studies
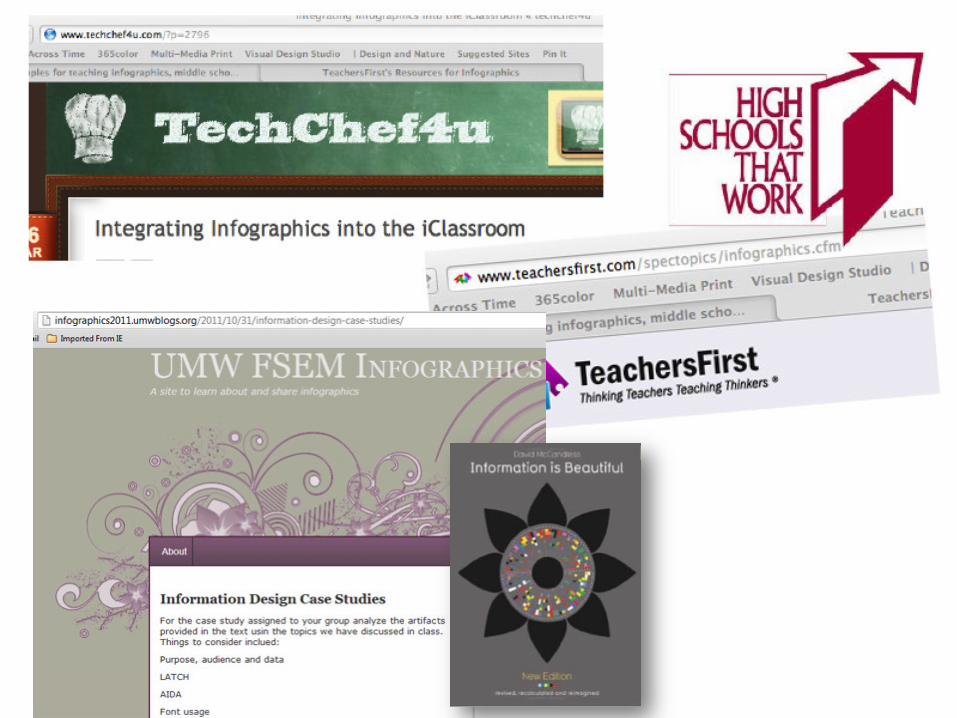
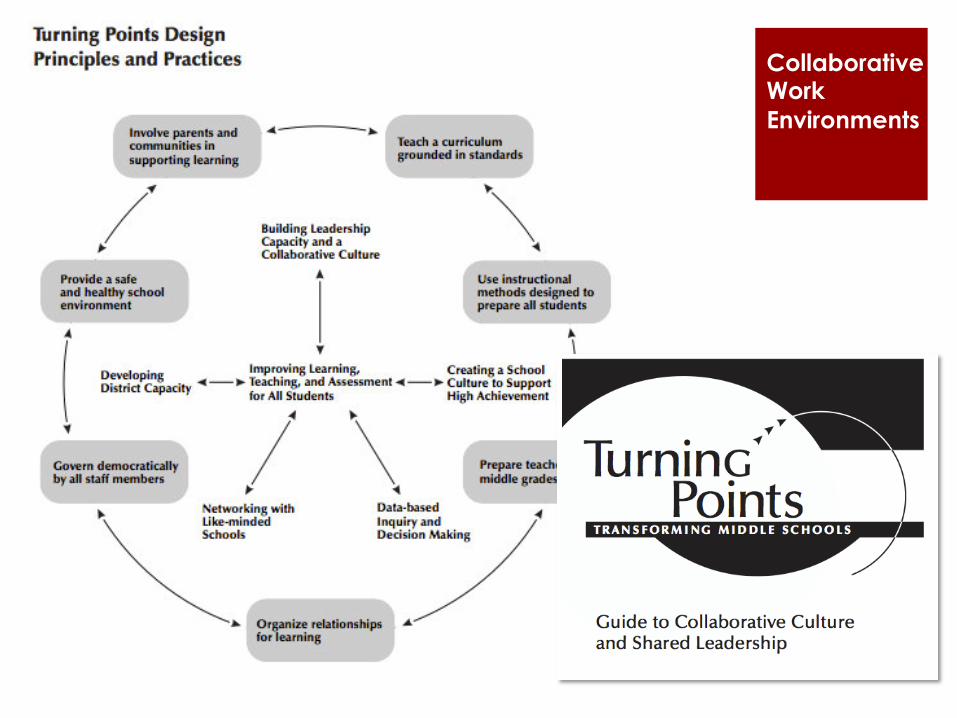
Collaborative Work Environments
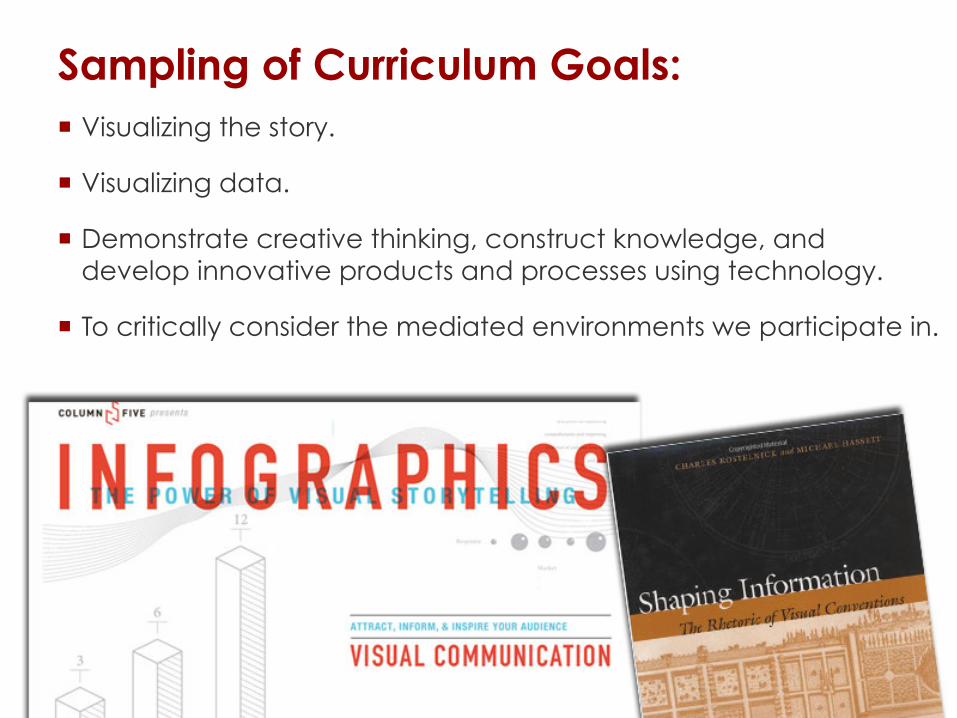
Sampling of Curriculum Goals: ¡ Visualizing the story.
¡ Visualizing data.
¡ Demonstrate creative thinking, construct knowledge, and develop innovative products and processes using technology.
¡ To critically consider the mediated environments we participate in.
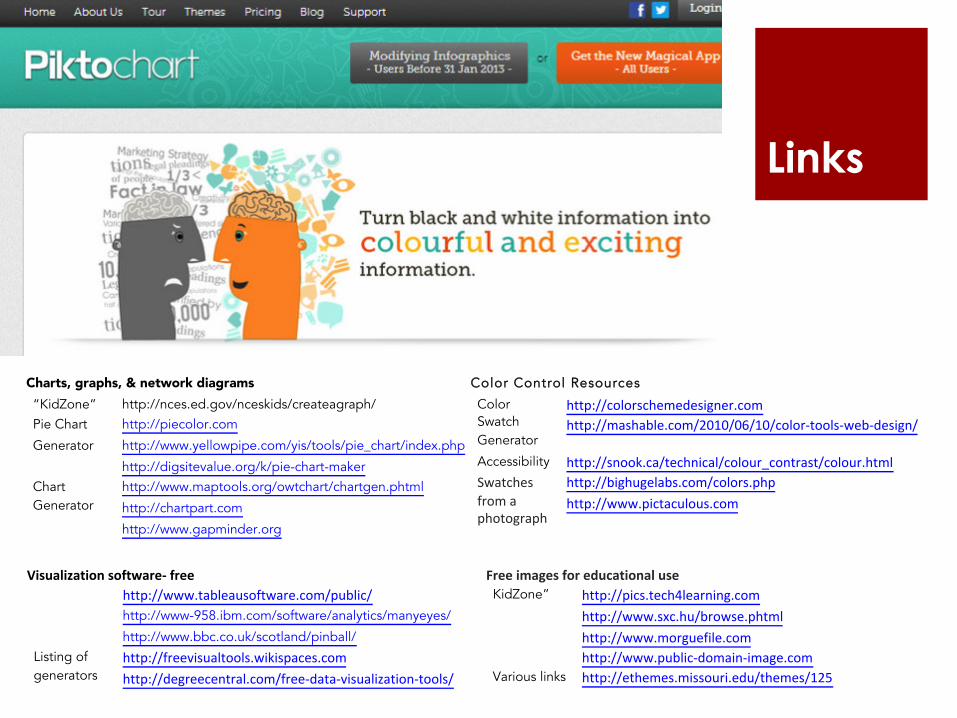
Charts, graphs, & network diagrams “KidZone” http://nces.ed.gov/nceskids/createagraph/ Pie Chart
Generator
http://piecolor.com
http://www.yellowpipe.com/yis/tools/pie_chart/index.php
http://digsitevalue.org/k/pie-chart-maker Chart Generator
http://www.maptools.org/owtchart/chartgen.phtml
http://chartpart.com
http://www.gapminder.org
!Visualization+software0+free http://www.tableausoftware.com/public/4
http://www-958.ibm.com/software/analytics/manyeyes/
http://www.bbc.co.uk/scotland/pinball/ Listing of generators
http://freevisualtools.wikispaces.com4http://degreecentral.com/free:data:visualization:tools/4
!
Color Control Resources
Color Swatch Generator
http://colorschemedesigner.com2http://mashable.com/2010/06/10/color9tools9web9design/
Accessibility http://snook.ca/technical/colour_contrast/colour.html Swatches2from2a2photograph
http://bighugelabs.com/colors.php2http://www.pictaculous.com2
!
Free$images$for$educational$use KidZone” http://pics.tech4learning.com http://www.sxc.hu/browse.phtml7
http://www.morguefile.com7http://www.public9domain9image.com7
Various links http://ethemes.missouri.edu/themes/125
!
Links
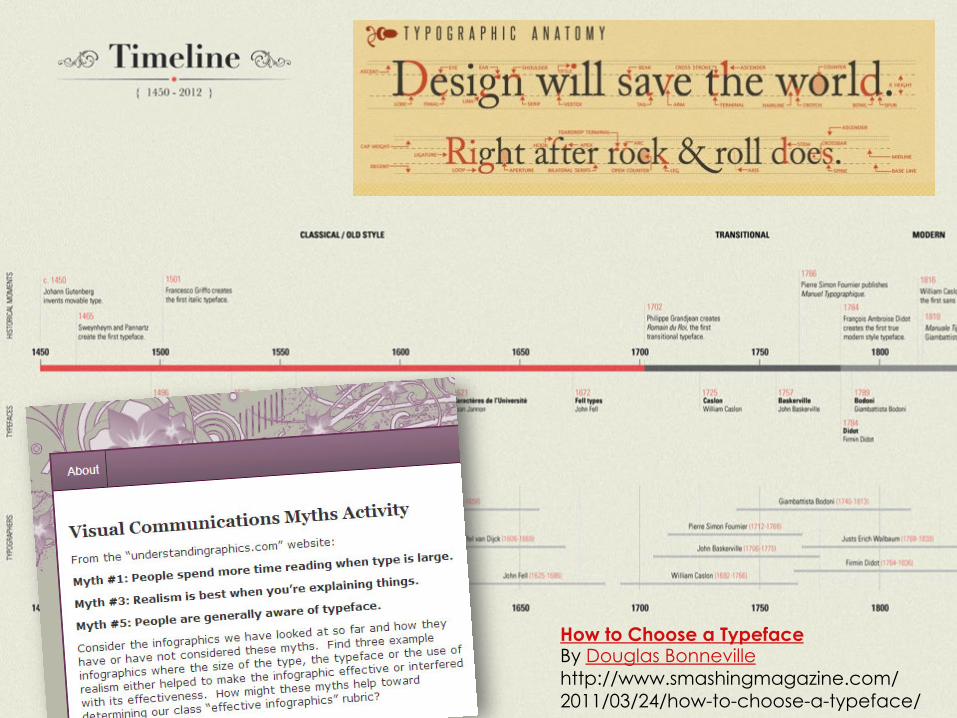
How to Choose a Typeface By Douglas Bonneville http://www.smashingmagazine.com/2011/03/24/how-to-choose-a-typeface/
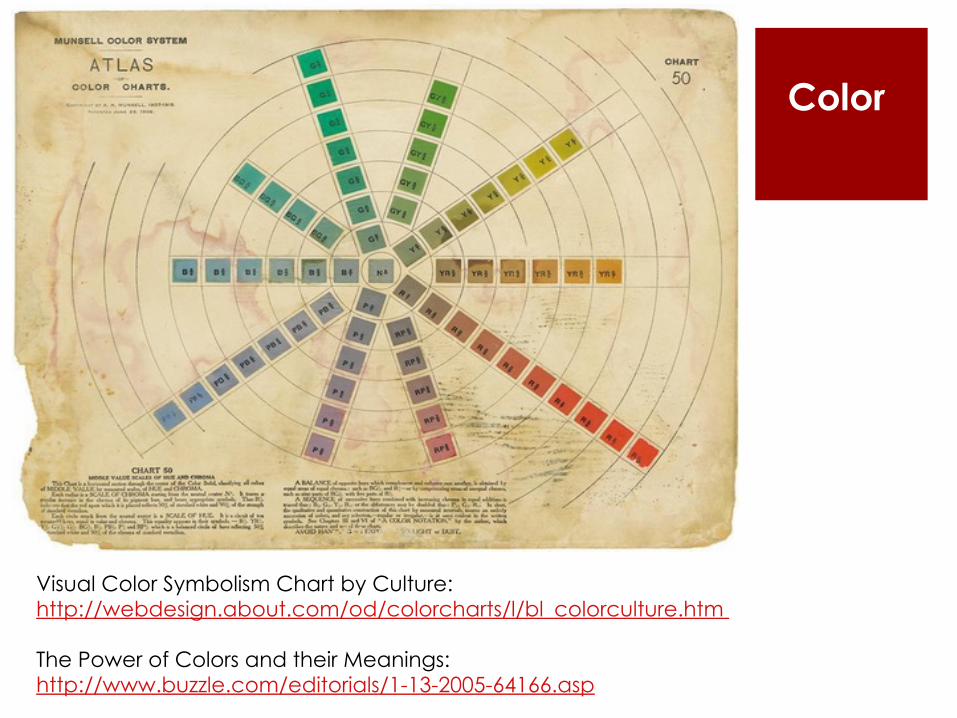
Visual Color Symbolism Chart by Culture: http://webdesign.about.com/od/colorcharts/l/bl_colorculture.htm The Power of Colors and their Meanings: http://www.buzzle.com/editorials/1-13-2005-64166.asp
Color
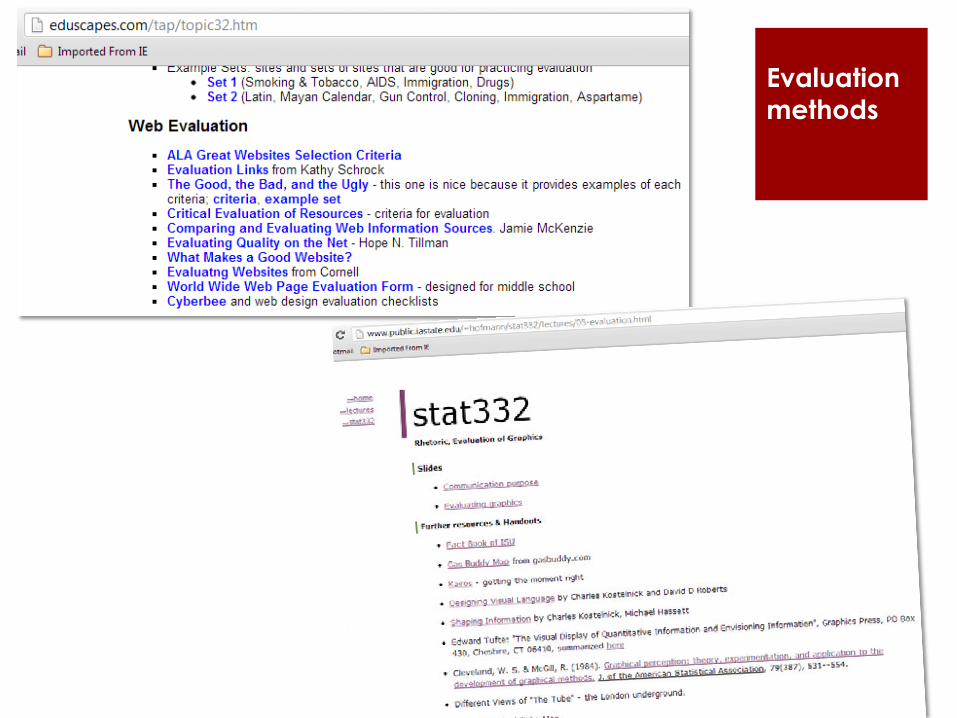
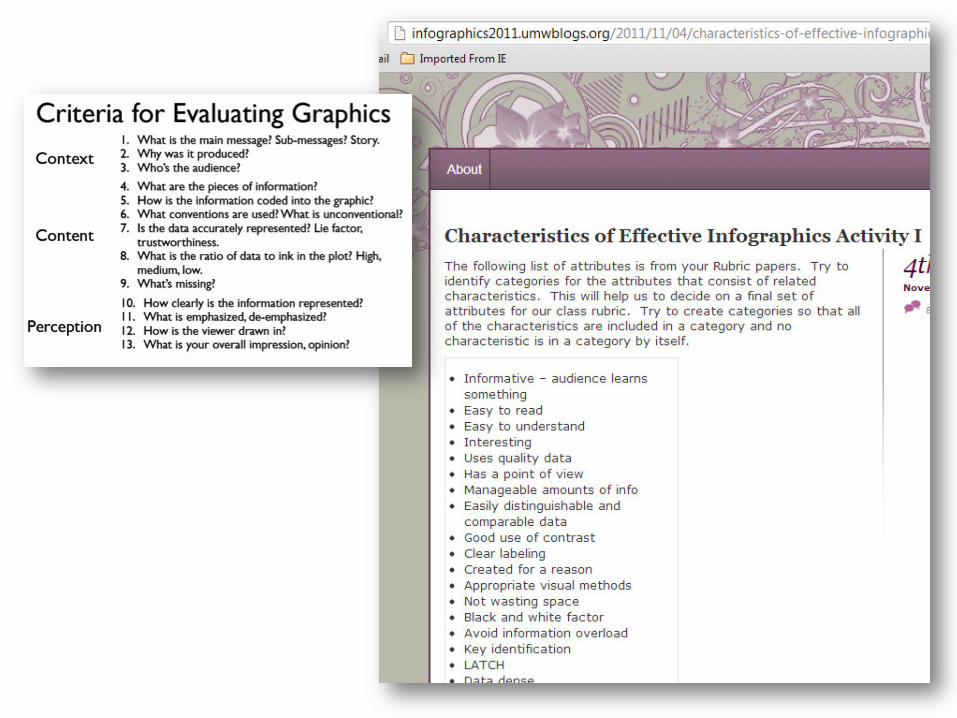
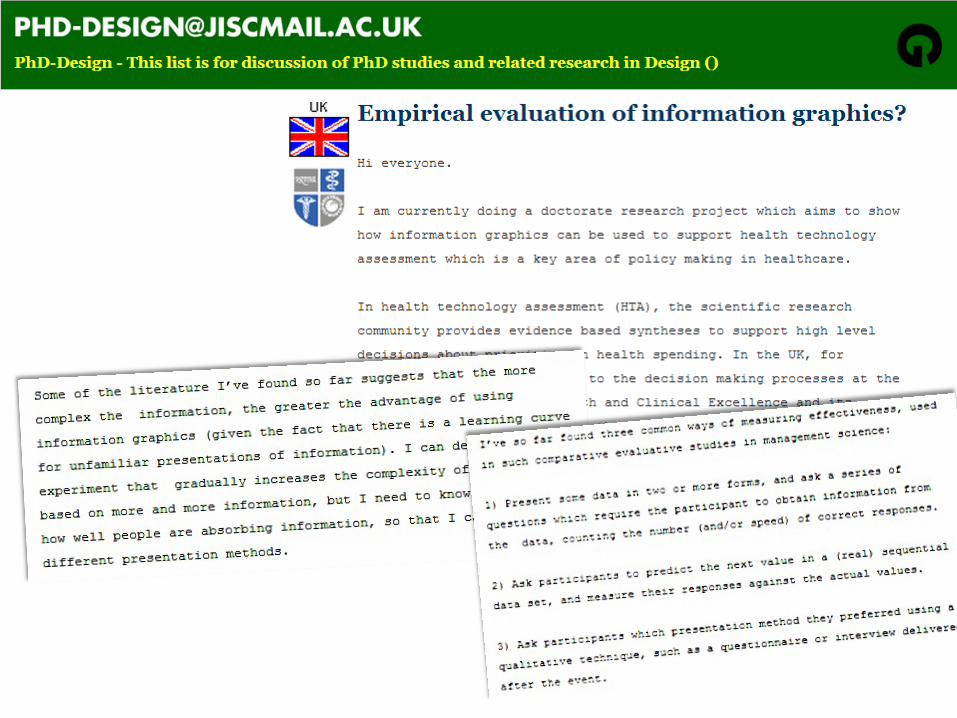
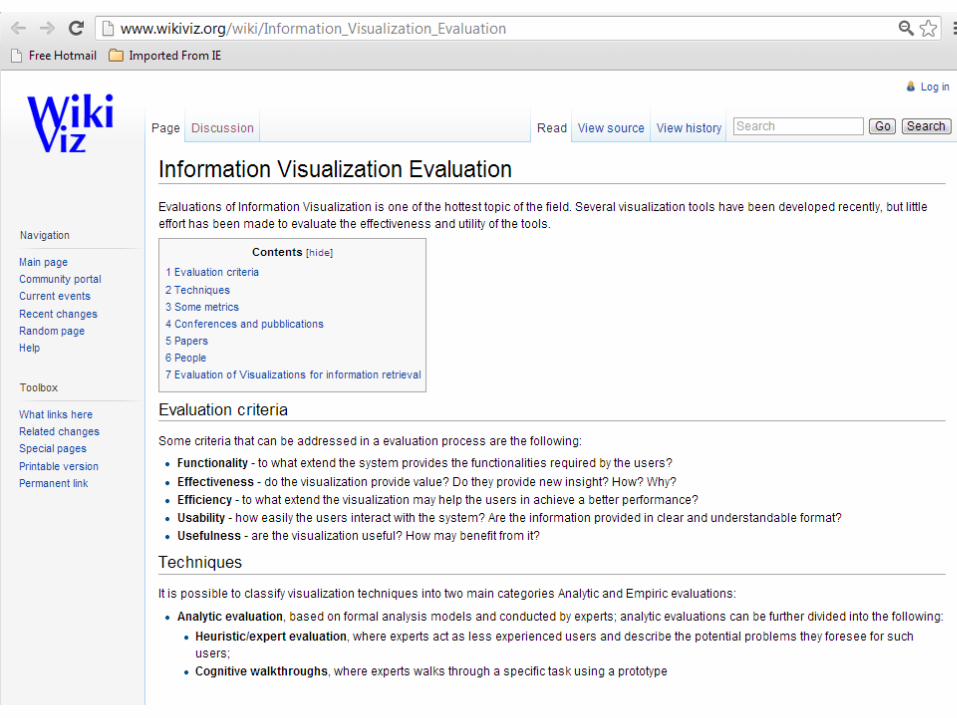
Evaluation methods
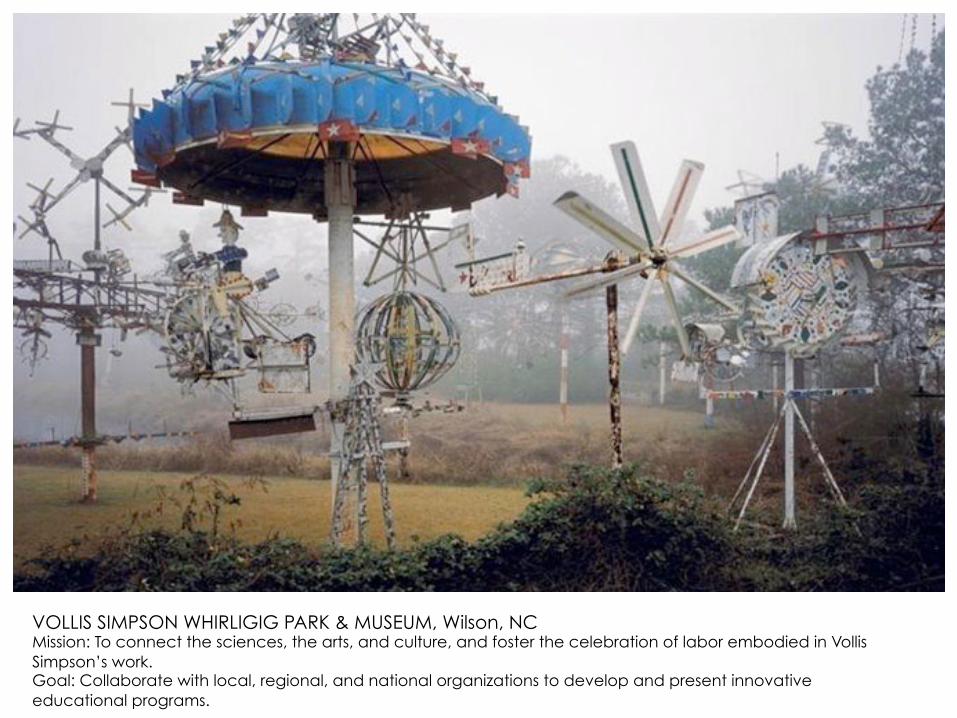
VOLLIS SIMPSON WHIRLIGIG PARK & MUSEUM, Wilson, NC Mission: To connect the sciences, the arts, and culture, and foster the celebration of labor embodied in Vollis Simpson’s work. Goal: Collaborate with local, regional, and national organizations to develop and present innovative educational programs.