Embed Size (px)
Citation preview
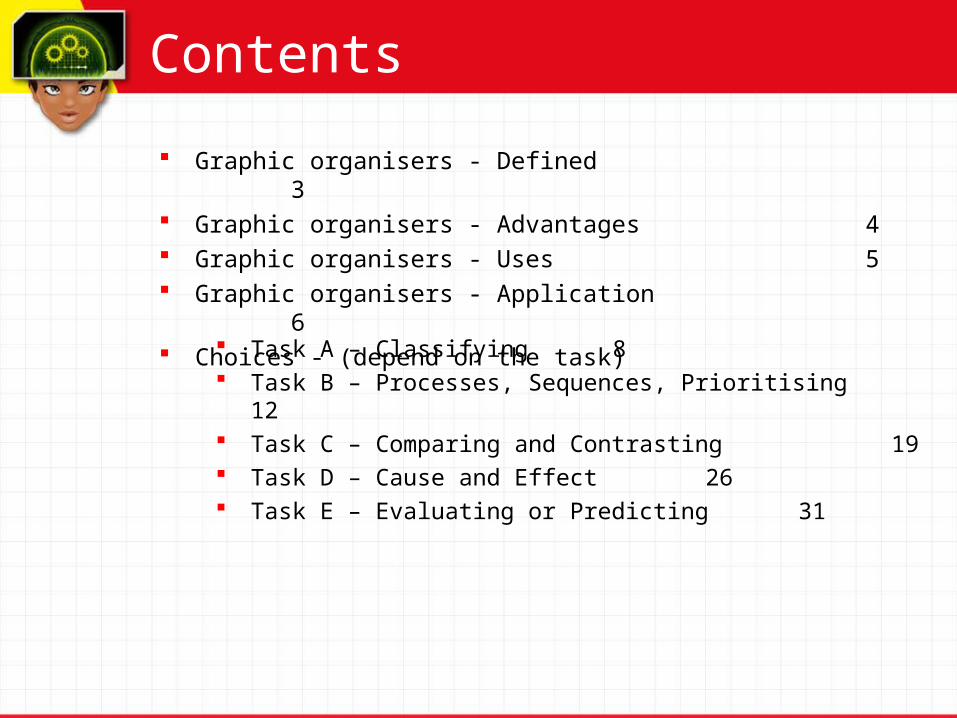
Contents
Graphic organisers - Defined 3 Graphic organisers - Advantages 4 Graphic organisers - Uses 5 Graphic organisers - Application 6 Choices - (depend on the task)
Task A – Classifying 8 Task B – Processes, Sequences, Prioritising 12 Task C – Comparing and Contrasting 19 Task D – Cause and Effect 26 Task E – Evaluating or Predicting 31
Graphic organisers defined
Graphic organisers are: a pictorial way of constructing knowledge a pictorial way of organising information a pictorial way of converting disjointed
information into a simple-to-read display a completed graphic organiser conveys complex
information in an easy to understand manner
Graphic organisers - advantages
Using graphic organisers ensures: an increased understanding of the topic an understanding of the relationships between
items an understanding of the meaning of each item that the most important parts of the information
are prioritized that new ideas are generated that student thinking skills are developed
Graphic organisers - uses
Graphic organisers can be used: to help analyse and synthesize information to structure written assignments to help in problem solving to assist in decision making to assist in planning research when brainstorming ideas to illustrate prior knowledge on the subject to categorise information to gather and record information to show the students’ thinkingCan be used in any subject in the curriculum
Graphic organisers - application
Graphic organisers can be applied: at the beginning of a unit of work
e.g. for brainstorming prior knowledge at the end of a unit of work
e.g. a self assessment rubic to describe a phenomenon to classify or categorise a phenomena to compare & contrast facts to sequence or order ideas to show causal links between ideas, information to evaluate and predict
Graphic organisers - choice
The tasks or thinking skills required determines the type of graphic organiser to be used
The following slides give examples of common graphic organisers according to the task involved
Classifying, recalling, brainstorming use Webs
Questions What is the central idea? What are the qualities/attributes? What are its functions?
Choices 1. Star, 2. Spider, 3. Cloud/cluster
Task A
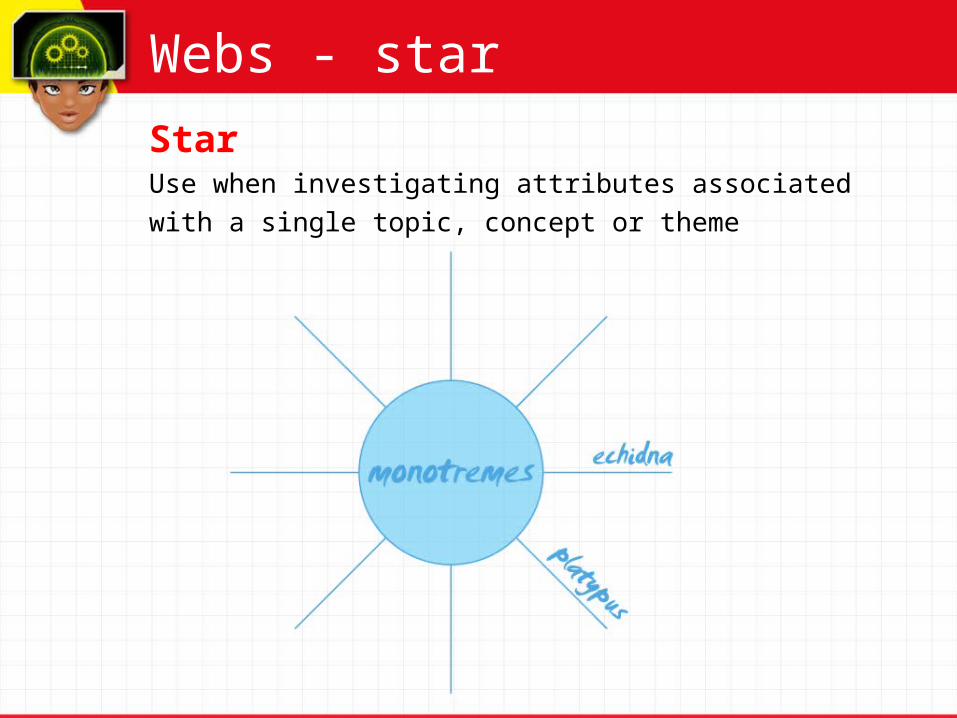
Webs - star
StarUse when investigating attributes associated
with a single topic, concept or theme
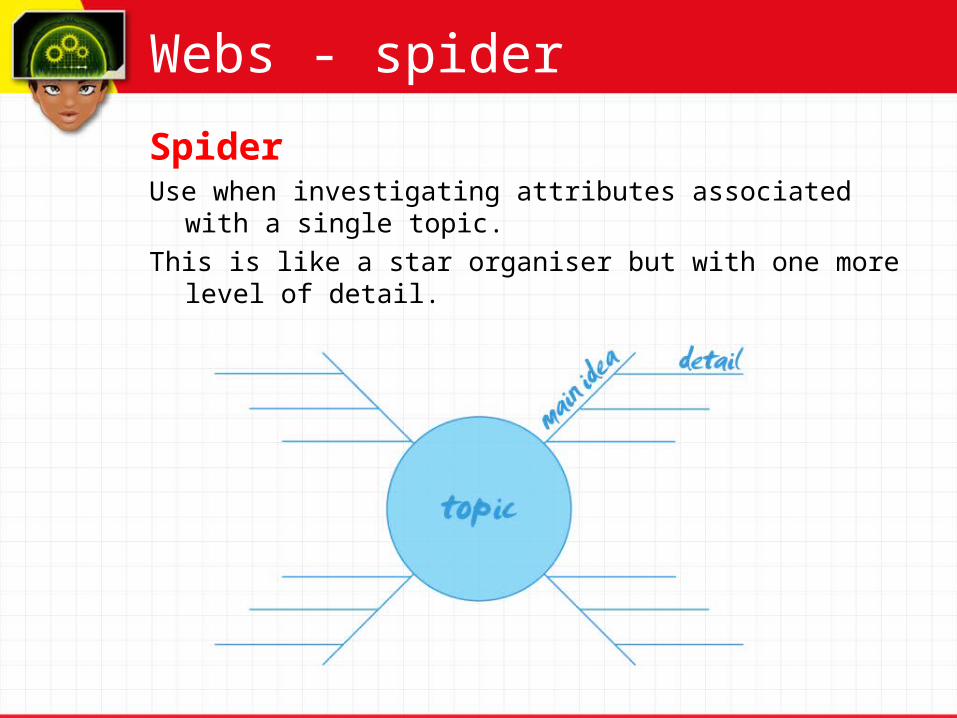
Webs - spider
SpiderUse when investigating attributes associated with a single topic.
This is like a star organiser but with one more level of detail.
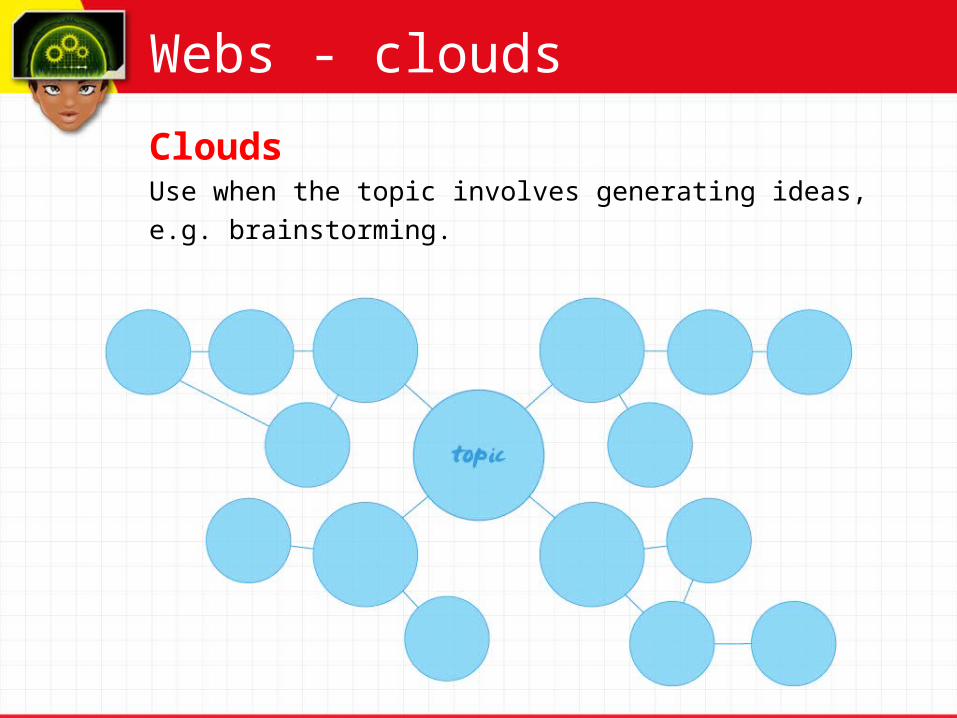
Webs - clouds
CloudsUse when the topic involves generating ideas,
e.g. brainstorming.
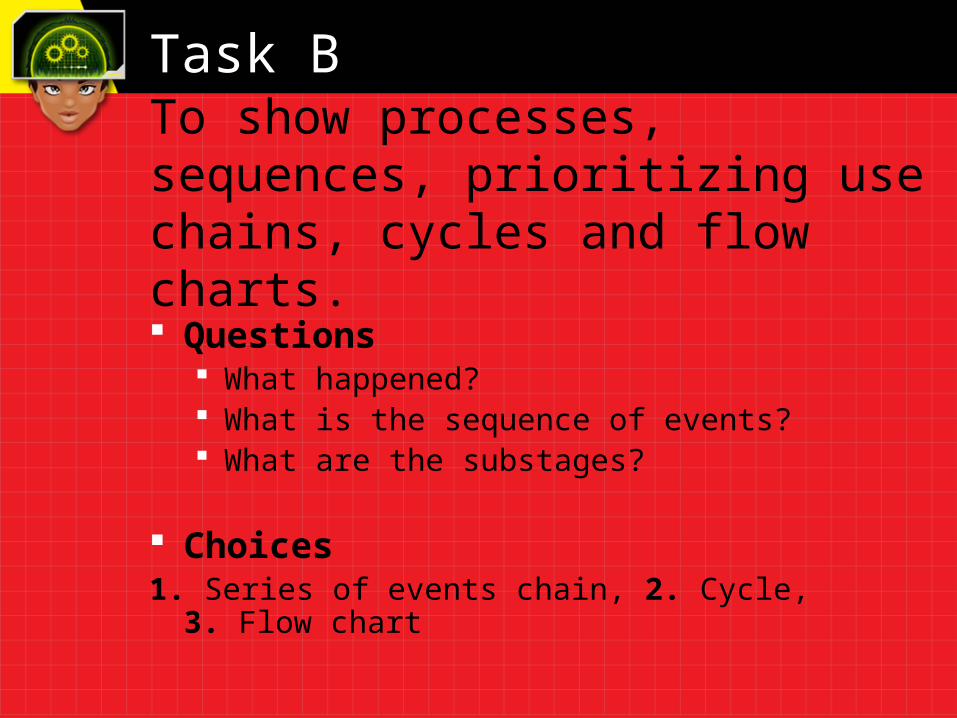
Task B
Questions What happened? What is the sequence of events? What are the substages?
Choices1. Series of events chain, 2. Cycle, 3. Flow chart
To show processes, sequences, prioritizing use chains, cycles and flow charts.
1. Chain of events
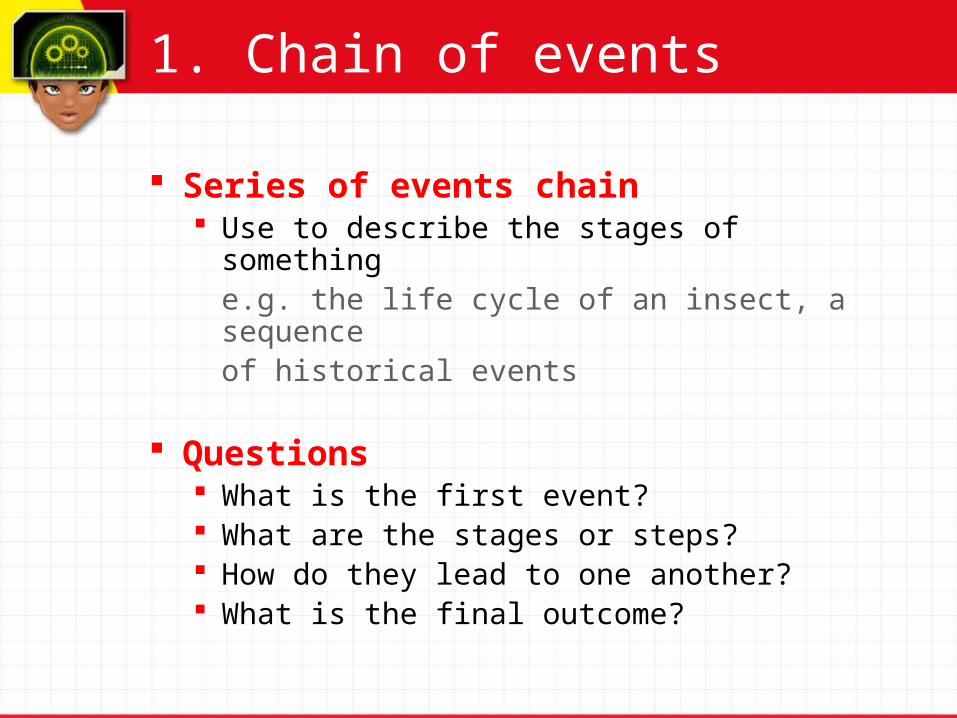
Series of events chain Use to describe the stages of something
e.g. the life cycle of an insect, a sequence of historical events
Questions What is the first event? What are the stages or steps? How do they lead to one another? What is the final outcome?
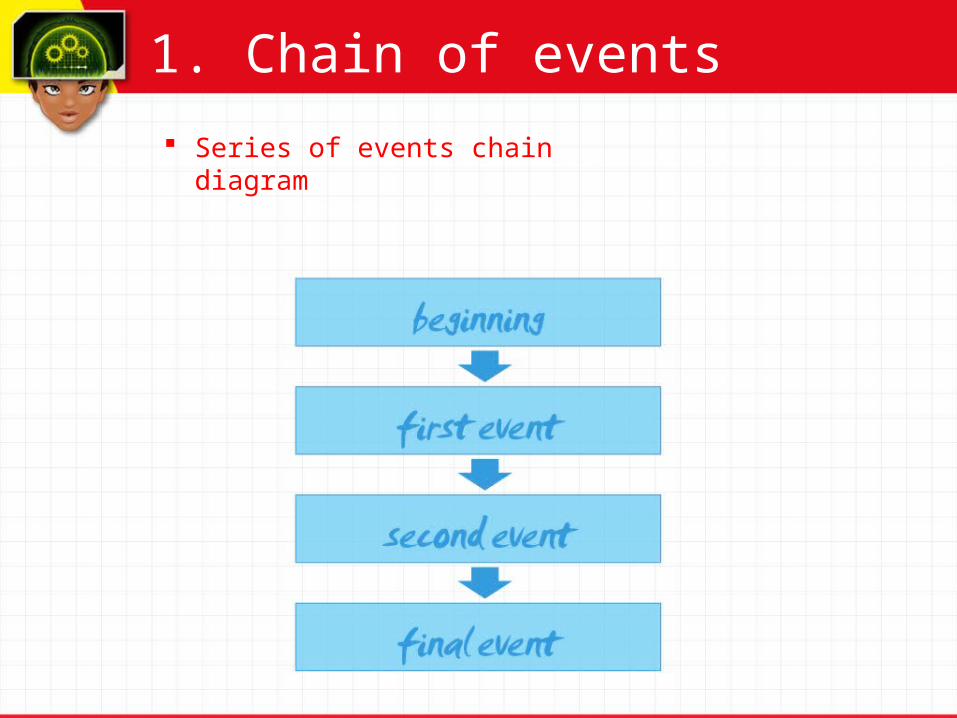
Series of events chain diagram
1. Chain of events
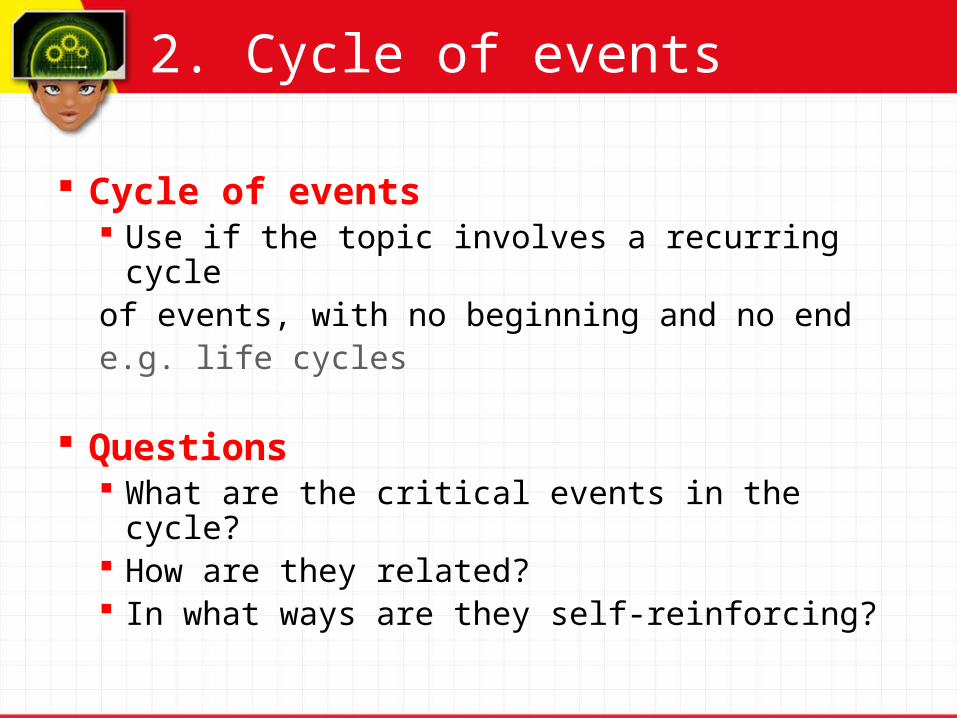
Cycle of events Use if the topic involves a recurring cycle of events, with no beginning and no end e.g. life cycles
Questions What are the critical events in the cycle? How are they related? In what ways are they self-reinforcing?
2. Cycle of events
2. Cycle of events
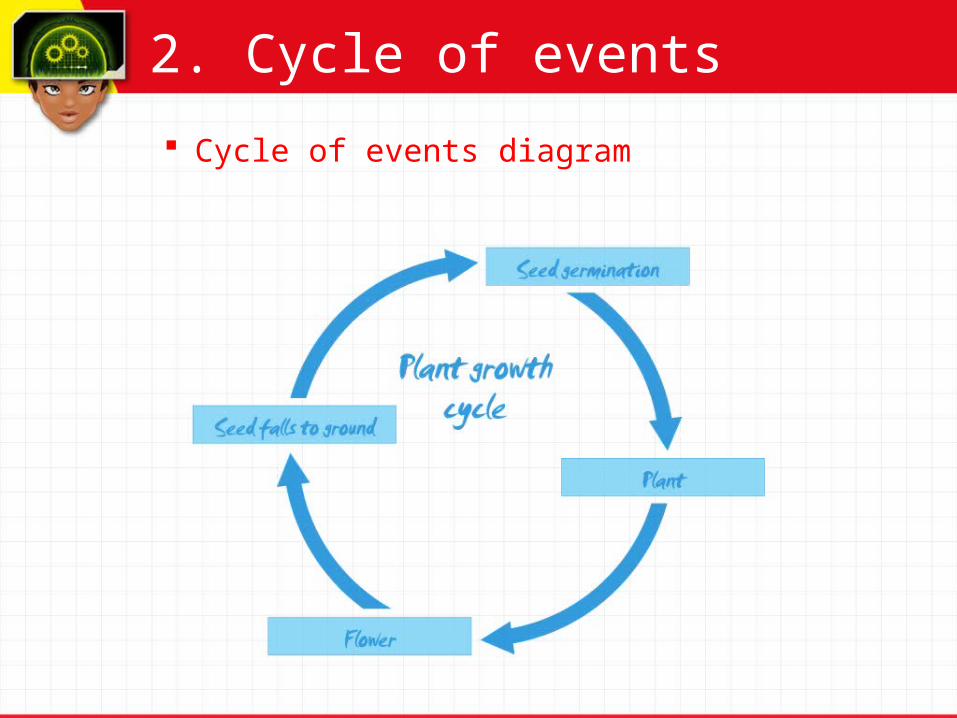
Cycle of events diagram
3. Flow chart / sequencing
Flow Chart Use to describe discrete step, or steps that
must be completed in order
Questions What happened? What is the sequence of events? What are the substages?
2. Flow chart / sequencing
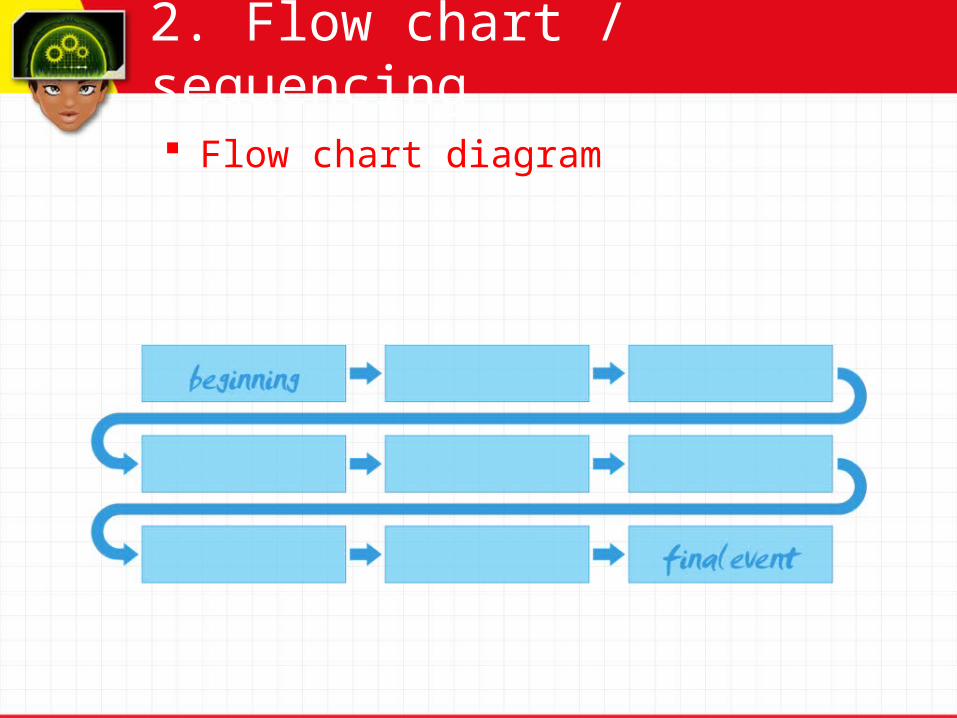
Flow chart diagram
Task C
Questions What are the things being compared? How are they similar? How are they different?
Choices1. Venn Diagram2. T Chart3. Compare & contrast matrix
To compare and contrast information.
1. Venn Diagram
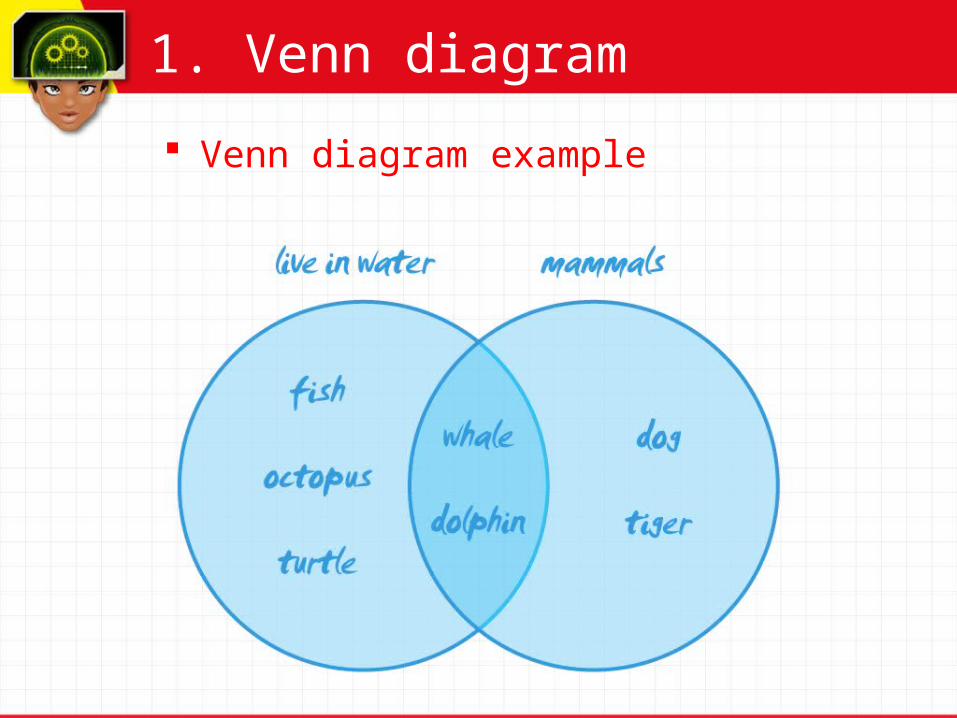
Venn Diagram Use to analyze similarities and differences
between two things by placing individual characteristics in either the left or right sections, and common characteristics in the overlapping section
Questions What are the two things being compared? How are they similar? How are they different?
1. Venn diagram
Venn diagram example
2. T-chart
T-Chart Use when analyzing or comparing two aspects
of a topic.
e.g. Fill out a T-Chart to evaluated the pros and cons associated with a decision
Questions What are the two things being compared? How are they similar? How are they different?
2. T-chart
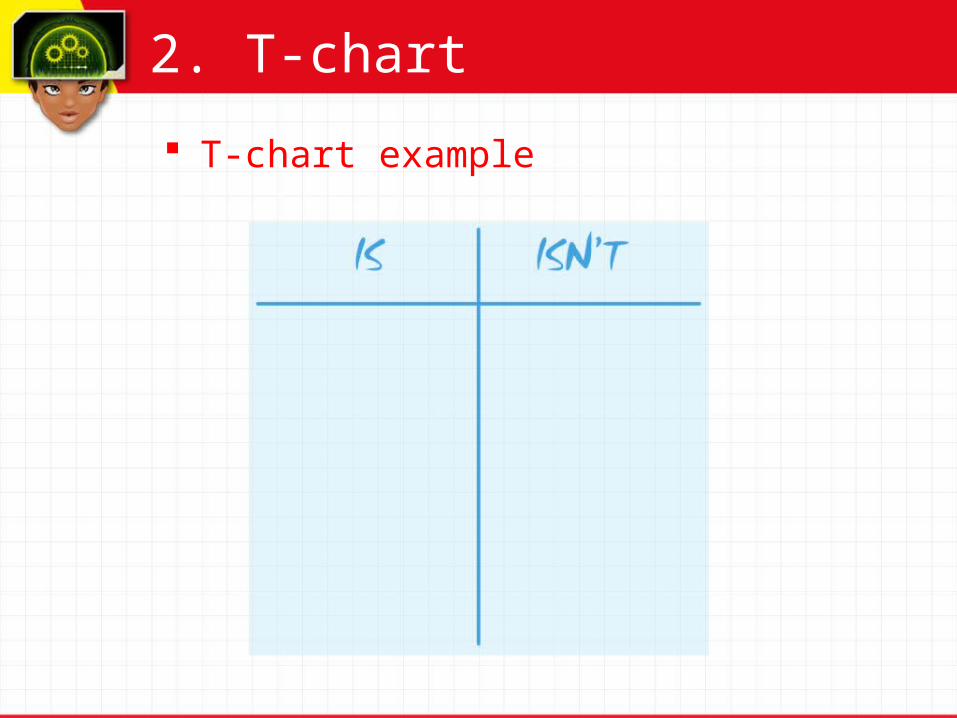
T-chart example
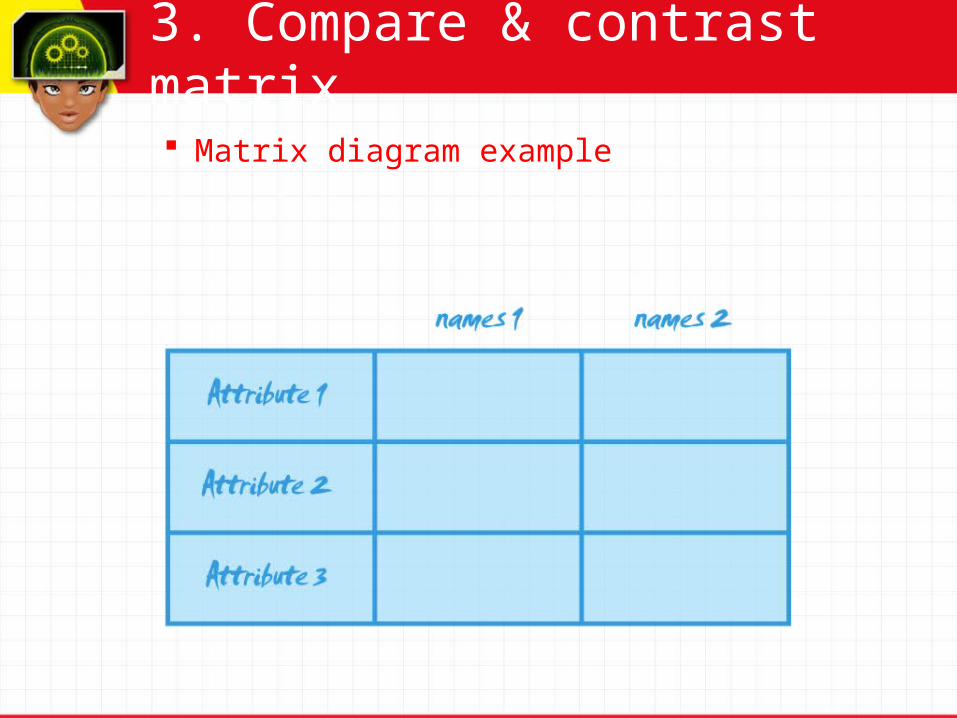
3. Compare & contrast matrix
Matrix or data chart Use to show differences and similarities
between two things eg people, places, events, ideas
Questions What are the two things being
compared? How are they similar? How are they different?
3. Compare & contrast matrix
Matrix diagram example
Task D
To show cause and effect
Questions What are the causes and effects of this
event? What might happen next?
Choices 1. Fishbone 2. Cause/effect chain of events 3.Multiple causes map
1. Webs - fishbone
Fishbone Used when investigating cause and effect
factors associated with a complex event or phenomenon.
Questions: What are the causes and effects of this event What might happen next What are the factors that cause X? How do they relate?
1. Webs - fishbone
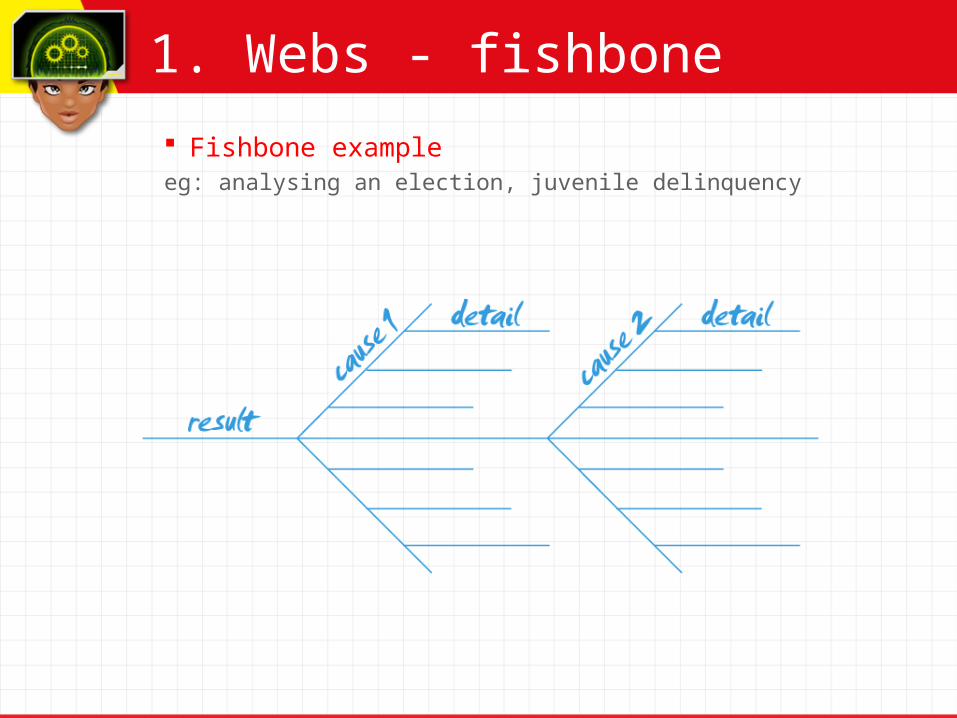
Fishbone exampleeg: analysing an election, juvenile delinquency
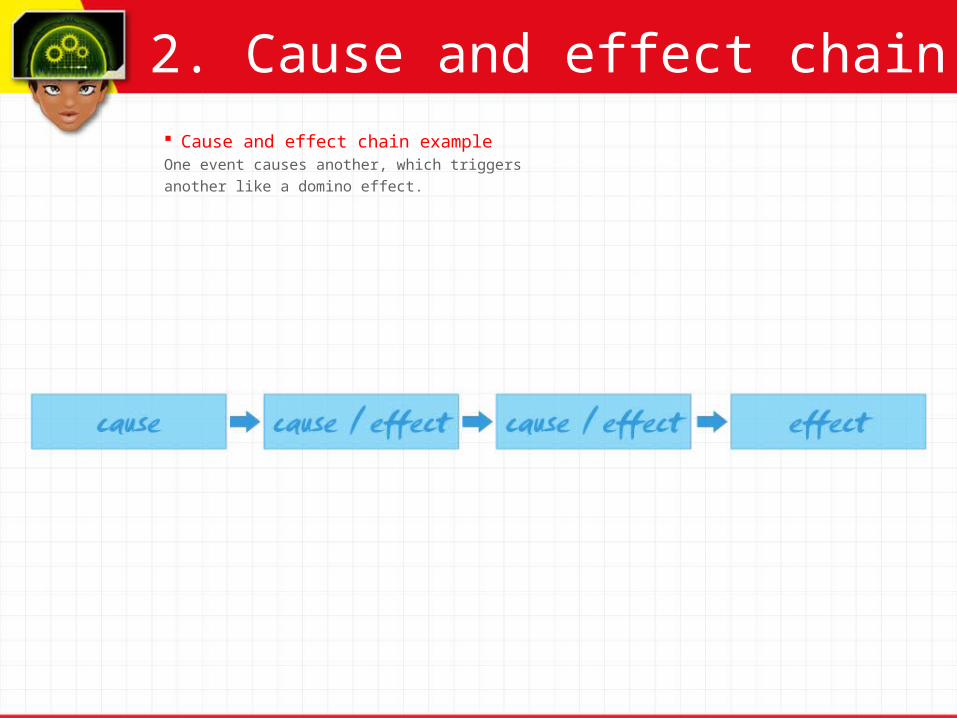
2. Cause and effect chain Cause and effect chain exampleOne event causes another, which triggers
another like a domino effect.
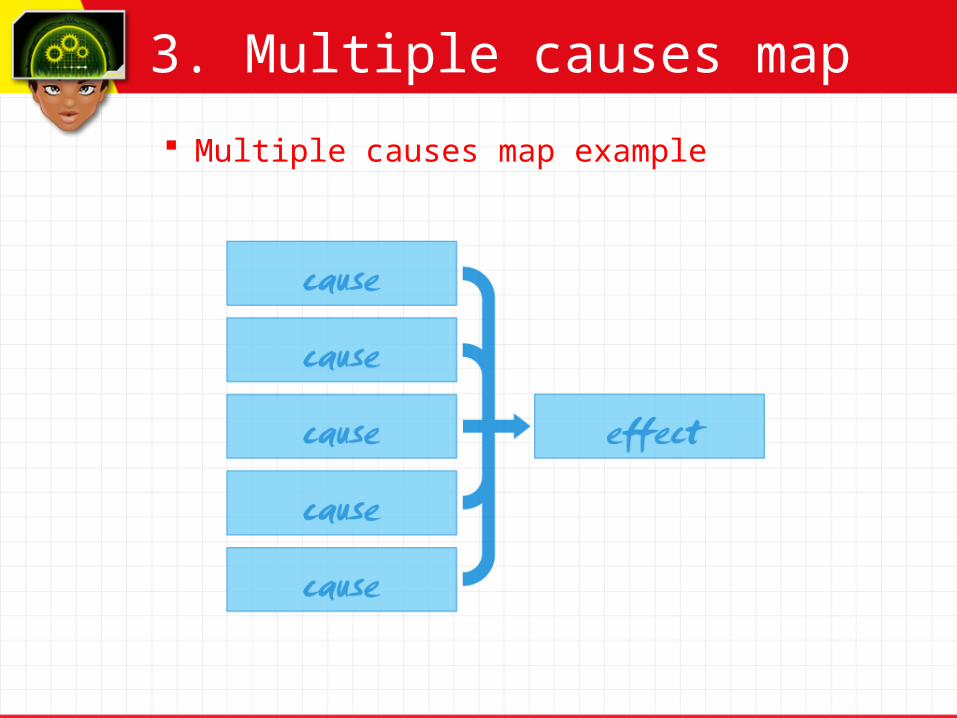
3. Multiple causes map
Multiple causes map example
Task E
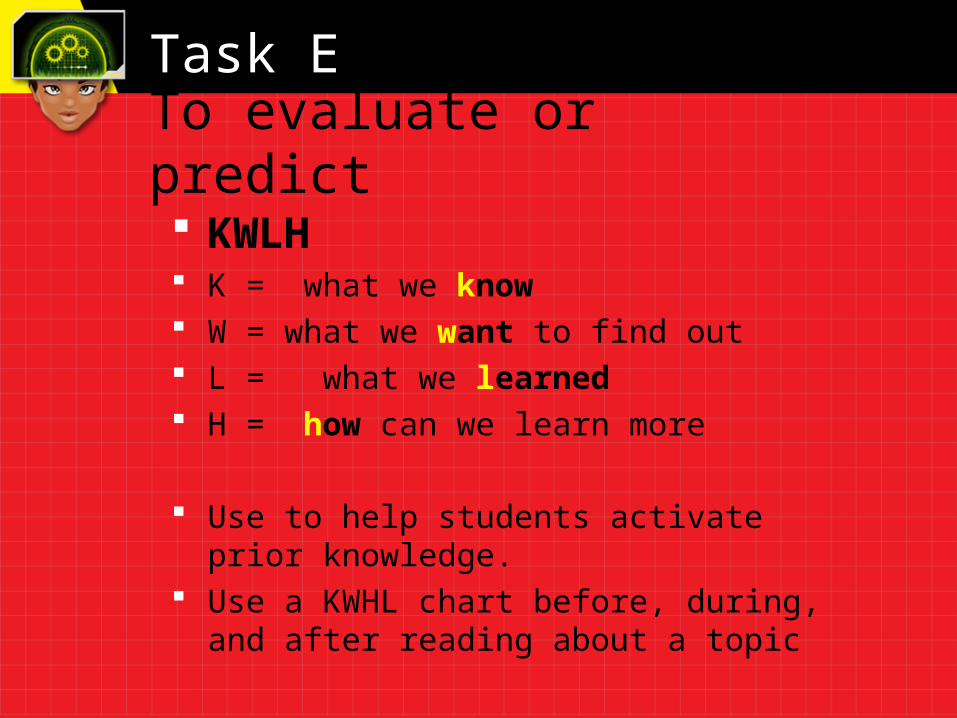
To evaluate or predict
KWLH K = what we know W = what we want to find out L = what we learned H = how can we learn more
Use to help students activate prior knowledge.
Use a KWHL chart before, during, and after reading about a topic
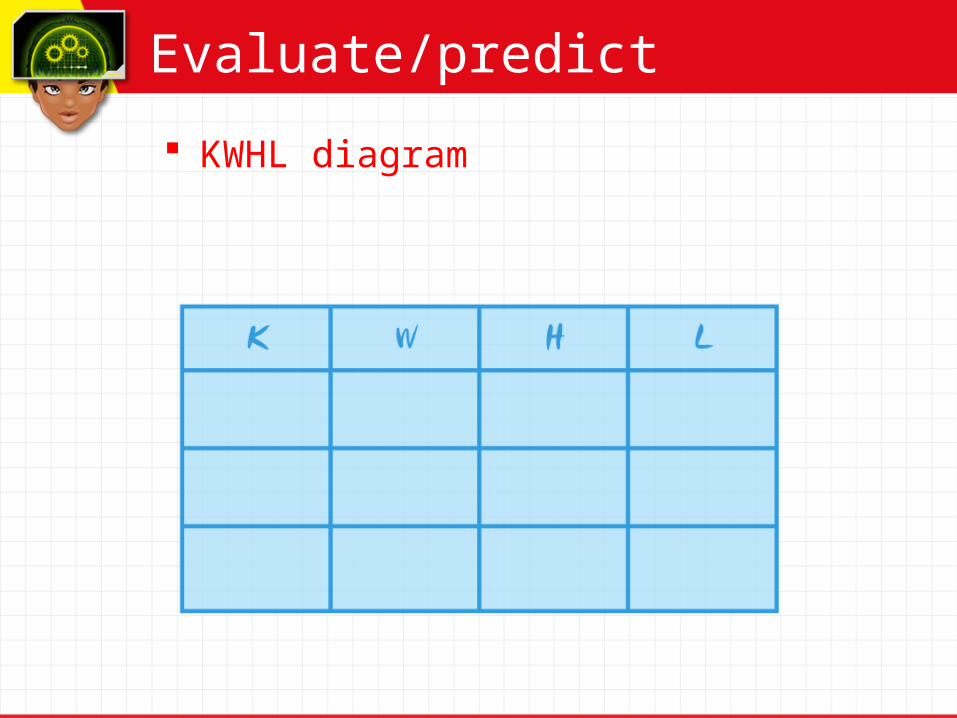
Evaluate/predict
KWHL diagram
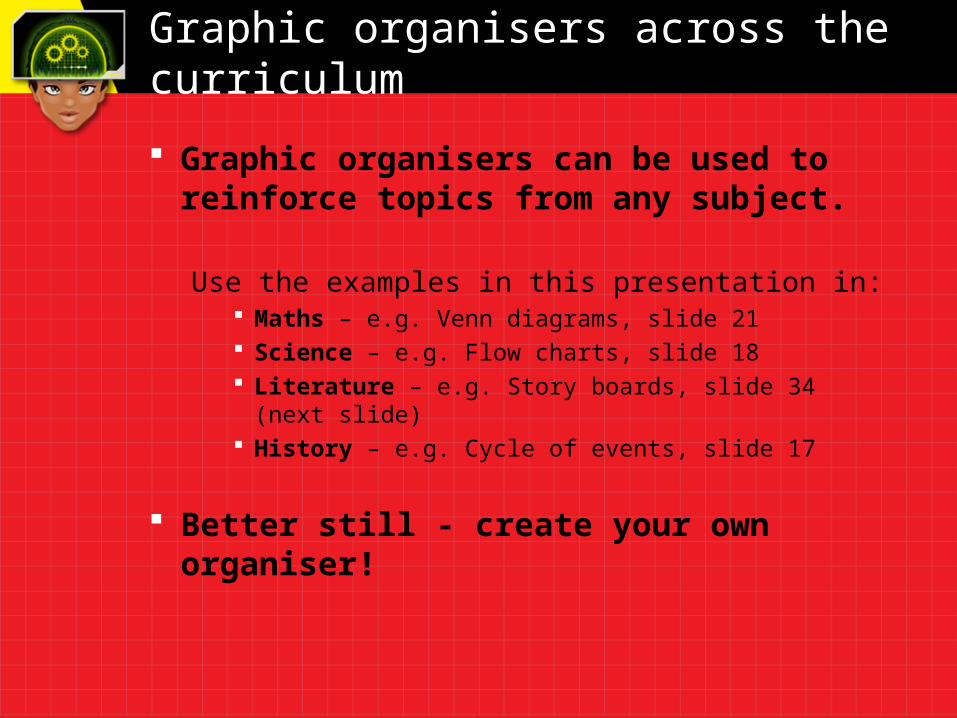
Graphic organisers across the curriculum
Graphic organisers can be used to reinforce topics from any subject.
Use the examples in this presentation in: Maths – e.g. Venn diagrams, slide 21 Science – e.g. Flow charts, slide 18 Literature – e.g. Story boards, slide 34 (next slide) History – e.g. Cycle of events, slide 17
Better still - create your own organiser!
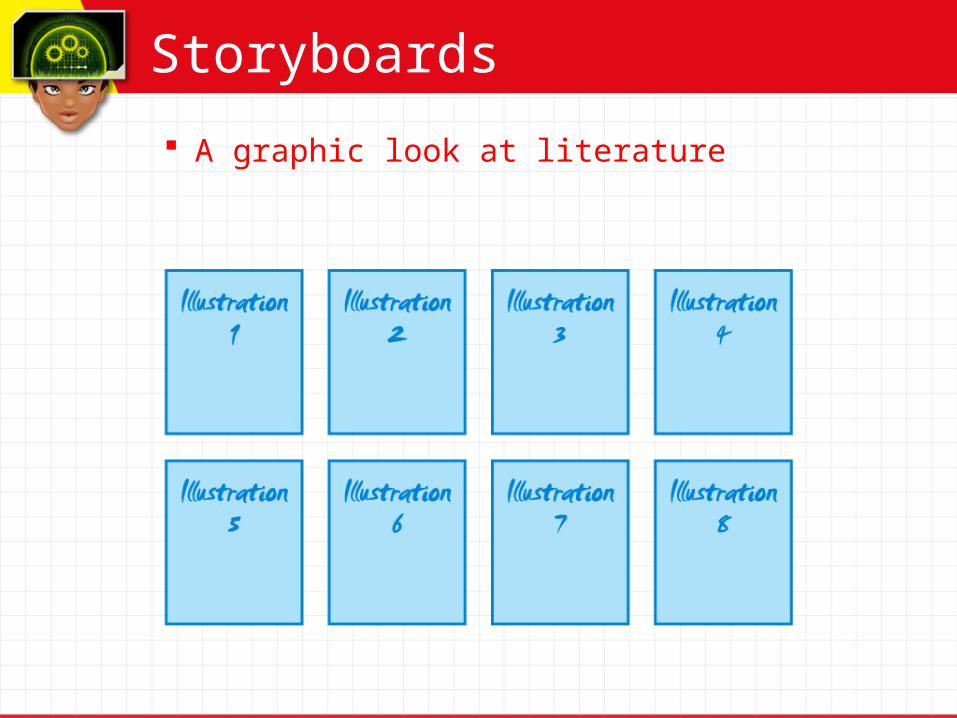
Storyboards
A graphic look at literature
References Enchanted Learners.com, Graphic Organizers, viewed 11th June, 2008,
http://www.enchantedlearning.com/graphicorganizers/
Graphic Organizers, Education Place, viewed 11th June, 2008, www.schools.nt.edu.au/larapsch/organisers.htm
Murcoch, K & Wilson, J, (2004), Learning Links, Strategic teaching for the learner-centred classroom, Curriculum Corp, Melbourne.
P.L. Duffy Resource Centre 2006, Trinity College, viewed 12th June, 2008, http://search.ninemsn.com.au/results.aspx?form=MICBAF&q=graphic%20organisers
The Graphic Organiser, Graphic.org, Viewed 12th June, 2008, http://www.graphic.org/
Thinking Toolbox: Graphic organisers, 2008, Larapinta Primary School, viewed 12th June 2008, www.schools.nt.edu.au/larapsch/organisers.htm
Write Design Online Graphic Organizers, viewed 10th June, 2008, http://www.writedesignonline.com/organizers/