Embed Size (px)
Citation preview
PM World Journal Exploring Gold Equivalency for Forecasting Vol. II, Issue V – May 2013 Steel Prices on Pipeline Prjoects www.pmworldjournal.net Featured Paper Trian Hendro Asmoro
© 2013 Trian Hendro Asmoro www.pmworldlibrary.net Page 1 of 22
Exploring Gold Equivalency for Forecasting Steel Prices on Pipeline
Projects
Trian Hendro Asmoro, CCE
Abstract The volatility of steel prices and international currency is an element that affects actual project costs. This situation can be mitigated by considering risk contingency as a fixed percentage of the total budget and/or by inputting an inflation factor into the cost estimation. These methods have not overcome the root problem, however, which is the decline in purchasing power of the US dollar as a base currency. As a result, an alternative currency with a stable and reliable value as a cost reference is needed. This paper will explore the possibility of using gold as an alternative currency to be used in forecasting selected steel prices, i.e. billet, hot rolled coil and scrap steel as the main material components in pipeline projects. The reliability of gold in terms of purchasing power compared to the USD will be discussed together with how gold equivalency can be applied for selected steels to establish a gold-based forecasting model. Finally it will be explained how steel prices will refer to the gold price forecast for the next four years. These methods will change the paradigm for estimating the cost of pipeline projects and may be developed for and applied to other projects. Keywords: Steel Prices, Gold Price, Cost Estimation, US Dollar, Purchasing Power, Gold Equivalency, Price Forecast, Project Cost Engineering, Pipeline Project Cost.
1. Introduction
Project cost overruns have become a major issue for project management in recent years. The volatility of steel prices and international currencies is one of many elements that affect actual project costs. Project costs are also affected by the discrepancy between local currencies and the US dollar, the base currency. However, in the last decade, market volatility and quantitative actions by major governments have led to large fluctuations in the value of the US dollar in terms of purchasing power. Although the US dollar has been widely accepted and used as the international currency in most countries [1], using the US dollar as a basis for forecasting prices and cost estimation for future projects is now risky and requires further evaluation.
1.1. Steel Prices
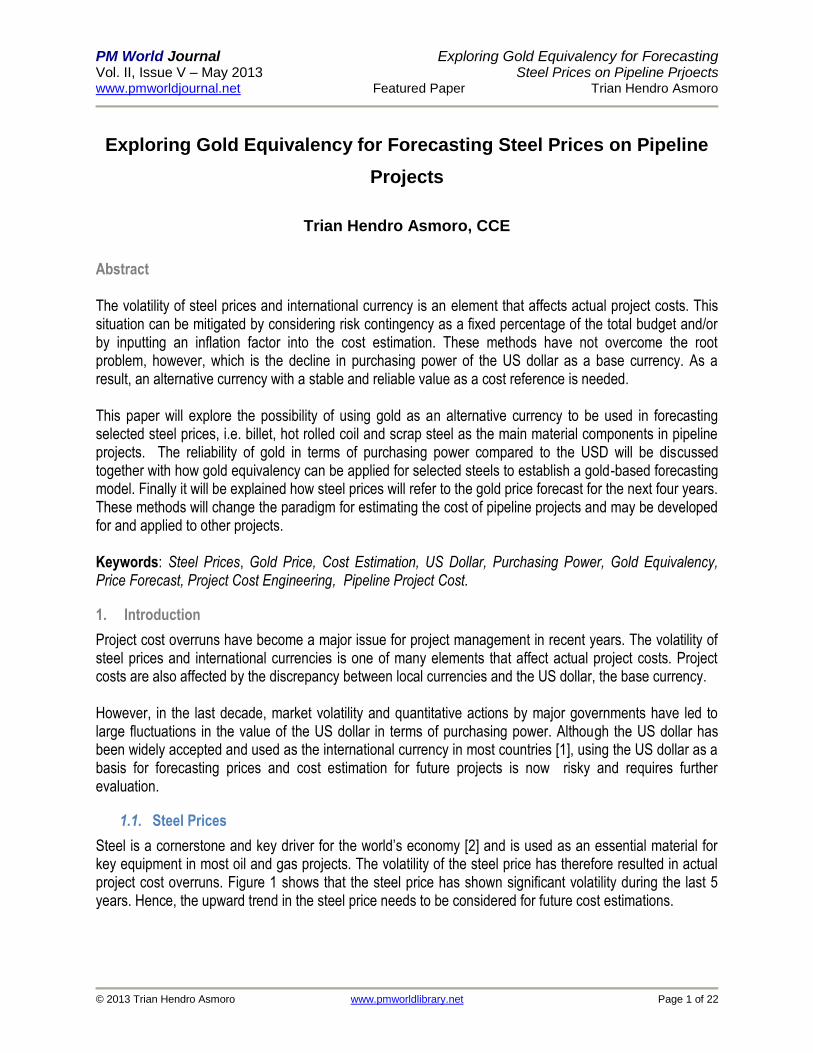
Steel is a cornerstone and key driver for the world’s economy [2] and is used as an essential material for key equipment in most oil and gas projects. The volatility of the steel price has therefore resulted in actual project cost overruns. Figure 1 shows that the steel price has shown significant volatility during the last 5 years. Hence, the upward trend in the steel price needs to be considered for future cost estimations.
PM World Journal Exploring Gold Equivalency for Forecasting Vol. II, Issue V – May 2013 Steel Prices on Pipeline Prjoects www.pmworldjournal.net Featured Paper Trian Hendro Asmoro
© 2013 Trian Hendro Asmoro www.pmworldlibrary.net Page 2 of 22
. Figure 1: World Average Steel Prices 1996 – 2012 [3]
1.2. US Dollar Index
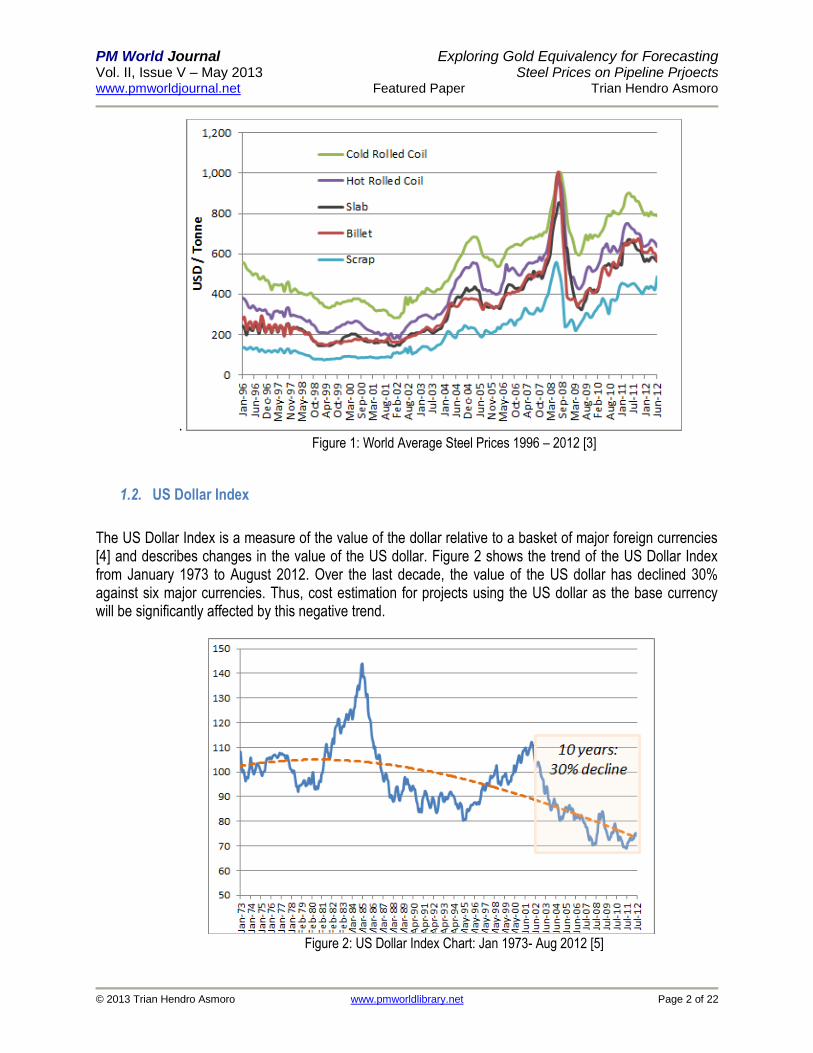
The US Dollar Index is a measure of the value of the dollar relative to a basket of major foreign currencies [4] and describes changes in the value of the US dollar. Figure 2 shows the trend of the US Dollar Index from January 1973 to August 2012. Over the last decade, the value of the US dollar has declined 30% against six major currencies. Thus, cost estimation for projects using the US dollar as the base currency will be significantly affected by this negative trend.
Figure 2: US Dollar Index Chart: Jan 1973- Aug 2012 [5]
PM World Journal Exploring Gold Equivalency for Forecasting Vol. II, Issue V – May 2013 Steel Prices on Pipeline Prjoects www.pmworldjournal.net Featured Paper Trian Hendro Asmoro
© 2013 Trian Hendro Asmoro www.pmworldlibrary.net Page 3 of 22
1.3. Problem Statement
The volatility of steel prices and international currencies is an element that affects the actual project costs. In addition, these costs are also influenced by the discrepancy between local currency and the US dollar as the base currency. This discrepancy is mitigated by building risk contingency as a fixed percentage of the total project budget and/or by inputting an inflation factor into cost estimation. However, these methods have not overcome the root problem, which is the decline in purchasing power of the US dollar. Hence there is a need to use an alternative currency with a stable and reliable value as a cost reference.
This paper will explore the potential for gold as an alternative currency to be used in forecasting selected steel prices, i.e. billet, hot rolled coil and scrap steel as main material components in oil and gas pipeline projects. The reliability of gold in terms of purchasing power compared to the US dollar and inflation will be examined, gold equivalency will be applied for selected steels to establish a gold-based forecasting model, the gold price will be forecasted using a regression model based on historical data, and finally steel prices will refer to the forecasted gold price for the next years (2013 – 2016).
2. Exploring the Purchasing Power of Gold
The purchasing power (PP) of gold will be analyzed and compared to that of the US dollar and US CPI (Consumer Price Index) to establish that gold is more reliable and sustainable in terms of value.
2.1. Gold and US Dollar
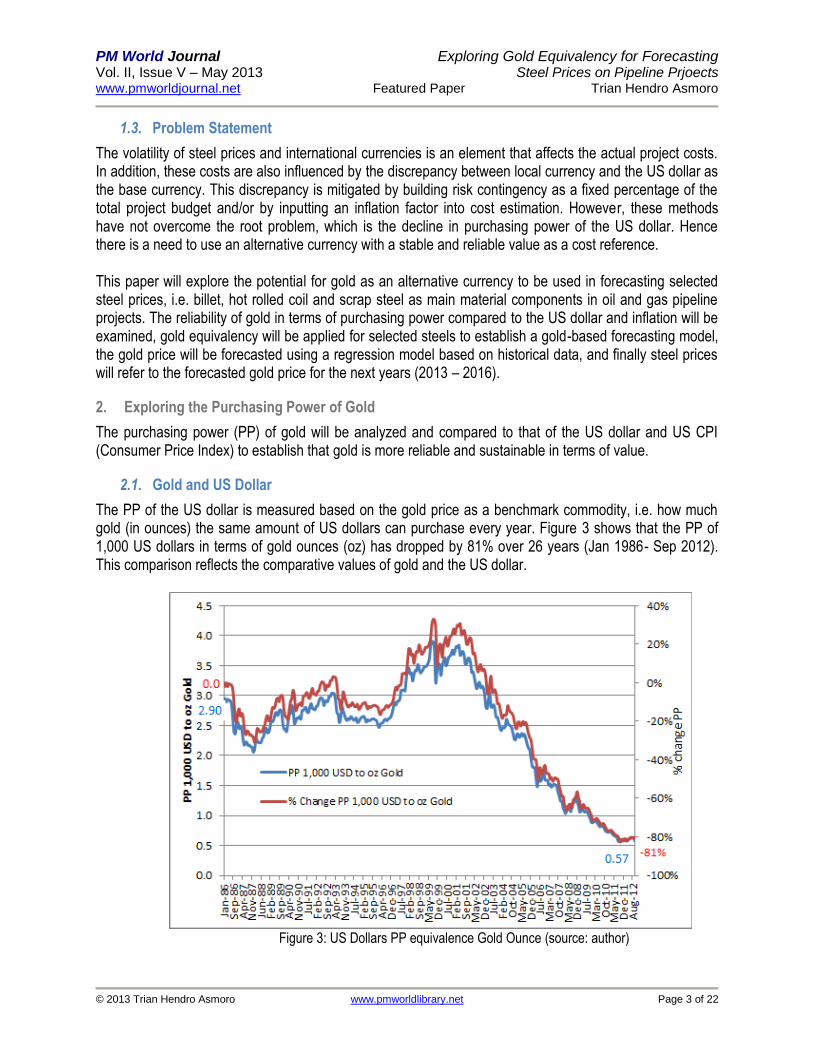
The PP of the US dollar is measured based on the gold price as a benchmark commodity, i.e. how much gold (in ounces) the same amount of US dollars can purchase every year. Figure 3 shows that the PP of 1,000 US dollars in terms of gold ounces (oz) has dropped by 81% over 26 years (Jan 1986- Sep 2012). This comparison reflects the comparative values of gold and the US dollar.
Figure 3: US Dollars PP equivalence Gold Ounce (source: author)

PM World Journal Exploring Gold Equivalency for Forecasting Vol. II, Issue V – May 2013 Steel Prices on Pipeline Prjoects www.pmworldjournal.net Featured Paper Trian Hendro Asmoro
© 2013 Trian Hendro Asmoro www.pmworldlibrary.net Page 4 of 22
The chart shows that the US dollar (along with other paper currencies) has eroded in terms of PP gold over recent years. As a result, any future cost estimation based on the US Dollar is not reliable and runs a high risk of cost overrun. Conversely, the value of gold has seen a reliable and sustainable PP, which makes it superior compared to the US dollar for future baseline of project cost estimation.
2.2. Consumer Price Index (CPI)
CPI represents the changes in price of a selected basket of household goods and services. CPI was considered as a measurement to quantify the purchasing power (PP) of a certain amount of money by answering the question of how much income is required today to purchase the same bag of goods and services that were purchased in the base period [6]. Therefore, comparing PP of the US dollar and gold against CPI will give an alternative comparison against inflation.
Using USD 1,000 in year 1986 as the base value, Figure 4 shows that PP of USD 1,000 has decreased by 109% [7], when benchmarked CPI. Conversely, PP gold has increased by 53.5% according to the value of USD 1,000 benchmarked CPI. This shows that gold has maintained its value compared to the US dollar for many years.
Figure 4: PP US Dollars and PP Gold against CPI (source: author)
In fact, the CPI released from the Government does not reflect the real inflation figure of the market [8]. Therefore, applying the real inflation figure into PP USD will make the CPI look even worse compared to that shown in Figure 4.
3. Model Development Using Gold Value
Steel is a primary material for pipeline projects, thus the cost of steel must be monitored in order to make a better project cost estimation. Using the value of gold has proved to be the most reliable and sustainable way to develop the forecast model for steel prices, i.e. billet, hot rolled coil (HRC) and scrap steel. This model will therefore convert steel volume (tonnes) into its gold equivalent (ounces).
PM World Journal Exploring Gold Equivalency for Forecasting Vol. II, Issue V – May 2013 Steel Prices on Pipeline Prjoects www.pmworldjournal.net Featured Paper Trian Hendro Asmoro
© 2013 Trian Hendro Asmoro www.pmworldlibrary.net Page 5 of 22
3.1. Pipeline Project Cost Components
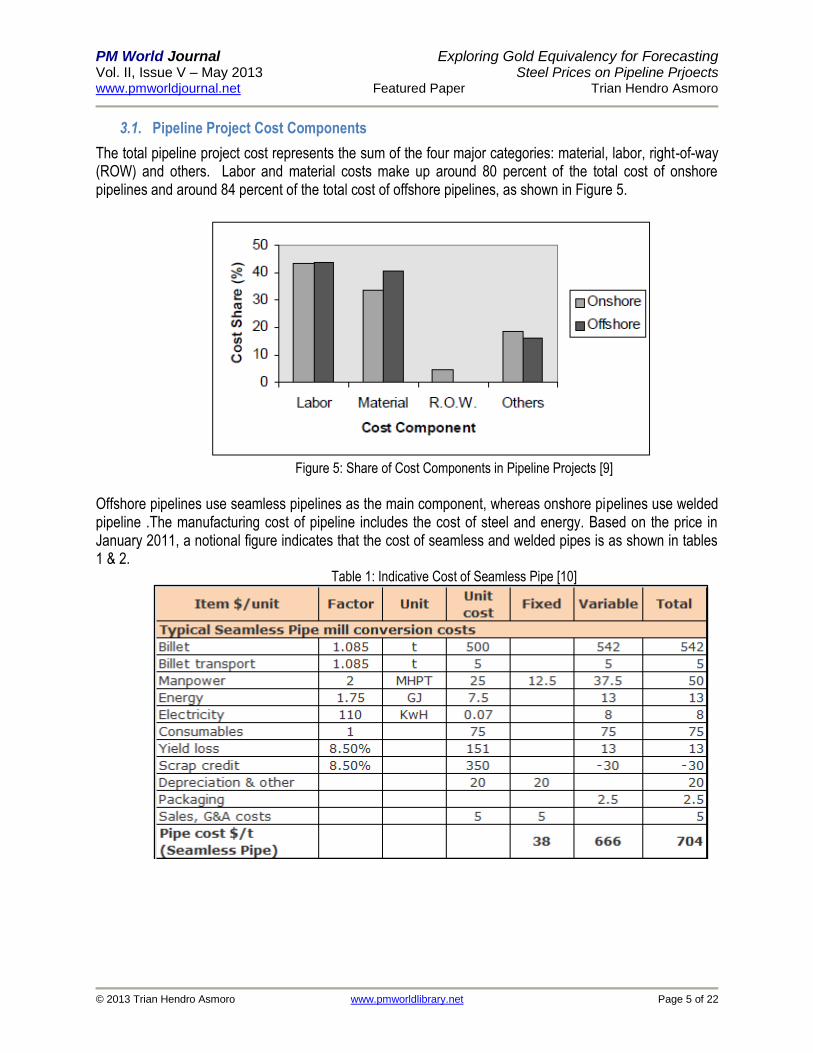
The total pipeline project cost represents the sum of the four major categories: material, labor, right-of-way (ROW) and others. Labor and material costs make up around 80 percent of the total cost of onshore pipelines and around 84 percent of the total cost of offshore pipelines, as shown in Figure 5.
Figure 5: Share of Cost Components in Pipeline Projects [9]
Offshore pipelines use seamless pipelines as the main component, whereas onshore pipelines use welded pipeline .The manufacturing cost of pipeline includes the cost of steel and energy. Based on the price in January 2011, a notional figure indicates that the cost of seamless and welded pipes is as shown in tables 1 & 2.
Table 1: Indicative Cost of Seamless Pipe [10]

PM World Journal Exploring Gold Equivalency for Forecasting Vol. II, Issue V – May 2013 Steel Prices on Pipeline Prjoects www.pmworldjournal.net Featured Paper Trian Hendro Asmoro
© 2013 Trian Hendro Asmoro www.pmworldlibrary.net Page 6 of 22
Table 2: Indicative Cost of Welded Pipe [11]
Following up from tables 1 and 2, the proportion of cost components for seamless and welded pipeline using data in January 2011 is shown in tables 3 and 4. Table 3 shows that billet was 77% of the cost of seamless pipe and scrap was -4.3%. Meanwhile, Table 4 shows that HRC was 90.9% of the cost of welded line pipe and scrap was -2.3%. Scrap shows a negative value because it can be sold on, thus reducing the cost of manufacturing line pipe.
Table 3: Proportion of Pipe Mill Conversion Costs for Seamless Pipe (source: author)
PM World Journal Exploring Gold Equivalency for Forecasting Vol. II, Issue V – May 2013 Steel Prices on Pipeline Prjoects www.pmworldjournal.net Featured Paper Trian Hendro Asmoro
© 2013 Trian Hendro Asmoro www.pmworldlibrary.net Page 7 of 22
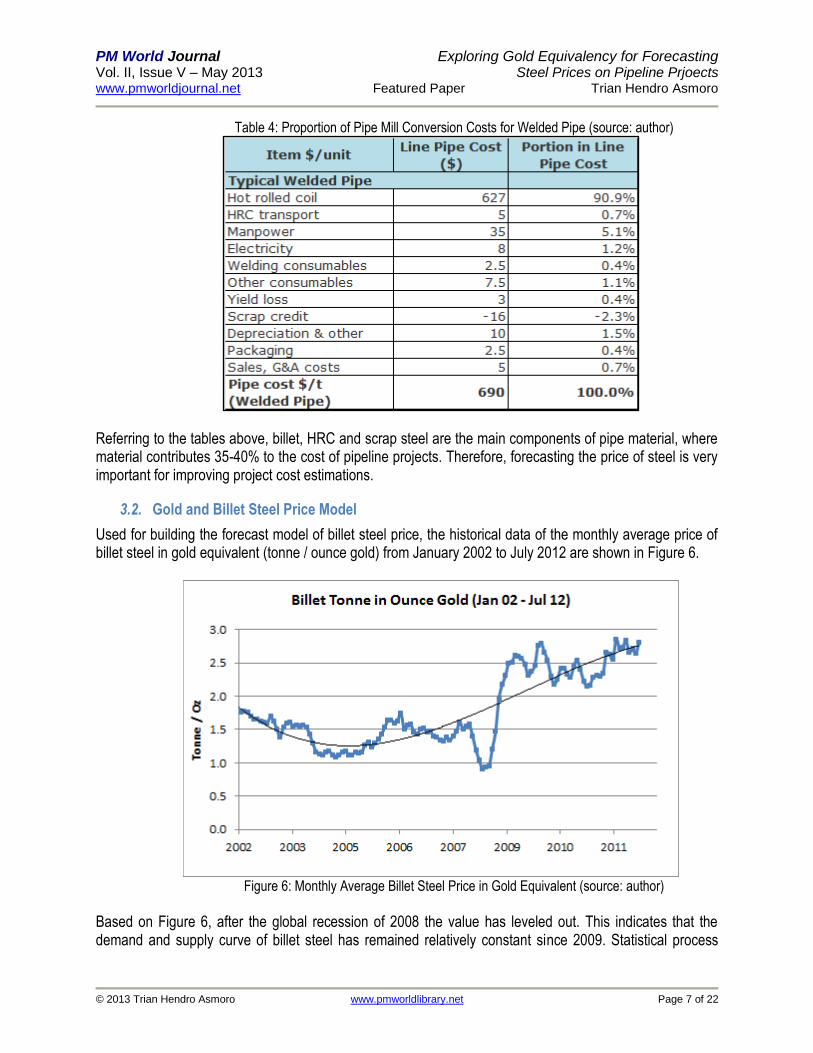
Table 4: Proportion of Pipe Mill Conversion Costs for Welded Pipe (source: author)
Referring to the tables above, billet, HRC and scrap steel are the main components of pipe material, where material contributes 35-40% to the cost of pipeline projects. Therefore, forecasting the price of steel is very important for improving project cost estimations.
3.2. Gold and Billet Steel Price Model
Used for building the forecast model of billet steel price, the historical data of the monthly average price of billet steel in gold equivalent (tonne / ounce gold) from January 2002 to July 2012 are shown in Figure 6.
Figure 6: Monthly Average Billet Steel Price in Gold Equivalent (source: author)
Based on Figure 6, after the global recession of 2008 the value has leveled out. This indicates that the demand and supply curve of billet steel has remained relatively constant since 2009. Statistical process

PM World Journal Exploring Gold Equivalency for Forecasting Vol. II, Issue V – May 2013 Steel Prices on Pipeline Prjoects www.pmworldjournal.net Featured Paper Trian Hendro Asmoro
© 2013 Trian Hendro Asmoro www.pmworldlibrary.net Page 8 of 22
control (SPC) analysis has therefore been chosen to forecast the value for the next four years using monthly observed data from Jan 2009 to July 2012.
SPC analysis of 43 data indicates that outliers are suspected, which will be excluded to build a control chart. Table 5 and Figure 7 show adjusted SPC and control chart for billet-gold equivalency after exclusion of outliers. The SPC and control chart show that since 2009 billet-gold equivalency has statistically remained stable within the range (UCL-LCL) using a confidence level of 99% (six sigma limits). Therefore, the value of billet steel for the following 4 years will be between 2.15 and 2.73 tonne / ounce gold.
Table 5: Adjusted SPC Billet-Gold Equivalency (source: author)
Figure 7: SPC Chart Billet-Gold Equivalency (source: author)
3.3. Gold and Hot Rolled Coil Steel Price Model
The historical data for the monthly average price of hot rolled coil (HRC) steel in gold equivalent (tonne / ounce gold) from Jan 2002 to July 2012 are shown in Figure 8.

PM World Journal Exploring Gold Equivalency for Forecasting Vol. II, Issue V – May 2013 Steel Prices on Pipeline Prjoects www.pmworldjournal.net Featured Paper Trian Hendro Asmoro
© 2013 Trian Hendro Asmoro www.pmworldlibrary.net Page 9 of 22
Figure 8: Monthly Average HRC Steel Price in Gold Equivalent (source: author)
Based on Figure 8, after the global recession started in 2008, the value of HRC steel price in gold equivalent has stabilized. This shows that the demand and supply curve of HRC steel has remained relatively constant since 2009. Statistical process control (SPC) analysis is therefore chosen in order to forecast the value for the next four years using monthly data from Jan 2009 to July 2012.
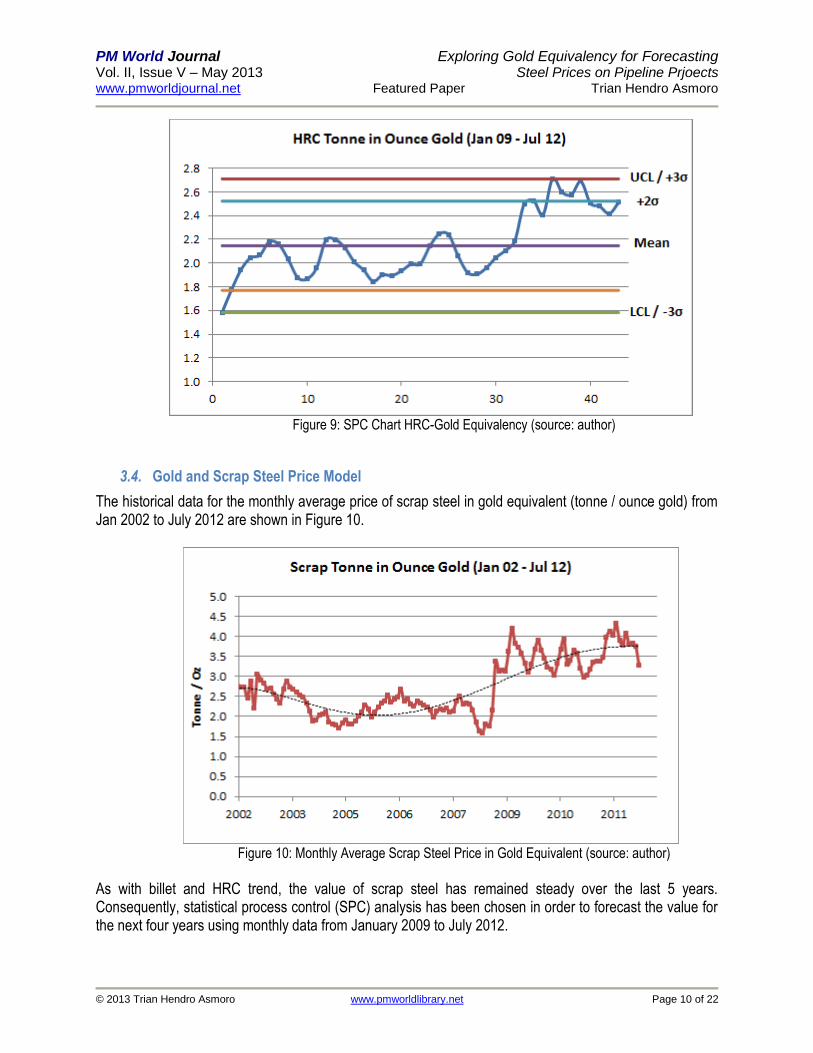
SPC analysis of 43 data indicates that since no outliers were suspected then a control chart can be built. Table 6 and Figure 9 show the SPC and control chart for HRC-gold equivalency. Since 2009, HRC-gold equivalent has remained statistically stable within the range (UCL-LCL) using a confidence level of 99% (six sigma limits). Therefore, the value of HRC steel for the following 4 years will be between 1.58 and 2.71 tonne / ounce gold.
Table 6: SPC HRC-Gold Equivalency (source: author)
PM World Journal Exploring Gold Equivalency for Forecasting Vol. II, Issue V – May 2013 Steel Prices on Pipeline Prjoects www.pmworldjournal.net Featured Paper Trian Hendro Asmoro
© 2013 Trian Hendro Asmoro www.pmworldlibrary.net Page 10 of 22
Figure 9: SPC Chart HRC-Gold Equivalency (source: author)
3.4. Gold and Scrap Steel Price Model
The historical data for the monthly average price of scrap steel in gold equivalent (tonne / ounce gold) from Jan 2002 to July 2012 are shown in Figure 10.
Figure 10: Monthly Average Scrap Steel Price in Gold Equivalent (source: author)
As with billet and HRC trend, the value of scrap steel has remained steady over the last 5 years. Consequently, statistical process control (SPC) analysis has been chosen in order to forecast the value for the next four years using monthly data from January 2009 to July 2012.
PM World Journal Exploring Gold Equivalency for Forecasting Vol. II, Issue V – May 2013 Steel Prices on Pipeline Prjoects www.pmworldjournal.net Featured Paper Trian Hendro Asmoro
© 2013 Trian Hendro Asmoro www.pmworldlibrary.net Page 11 of 22
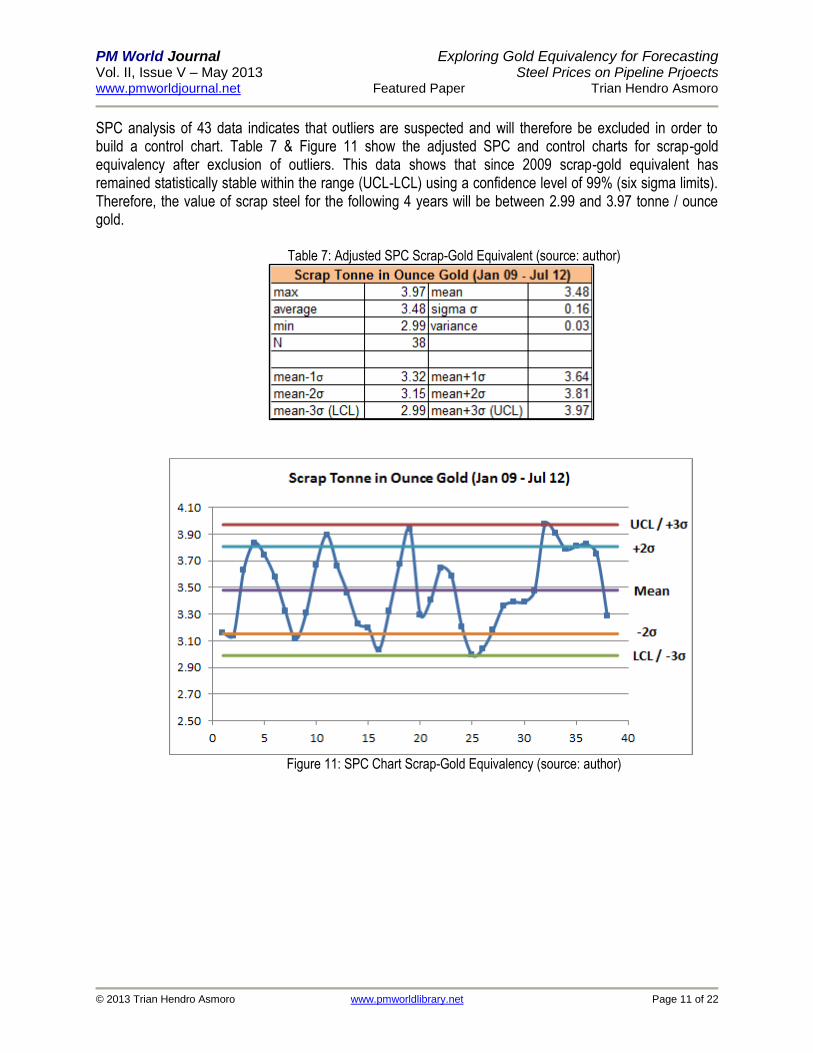
SPC analysis of 43 data indicates that outliers are suspected and will therefore be excluded in order to build a control chart. Table 7 & Figure 11 show the adjusted SPC and control charts for scrap-gold equivalency after exclusion of outliers. This data shows that since 2009 scrap-gold equivalent has remained statistically stable within the range (UCL-LCL) using a confidence level of 99% (six sigma limits). Therefore, the value of scrap steel for the following 4 years will be between 2.99 and 3.97 tonne / ounce gold.
Table 7: Adjusted SPC Scrap-Gold Equivalent (source: author)
Figure 11: SPC Chart Scrap-Gold Equivalency (source: author)
PM World Journal Exploring Gold Equivalency for Forecasting Vol. II, Issue V – May 2013 Steel Prices on Pipeline Prjoects www.pmworldjournal.net Featured Paper Trian Hendro Asmoro
© 2013 Trian Hendro Asmoro www.pmworldlibrary.net Page 12 of 22
4. Model Applications
In this chapter, the gold price will be forecasted based on historical data. The forecast model output of selected steel prices for next four years will be shown based on the gold value.
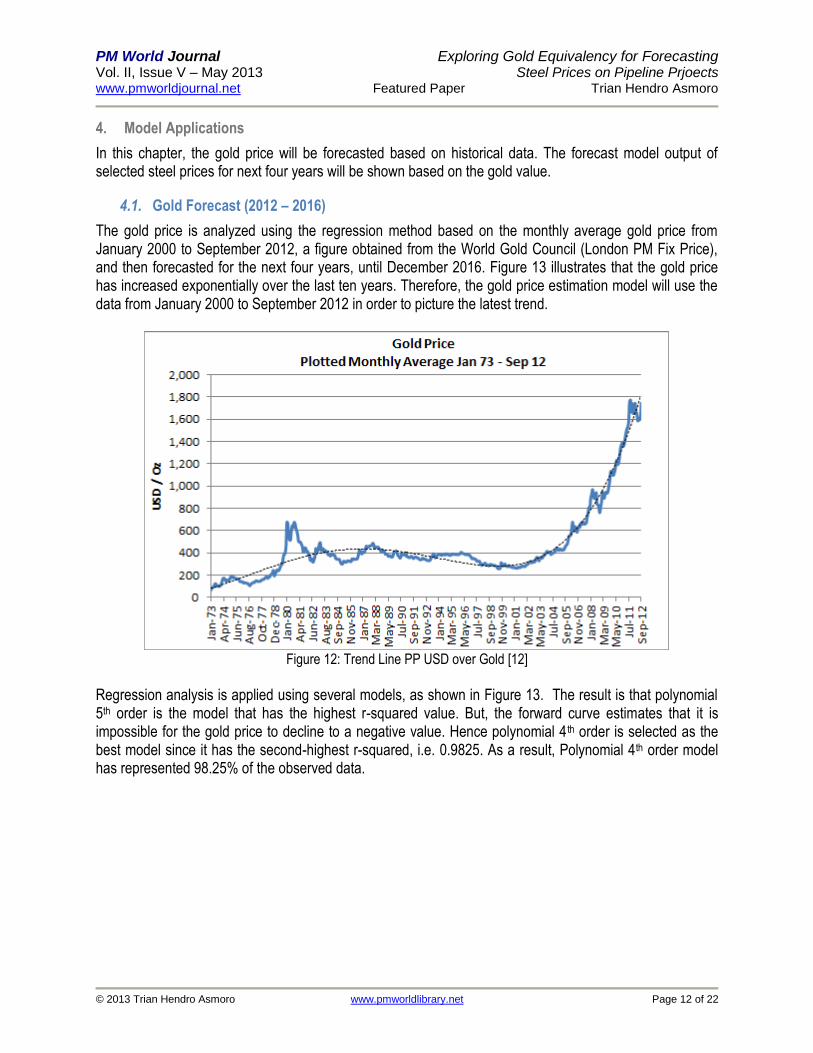
4.1. Gold Forecast (2012 – 2016)
The gold price is analyzed using the regression method based on the monthly average gold price from January 2000 to September 2012, a figure obtained from the World Gold Council (London PM Fix Price), and then forecasted for the next four years, until December 2016. Figure 13 illustrates that the gold price has increased exponentially over the last ten years. Therefore, the gold price estimation model will use the data from January 2000 to September 2012 in order to picture the latest trend.
Figure 12: Trend Line PP USD over Gold [12]
Regression analysis is applied using several models, as shown in Figure 13. The result is that polynomial 5th order is the model that has the highest r-squared value. But, the forward curve estimates that it is impossible for the gold price to decline to a negative value. Hence polynomial 4 th order is selected as the best model since it has the second-highest r-squared, i.e. 0.9825. As a result, Polynomial 4th order model has represented 98.25% of the observed data.

PM World Journal Exploring Gold Equivalency for Forecasting Vol. II, Issue V – May 2013 Steel Prices on Pipeline Prjoects www.pmworldjournal.net Featured Paper Trian Hendro Asmoro
© 2013 Trian Hendro Asmoro www.pmworldlibrary.net Page 13 of 22
Figure 13: Gold Price Forecast using Regression Models (source: author)
Next, the regression equation selected is based on a moderate, aggressive and conservative model to develop a range estimate. As a result, polynomial 4th order is treated as a moderate model, polynomial 3rd order is treated as an aggressive model, and linear is treated as a conservative model. The equations shown in equations 1, 2 and 3 below are used to forecast the average monthly gold price until 2016.
(Equation 1)
(Equation 2)
(Equation 3) YM = average monthly gold price of moderate forecast model 2012-2016 YA = average monthly gold price of aggressive forecast model 2012-2016 YC = average monthly gold price of conservative forecast model 2012-2016 X = monthly time unit 153 + n (1, 2, 3…)
Following this, the moderate model is tested using residual (error) analysis to describe the reliability of the base predictive model. Table 8 and Figure 14 show the residual analysis and plot using control chart, after comparing Equation 2 output to actual data.

PM World Journal Exploring Gold Equivalency for Forecasting Vol. II, Issue V – May 2013 Steel Prices on Pipeline Prjoects www.pmworldjournal.net Featured Paper Trian Hendro Asmoro
© 2013 Trian Hendro Asmoro www.pmworldlibrary.net Page 14 of 22
Table 8: Chart Variables for Residual Analysis (source: author)
Figure 14: Residual Analysis Chart for Gold Price Forecast Model (source: author)
This indicates that the model is quite reliable, supported by the following conditions [13]:
a. The variance of residual data is relatively constant - either increasing or decreasing over the period (stationary condition)
b. Residuals show no drift with time (consistency condition)
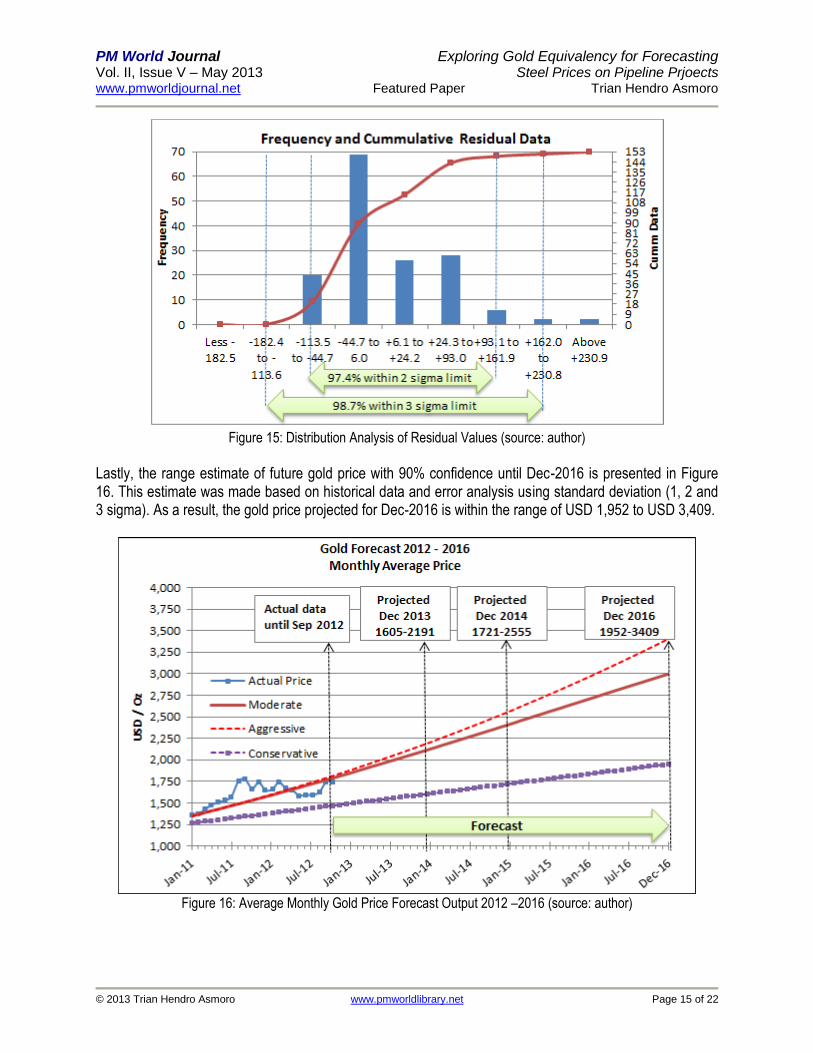
c. Distribution of residual (error) values shows 97.4% are within 2 sigma limit and 98.7% within 3
sigma limit as shown in Figure 15. Therefore, the model will be used as predictive model of future gold prices.
PM World Journal Exploring Gold Equivalency for Forecasting Vol. II, Issue V – May 2013 Steel Prices on Pipeline Prjoects www.pmworldjournal.net Featured Paper Trian Hendro Asmoro
© 2013 Trian Hendro Asmoro www.pmworldlibrary.net Page 15 of 22
Figure 15: Distribution Analysis of Residual Values (source: author)
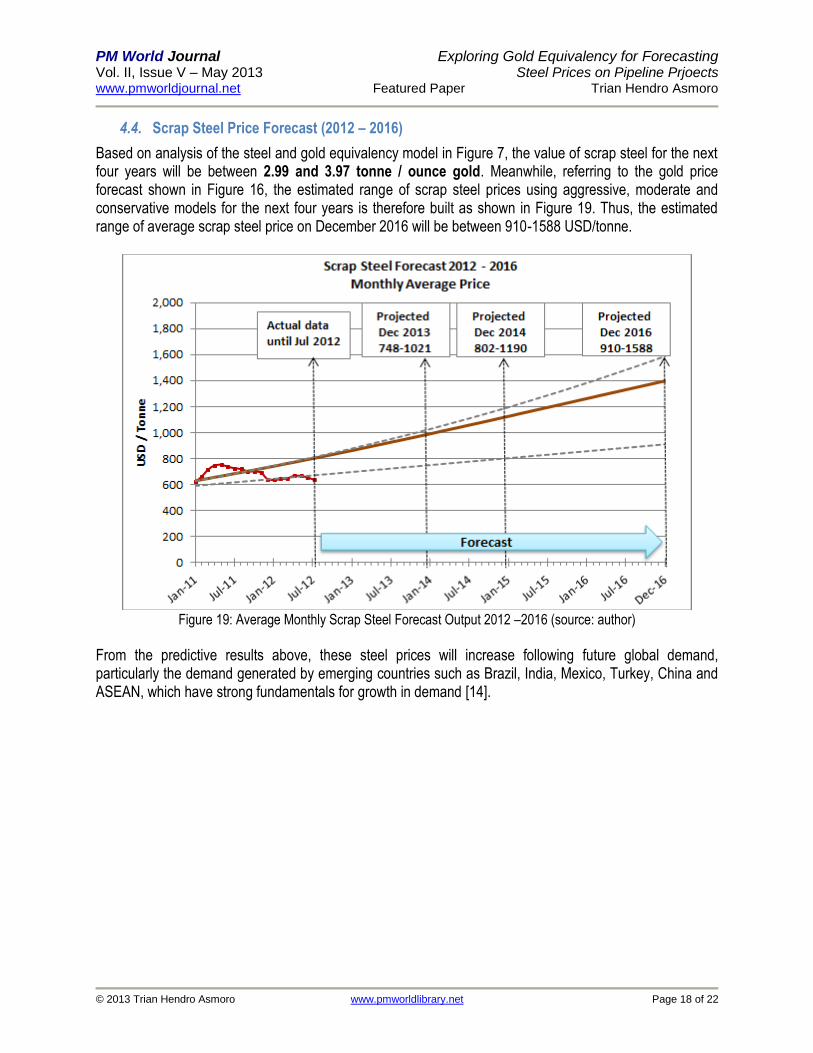
Lastly, the range estimate of future gold price with 90% confidence until Dec-2016 is presented in Figure 16. This estimate was made based on historical data and error analysis using standard deviation (1, 2 and 3 sigma). As a result, the gold price projected for Dec-2016 is within the range of USD 1,952 to USD 3,409.
Figure 16: Average Monthly Gold Price Forecast Output 2012 –2016 (source: author)

PM World Journal Exploring Gold Equivalency for Forecasting Vol. II, Issue V – May 2013 Steel Prices on Pipeline Prjoects www.pmworldjournal.net Featured Paper Trian Hendro Asmoro
© 2013 Trian Hendro Asmoro www.pmworldlibrary.net Page 16 of 22
4.2. Billet Steel Prices Forecast (2012 – 2016)
Based on the analysis of steel and gold equivalency model in Figure 7, the value of billet steel for the next four years will be between 2.15 and 2.73 tonne / ounce gold. Meanwhile, referring to the gold price forecast shown in Figure 16, the estimated range of billet steel prices using aggressive, moderate and conservative models for the next four years are therefore built as shown in Figure 17. Thus, the estimated range of the average billet steel price in December 2016 will be between 800 and 1,397 USD/tonne.
Figure 17: Average Monthly Billet Steel Price Forecast Output 2012 –2016 (source: author)

PM World Journal Exploring Gold Equivalency for Forecasting Vol. II, Issue V – May 2013 Steel Prices on Pipeline Prjoects www.pmworldjournal.net Featured Paper Trian Hendro Asmoro
© 2013 Trian Hendro Asmoro www.pmworldlibrary.net Page 17 of 22
4.3. Hot Rolled Coil Steel Price Forecast (2012 – 2016)
Based on analysis of the steel and gold equivalency model in Figure 7, the value of hot rolled coil (HRC) steel for the next four years will be between 1.58 and 2.71 tonne / ounce gold. Meanwhile, referring to the gold price forecast shown in Figure 16, the estimated range of HRC steel prices using aggressive, moderate and conservative models for the next four years is therefore built as shown in Figure 18. Thus, the estimated range of average HRC steel price on December 2016 will be between 561 and 980 USD/tonne.
Figure 18: Average Monthly HRC Steel Forecast Output 2012 –2016 (source: author)
PM World Journal Exploring Gold Equivalency for Forecasting Vol. II, Issue V – May 2013 Steel Prices on Pipeline Prjoects www.pmworldjournal.net Featured Paper Trian Hendro Asmoro
© 2013 Trian Hendro Asmoro www.pmworldlibrary.net Page 18 of 22
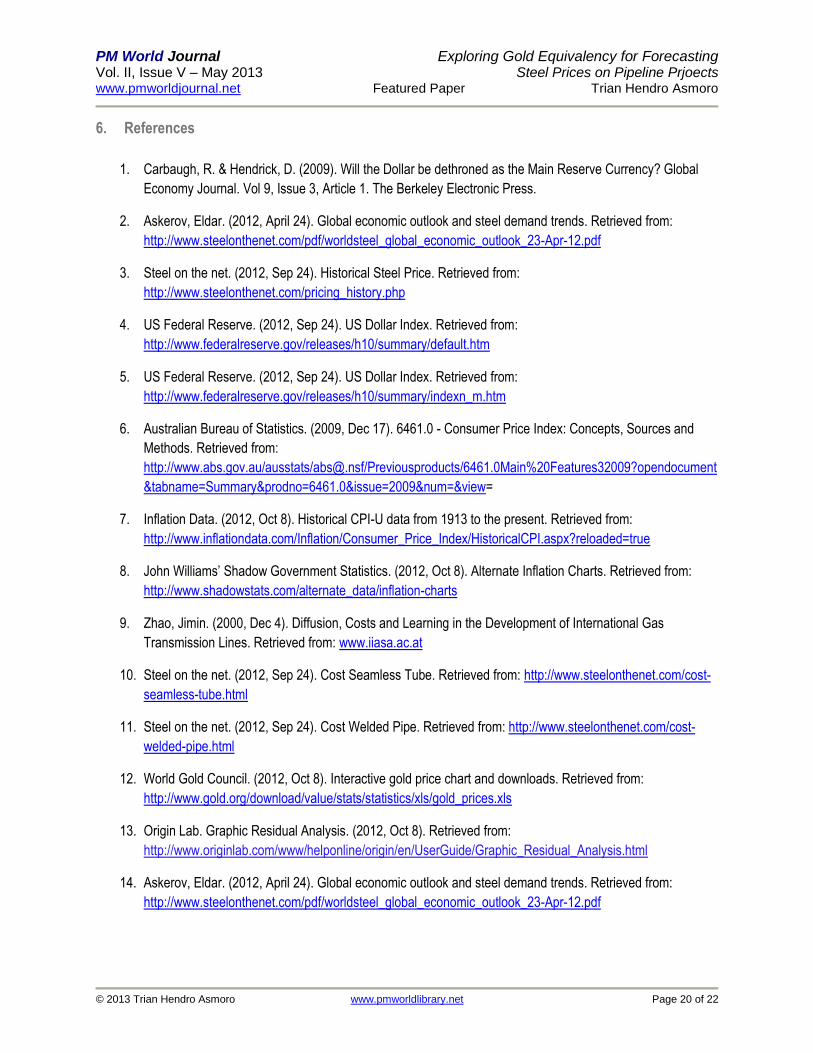
4.4. Scrap Steel Price Forecast (2012 – 2016)
Based on analysis of the steel and gold equivalency model in Figure 7, the value of scrap steel for the next four years will be between 2.99 and 3.97 tonne / ounce gold. Meanwhile, referring to the gold price forecast shown in Figure 16, the estimated range of scrap steel prices using aggressive, moderate and conservative models for the next four years is therefore built as shown in Figure 19. Thus, the estimated range of average scrap steel price on December 2016 will be between 910-1588 USD/tonne.
Figure 19: Average Monthly Scrap Steel Forecast Output 2012 –2016 (source: author)
From the predictive results above, these steel prices will increase following future global demand, particularly the demand generated by emerging countries such as Brazil, India, Mexico, Turkey, China and ASEAN, which have strong fundamentals for growth in demand [14].

PM World Journal Exploring Gold Equivalency for Forecasting Vol. II, Issue V – May 2013 Steel Prices on Pipeline Prjoects www.pmworldjournal.net Featured Paper Trian Hendro Asmoro
© 2013 Trian Hendro Asmoro www.pmworldlibrary.net Page 19 of 22
5. Conclusion
This paper explores the possibility of using gold as an alternative currency applicable for estimating the cost of material for pipeline projects due to the fact that the purchasing power of the US dollar has declined. This deterioration in the value of the USD as the base currency for estimating costs can lead to project cost overruns, which indeed have occurred for many years. Applying an inflation factor when cost-estimating is not a better approach, since the government always tries to manipulate the actual figures. This paper finds that actual prices of billet, hot rolled coil (HRC) and scrap steel used as the main material components for pipeline projects have maintained a consistent value in terms of gold equivalent (ounce gold / tonne steel), thus the forecast for steel prices should use gold equivalency to maintain price reliability. As a result, a predictive gold price model has been built to last until 2016 using three different scenarios, i.e. moderate, conservative and aggressive, and has been used as a reference for the price of steel. Finally, the forecast model for selected steel prices of billet, HRC and scrap steel until the end of 2016 will be based on the gold value. This paper concludes that gold should be adapted as a feasible alternative to establish the new yardstick for project cost baseline. A similar approach using gold equivalency can be implemented for other project materials or commodities, since only real money with intrinsic value such as gold will stand the test of time.
PM World Journal Exploring Gold Equivalency for Forecasting Vol. II, Issue V – May 2013 Steel Prices on Pipeline Prjoects www.pmworldjournal.net Featured Paper Trian Hendro Asmoro
© 2013 Trian Hendro Asmoro www.pmworldlibrary.net Page 20 of 22
6. References
1. Carbaugh, R. & Hendrick, D. (2009). Will the Dollar be dethroned as the Main Reserve Currency? Global
Economy Journal. Vol 9, Issue 3, Article 1. The Berkeley Electronic Press.
2. Askerov, Eldar. (2012, April 24). Global economic outlook and steel demand trends. Retrieved from:
http://www.steelonthenet.com/pdf/worldsteel_global_economic_outlook_23-Apr-12.pdf
3. Steel on the net. (2012, Sep 24). Historical Steel Price. Retrieved from:
http://www.steelonthenet.com/pricing_history.php
4. US Federal Reserve. (2012, Sep 24). US Dollar Index. Retrieved from:
http://www.federalreserve.gov/releases/h10/summary/default.htm
5. US Federal Reserve. (2012, Sep 24). US Dollar Index. Retrieved from:
http://www.federalreserve.gov/releases/h10/summary/indexn_m.htm
6. Australian Bureau of Statistics. (2009, Dec 17). 6461.0 - Consumer Price Index: Concepts, Sources and
Methods. Retrieved from:
http://www.abs.gov.au/ausstats/[email protected]/Previousproducts/6461.0Main%20Features32009?opendocument
&tabname=Summary&prodno=6461.0&issue=2009&num=&view=
7. Inflation Data. (2012, Oct 8). Historical CPI-U data from 1913 to the present. Retrieved from:
http://www.inflationdata.com/Inflation/Consumer_Price_Index/HistoricalCPI.aspx?reloaded=true
8. John Williams’ Shadow Government Statistics. (2012, Oct 8). Alternate Inflation Charts. Retrieved from:
http://www.shadowstats.com/alternate_data/inflation-charts
9. Zhao, Jimin. (2000, Dec 4). Diffusion, Costs and Learning in the Development of International Gas
Transmission Lines. Retrieved from: www.iiasa.ac.at
10. Steel on the net. (2012, Sep 24). Cost Seamless Tube. Retrieved from: http://www.steelonthenet.com/cost-
seamless-tube.html
11. Steel on the net. (2012, Sep 24). Cost Welded Pipe. Retrieved from: http://www.steelonthenet.com/cost-
welded-pipe.html
12. World Gold Council. (2012, Oct 8). Interactive gold price chart and downloads. Retrieved from:
http://www.gold.org/download/value/stats/statistics/xls/gold_prices.xls
13. Origin Lab. Graphic Residual Analysis. (2012, Oct 8). Retrieved from:
http://www.originlab.com/www/helponline/origin/en/UserGuide/Graphic_Residual_Analysis.html
14. Askerov, Eldar. (2012, April 24). Global economic outlook and steel demand trends. Retrieved from:
http://www.steelonthenet.com/pdf/worldsteel_global_economic_outlook_23-Apr-12.pdf
PM World Journal Exploring Gold Equivalency for Forecasting Vol. II, Issue V – May 2013 Steel Prices on Pipeline Prjoects www.pmworldjournal.net Featured Paper Trian Hendro Asmoro
© 2013 Trian Hendro Asmoro www.pmworldlibrary.net Page 21 of 22
7. Bibliography
1. MEPS. (2012, Sep 24). World Carbon Steel Prices. Retrieved from:
http://www.meps.co.uk/World%20Carbon%20Price.htm
2. Federal Reserve Bank of Atlanta. Dollar Index Historical Data. Retrieved from:
http://www.frbatlanta.org/dollarindex/User/dsp_index_menu.cfm
3. Mckinsey Quarterly. (2002, Oct). The real cost of equity. Retrieved from:
https://www.mckinseyquarterly.com/The_real_cost_of_equity_1533
4. KITCO Gold Index. (2012, Sep 24). Gold Historical Charts. Retrieved from:
http://www.kitco.com/charts/historicalgold.html
5. Gold Price Network. (2012, Sep 24). Gold price per ounce in Indonesia in Rupiah (IDR). Retrieved from:
http://goldpricenetwork.com/goldprice/indonesia/
6. Bereau of Labor Statistics. (2012, Oct 8). Consumer Price Index. Retrieved from:
http://www.bls.gov/cpi/tables.htm
7. Ming, T. (2001, Feb). An Introduction to SPC: SPC Tools - Control charts. Retrieved from:
http://lorien.ncl.ac.uk/ming/spc/spc8.htm
8. Arsham, H. (2011). Predictions by Regression. Retrieve from: http://home.ubalt.edu/ntsbarsh/stat-
data/forecast.htm#rcomputeodel
9. John Williams’ Shadow Government Statistics. (2008, Sep 10). Response to BLS Article on CPI
Misconceptions. Retrieved from: http://www.shadowstats.com/article/special-comment
10. US Government, Department of Energy (DOE). (1995, Oct). How to Measure Performance: A Handbook of
Techniques and Tools. Retrieved from: http://www.orau.gov/pbm/documents/handbook1.html
11. Department of Defense (DoD), Information Analysis Center (IAC). Statistical Process Control. Retrieved
from: http://goldpractice.thedacs.com/practices/spc/index.php
12. Bob Emery. (2012, Oct 20). Prepared Notes. Retrieved from:
http://webs.mn.catholic.edu.au/physics/emery/measurement.htm#Accuracy
13. Why is gold considered a “Safe-Haven”?. Retrieved from: http://www.forexnews.com/questions/why-is-gold-
considered-a-safe-haven/
14. Becker, Antoaneta, CHINA: Not Dollar, Not Euro, But Gold, The Stories Underneath. Retrieved from
http://www.ipsnews.net/news.asp?idnews=56552
15. Bivens, J. (2003, Jul 24). The benefits of the dollar’s decline. Retrieved from:
http://www.epi.org/publication/briefingpapers_bp140/

PM World Journal Exploring Gold Equivalency for Forecasting Vol. II, Issue V – May 2013 Steel Prices on Pipeline Prjoects www.pmworldjournal.net Featured Paper Trian Hendro Asmoro
© 2013 Trian Hendro Asmoro www.pmworldlibrary.net Page 22 of 22
About the Author
Trian Hendro Asmoro
Jakarta, Indonesia
Trian Hendro Asmoro is an oil and gas professional with 7
years of experiences in project management and cost engineering, i.e. project coordinator, project site engineer, and pipeline project leader. He is currently a planning & cost engineer at PT Medco E&P Indonesia. Trian holds a bachelor degree in Industrial Engineering from Institut Teknologi Bandung (ITB), and a Magister Management (MM) degree in Strategic Finance (Distinction) from Paramadina Graduate School (PGS). Trian is a Certified Cost Engineer (CCE), driven by passion to share contribution in oil & gas sector. He has published several professional papers in Indonesia and International events. He lives in Jakarta, Indonesia and can be contacted at [email protected]