Embed Size (px)
Citation preview

Exploring Environmental ProblemsStudent Edition

Cop
yrig
ht ©
Gle
ncoe
/McG
raw
-Hill
, a d
ivis
ion
of t
he M
cGra
w-H
ill C
ompa
nies
, Inc
.
Earth Science: Geology, the Environment, and the Universe
Laboratory Manual, SE and TE
GeoLab and MiniLab Worksheets
Exploring Environmental Problems, SE and TE
Study Guide for Content Mastery, SE and TE
Chapter Assessment
Performance Assessment in Earth Science
ExamView™ Pro CD-ROM Windows/Macintosh
Cooperative Learning in the Science Classroom
Performance Assessment in the Science Classroom
Alternate Assessment in the Science Classroom
Glencoe Science Web Site: science.glencoe.com
Lesson Plans
Block Scheduling Lesson Plans
Section Focus Transparencies and Masters
Teaching Transparencies and Masters
MindJogger Videoquizzes, VHS/DVD
Puzzlemaker Software, Windows/Macintosh
Guided Reading Audio Program
Interactive Teacher Edition CD-ROM
Interactive Lesson Planner CD-ROM
Using the Internet in the Science Classroom
Glencoe/McGraw-Hill
Copyright © by The McGraw-Hill Companies, Inc. All rights reserved. Permission is granted to reproduce the material containedherein on the condition that such material be reproduced only for classroom use; be provided to students, teachers, and familieswithout charge; and be used solely in conjunction with the Earth Science: Geology, the Environment, and the Universe program.Any other reproduction, for use or sale, is prohibited without prior written permission of the publisher.
Send all inquiries to:Glencoe/McGraw-Hill8787 Orion PlaceColumbus, OH 43240
ISBN 0-07-824569-9Printed in the United States of America.1 2 3 4 5 6 7 8 9 10 045 08 07 06 05 04 03 02 01
Credits
ART CREDITSMacArt Design: 14, 24, 61; Navta Associates: 46, 57, 70T, 71T, 72T

Cop
yrig
ht ©
Gle
ncoe
/McG
raw
-Hill
, a d
ivis
ion
of t
he M
cGra
w-H
ill C
ompa
nies
, Inc
.
Exploring Environmental Problems Earth Science: Geology, the Environment, and the Universe iii
EXPLORING ENVIRONMENTAL PROBLEMS
Contents
How to Use This Laboratory Manual . . . . . . . . . . . . . . . . . . . . . . . . . ivWriting a Laboratory Report . . . . . . . . . . . . . . . . . . . . . . . . . . . . . . . . vTechnology-Based Systems for the Lab . . . . . . . . . . . . . . . . . . . . . . . viiLaboratory Equipment . . . . . . . . . . . . . . . . . . . . . . . . . . . . . . . . . . . viiiSafety in the Laboratory . . . . . . . . . . . . . . . . . . . . . . . . . . . . . . . . . . . . xiSafety Symbols . . . . . . . . . . . . . . . . . . . . . . . . . . . . . . . . . . . . . . . . . . . xiiUsing Technology to Study Environmental Science . . . . . . . . . . . . . xiii
Calculator-Based Labs1 CALCULATOR-BASED LAB/DESIGN YOUR OWN
How can certain factors affect the health of an ecosystem? . . . . . . . . . . . . . . . . . . . . . . . . 1
2 CALCULATOR-BASED LAB/DESIGN YOUR OWN
How can you test a hypothesis about the condition of a body of water? . . . . . . . . . . . . . . 5
3 CALCULATOR-BASED LAB
How does the presence of water vapor and carbon dioxide affect the temperature of Earth’s atmosphere? . . . . . . . . . . . . . . . . . . . . . . . . . . . . . . . . . . . . . . . . . . 9
4 CALCULATOR-BASED LAB
How might global warming affect sea level? . . . . . . . . . . . . . . . . . . . . . . . . . . . . . . . . . . . 13
5 CALCULATOR-BASED LAB
How does increased CO2 affect the pH of water? . . . . . . . . . . . . . . . . . . . . . . . . . . . . . . . 17
6 CALCULATOR-BASED LAB
Simulating Acid Precipitation Using H2SO4 . . . . . . . . . . . . . . . . . . . . . . . . . . . . . . . . . . . 21
7 CALCULATOR-BASED LAB/DESIGN YOUR OWN
How does exposure to acid solutions affect metal and stone? . . . . . . . . . . . . . . . . . . . . . 25
8 CALCULATOR-BASED LAB
What is the effect of deforestation on the microclimate of an area? . . . . . . . . . . . . . . . . .29
9 CALCULATOR-BASED LAB
How can runoff affect the water quality of streams and rivers? . . . . . . . . . . . . . . . . . . . . 33
10 CALCULATOR-BASED LAB
How much wasted energy goes out the window? . . . . . . . . . . . . . . . . . . . . . . . . . . . . . . . 37
11 CALCULATOR-BASED LAB
Which type of lightbulb is more efficient? . . . . . . . . . . . . . . . . . . . . . . . . . . . . . . . . . . . . 41
Global Positioning System Labs12 GLOBAL POSITIONING SYSTEM LAB
How can you use a GPS receiver to find your position on Earth’s surface? . . . . . . . . . . . 45
13 GLOBAL POSITIONING SYSTEM LAB
How can you use GPS to make a map and find direction? . . . . . . . . . . . . . . . . . . . . . . . 49
14 GLOBAL POSITIONING SYSTEM LAB
GPS Scavenger Hunt . . . . . . . . . . . . . . . . . . . . . . . . . . . . . . . . . . . . . . . . . . . . . . . . . . . . . 53
15 GLOBAL POSITIONING SYSTEM LAB
GPS Scavenger Hunt for Experts . . . . . . . . . . . . . . . . . . . . . . . . . . . . . . . . . . . . . . . . . . . . 57
16 GLOBAL POSITIONING SYSTEM LAB
How does runoff in a watershed affect the water quality of a wetland? . . . . . . . . . . . . . 61

Cop
yrig
ht ©
Gle
ncoe
/McG
raw
-Hill
, a d
ivis
ion
of t
he M
cGra
w-H
ill C
ompa
nies
, Inc
.
iv Earth Science: Geology, the Environment, and the Universe Exploring Environmental Problems
EXPLORING ENVIRONMENTAL PROBLEMS
How to Use This Laboratory Manual
Working in the laboratory throughout the course of the year can be an enjoyablepart of your Earth science experience. Earth Science: Geology, the Environment,and the Universe Exploring Environmental Problems is a tool for making yourlaboratory work both worthwhile and fun. The laboratory activities are designed tofulfill the following purposes:
• to stimulate your interest in science in general and especially in Earth science
• to reinforce important concepts studied in your textbook
• to allow you to verify some of the scientific information learned during your Earth science course
• to allow you to discover for yourself Earth science concepts and ideas not necessarily covered in class or in the textbook readings
• to acquaint you with a variety of modern tools and techniques used by today’sEarth scientists
Most importantly, the laboratory activities will give you firsthand experience in how a scientist works.
The activities in Exploring Environmental Problems are of two types:Calculator-Based Labs and Global Positioning System Labs. In an activity, you willbe presented with a problem. Then, through use of scientific methods, you will seekanswers. Your conclusions will be based on your observations alone or on thosemade by the entire class, recorded experimental data, and your interpretation ofwhat the data and observations mean. Some of the Calculator-Based Labs areDesign Your Own, which are similar to the Design Your Own labs in your textbook.In Design Your Own labs, you will design your own experiments to find answers to problems.
The Calculator-Based System (CBL) is an interface that collects data fromprobes and sends the information to a calculator. The calculator, in turn, runsstored data collection and processing programs, which interpret and plot dataobtained from the CBL system.
You may substitute a Macintosh or PC computer for a calculator. A computerinterface (microcomputer) is then substituted for the CBL System. The computercan run a variety of data analysis programs, which will graph and analyze datacollected from the interface.
Global Positioning System, or GPS, is the instrument you will use for the last five labs. This is an instrument for locating your position on Earth. Its mainpurpose is to provide navigation information. It is designed to pinpoint latitude,longitude, and elevation on Earth.
In addition to the activities, this laboratory manual has several other features—a description of how to write a lab report, diagrams of laboratory equipment, andinformation on safety that includes first aid and a safety contract. Read the sectionon safety now. Safety in the laboratory is your responsibility. Working in thelaboratory can be a safe and fun learning experience. By using Earth Science:Geology, the Environment, and the Universe, Exploring Environmental Problems,you will find Earth science both understandable and exciting. Have a good year!

Cop
yrig
ht ©
Gle
ncoe
/McG
raw
-Hill
, a d
ivis
ion
of t
he M
cGra
w-H
ill C
ompa
nies
, Inc
.
Exploring Environmental Problems Earth Science: Geology, the Environment, and the Universe v
EXPLORING ENVIRONMENTAL PROBLEMS
Writing a Laboratory Report
When scientists perform experiments, they make observations, collect and analyze data, and formulategeneralizations about the data. When you work in the laboratory, you should record all your data in alaboratory report. An analysis of data is easier if all data are recorded in an organized, logical manner.Tables and graphs are often used for this purpose.
A written laboratory report should include all of the following elements.
RESEARCH QUESTION: What exactly do you want to know as a result ofconducting this experiment?
HYPOTHESIS: The hypothesis is the guide for the research. Write a clear andconcise statement that, based on your prior knowledge and literaturereview, you think this experiment will confirm.
MATERIALS: List all laboratory equipment and other materials needed toperform the experiment.
PROCEDURE: Describe each step of the procedure so that someone elsecould perform the experiment following your directions.
DATA AND DATA ANALYSIS: Include in your report all observations, data,tables, graphs, and sketches necessary to test your hypothesis.
CONCLUSION: When testing a hypothesis, there are only three possibleconclusions: data support the hypothesis; data reject the hypothesis; ordata are inconclusive to support or reject the hypothesis.
DISCUSSION: Describe the implications of your findings. If possible, answeryour research question based on your findings. Include error analysis andsuggestions for repeating the experiment to better answer the researchquestions. What still remains unknown?
Read the following description of an environmental experiment. Then answer the questions.
A group of students conducted an experiment to test which flower color attractsinsects. They randomly placed six plastic flowers of four colors in a matrix. Theyobserved the flowers for 2 hours and counted the number of insects that flew toeach flower. The next day they observed that spider webs were attached to manyof the flowers. One student hypothesized that spiders know which flowersattract insects. Spiders then build webs to catch the insects.
Table 1 Insects Attracted to Colored Flowers Table 2 Spider Web Appearances
1. What was the purpose of the second experiment?
2. What materials were needed for the two experiments?
6 Blue 6 White 6 Red 6 Yellow Insects Flowers Flowers Flowers Flowers
Flies 1 5 5 5
Bees 2 10 10 12
Ants 1 0 0 1
Blue White Red Yellow
Webs 0 4 3 4

3. Write a step-by-step procedure for testing the first experiment, the color preference of the insects.
4. Table 2 shows the data collected in the spider web experiment. Based on these data, state a conclusion for this experiment.
5. Plot the data in Table 1 on a graph. Show total number of insects on the vertical axis and the color on the horizontal axis.
Cop
yrig
ht ©
Gle
ncoe
/McG
raw
-Hill
, a d
ivis
ion
of t
he M
cGra
w-H
ill C
ompa
nies
, Inc
.
vi Earth Science: Geology, the Environment, and the Universe Exploring Environmental Problems
EXPLORING ENVIRONMENTAL PROBLEMS
Writing a Laboratory Report, continued
Cop
yrig
ht ©
Gle
ncoe
/McG
raw
-Hill
, a d
ivis
ion
of t
he M
cGra
w-H
ill C
ompa
nies
, Inc
.
Exploring Environmental Problems Earth Science: Geology, the Environment, and the Universe vii
EXPLORING ENVIRONMENTAL PROBLEMS
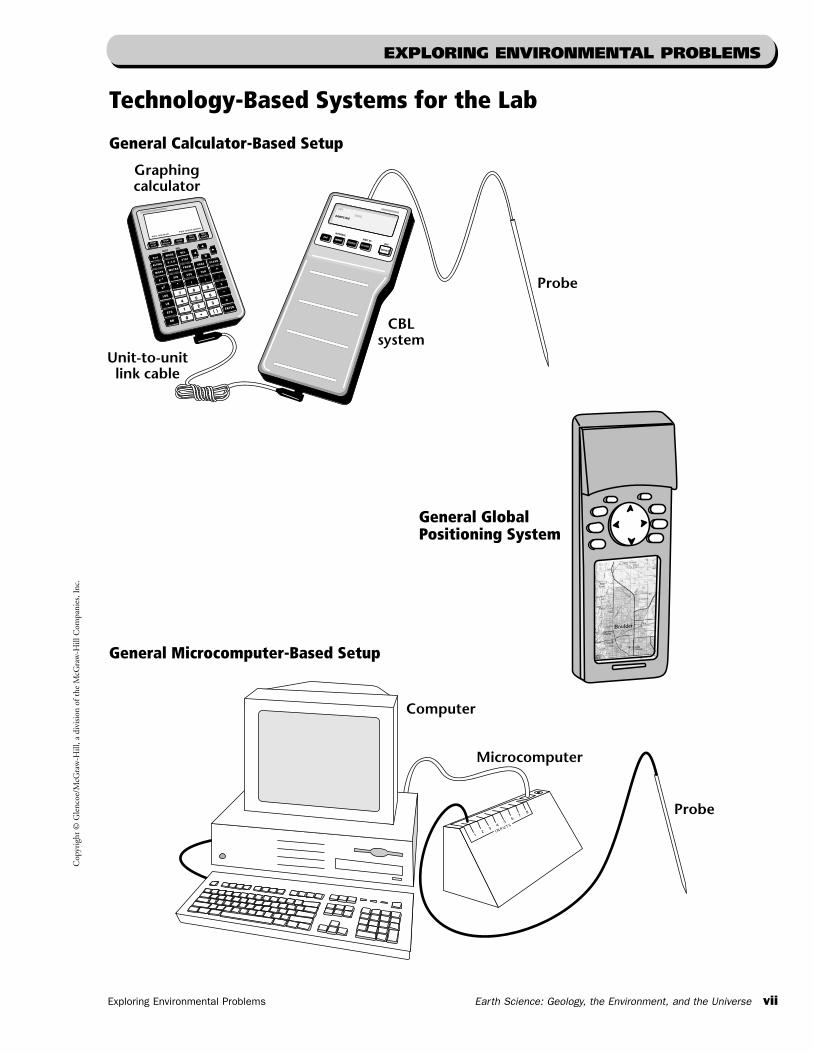
Technology-Based Systems for the Lab
General Calculator-Based Setup
1 2 3 4 5 6 7 8
I N P U T S
General Global Positioning System
General Microcomputer-Based Setup

Cop
yrig
ht ©
Gle
ncoe
/McG
raw
-Hill
, a d
ivis
ion
of t
he M
cGra
w-H
ill C
ompa
nies
, Inc
.
viii Earth Science: Geology, the Environment, and the Universe Exploring Environmental Problems
EXPLORING ENVIRONMENTAL PROBLEMS
Laboratory Equipment

Cop
yrig
ht ©
Gle
ncoe
/McG
raw
-Hill
, a d
ivis
ion
of t
he M
cGra
w-H
ill C
ompa
nies
, Inc
.
Exploring Environmental Problems Earth Science: Geology, the Environment, and the Universe ix
EXPLORING ENVIRONMENTAL PROBLEMS
Laboratory Equipment, continued

Cop
yrig
ht ©
Gle
ncoe
/McG
raw
-Hill
, a d
ivis
ion
of t
he M
cGra
w-H
ill C
ompa
nies
, Inc
.
x Earth Science: Geology, the Environment, and the Universe Exploring Environmental Problems
EXPLORING ENVIRONMENTAL PROBLEMS
Laboratory Equipment, continued

Cop
yrig
ht ©
Gle
ncoe
/McG
raw
-Hill
, a d
ivis
ion
of t
he M
cGra
w-H
ill C
ompa
nies
, Inc
.
Exploring Environmental Problems Earth Science: Geology, the Environment, and the Universe xi
EXPLORING ENVIRONMENTAL PROBLEMS
Safety in the Laboratory
1. Always obtain your teacher’s permission tobegin a lab.
2. Study the procedure. If you have questions, askyour teacher. Be sure you understand all safetysymbols shown.
3. Use the safety equipment provided for you.Goggles and a laboratory apron should be worn when any lab calls for using chemicals.
4. When you are heating a test tube, always slant it so the mouth points away from you and others.
5. Never eat or drink in the lab. Never inhalechemicals. Do not taste any substance or draw any material into your mouth.
6. If you spill any chemical, immediately wash itoff with water. Report the spill immediately toyour teacher.
7. Know the location and proper use of the fireextinguisher, safety shower, fire blanket, first aid kit, and fire alarm.
8. Keep all materials away from open flames.Tie back long hair and loose clothing.
9. If a fire should break out in the lab, or if yourclothing should catch fire, smother it with the fire blanket or a coat, or get under a safety shower. NEVER RUN.
10. Report any accident or injury, no matter howsmall, to your teacher.
Follow these procedures as you clean up your work area.
1. Turn off the water and gas. Disconnectelectrical devices.
2. Return materials to their places.
3. Dispose of chemicals and other materials asdirected by your teacher. Place broken glass and solid substances in the proper containers.Never discard materials in the sink.
4. Clean your work area.
5. Wash your hands thoroughly after workingin the laboratory.
Injury Safe response
Burns Apply cold water. Call your teacher immediately.
Cuts and bruises Stop any bleeding by applying direct pressure. Cover cuts with a clean dressing.Apply cold compresses to bruises. Call your teacher immediately.
Fainting Leave the person Iying down. Loosen any tight clothing and keep crowds away.Call your teacher immediately.
Foreign matter in eye Flush with plenty of water. Use an eyewash bottle or fountain.
Poisoning Note the suspected poisoning agent and call your teacher immediately.
Any spills on skin Flush with large amounts of water or use safety shower. Call your teacher immediately.
Safety ContractI, ____________________________________________ , have read and understand the safety rules
and first aid information listed above. I recognize my responsibility and pledge to observe all safety rules in the science classroom at all times.
__________________________________________________________ ___________________signature date
First Aid in the Laboratory

Cop
yrig
ht ©
Gle
ncoe
/McG
raw
-Hill
, a d
ivis
ion
of t
he M
cGra
w-H
ill C
ompa
nies
, Inc
.
xii Earth Science: Geology, the Environment, and the Universe Exploring Environmental Problems
EXPLORING ENVIRONMENTAL PROBLEMS
Eye SafetyProper eye protectionshould be worn at alltimes by anyone per-forming or observingscience activities.
ClothingProtectionThis symbol appearswhen substancescould stain or burnclothing.
Animal SafetyThis symbol appearswhen safety of ani-mals and studentsmust be ensured.
RadioactivityThis symbol appearswhen radioactivematerials are used.
Avoid skin contact withthese materials. Wearmask or gloves.
Notify your teacher ifyou suspect contactwith material. Washhands thoroughly.
Organisms or otherbiological materialsthat might be harmfulto humans
bacteria, fungi, blood,unpreserved tissues,plant materials
BIOLOGICAL
Use proper protectionwhen handling.
Go to your teacher forfirst aid.
Objects that can burnskin by being too coldor too hot
boiling liquids, hotplates, dry ice, liquidnitrogen
EXTREMETEMPERATURE
Do not dispose ofthese materials in thesink or trash can.
Dispose of wastes asdirected by yourteacher.
Special disposal proce-dures need to be followed.
certain chemicals,living organismsDISPOSAL
SAFETY SYMBOLS
Practice common-sensebehavior and followguidelines for use ofthe tool.
Go to your teacher forfirst aid.
Use of tools or glass-ware that can easilypuncture or slice skin
razor blades, pins,scalpels, pointed tools,dissecting probes, bro-ken glass
SHARPOBJECT
Make sure there isgood ventilation. Neversmell fumes directly.Wear a mask.
Leave foul area andnotify your teacherimmediately.
Possible danger to res-piratory tract fromfumes
ammonia, acetone,nail polish remover,heated sulfur, mothballs
FUME
Double-check setupwith teacher. Checkcondition of wires andapparatus.
Do not attempt to fixelectrical problems.Notify your teacherimmediately.
Possible danger fromelectrical shock or burn
improper grounding,liquid spills, shortcircuits, exposed wires
ELECTRICAL
Wear dust mask andgloves. Practice extracare when handlingthese materials.
Go to your teacher forfirst aid.
Substances that canirritate the skin ormucus membranes ofthe respiratory tract
pollen, moth balls,steel wool, fiber glass,potassium permanganate
IRRITANT
Wear goggles, gloves,and an apron.
Immediately flush theaffected area withwater and notify yourteacher.
Chemicals that canreact with and destroytissue and other materials
bleaches such ashydrogen peroxide;acids such as sulfuricacid, hydrochloric acid;bases such as ammo-nia, sodium hydroxide
CHEMICAL
Follow your teacher’sinstructions.
Always wash handsthoroughly after use.Go to your teacher forfirst aid.
Substance may be poi-sonous if touched,inhaled, or swallowed
mercury, many metalcompounds, iodine,poinsettia plant parts
TOXIC
Tie back hair. Avoidwearing loose clothing.Avoid open flames whenusing flammable chemi-cals. Be aware of loca-tions of fire safetyequipment.
Notify your teacherimmediately. Use firesafety equipment ifapplicable.
Open flame may igniteflammable chemicals,loose clothing, or hair
alcohol, kerosene,potassium perman-ganate, hair, clothing
OPENFLAME
PRECAUTION REMEDYHAZARD EXAMPLES
The Earth Science: Geology, the Environment, and the Universe program uses safety symbols to alert you and yourstudents to possible laboratory dangers. These symbols are provided in the student text in Appendix B and are explainedbelow. Be sure your students understand each symbol before they begin an activity that displays a symbol.

Cop
yrig
ht ©
Gle
ncoe
/McG
raw
-Hill
, a d
ivis
ion
of t
he M
cGra
w-H
ill C
ompa
nies
, Inc
.
Exploring Environmental Problems Earth Science: Geology, the Environment, and the Universe xiii
EXPLORING ENVIRONMENTAL PROBLEMS
Making a DifferenceEnvironmental science incorporates principles of Earth science, the physical sciences, biology,economics, and even political science. Nonetheless,you—as a beginning environmental sciencestudent—can make significant contributions tosolving environmental problems in your localcommunity. For example, students participating in the GLOBE program are monitoring theenvironment in their communities and posting theirdiscoveries on the Internet. GLOBE is a worldwidenetwork of teachers, students, and scientists workingtogether to learn about the environment. Go to theGlencoe Science Web Site at tofind out more about GLOBE.
Exploring Environmental ProblemsThe labs in Exploring Environmental Problems showyou how to use some of the latest technology tomonitor aquatic and terrestrial ecosystems. You willexamine principles involved in global problems suchas acid precipitation, global warming, deforestation,and the cost of energy. To study your local environ-ment, you will first have to review the use ofCalculator-Based Labs (CBLs) and GlobalPositioning System (GPS).
The Scientific MethodScientists make observations, formulate hypotheses,and then test the hypotheses in controlledexperiments. This procedure is called the scientificmethod and you will use this method in your studyof environmental issues. Although all scientificinvestigations do not follow the same methods,all scientists conduct experiments and drawconclusions based on facts, not opinions. Thetechniques and tools you learn to use in these labs will prepare you to design and conductenvironmental experiments.
Calculator-Based LabsIn Exploring Environmental Problems, you will be using two technologies to collect data andinformation. In the first part of this manual, you will use an instrument called a Calculator-Based Lab(CBL) unit. A CBL unit is an electronic device thatuses voltage changes to record data. For example,when you use a temperature probe, a change intemperature causes a slight difference in the voltagepassing through the probe. The CBL unit has aninternal program that converts the change in voltageto a temperature reading. Similarly, a pH probe canbe calibrated to use a voltage change to give the pHreading of a solution. The CBL device can beconnected to a graphing calculator or a micro-computer, which has programs to store and graphthe data that you can then analyze. When using agraphing calculator or a microcomputer with theCBL unit, you will need a set of programs calledChemBio. ChemBio should be saved in Applicationsor Programs.
The CBL device has an automatic power-downsystem. Your CBL unit or the calculator attached toit may shut down after 10 minutes to conserve thebattery. If this happens, turn the device back onwhen you are ready to use it. If the CBL is attachedto a calculator when the power turns off, the datawill be saved in memory. If you are not connected toa calculator and the unit powers down, you will losethe data. When attaching a probe to the CBL unit,you should always put the probe in the lowestnumbered channel. There are three channels thatallow you to use three probes at the same time.
Global Positioning SystemThe instrument you will use for the last five labs is aGlobal Positioning System (GPS) unit, which is usedto locate your position on Earth. The United StatesDepartment of Defense constructed the system for$12 billion. Its official name is the NAVSTAR Global
science.glencoe.com
Using Technology to Study Environmental Science
The scientific study of the environment is relatively new. During the 1960s, scientists becameincreasingly concerned about the impact of the human population on the health of theenvironment. Many scientists agreed that Earth was becoming polluted and that naturalresources were being consumed too quickly. They began to analyze the relationship betweenhumans and the environment. Such study is called environmental science.
Cop
yrig
ht ©
Gle
ncoe
/McG
raw
-Hill
, a d
ivis
ion
of t
he M
cGra
w-H
ill C
ompa
nies
, Inc
.
xiv Earth Science: Geology, the Environment, and the Universe Exploring Environmental Problems
EXPLORING ENVIRONMENTAL PROBLEMS
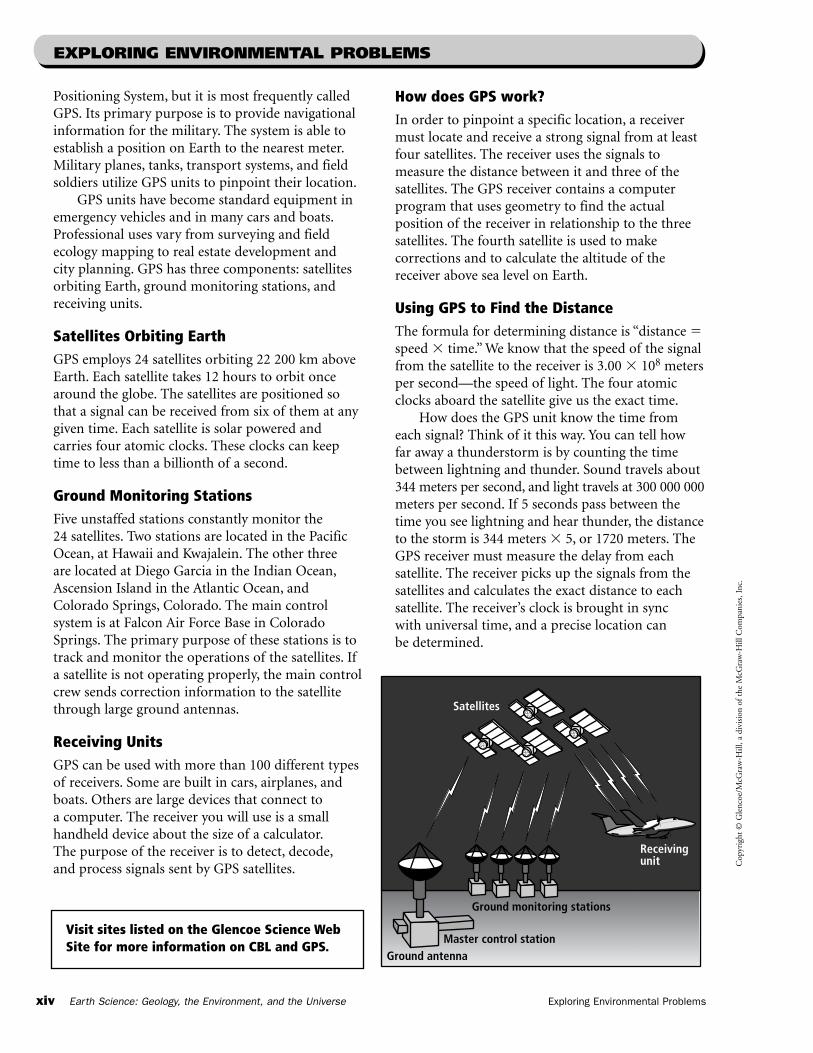
Positioning System, but it is most frequently calledGPS. Its primary purpose is to provide navigationalinformation for the military. The system is able toestablish a position on Earth to the nearest meter.Military planes, tanks, transport systems, and fieldsoldiers utilize GPS units to pinpoint their location.
GPS units have become standard equipment inemergency vehicles and in many cars and boats.Professional uses vary from surveying and fieldecology mapping to real estate development and city planning. GPS has three components: satellitesorbiting Earth, ground monitoring stations, andreceiving units.
Satellites Orbiting EarthGPS employs 24 satellites orbiting 22 200 km aboveEarth. Each satellite takes 12 hours to orbit oncearound the globe. The satellites are positioned sothat a signal can be received from six of them at anygiven time. Each satellite is solar powered andcarries four atomic clocks. These clocks can keeptime to less than a billionth of a second.
Ground Monitoring StationsFive unstaffed stations constantly monitor the 24 satellites. Two stations are located in the PacificOcean, at Hawaii and Kwajalein. The other three are located at Diego Garcia in the Indian Ocean,Ascension Island in the Atlantic Ocean, andColorado Springs, Colorado. The main controlsystem is at Falcon Air Force Base in ColoradoSprings. The primary purpose of these stations is totrack and monitor the operations of the satellites. Ifa satellite is not operating properly, the main controlcrew sends correction information to the satellitethrough large ground antennas.
Receiving UnitsGPS can be used with more than 100 different typesof receivers. Some are built in cars, airplanes, andboats. Others are large devices that connect to a computer. The receiver you will use is a smallhandheld device about the size of a calculator.The purpose of the receiver is to detect, decode,and process signals sent by GPS satellites.
How does GPS work?In order to pinpoint a specific location, a receivermust locate and receive a strong signal from at leastfour satellites. The receiver uses the signals tomeasure the distance between it and three of thesatellites. The GPS receiver contains a computerprogram that uses geometry to find the actualposition of the receiver in relationship to the threesatellites. The fourth satellite is used to makecorrections and to calculate the altitude of thereceiver above sea level on Earth.
Using GPS to Find the Distance The formula for determining distance is “distance �speed � time.” We know that the speed of the signalfrom the satellite to the receiver is 3.00 � 108 metersper second—the speed of light. The four atomicclocks aboard the satellite give us the exact time.
How does the GPS unit know the time fromeach signal? Think of it this way. You can tell howfar away a thunderstorm is by counting the timebetween lightning and thunder. Sound travels about344 meters per second, and light travels at 300 000 000meters per second. If 5 seconds pass between thetime you see lightning and hear thunder, the distanceto the storm is 344 meters � 5, or 1720 meters. TheGPS receiver must measure the delay from eachsatellite. The receiver picks up the signals from thesatellites and calculates the exact distance to eachsatellite. The receiver’s clock is brought in sync with universal time, and a precise location can be determined.
Satellites
Receivingunit
Ground monitoring stations
Master control stationGround antenna
Visit sites listed on the Glencoe Science WebSite for more information on CBL and GPS.

Cop
yrig
ht ©
Gle
ncoe
/McG
raw
-Hill
, a d
ivis
ion
of t
he M
cGra
w-H
ill C
ompa
nies
, Inc
.
Exploring Environmental Problems Lab 1 Earth Science: Geology, the Environment, and the Universe 1
Name Class Date
P R O B L E M
O B J E C T I V E S
How can certain physical and chemical properties of a body of water affect its ability tosupport life?
LAB CALCULATOR-BASED LAB1Use with Chapter 9
Section 9.1
DESIGN YOUR OWN
How can certain factors affectthe health of an ecosystem?
All bodies of water are affected by the land, air, and human activity around them.Environmental scientists monitor several factors to gauge the health of aquatic
ecosystems. Four common measurements are electrical conductivity, transparency, pH, andtemperature. Conductivity is the ability of water to conduct electricity. High conductivitymeans a higher concentration of ions, which could come from dissolved salts and metals.Transparency is the distance light can travel through water. Erosion of soil or wastes can limitwater transparency, blocking the sunlight that aquatic organisms at the base of food chainsneed for photosynthesis. The pH of water also influences where aquatic organisms can live.Most organisms can live within a specific pH range. Water that becomes too acidic or too basiccan be deadly. Temperature is also important. As water temperature rises, there is lessdissolved oxygen for living organisms.
• Hypothesize how physical and chem-ical properties of a body of wateraffect aquatic life.
• Measure and record the physical andchemical properties in a water samplefrom a specific body of water.
• Observe the area around the body ofwater to find possible sources ofchemical input.
• Draw conclusions about whether thebody of water is chemically or physi-cally influenced by nearby sources.
• Infer how drainage could affectaquatic life in the body of water.
H Y P O T H E S I S
Hypothesize how certain physical and chemical properties of a body of water wouldaffect aquatic life.

Cop
yrig
ht ©
Gle
ncoe
/McG
raw
-Hill
, a d
ivis
ion
of t
he M
cGra
w-H
ill C
ompa
nies
, Inc
.
Name Class Date
2 Lab 1 Earth Science: Geology, the Environment, and the Universe Exploring Environmental Problems
LAB CALCULATOR-BASED LAB1
P R E P A R A T I O N
MATERIALS
CBL unitTI graphing calculatorlink cablebucket tied to a ropealcohol-based thermometer
or CBL temperature sensorSecchi discmeterstick pH probestandard solution (pH 4)standard solution (pH 7)50-mL graduated cylinder250-mL beakers in which samples can
be placed for testing (2)
conductivity probe1000�S standard solutionwash bottle of distilled water
SAFETY PRECAUTIONS
• Watch out for poisonous plants, and avoid contact with ticks and mosquitoes. Wear clothesthat cover your legs and arms. Do not wearopen-toed shoes.
• Wipe up any spills in the classroom immediatelyto prevent slipping or falling.
• Acid may irritate your skin. Always use cautionand wear gloves when handling acid.
P R O C E D U R E
1. Select a body of water near your school thatyou can sample several times during the year.Use a bucket tied to a rope to take a watersample. Do not clean the bucket with soap.Rinse it out three times with the water fromyour site. Do not stir up your sample area byreturning the rinse water to the same place. Donot put your hands in the sample water. Usethe bucket to obtain a surface sample as farfrom shore as you can manage.
2. Record the temperature of the air near yoursite by holding the thermometer in the shade.Wait several minutes for the temperature tostabilize. Repeat all of your readings until youand your team agree on the temperature towithin 0.5°C. Record the temperature of thewater using the same procedure.
3. For a transparency determination, lower aSecchi disc into the water until it is no longervisible. Record the depth where it disappearedin cm. Raise the disc until you can just see itagain. Record this depth also. These tworeadings should agree to within 10 cm. Repeatthese measurements until your group agrees towithin 10 cm. Average the two depths for your final reading.
4. Take the water sample back to the lab tomeasure pH and conductivity.
5. Soak the tip of the conductivity probe indistilled water while you use the pH probe.
6. To measure pH, connect the CBL unit to thegraphing calculator and connect the pH probeto channel 1.a. Turn on the calculator and CBL. Select
CHEMBIO.b. Set up probes.c. Enter 1 for number of probes. Press
ENTER.d. Select pH and ENTER. Enter 1 for the
channel. Press ENTER.7. You are now ready to calibrate the CBL and
measure pH.a. Select PERFORM NEW and ENTER.b. Remove the pH probe from the storage
bottle. Rinse the probe with distilled water.c. Place the probe in the standard solution
(pH 4). When the voltage reading on theCBL stops changing, press TRIGGER onthe CBL. Press 4 in the calculator and pressENTER.
d. Rinse the pH probe again with distilledwater. Place the probe in the standardsolution (pH 7). When the voltage readingon the CBL stops changing, pressTRIGGER. Press 7 on the calculatorand press ENTER.
DESIGN YOUR OWN

Cop
yrig
ht ©
Gle
ncoe
/McG
raw
-Hill
, a d
ivis
ion
of t
he M
cGra
w-H
ill C
ompa
nies
, Inc
.
Name Class Date
Exploring Environmental Problems Lab 1 Earth Science: Geology, the Environment, and the Universe 3
P R O C E D U R E , continued
D A T A A N D O B S E R V A T I O N S
e. The screen will display the slope andintercept of the calibration line. PressENTER and select COLLECT DATA.
f. Press ENTER again. Select MONITORINPUT on the Data Collection menu. Letthe device warm up for 30 seconds. Thenpress ENTER again. The pH probe is nowready to measure the pH of your watersample.
g. Pour 100 mL of water from the bucket intoa beaker.
h. Rinse the probe with distilled water andplace it in your water sample. When thereading stabilizes, record the pH. Rinse theprobe with distilled water, then repeat thereading. Record the pH again. Calculate andrecord the average.
i. When you finish taking measurements,press + to return to the MAIN MENU.Remove the pH probe, rinse the tip, thenreturn it to the storage bottle.
8. Now measure the conductivity of your sample.a. After soaking the conductivity probe for at
least 10 minutes, attach it to the CBL inchannel 1. For freshwater or brackish water(mixture of salt and fresh, as in an estuaryor the lower part of a river that meets anocean), set the switch on the black box ofthe probe to 0–2000�S. For seawater, set theswitch to 0–20,000�S.
b. Press ENTER on the MAIN MENU. Thecalculator will show the message. BE SURETO SET SWITCH ON PROBE. CBLSHOWS ONLY 3 SIG. FIGURES.
This is just a reminder to read the datafrom the calculator.
c. In the CALCULATOR MENU, choosechannel 1 and PERFORM NEW.
d. When the screen starting with USE [CHVIEW] BUTTON ON CBL TO MONITORVOLTAGE. WHEN STABLE PRESS CBLTRIGGER appears, remove the probe fromthe distilled water. Shake off excess water.When the voltage reading on the CBL isstable, press TRIGGER. Because there areno ions present, press 0 in the calculatorand press ENTER.
e. Place the probe in the 1000�S standardsolution. When the voltage reading on theCBL is stable, press TRIGGER on the CBL.Press a reference value of 1000 in thecalculator. Press ENTER.
f. The calculator should show the interceptand slope values for the calibration line.Press ENTER. You should now be back atthe MAIN MENU display on the calculator.
g. Rinse the probe with distilled water. SelectCOLLECT DATA and MONITOR INPUT.
h. Pour 100 mL of water from the bucket intoa beaker.
i. Place the probe in your water sample. Readthe conductivity of your sample. Rinse theprobe in distilled water and repeat thereading. Record it. Then calculate theaverage and record it.
LAB CALCULATOR-BASED-LAB1DESIGN YOUR OWN
Air temperature Water temperature Transparency pH Conductivity
1. 1. 1. 1. 1.
2. 2. 2. 2. 2.
Average
Readings within Readings within Readings within Readings within Readings within0.5°C 0.5°C 1 cm 0.2 pH units 40�S

Cop
yrig
ht ©
Gle
ncoe
/McG
raw
-Hill
, a d
ivis
ion
of t
he M
cGra
w-H
ill C
ompa
nies
, Inc
.
Name Class Date
4 Lab 1 Earth Science: Geology, the Environment, and the Universe Exploring Environmental Problems
LAB CALCULATOR-BASED LAB1
A N A LY Z E A N D C O N C L U D E
1. Normally, air temperature can be colder than water temperature in the winter. Air temperature can bewarmer than water temperature in the summer. How do the air and surface water temperatures compare?Do your readings follow this pattern? If they are very different, what might be the cause?
2. Many aquatic systems have a transparency of a few meters. Very fertile waters can be less transparentbecause of dense plankton. Waters full of sediment can also have low transparency. Nutrient-poor waterssuch as open ocean can be highly transparent—to a depth of 30 meters. Is the transparency of the wateryou tested low or high? Explain what might be the cause.
3. Rainwater is naturally acidic, with a pH of 5.0–6.5. Most organisms prefer a pH of 6.5–8.2. What is the pH of your water sample? Is it within the range that most organisms prefer?
A P P LY A N D A S S E S S
C H E C K Y O U R H Y P O T H E S I S
1. Based on temperature, transparency, pH, and conductivity, rate the suitability of this body of water for aquatic life.
DESIGN YOUR OWN
D A T A A N D O B S E R V A T I O N S , continued
1. Describe the site. What type of water body is it? What organisms did you observe?
2. List sources around the body of water from which substances might enter such as lawns, agriculture,and storm sewers.
Did your data support your hypothesis? Why or why not?

Cop
yrig
ht ©
Gle
ncoe
/McG
raw
-Hill
, a d
ivis
ion
of t
he M
cGra
w-H
ill C
ompa
nies
, Inc
.
Exploring Environmental Problems Lab 2 Earth Science: Geology, the Environment, and the Universe 5
Name Class Date
H Y P O T H E S I S
P O S S I B L E M A T E R I A L S
Hypothesize how a certain factor could affect water quality.
P R O B L E M
O B J E C T I V E S
How can you test a hypothesis about the condition of a nearby body of water?
LAB CALCULATOR-BASED LAB2Use with Chapter 1
Section 1.2
DESIGN YOUR OWN
How can you test a hypothesisabout the condition of a body of water?Environmental scientists often plan tests to reveal the water quality of a lake,
a stream, a river, or an estuary. Choose a nearby body of water. Decide on aquestion you would like to answer about its water quality. State a hypothesis, thencarefully plan a procedure to collect the data that will test that hypothesis, usingobservation and some of the sampling techniques you learned in Lab 1.
• Hypothesize how a certain factoraffects water quality.
• Plan an experiment to test yourhypothesis.
• Measure the physical or chemicalproperties you are testing.
• Make a data table in which to recordmeasurements.
• Draw conclusions about the qualityof the water based on your data.
CBL unit TI graphing calculatorlink cablewash bottle of distilled waterbucket tied to a ropealcohol-based thermometerSecchi discmeterstick
pH probestandard solution (pH 4)standard solution (pH 7)conductivity probe1000�S standard solutiongraduated 50-mL cylinder250-mL beakers (4–5)

Cop
yrig
ht ©
Gle
ncoe
/McG
raw
-Hill
, a d
ivis
ion
of t
he M
cGra
w-H
ill C
ompa
nies
, Inc
.
Name Class Date
6 Lab 2 Earth Science: Geology, the Environment, and the Universe Exploring Environmental Problems
LAB CALCULATOR-BASED LAB2
P O S S I B L E M A T E R I A L S , continued
P L A N T H E E X P E R I M E N T
D A T A A N D O B S E R V A T I O N S
Make a data table to record your observations and measurements.
DESIGN YOUR OWN
SAFETY PRECAUTIONS
• Wipe up any spilled liquid.
• Avoid poisonous plants and insects.
• Wear protective clothing and sturdy shoes.
• Handle acid with care.
• Mercury is toxic and hazardous. Do not handlethe mercury if a mercury-filled thermometerbreaks. Notify your teacher immediately.
• Working with a partner, decide what you wouldlike to know about the body of water, based onthe data you collected in Lab 1. For example, areyou interested in determining the sources of anypollution? Would you like to know if pollution inthe water differs with location or depth? Perhapsyou would like to find out if some areas of thewater are better suited for aquatic life than others.
• Some methods to consider include taking meas-urements of the same factor at different times ofday or in different weather conditions. The water
could also be sampled at different depths or atseveral different sites on its surface. CAUTION:Be careful of fast-moving current when workingnear a body of water. Take precautions againstslipping or falling.
• Consider using a map or diagram of the body of water on which to plot your data.
• Make a list of the steps you will follow to testyour hypothesis. As you plan the experiment,remember to test just one variable at a time.

Cop
yrig
ht ©
Gle
ncoe
/McG
raw
-Hill
, a d
ivis
ion
of t
he M
cGra
w-H
ill C
ompa
nies
, Inc
.
Name Class Date
Exploring Environmental Problems Lab 2 Earth Science: Geology, the Environment, and the Universe 7
C H E C K Y O U R H Y P O T H E S I S
Do your data support your hypothesis? Why or why not?
A N A LY Z E A N D C O N C L U D E
1. What question about the water quality of the body of the water was your experiment set up to test?
2. What procedure did you use to test your hypothesis?
3. Did your procedure produce useful data? Explain.
LAB CALCULATOR-BASED LAB2DESIGN YOUR OWN

Cop
yrig
ht ©
Gle
ncoe
/McG
raw
-Hill
, a d
ivis
ion
of t
he M
cGra
w-H
ill C
ompa
nies
, Inc
.
Name Class Date
8 Lab 2 Earth Science: Geology, the Environment, and the Universe Exploring Environmental Problems
LAB CALCULATOR-BASED LAB2DESIGN YOUR OWN
A P P LY A N D A S S E S S
F U R T H E R I N V E S T I G A T I O N
1. What conclusions can you draw about the water quality based on your data?
2. How might you redesign the experiment to yield better results?
• What new questions were generated as a result of your investigation? How might youdesign an additional investigation to answer those questions?
• Do research to find out what general standards drinking water must meet. Find outwhere your drinking water comes from and whether the body of water that supplies itmeets these standards. If there have been problems with the body of water, find outwhat they are. Contact your local water utility to ask how they are dealing with anyproblems. Share your findings with the class.

Cop
yrig
ht ©
Gle
ncoe
/McG
raw
-Hill
, a d
ivis
ion
of t
he M
cGra
w-H
ill C
ompa
nies
, Inc
.
Exploring Environmental Problems Lab 3 Earth Science: Geology, the Environment, and the Universe 9
Name Class Date
O B J E C T I V E S
• Hypothesize how water vapor andcarbon dioxide (CO2) affect air temperature.
• Measure and graph the effect ontemperature when water vapor andcarbon dioxide are added to air.
• Draw conclusions about how thepresence of carbon dioxide and water affects the temperature of theair.
• Infer how the data gathered in thisexperiment might help explain globalwarming.
P R O B L E M
What effect does the presence of carbon dioxide and water vapor in the air have ontemperature of the atmosphere?
How does the presence of watervapor and carbon dioxide affect thetemperature of Earth’s atmosphere?
If the gases in the atmosphere did not absorb energy, Earth would be too cold to support lifeas we know it. Earth’s atmosphere acts like a huge greenhouse that traps heat. The atmosphere
allows short wavelength energy such as visible light and ultraviolet light to enter. Earth’s surfaceabsorbs this energy and reemits it as longer-wavelength infrared energy. Like the glass of agreenhouse, Earth’s atmosphere prevents much of this infrared energy from escaping, and thus the energy heats the atmosphere.
The atmosphere contains nitrogen, oxygen, water vapor, carbon dioxide, and trace amountsof numerous other gases. Some of these gases help maintain Earth’s surface temperatures. Theyare known as greenhouse gases. Water vapor is the major heat-trapping gas. However, theoverall concentration of water vapor in the atmosphere does not seem to be significantly affectedby human activities. In contrast, levels of the greenhouse gas carbon dioxide have beenincreasing over time. How could this affect Earth’s temperature?
For this lab, you will produce the carbon dioxide by the following reaction:
NaHCO3(s) � HC2H3O2(aq) → NaC2H3O2(aq) � CO2(g) � H2O(l)
LAB CALCULATOR-BASED LAB3Use with Chapter 11
Section 11.1
H Y P O T H E S I S
Hypothesize which sample will showthe greatest rise in temperature whenexposed to solar energy: air alone, airthat contains added water vapor, or airthat contains added carbon dioxide andwater vapor.

Cop
yrig
ht ©
Gle
ncoe
/McG
raw
-Hill
, a d
ivis
ion
of t
he M
cGra
w-H
ill C
ompa
nies
, Inc
.
Name Class Date
10 Lab 3 Earth Science: Geology, the Environment, and the Universe Exploring Environmental Problems
P R E P A R A T I O N
MATERIALS
black marker3 pint-size plastic resealable
storage bagswater25-mL graduated cylinderbaking sodavinegarbalanceCBL unitTI graphing calculatorlink cable
3 temperature probesflood lamp (if conducting inside)tapehand pump
SAFETY PRECAUTIONS
• Wipe up any spilled liquid.
• Vinegar is an acid and may irritate skin.
P R O C E D U R E
PRODUCE THE GASES
1. Use the marker to label one plastic bag“control.” Use the hand pump to fill it with air.Close the bag.
2. Label the second bag “water vapor.” Pour 20 mL of water into the bag. Then use thepump to fill it with air to the same volume as the control.
3. Label the third bag “carbon dioxide and watervapor.” Place 10 grams of baking soda in abottom corner of the bag. Roll the bag so thebaking soda will not mix immediately with thevinegar you are about to add. Pour in 20 mL of vinegar and quickly close the bag. If thevolume is less than the control, add air withthe pump until the volumes are the same.
SET UP THE CBL
4. Connect three temperature probes to one CBL.Link the CBL to the calculator.
5. Select CHEMBIO and a temperature problemin each of the three channels.
6. From COLLECT DATA, select TIME GRAPH.Select TIME BETWEEN SAMPLES =6 SECONDS; select 80 SAMPLES.
7. A window will appear in which you can checkthe setting. Press ENTER if the numbers arecorrect.
8. Ymin should be 15. Ymax should be 80. Sclshould be 1. Do not press ENTER until youhave your experiment set up and ready to go.
SET UP THE EXPERIMENT
9. Place the temperature probes on a flat surfacein the bright sun or under a flood lamp.CAUTION: The surface of the flood lamp may be hot.
10. Place the bag labeled “control” over thetemperature probe in channel 1 so that theblack probe tip touches the bag. Tape theprobe to the bag.
11. Place the bag labeled “water vapor” over theprobe in channel 2, making sure that the probeis not touching the liquid. Tape the probe tothe bag.
12. Place the bag labeled “carbon dioxide andwater vapor” over the probe in channel 3,making sure the temperature probe is nottouching the liquid. Tape the probe to the bag.
13. Check the set-up. Make sure all bags receivethe same amount of light and the probes aretouching the surfaces of the bags.
14. Press ENTER on the CBL to begin collecting data.
15. When the CBL says DONE, the graph willappear on the calculator screen. Sketch thegraph in the data table.
LAB CALCULATOR-BASED LAB3

Cop
yrig
ht ©
Gle
ncoe
/McG
raw
-Hill
, a d
ivis
ion
of t
he M
cGra
w-H
ill C
ompa
nies
, Inc
.
Name Class Date
Exploring Environmental Problems Lab 3 Earth Science: Geology, the Environment, and the Universe 11
A N A LY Z E A N D C O N C L U D E
1. Describe the contents of each bag.
2. Describe the graphs, including patterns you observe. If the curves are not smooth, what could account for slight dips? (Hint: Was it a cloudy day?)
3. Was there a difference in the change in temperature inside the three bags?
4. Contrast the temperature change for air alone; air and additional water vapor; and air and additionalwater vapor and carbon dioxide.
D A T A A N D O B S E R V A T I O N S
LAB CALCULATOR-BASED LAB3
Air Air and water vapor Air, water vapor, and CO2
Gases Initial Temperature Final Temperature Change in Temperature
Air
Air and water vapor
Air, water vapor, and CO2
Graphs
Table

Cop
yrig
ht ©
Gle
ncoe
/McG
raw
-Hill
, a d
ivis
ion
of t
he M
cGra
w-H
ill C
ompa
nies
, Inc
.
Name Class Date
12 Lab 3 Earth Science: Geology, the Environment, and the Universe Exploring Environmental Problems
A P P LY A N D A S S E S S
1. Based on the data you gathered during this experiment, does the addition of water vapor or carbon dioxide to air affect its ability to retain heat? Explain your answer.
2. Which substance has the greatest effect on the ability of air to retain heat? Explain your answer.
3. The amount of carbon dioxide entering Earth’s atmosphere has been increasing since the late nineteenthcentury, largely as the result of the burning of fossil fuels by industry, in vehicles, and to produce electricpower. Based on the results of this experiment, do you think there could be a relationship between theincrease in carbon dioxide in the air and global warming? Explain your answer.
C H E C K Y O U R H Y P O T H E S I S
Did your data support your hypothesis? Why or why not?
F U R T H E R I N V E S T I G A T I O N
• Design and conduct an experiment to determine if carbon dioxide or water vapor affects temperaturemore. How could you get a bag of carbon dioxide without water vapor?
• Do research to identify the major greenhouse gases that help the atmosphere hold in heat. Find majorsources of the gases and write a report on what people can do to decrease the amount of these gasesthat are added to the atmosphere.
LAB CALCULATOR-BASED LAB3

Cop
yrig
ht ©
Gle
ncoe
/McG
raw
-Hill
, a d
ivis
ion
of t
he M
cGra
w-H
ill C
ompa
nies
, Inc
.
Exploring Environmental Problems Lab 4 Earth Science: Geology, the Environment, and the Universe 13
Name Class Date
P R E P A R A T I O N
MATERIALS
200-mL graduated cylinder10-mL graduated cylinderred food coloring125-mL flaskone-hole stopper to fit the flaskPasteur pipettetapesmall millimeter rulerlarge beakerhot platering stand and clamp
temperature probeCBL unitTI graphing calculator with ChemBio pipette bulb
SAFETY PRECAUTIONS
• Wipe up any spills immediately toprevent slips or falls.
• Use caution when handling hot sur-faces or liquids. Liquids may sprayout if overheated in a flask.
P R O B L E M
O B J E C T I V E S
H Y P O T H E S I S
What effect would an increase in temperature have on water volume?
How might global warming affect sea level?Studies indicate that an increase in greenhouse gases can cause an increase in
atmospheric temperature. The temperature increase could be about 2–3°C over 100 years. That may not seem like a big problem. But could this small increaseaffect the level of the world’s oceans?
LAB CALCULATOR-BASED LAB4Use with Chapter 8, Section 8.3 and
Chapter 14, Section 14.4
• Hypothesize how temperatureincrease might affect a volume ofwater.
• Measure any change in the volume ofa water sample as temperatureincreases.
• Make a table to display the results ofyour experiment.
• Draw conclusions about how tem-perature affects water volume.
• Infer how an increase in atmospherictemperature could affect sea level onEarth.
Hypothesize how a rise in temperature would affect the volume of a water sample.
program

Cop
yrig
ht ©
Gle
ncoe
/McG
raw
-Hill
, a d
ivis
ion
of t
he M
cGra
w-H
ill C
ompa
nies
, Inc
.
Name Class Date
14 Lab 4 Earth Science: Geology, the Environment, and the Universe Exploring Environmental Problems
P R O C E D U R E
You will work with a partner to complete this activity.
SET UP THE EQUIPMENT
1. Mix 200 mL of water with red food coloring tomake the water level easier to read.
2. Fill the 125-mL flask to the rim with thecolored water, then put the stopper on the flask.
3. Place the pipette in the one-hole stopper.CAUTION: Be careful when inserting thepipette into the one-hole stopper. It couldpuncture or cut your skin. The water shouldrise into the pipette, but there should still bea lot of room for the water to expand up thepipette. If the water rises too far, remove thestopper and take a little water out of the flask.
4. Tape a ruler to the pipette so you can easilyread the change in height of the column.
5. Using the ring stand and clamp, connect theclamp to the neck of the flask. Place the flaskin the hot water bath setup. The beaker shouldbe on the hot plate, but the heat should not yetbe turned on. See figure below.
6. Record the level of the water in the pipette inmillimeters. Place a mark on the flask at thebottom of the stopper. You will use this laterto determine the exact amount of water inthe flask.
7. Place the temperature probe in the water bathnear but not touching the bottom of the flask.
SET UP THE CBL
8. Connect the temperature probe to the CBL inchannel 1. Connect the CBL to the calculator.
9. Select CHEMBIO and 1 probe (temperature)in channel 1.
10. Select COLLECT DATA and TRIGGERPROMPT.
11. Allow 1 minute to pass before taking the firstdata point. When the temperature readingsstop changing, press TRIGGER on the CBL.It will prompt you to record a value. Recordthe level of the liquid in the pipette.
12. Select MORE DATA
13. Turn on the hot plate.14. When the water level has increased 2 mm,
press TRIGGER. The calculator will recordthe temperature and prompt you to enter the
liquid level. Also record the water level andtemperature in the data table on the next page.
15. Select MORE DATA.
16. Repeat the procedure until you have collected10–15 data points or the liquid level isapproaching the top of your pipette. This willvary with the pipette you use. If you use a verythin pipette, record about every 5 mm. If youuse a thick pipette, record about every 1 mm.Try to measure at least a 5°C temperaturechange if possible.
17. Select STOP and GRAPH. Sketch the graph inthe box on the next page.
FIND THE VOLUME INCREASE
To find the exact volume of the water at maximumtemperature, you need to know how much waterwas in the flask and in the pipette. Use roomtemperature water for the following three steps.
18. Remove the stopper from the flask. Fill theflask to the mark you made in step 6. Pour thewater from the flask into a 200-mL graduatedcylinder. Record the volume in your notebook.
19. Remove the pipette from the rubber stopper.Fill the pipette with the same amount of waterit held at its maximum during the experiment.
20. Drain the water from the pipette into a 10-mLgraduated cylinder.
LAB CALCULATOR-BASED LAB4
OFF
MED
HIGH LOW
Clamp
Beaker
Flask withcolored
water
Ruler
Hot plate
Pipette
Ring stand
Stopper
56
43
21

Cop
yrig
ht ©
Gle
ncoe
/McG
raw
-Hill
, a d
ivis
ion
of t
he M
cGra
w-H
ill C
ompa
nies
, Inc
.
Name Class Date
Exploring Environmental Problems Lab 4 Earth Science: Geology, the Environment, and the Universe 15
D A T A A N D O B S E R V A T I O N S
LAB CALCULATOR-BASED LAB4
Data Table
GraphWater Rise Due to Temperature
Temperature (°C) Height of Water (mm)
Cop
yrig
ht ©
Gle
ncoe
/McG
raw
-Hill
, a d
ivis
ion
of t
he M
cGra
w-H
ill C
ompa
nies
, Inc
.
Name Class Date
16 Lab 4 Earth Science: Geology, the Environment, and the Universe Exploring Environmental Problems
C H E C K Y O U R H Y P O T H E S I S
Did your data support your hypothesis? Why or why not?
A P P LY A N D A S S E S S
F U R T H E R I N V E S T I G A T I O N
1. Based on the data you collected during this experiment, would a rise in global temperature result in an increase in the volume of oceans? What would be the general effect on sea level?
2. What might be the effect on coastal areas worldwide? Would this present a problem? Explain your answer.
LAB CALCULATOR-BASED LAB4
A N A LY Z E A N D C O N C L U D E
1. Does the volume of the water sample change with a rise in temperature? Explain.
2. What is the relationship between temperature and volume? By what percentage does volume change for each 1.0°C change in temperature? Show your calculations.
Some studies project a possible rise in sea level of about 48 cm (19 in) by the year2100. Report on possible effects of this rise in one of the major cities at or near theEast or Gulf Coast, such as New York City; Charleston, South Carolina; Miami,Florida; or New Orleans, Louisiana.
Cop
yrig
ht ©
Gle
ncoe
/McG
raw
-Hill
, a d
ivis
ion
of t
he M
cGra
w-H
ill C
ompa
nies
, Inc
.
Exploring Environmental Problems Lab 5 Earth Science: Geology, the Environment, and the Universe 17
Name Class Date
H Y P O T H E S I S
Hypothesize how adding carbon dioxide to distilled water will change the pH.
O B J E C T I V E S
• Hypothesize how adding carbondioxide changes the pH of distilledwater.
• Measure the change in pH of distilledwater as carbon dioxide is added orremoved.
• Contrast the pH of water with differ-ing amounts of carbon dioxide.
• Graph the change in pH as carbondioxide is dissolved in distilled water.
• Infer what is responsible for any dif-ference in the change in pH.
P R O B L E M
How will the pH of water change if carbon dioxide is dissolved in it?
How does increased CO2affect the pH of water?
An acid is a substance that produces hydrogen ions (H�) when dissolved in water.A base is a substance that produces hydroxide ions (OH�) when dissolved in
water. We measure the amounts of H� ions and OH� ions present by the unit pH.The pH scale ranges from 0 to 14. On the pH scale, 7 is neutral. A pH below 7 isconsidered to be acidic, whereas a pH above 7 is basic.
Carbon dioxide, CO2, reacts with water to form carbonic acid as indicated in thefollowing reaction:
CO2(g) � H2O(l) ↔ H2CO3(aq)
Carbonic acid, a weak acid, breaks down to produce H� in the following reaction:H2CO3(aq) ↔ 2H+ � CO3
2�
Notice that the arrows in the above reactions go both ways. This means that the reactioncan go either forward or in reverse. It is possible for H2CO3(aq) to disassociate into CO2(g)� H2O(l).
In this experiment, you will test the effect of dissolving CO2 on the pH of distilled water.The CO2 for this activity is produced when your body burns the food you eat. The gases youexhale contain CO2. In the second part of the experiment, you will test the pH of boileddistilled water after heat has driven off the gaseous CO2.
LAB CALCULATOR-BASED LAB5Use with Chapter 27
Section 27.3

Cop
yrig
ht ©
Gle
ncoe
/McG
raw
-Hill
, a d
ivis
ion
of t
he M
cGra
w-H
ill C
ompa
nies
, Inc
.
Name Class Date
18 Lab 5 Earth Science: Geology, the Environment, and the Universe Exploring Environmental Problems
P R O C E D U R E
1. All glassware in this experiment must be clean.
2. Pour 50 mL of distilled water into a clean 100-mL beaker. Pour another 50 mL ofdistilled water into a second 100-mL beaker.
3. Remove the pH electrode from the storagebottle and rinse it with distilled water.Calibrate the pH probe as instructed by your teacher.
4. After calibrating the pH probe, you should beback to the MAIN MENU.
a. Select COLLECT DATA. Press ENTER.
b. Select TIME GRAPH. Press ENTER. Thecalculator display should read ALLOW30 SECONDS FOR CBL TO WARM UP.The CBL should display READY and threedashes. Wait 30 seconds. Press ENTER.
c. Enter 1 for time between samples.Press ENTER.
d. Enter 60 for the number of samples.Press ENTER.
e. The screen will show the sample time of1 second, the number of sample–60, and the experiment length–60 seconds. PressENTER.
f. Select USE TIME SETUP. Press ENTER.
g. Set Y-AXIS MINIMUM to 1. Press ENTER.
h. Set Y-AXIS MAXIMUM to 14.Press ENTER.
i. Set Y-SCL to 1. Press ENTER. You will see amessage that says you are ready to begin.
5. Press ENTER to begin collecting data. As soonas the CBL starts sampling, place a straw belowthe surface of the distilled water in the beakerand blow for 1 minute. Swirl the beaker gentlyas you blow into the water. The CBL will read,graph the pH, and record the values in thecalculator.
6. When the CBL displays DONE, TIME IN L1AND PH IN L2 WILL APPEAR. Press ENTER.
7. Sketch your graph in the space provided in thedata table. Record the initial pH and the finalpH. Press ENTER.
8. Select NO for repeat experiment.Press ENTER.
9. Return to the main menu and selectCOLLECT DATA and MONITOR INPUT.
10. Place the pH probe in the water in the secondbeaker and record the pH. Remove the probeand boil the water for 3 minutes. Allow it tocool for 2–3 minutes. Use the probe to findthe pH of the boiled water.
11. Place a clean straw below the surface ofthe boiled water and blow for 1 minute.CAUTION: Avoid splashing any liquid out of the beaker. Hot water can burn your skin.Measure and record the pH.
LAB CALCULATOR-BASED LAB5
P R E P A R A T I O N
MATERIALS
TI graphing calculatorlink cableCBL unitplastic bottles with pond or lake waterstraws (2)pH probedistilled water100-mL beakers (2)
SAFETY PRECAUTIONS
• Wipe up any spills immediately to help preventslips or falls.
• Wear an apron and safety goggles during the labprocedure.

Cop
yrig
ht ©
Gle
ncoe
/McG
raw
-Hill
, a d
ivis
ion
of t
he M
cGra
w-H
ill C
ompa
nies
, Inc
.
Name Class Date
Exploring Environmental Problems Lab 5 Earth Science: Geology, the Environment, and the Universe 19
D A T A A N D O B S E R V A T I O N S
EFFECT OF CO2
Table 1
Table 2
LAB CALCULATOR-BASED LAB5
pH
Time
Distilled Water Graph as CO2 Is Added
Initial pH Final pH ∆pH
Distilled water
Boiled distilled water
A N A LY Z E A N D C O N C L U D E
1. What is the initial pH of both water samples?
2. What happened to the pH of the distilled water as you added CO2?
3. Write an equation(s) for the reaction that occurred when you blew in the water.
4. Infer why this happened.
Cop
yrig
ht ©
Gle
ncoe
/McG
raw
-Hill
, a d
ivis
ion
of t
he M
cGra
w-H
ill C
ompa
nies
, Inc
.
Name Class Date
20 Lab 5 Earth Science: Geology, the Environment, and the Universe Exploring Environmental Problems
A N A LY Z E A N D C O N C L U D E , continued
5. Write an equation(s) for the reaction that occurred when you boiled the water.
6. Why did the pH of the boiled water go up?
7. What happened to the pH when you added CO2 to the water?
8. Infer what accounts for the difference.
A P P LY A N D A S S E S S
F U R T H E R I N V E S T I G A T I O N
C H E C K Y O U R H Y P O T H E S I S
1. Most textbooks say water has a neutral pH of 7. Why is that most often not the case?
2. If normal rainwater has a pH of between 5.6 and 6.0, is this an indicator of pollution in the air?
3. What do you think would happen if increased carbon dioxide is present in the air?
LAB CALCULATOR-BASED LAB5
Was your hypothesis supported by your data? Why or why not?
Collect rainwater and measure its pH. Contrast your results with room temperature distilled water.

Cop
yrig
ht ©
Gle
ncoe
/McG
raw
-Hill
, a d
ivis
ion
of t
he M
cGra
w-H
ill C
ompa
nies
, Inc
.
Exploring Environmental Problems Lab 6 Earth Science: Geology, the Environment, and the Universe 21
Name Class Date
P R E P A R A T I O N
MATERIALS
TI graphing calculatorlink cableCBL unitpH probe attached to port in CBLcontainer of distilled water50-mL graduated cylinders (4)100-mL beakers (4)bottle of 0.1 M sulfuric aciddropper
50 mL distilled water50 mL ocean water 50 mL lake or pond water50 mL buffer solution
SAFETY PRECAUTIONS
Handle acid with care. If acid spills,wipe it up right away. Dispose of thecloth as directed by your teacher.
O B J E C T I V E S
• Measure the change in pH levels ofdifferent water samples as acid isadded.
• Record the results in a data table.
• Compare and contrast the change inpH of water samples recorded in thetable.
• Draw conclusions about what isresponsible for the difference in thechange in pH levels among watersamples.
• Infer why some bodies of water aremore sensitive to acid precipitationthan others.
P R O B L E M
What effect does the addition of acid have on water taken from various sources? Whataccounts for the difference? What effect can this have in the natural environment?
Simulating Acid PrecipitationUsing H2SO4
Rainwater is slightly acidic naturally. But human activities can make it even moreacidic, with harmful environmental effects. The problem starts with the burning
of fossil fuels in power plants and motor vehicles. Burning these fuels produces sulfurdioxide and nitrogen oxide emissions. They combine with moisture in the air toproduce sulfuric and nitric acid, which fall from the sky as acid precipitation. Acidprecipitation enters surface water bodies such as lakes, ponds, streams, and oceans,where it can change the water’s pH levels. How much of a change there is in pHdepends in part on substances dissolved in the water. Some bodies of water containnatural substances, called buffers, which help neutralize the acid that comes from acidprecipitation. In water bodies without these buffers, acid precipitation can causeexcessive and harmful levels of acidity that can disrupt aquatic ecosystems.
LAB CALCULATOR-BASED LAB6Use with Chapter 27
Section 27.3

Cop
yrig
ht ©
Gle
ncoe
/McG
raw
-Hill
, a d
ivis
ion
of t
he M
cGra
w-H
ill C
ompa
nies
, Inc
.
Name Class Date
22 Lab 6 Earth Science: Geology, the Environment, and the Universe Exploring Environmental Problems
P R O C E D U R E
Work in groups of three. Calibrate the CBLaccording to your teacher’s instructions.
Test the change in pH of distilled water.
1. Remove the pH electrode from the case. Poursome distilled water from the container overthe pH electrode to rinse it.
2. Measure 50 mL of distilled water with thegraduated cylinder. Pour it into a 100-mLbeaker.
3. Place the pH probe in the sample of distilledwater.
4. Select COLLECT DATA. Press ENTER.
5. Select TRIGGER/PROMPT. Press ENTER. Thecalculator should read ALLOW 30 SECONDSFOR CBL TO WARM UP. The CBL shoulddisplay READY and three numbers. Wait30 seconds. Press ENTER.
6. Read the CBL display. When the numbers onthe display stop changing, press TRIGGER.ENTER VALUE should appear on thecalculator’s display.
7. Enter 0, the number of drops of sulfuric acidadded so far.
8. Press ENTER. The calculator now displays aDATA COLLECTION menu.
9. Select MORE DATA. Press ENTER.
10. Add 1 drop of sulfuric acid to the beaker. Swirlthe contents of the beaker thoroughly. Do notspill the contents. When numbers on the CBLdisplay stop changing, press TRIGGER. Enterthe total drops of sulfuric acid that have beenadded to the beaker to this point (1 drop).
11. The DATA COLLECTION menu appears.Select MORE DATA. Press ENTER.
12. Repeat steps 10–11 until 10 drops of sulfuricacid have been added to the beaker. SelectSTOP AND GRAPH. A graph should appear.Press ENTER.
13. Select NO for repeat experiment. PressENTER.
14. Select QUIT. Press ENTER. The calculator willdisplay DONE.
15. Press STAT. EDIT will be highlighted.
16. Press ENTER. The drops will be in L1 and thepH in L2. Record the pH values for each drop(rounded to two decimal places) in Table 1.
Test the change in pH levels of ocean water.
Repeat steps 1 through 16 above with 50 mL of ocean water using a clean graduated cylinderand beaker.
Test the change in pH levels of lake or pond water.
Repeat steps 1 through 16 above with 50 mL of lake or pond water using a clean graduatedcylinder and beaker.
Test the change in pH levels of buffer solution.
Repeat steps 1 through 16 above with 50 mL ofa buffer solution using a clean graduated cylinderand beaker.
LAB CALCULATOR-BASED LAB6

Cop
yrig
ht ©
Gle
ncoe
/McG
raw
-Hill
, a d
ivis
ion
of t
he M
cGra
w-H
ill C
ompa
nies
, Inc
.
Name Class Date
Exploring Environmental Problems Lab 6 Earth Science: Geology, the Environment, and the Universe 23
D A T A A N D O B S E R V A T I O N S
LAB CALCULATOR-BASED LAB6
Drops Distilled Water Ocean Water Lake or Pond Water Buffer Solution
0
1
2
3
4
5
6
7
8
9
10
A N A LY Z E A N D C O N C L U D E
1. Which water samples maintained a fairly stable pH for the longest period after you started to add acid?
2. How many drops of acid were added to each sample before a pH change greater than 2.0 occurred?
3. In which water samples did the pH drop most quickly when you began to add acid?
4. Based on the rate of change in pH for each sample, which sample(s) respond most similar to the buffer solution? Explain your answer.
A P P LY A N D A S S E S S
1. Infer why the sample(s) in question 4 above responded like the buffered solution.
Table 1 Changes in pH Levels

pH 6.5 pH 6.0 pH 5.5 pH 5.0 pH 4.5 pH 4.0
Trout
Bass
Perch
Frogs
Salamanders
Clams
Crayfish
Snails
Mayfly
Cop
yrig
ht ©
Gle
ncoe
/McG
raw
-Hill
, a d
ivis
ion
of t
he M
cGra
w-H
ill C
ompa
nies
, Inc
.
Name Class Date
24 Lab 6 Earth Science: Geology, the Environment, and the Universe Exploring Environmental Problems
A P P LY A N D A S S E S S , continued
LAB CALCULATOR-BASED LAB6
2. Many aquatic organisms can survive in water only within a narrow range of pH values. In which type ofbody of water—lakes, ponds, or oceans—would organisms be more affected by acid precipitation? Explain.
3. Use the map above to determine which part of the country has the most acidic precipitation.
4. Acid precipitation falls in both Indiana and New York. But lakes in New York suffer more negative effectsof the acid precipitation than do those in Indiana. Why do you think this is the case?
Table 2 pH Range in Which Various Organisms Can Survive
Source: EPA Website http://www.epa.gov/acidrain/student/water.html
5. Use Table 2 to determine the organism that would be best able to withstand the negative effects of acidprecipitation in a lake. Explain your answer. Then use Table 1 on page 23 to determine whether thatorganism would survive in pond water after five drops of acid were added. After ten drops were added?
>5.0
5.04.8
4.6
4.4
4.44.4
4.45.0 4.64.8
4.2
4.2 4.2
4.6
4.45.0pH of Rainwater Fallingon the United States
Cop
yrig
ht ©
Gle
ncoe
/McG
raw
-Hill
, a d
ivis
ion
of t
he M
cGra
w-H
ill C
ompa
nies
, Inc
.
Exploring Environmental Problems Lab 7 Earth Science: Geology, the Environment, and the Universe 25
Name Class Date
O B J E C T I V E S
• Design an experiment to test the waythe pH of a solution affects materialsexposed to it.
• Compare and contrast the effect ofpH on various materials.
• Record the results in a data table.
• Infer how acid precipitation wouldaffect bridges, buildings, and otherstructures made of metal and stone.
H Y P O T H E S I S
Write a hypothesis about how exposure to solutions of different pH will affect variousmetal and stone samples.
P R E P A R A T I O N
POSSIBLE MATERIALS
CBL unitTI graphing calculatorpH probecontainer of distilled water hydrochloric acidtap waterbaking sodaspoon
dropper100-mL beakers (3)iron samplecopper samplezinc samplemarble samplelimestone samplemass balance
P R O B L E M
How does exposure to acid solutions affect metal and stone?
LAB CALCULATOR-BASED LAB7Use with Chapter 3, Section 3.2
and Chapter 7, Section 7.1
DESIGN YOUR OWN
How does exposure to acidsolutions affect metal and stone?
Many important structures in the United States are made of metal and stone.These include bridges and significant buildings. When acid precipitation falls
on these structures, problems can result.
Cop
yrig
ht ©
Gle
ncoe
/McG
raw
-Hill
, a d
ivis
ion
of t
he M
cGra
w-H
ill C
ompa
nies
, Inc
.
Name Class Date
26 Lab 7 Earth Science: Geology, the Environment, and the Universe Exploring Environmental Problems
LAB CALCULATOR-BASED LAB7
P R E P A R A T I O N , continued
SAFETY PRECAUTIONS
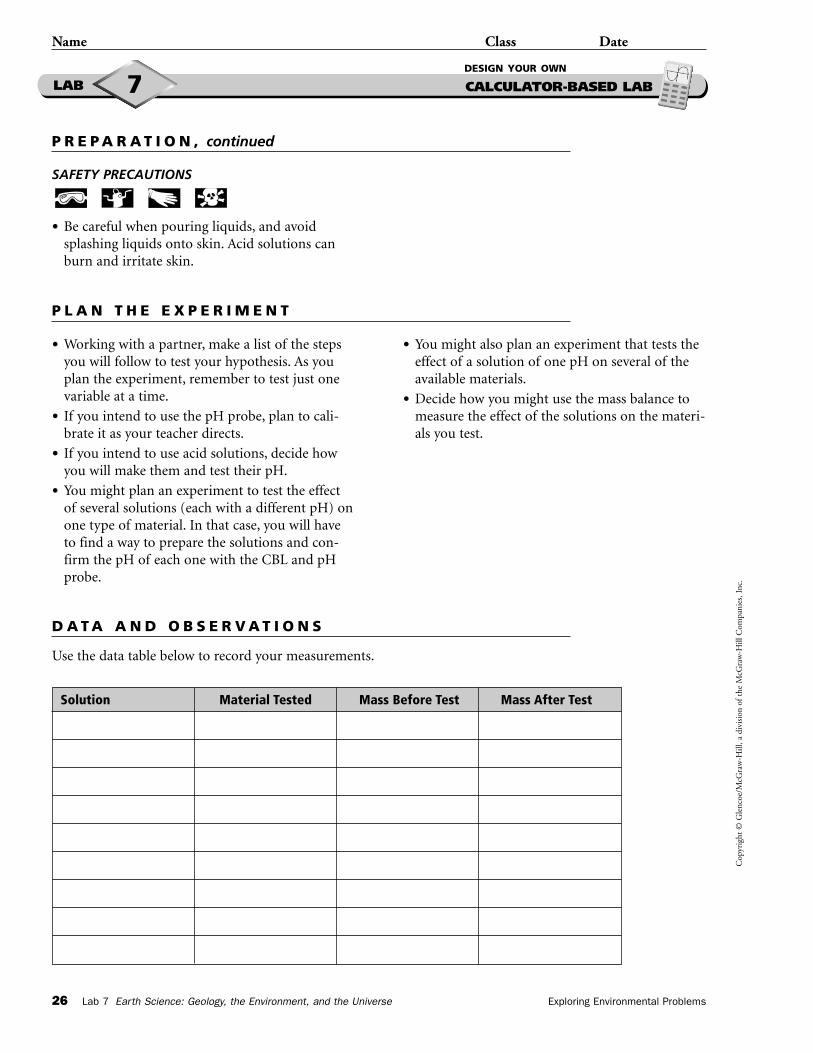
• Be careful when pouring liquids, and avoidsplashing liquids onto skin. Acid solutions canburn and irritate skin.
P L A N T H E E X P E R I M E N T
D A T A A N D O B S E R V A T I O N S
• Working with a partner, make a list of the stepsyou will follow to test your hypothesis. As youplan the experiment, remember to test just onevariable at a time.
• If you intend to use the pH probe, plan to cali-brate it as your teacher directs.
• If you intend to use acid solutions, decide howyou will make them and test their pH.
• You might plan an experiment to test the effectof several solutions (each with a different pH) onone type of material. In that case, you will haveto find a way to prepare the solutions and con-firm the pH of each one with the CBL and pHprobe.
• You might also plan an experiment that tests theeffect of a solution of one pH on several of theavailable materials.
• Decide how you might use the mass balance tomeasure the effect of the solutions on the materi-als you test.
DESIGN YOUR OWN
Use the data table below to record your measurements.
Solution Material Tested Mass Before Test Mass After Test

Cop
yrig
ht ©
Gle
ncoe
/McG
raw
-Hill
, a d
ivis
ion
of t
he M
cGra
w-H
ill C
ompa
nies
, Inc
.
Name Class Date
Exploring Environmental Problems Lab 7 Earth Science: Geology, the Environment, and the Universe 27
C H E C K Y O U R H Y P O T H E S I S
Did your experiment prove your hypothesis? If not, what might have caused the error?
A N A LY Z E A N D C O N C L U D E
1. Did the material samples change after exposure to the solutions? How did they change?
2. Did the pH of the solution in which the material samples were placed affect how much the material changed over time? How?
3. Did the type of material tested affect the results? If so, how?
4. Which sample changed the most after exposure to the solution? Which changed the least? Explain your results.
5. What is the relationship between the pH of the solution and the amount of change in the exposed material?
LAB CALCULATOR-BASED LAB7DESIGN YOUR OWN

Cop
yrig
ht ©
Gle
ncoe
/McG
raw
-Hill
, a d
ivis
ion
of t
he M
cGra
w-H
ill C
ompa
nies
, Inc
.
Name Class Date
28 Lab 7 Earth Science: Geology, the Environment, and the Universe Exploring Environmental Problems
LAB CALCULATOR-BASED LAB7
A P P LY A N D A S S E S S
1. How are the solutions you used in this experiment like acid precipitation?
2. Based on your experiment, how would acid precipitation with a low pH affect metal bridges or stone buildings?
3. How would the pH of the acid precipitation change its effect on buildings and other structures?
4. Would the effects of acid precipitation change depending on the type of stone or metal exposed to it? Explain your answer.
5. How could builders use this information to decrease the effects of acid precipitation on structures made of metal or stone?
F U R T H E R I N V E S T I G A T I O N
Test additional materials and add your observations to the data table. Share yourfindings with the rest of the class.
DESIGN YOUR OWN

Cop
yrig
ht ©
Gle
ncoe
/McG
raw
-Hill
, a d
ivis
ion
of t
he M
cGra
w-H
ill C
ompa
nies
, Inc
.
Exploring Environmental Problems Lab 8 Earth Science: Geology, the Environment, and the Universe 29
Name Class Date
O B J E C T I V E S
• Hypothesize how three micro-climates differ.
• Apply knowledge of the CBL to col-lect temperature, relative humidity,and light-intensity data.
• Use a table to record data gatheredduring the lab.
• Construct graphs with data gatheredduring the lab.
H Y P O T H E S I S
Hypothesize how the microclimate of a forest, a field, and a paved area might differ.
P R O B L E M
What is the difference in microclimate of a forest, a field, and a paved area?
What is the effect of deforestationon the microclimate of an area?
Microclimates are local climate conditions that differ from the general climate of an area.Places with heavy vegetation, such as forests, create microclimates for many reasons.
The trees cast shadows and block low-level winds. Trees also take in water from the ground and release it through their leaves, affecting humidity. The forest provides habitats for smallmammals, birds, reptiles, amphibians, insects, and many invertebrates. The trees provide aplace to live that is sheltered from the elements as well as from predators. The forest is bothcooler in the hot summer and warmer in the cold winter. The shade of the forest means greaterhumidity than in open areas where direct sunlight increases rates of evaporation. Animalsliving in the forest enjoy a more moderate environment than animals in the open areas.
In this lab, you will find out how a forest microclimate differs in terms of temperature,humidity, and light intensity from treeless areas nearby. Then you will consider how the loss of trees could affect both the microclimate and wildlife population of a forest ecosystem.
LAB CALCULATOR-BASED LAB8Use with Chapter 25, Section 25.3
and Chapter 27, Section 27.2

Cop
yrig
ht ©
Gle
ncoe
/McG
raw
-Hill
, a d
ivis
ion
of t
he M
cGra
w-H
ill C
ompa
nies
, Inc
.
Name Class Date
30 Lab 8 Earth Science: Geology, the Environment, and the Universe Exploring Environmental Problems
P R E P A R A T I O N
MATERIALS
meterstickCBL unitTI graphing calculatorlink cabletemperature proberelative humidity sensorlight sensorgarden trowel
SAFETY PRECAUTIONS
Be sure to wear long sleeves, long pants, andclosed-toe shoes when working in wooded areas to protect your skin from poisonous plants,tick bites, and mosquito bites.
P R O C E D U R E
You will work with a group.
SETTING UP THE CBL AND PROBES
1. Connect the CBL unit to the graphingcalculator using the link cable.
2. Insert the temperature probe into channel 1 of the CBL, the relative humidity sensor intochannel 2, and the light sensor into channel 3.
3. Turn on the calculator and CBL. SelectCHEMBIO.
4. Press ENTER two times to go to the MAINMENU. Select SET UP PROBES. Type in 3 forthe number of probes and sensors.
5. Select TEMPERATURE and press ENTER.Type in 1 for the channel. Press ENTER.
6. In the Select Probe Menu, select MORE PROBESand then select RELATIVE HUMIDITY. Select 2for the channel number. Press ENTER. Forcalibration, use STORED. Press ENTER.
7. In the Select Probe Menu, select MOREPROBES and then select LIGHT. Select 3 for the channel number. Press ENTER. Forcalibration, use STORED. The calculatorscreen will remind you to switch on the probe(sensor). Turn the switch on the light sensor to1–150,000 LUX. Press ENTER. Select the samelight setting on the calculator. Press ENTER.
8. Select DATA in the MAIN MENU. SelectMONITOR INPUT. The calculator screen willdisplay temperature in CH 1, relative humidityin CH 2, and light in CH 3. (Wait for the probesor sensors to stabilize when collecting readings,especially with the relative humidity sensor.)
COLLECTING THE DATA
9. You will be measuring temperature, humidity,and light intensity in three environments: aforested area, an open field or a lawn, and apaved area such as a parking lot. Thecalculator will remain on the Monitor Inputscreen while you are in the field. It will displayall three readings simultaneously, but focus onmeasuring only one variable at a time.Occasionally a link cable will dislodge or thedata readings will freeze. You will then have to reset the calculator.
10. Take measurements in the forested area andthe field or lawn at three heights: 1 meterabove the ground, at ground level, and 5 centimeters below the surface. Use ameterstick to measure heights and a gardentrowel to dig the area below the surface. Skipthe below-ground reading in the paved area.
11. To take each measurement, hold the probe orsensor at the desired height until the readingstabilizes, usually less than a minute. Point thelight sensor toward the ground—not the sky.A reading will appear on the Monitor Inputscreen of the calculator. When each readingstabilizes, copy it into your notebook.
12. Start with the forested area. Repeat themeasurements for the field or lawn. Thencollect data in the paved area.
13. Enter the data from your notebook in thetables on the next page.
LAB CALCULATOR-BASED LAB8
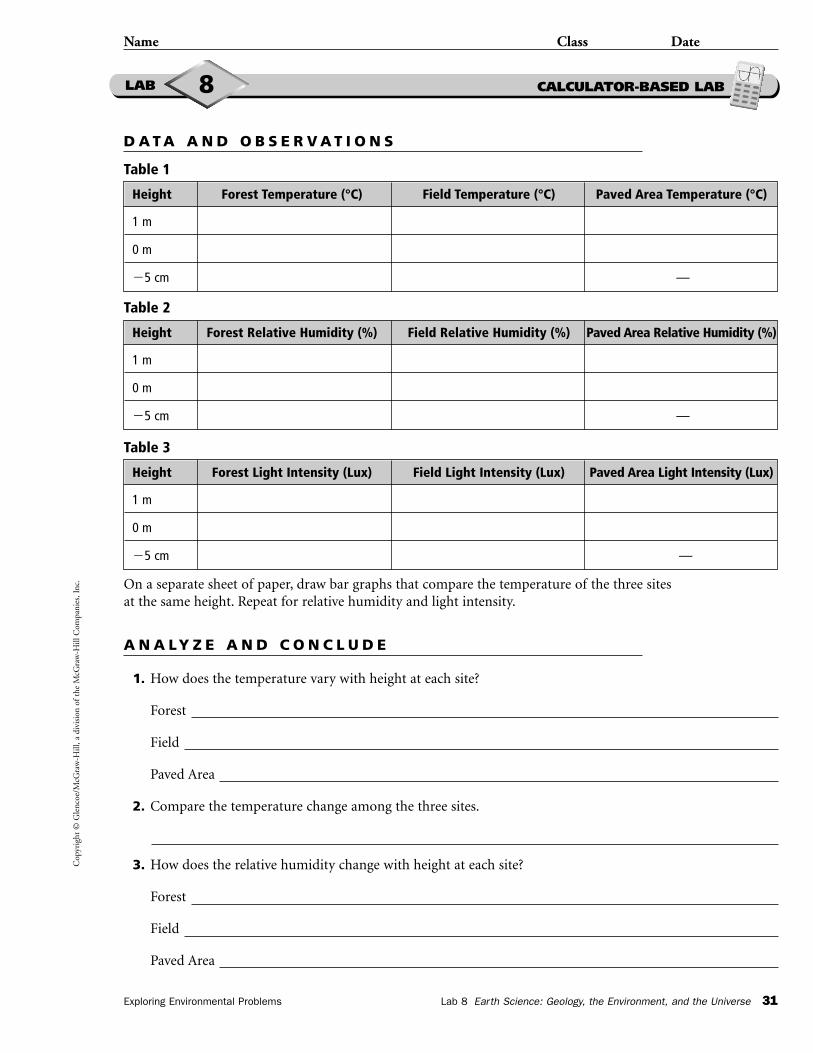
Cop
yrig
ht ©
Gle
ncoe
/McG
raw
-Hill
, a d
ivis
ion
of t
he M
cGra
w-H
ill C
ompa
nies
, Inc
.
Name Class Date
Exploring Environmental Problems Lab 8 Earth Science: Geology, the Environment, and the Universe 31
D A T A A N D O B S E R V A T I O N S
On a separate sheet of paper, draw bar graphs that compare the temperature of the three sites at the same height. Repeat for relative humidity and light intensity.
LAB CALCULATOR-BASED LAB8
Height Forest Temperature (°C) Field Temperature (°C) Paved Area Temperature (°C)
1 m
0 m
�5 cm —
Table 1
Height Forest Relative Humidity (%) Field Relative Humidity (%) Paved Area Relative Humidity (%)
1 m
0 m
�5 cm —
Table 2
Height Forest Light Intensity (Lux) Field Light Intensity (Lux) Paved Area Light Intensity (Lux)
1 m
0 m
�5 cm —
Table 3
A N A LY Z E A N D C O N C L U D E
1. How does the temperature vary with height at each site?
Forest
Field
Paved Area
2. Compare the temperature change among the three sites.
3. How does the relative humidity change with height at each site?
Forest
Field
Paved Area

Cop
yrig
ht ©
Gle
ncoe
/McG
raw
-Hill
, a d
ivis
ion
of t
he M
cGra
w-H
ill C
ompa
nies
, Inc
.
Name Class Date
32 Lab 8 Earth Science: Geology, the Environment, and the Universe Exploring Environmental Problems
A N A LY Z E A N D C O N C L U D E , continued
4. Compare the relative humidity change among the three sites.
5. How does the light intensity change with height at each site?
Forest
Field
Paved Area
6. Compare the light intensity change among the three sites.
7. Summarize the difference in microclimate between the forested and nonforested areas.
C H E C K Y O U R H Y P O T H E S I S
Did your data help you support your hypothesis? Explain your answer.
A P P LY A N D A S S E S S
1. Based on your findings of differences in microclimate, which of these sites would a small mammal prefer? Explain your answer.
2. What effect would removing the forest have on the microclimate of the area?
3. How would removal of the forest and the changes you described in question 2 affect wildlife in the forested area? Explain your answer.
4. Would the loss of the forested area affect the climate of the area around it? Explain your answer.
F U R T H E R I N V E S T I G A T I O N
LAB CALCULATOR-BASED LAB8
Find a fourth type of microclimate area (such as a hilltop, a gully, or an area bordering water) to test.Collect data there and compare this microclimate with the others previously tested in the lab.

Cop
yrig
ht ©
Gle
ncoe
/McG
raw
-Hill
, a d
ivis
ion
of t
he M
cGra
w-H
ill C
ompa
nies
, Inc
.
Exploring Environmental Problems Lab 9 Earth Science: Geology, the Environment, and the Universe 33
Name Class Date
O B J E C T I V E S
• Hypothesize how removal of nearbyvegetation affects water quality of ariver or stream.
• Apply knowledge of the CBL to collect water conductivity data.
• Use a table to record data gatheredduring the lab.
• Make a map of your study area.
• Infer the reason for the determinedwater quality.
H Y P O T H E S I S
Hypothesize how the removal of vegetation near a river or stream affects its water quality.
P R O B L E M
How does the removal of vegetation near a river or stream affect water quality?
How can runoff affect the waterquality of streams and rivers?
As the number of housing developments, shopping centers, roads, and office complexesincreases, more forests, wetlands, and grasslands disappear. Aside from the beauty of
these natural environments, what is lost? Are there negative environmental effects whenvegetation is replaced by impervious surfaces such as parking lots, highways, andsidewalks? Does the type of land use along a body of water affect the type and the amount of runoff that flows in?
In this lab, you will survey your community to find developed areas where runoffinto streams or rivers is occurring. What effect is that runoff having on the water intowhich it flows?
LAB CALCULATOR-BASED LAB9Use with Chapter 7, Section 7.2
and Chapter 27, Section 27.2

Cop
yrig
ht ©
Gle
ncoe
/McG
raw
-Hill
, a d
ivis
ion
of t
he M
cGra
w-H
ill C
ompa
nies
, Inc
.
Name Class Date
34 Lab 9 Earth Science: Geology, the Environment, and the Universe Exploring Environmental Problems
P R E P A R A T I O N
MATERIALS
CBL unitTI graphing calculatorlink cableconductivity probe8 water sampling bottlescontainers with distilled water for soaking probesnotebookpencil
SAFETY PRECAUTIONS
• Be sure to wear long sleeves, long pants, andclosed-toe shoes when working in wooded areasto protect your skin from poisonous plants, tickbites, and mosquito bites.
• Use caution when working near streams to avoidfalling in water.
P R O C E D U R E
You will work with a group to determine thechemical input to streams or rivers by using a conductivity meter.
SETTING UP THE CBL AND PROBES
1. As a group, look at a map and choose thearea along a river or stream that you want tosample. Draw a map of the area on a separatesheet of paper and note where there are landuses such as farms, golf courses, parking lots,parks, forests, lawns, stores, or factories.CAUTION: Avoid construction sites.
2. Identify several sampling sites in the area youchoose. Add them to your map. On the tableon the next page, note the conditions of thebanks along the river or stream at each site.Also note the weather conditions (such asrecent precipitation) when you sample.
3. Collect water samples from the sites. Makesure the water sampling bottles are clean andthere is no soap residue inside. Before usingthe conductivity probe, soak its tip in distilledwater for 10 minutes.
4. Connect the CBL unit to the calculator by thelink cable. Insert the conductivity probe intoChannel 1.
5. Turn on the CBL and calculator. SelectCHEMBIO (under PRGM on the TI-83, orAPPS on the TI-83+). Press ENTER twice toget the Main Menu.
6. Select SET UP PROBES. Type in 1 for thenumber of probes. Press ENTER. In the SelectProbe Menu, select CONDUCTIVITY. Thisis a freshwater activity, so set the probe on0–2000 microsiemens (MICS). The screen willremind you to read the calculator rather thanthe CBL screen.
7. Select 1 for the Channel Number. PressENTER. For calibration, use STORED. Youare only interested in comparing sites, notthe actual conductivity of each site.
8. On the Conductivity Menu, select 0–2000MICS. In the Main Menu, select COLLECTDATA. On the Data Collection screen, selectMONITOR INPUT. Be sure to rinse theprobes between samples.
LAB CALCULATOR-BASED LAB9

Cop
yrig
ht ©
Gle
ncoe
/McG
raw
-Hill
, a d
ivis
ion
of t
he M
cGra
w-H
ill C
ompa
nies
, Inc
.
Name Class Date
Exploring Environmental Problems Lab 9 Earth Science: Geology, the Environment, and the Universe 35
D A T A A N D O B S E R V A T I O N S
A N A LY Z E A N D C O N C L U D E
1. Which site has the greatest level of conductivity, or dissolved ions?
2. What could account for this level of conductivity?
3. How is conductivity affected as you move from upstream to downstream sites?
4. How did conductivity next to shores with vegetation compare to those with bare soil?
LAB CALCULATOR-BASED LAB9
Site Number Site Description Weather Conditions Conductivity Reading
(upstream)1
2
3
4
5
6
7
8(downstream)

Cop
yrig
ht ©
Gle
ncoe
/McG
raw
-Hill
, a d
ivis
ion
of t
he M
cGra
w-H
ill C
ompa
nies
, Inc
.
Name Class Date
36 Lab 9 Earth Science: Geology, the Environment, and the Universe Exploring Environmental Problems
C H E C K Y O U R H Y P O T H E S I S
Did your data help you support your hypothesis? Explain your answer.
A P P LY A N D A S S E S S
F U R T H E R I N V E S T I G A T I O N
1. What are the possible sources of the ions (pollution) that entered the water in your sampling area?
2. Why should sites near vegetation have fewer ions (less pollution) than those sites near bare soil?
3. Why do increased ions in a body of water often mean water that is more polluted?
LAB CALCULATOR-BASED LAB9
Repeat this activity, taking samples from several sites before and after a heavy rainstorm.Determine whether conductivity is connected with rainfall.

Cop
yrig
ht ©
Gle
ncoe
/McG
raw
-Hill
, a d
ivis
ion
of t
he M
cGra
w-H
ill C
ompa
nies
, Inc
.
Exploring Environmental Problems Lab 10 Earth Science: Geology, the Environment, and the Universe 37
Name Class Date
O B J E C T I V E S
• Hypothesize how much energy is lostthrough classroom windows.
• Measure the area of windows in yourclassroom.
• Use the CBL to determine the tem-perature inside and outside of class-room windows.
• Calculate the energy lost throughyour classroom windows.
H Y P O T H E S I S
Hypothesize how much energy is lost through the windows of your classroom.
P R O B L E M
How much energy is lost through classroom windows, and what does it cost?
How much wasted energy goes out the window?Heat flows from hotter objects to cooler objects. This fact can become a problem
when you are trying to keep a room warm in cold weather or cold in warmweather. In winter, warm air flows out of buildings, largely through windows. In veryhot weather, heat can enter buildings through windows, making air-conditioning lessefficient. The energy lost through windows alone accounts for 17 percent of abuilding’s heating and cooling costs.
In this lab, you will measure the amount of energy lost through the windows ofyour classroom and determine the cost of this wasted energy.
LAB CALCULATOR-BASED LAB10Use with Chapter 26, Section 26.3
and Chapter 27, Section 27.1
P R E P A R A T I O N
MATERIALS
CBL unitTI graphing calculatorlink cabletemperature probeyardstick (because of units used to measure
energy, yards must be used instead of meters)notebook
SAFETY PRECAUTIONS

Cop
yrig
ht ©
Gle
ncoe
/McG
raw
-Hill
, a d
ivis
ion
of t
he M
cGra
w-H
ill C
ompa
nies
, Inc
.
Name Class Date
38 Lab 10 Earth Science: Geology, the Environment, and the Universe Exploring Environmental Problems
P R O C E D U R E
D A T A A N D O B S E R V A T I O N S
You will work with a group of three to four people.
1. Measure the length and width of each windowin your classroom. Calculate the area of thewindows, as illustrated in Table 2 below.
2. You will now use the temperature probe todetermine the temperature on the inside andoutside of the windows. Connect the CBL unitand the calculator with the link cable. Turn onthe unit.
3. Insert the temperature probe in Channel 1.Select CHEMBIO.
4. Press ENTER twice to get the MAIN MENU.Select SET UP PROBE. Type 1 for the numberof probes. Under SELECT PROBE, chooseTEMPERATURE. Type 1 for the channelnumber. Press ENTER.
5. In the MAIN MENU, select COLLECT DATA.Press ENTER. In the DATA COLLECTIONMENU select MONITOR INPUT. PressENTER. The temperature will be displayed onthe calculator.
6. Select five areas of your window from which tocollect temperature data. You will take thereadings at these five spots both inside andoutside. To take each reading, hold thetemperature probe two centimeters away fromthe window for 1 minute. Record thetemperature. Convert the Celsius temperature
to Fahrenheit using the following formula:F � 9/5 C � 32. Record the temperatures inTable 3 on the next page. Take the five insidereadings. Then repeat this procedure outside.Find the difference in temperature bysubtracting the outside from the inside.
7. To calculate the energy lost or gained througha window in BTUs (British Thermal Units),use the following formula:
To calculate heat loss or gain in BTUs per hour:
To convert BTUs/hour to kilowatt-hours (unitsof energy use):
8. To calculate the cost of these kilowatt-hours,find out what you are charged per kilowatt-hour in your area. You can also use the averageprice charged for a kilowatt-hour in theUnited States, which is $.07.
9. Finish the calculations for the lab, using Table 4 on the next page. Use the example inthe first column of the table to see how thecalculations are done.
LAB CALCULATOR-BASED LAB10
feet2 � difference in temperatureR-value
kilowatt hours �BTU3412
BTUs per
hour�
Units Single-pane windows Double-pane windows Triple-pane windows Low emission windows
R-value 0.9 1.85 2.8 4.0
Table 1 R-values for Different Types of Windows
Number of TotalWindow type Length Width Area in square feet windows of this type square feet
Example 6 ft. 3 ft. 18 ft2 6 108 ft2
Total area of all windows
Table 2 Data Table for Area of Windows

Cop
yrig
ht ©
Gle
ncoe
/McG
raw
-Hill
, a d
ivis
ion
of t
he M
cGra
w-H
ill C
ompa
nies
, Inc
.
Name Class Date
Exploring Environmental Problems Lab 10 Earth Science: Geology, the Environment, and the Universe 39
D A T A A N D O B S E R V A T I O N S , continued
LAB CALCULATOR-BASED LAB10
Location Inside Temperature Outside Temperature
1
2
3
4
5
Average
Table 3 Temperature Readings
Actualclassroom If area ofarea for windows Cold day Double- Triple- Low-
single-pane was cut with a 40° pane pane emissionUnits Example windows in half temperature windows windows windows
ft2 108 ft2
Averageinside 70° Ftemperature °F
Averageoutside 60° Ftemperature °F
Temperaturedifference
10
R-value 0.9 0.9 0.9 0.9 1.85 2.8 40
Heat lossor gain inBTU/hr
Heat lossor gain inBTU/year**
Kilowatt-hours per year
Annual costof kilowatt-hour (.07)
Table 4* Results of Calculations
** Table 4 assumes that the classroom windows are single panes. If this is not the case, start on the appropriate column.** This is based on the assumption that the temperature differences will be 10 degrees on an annual basis.
108 � 100.9
� 1200
105120003412
� 3081
1200 � 8760� 10512000
.07 � 3081� $215.70

Cop
yrig
ht ©
Gle
ncoe
/McG
raw
-Hill
, a d
ivis
ion
of t
he M
cGra
w-H
ill C
ompa
nies
, Inc
.
Name Class Date
40 Lab 10 Earth Science: Geology, the Environment, and the Universe Exploring Environmental Problems
C H E C K Y O U R H Y P O T H E S I S
Did your data help you support your hypothesis? Explain your answer.
A P P LY A N D A S S E S S
F U R T H E R I N V E S T I G A T I O N
1. Homes and offices often have many windows because they let in light and provide a pleasant view of outside scenery. Are there some climates in which large windows are not a good idea, in terms ofenergy efficiency? Explain your answer.
2. Because more light comes in through south-facing windows than north-facing windows, how would the placement of windows in the building affect heat loss or gain in your climate?
LAB CALCULATOR-BASED LAB10
A N A LY Z E A N D C O N C L U D E
1. Based on your calculations, list two ways that windows can be designed to reduce energy loss.
2. Heat exchanged through windows is affected by the difference between the inside and outside temperatures.How would your calculations be affected by taking these measurements at a different time of year?
Estimate the amount of money your school could save by replacing its present windows with moreenergy-efficient ones. For example, if your school has single-pane windows, how much could besaved by changing to double-pane windows? If it has double-pane windows, how much would besaved by changing to triple-pane or low-emission windows? Include the cost of window replacementin your budget.

Cop
yrig
ht ©
Gle
ncoe
/McG
raw
-Hill
, a d
ivis
ion
of t
he M
cGra
w-H
ill C
ompa
nies
, Inc
.
Name Class Date
O B J E C T I V E S
• Hypothesize how the energy effi-ciency of incandescent and fluores-cent lightbulbs compares.
• Use the CBL to determine the lightand heat energy given off by incan-descent and fluorescent lightbulbs.
• Calculate energy efficiency.
• Calculate money saved by using the more efficient lightbulb.
H Y P O T H E S I S
Hypothesize how the energy efficiency of incandescent and fluorescent lightbulbs compares.
P R O B L E M
How do incandescent and fluorescent lightbulbs compare in terms of energy efficiency?
Which type of lightbulb is more efficient?
When you see a lightbulb, chances are it’s either incandescent or fluorescent. But eachtype of lightbulb works in a different way. In an incandescent lightbulb, electric
current (a series of electrons) passes through a tungsten filament. Because the filamentresists the flow of electrons, it heats up and glows, producing light. A fluorescent lightbulbcontains mercury vapor. When electric current passes through the lightbulb, atoms ofmercury vapor become excited and give off energy in the ultraviolet (UV) range. This UVenergy makes a phosphorus coating inside the lightbulb glow, giving off light. Incandescentlightbulbs are much more common than fluorescent lightbulbs. In fact, there’s a goodchance that most of the lightbulbs in your home are incandescent lightbulbs. But whichtype of lightbulb is better to use?
In this lab, you will compare the energy efficiency of incandescent and fluorescentlightbulbs to see which type wastes more energy.
LAB CALCULATOR-BASED LAB11Use with Chapter 26
Section 26.3
Exploring Environmental Problems Lab 11 Earth Science: Geology, the Environment, and the Universe 41
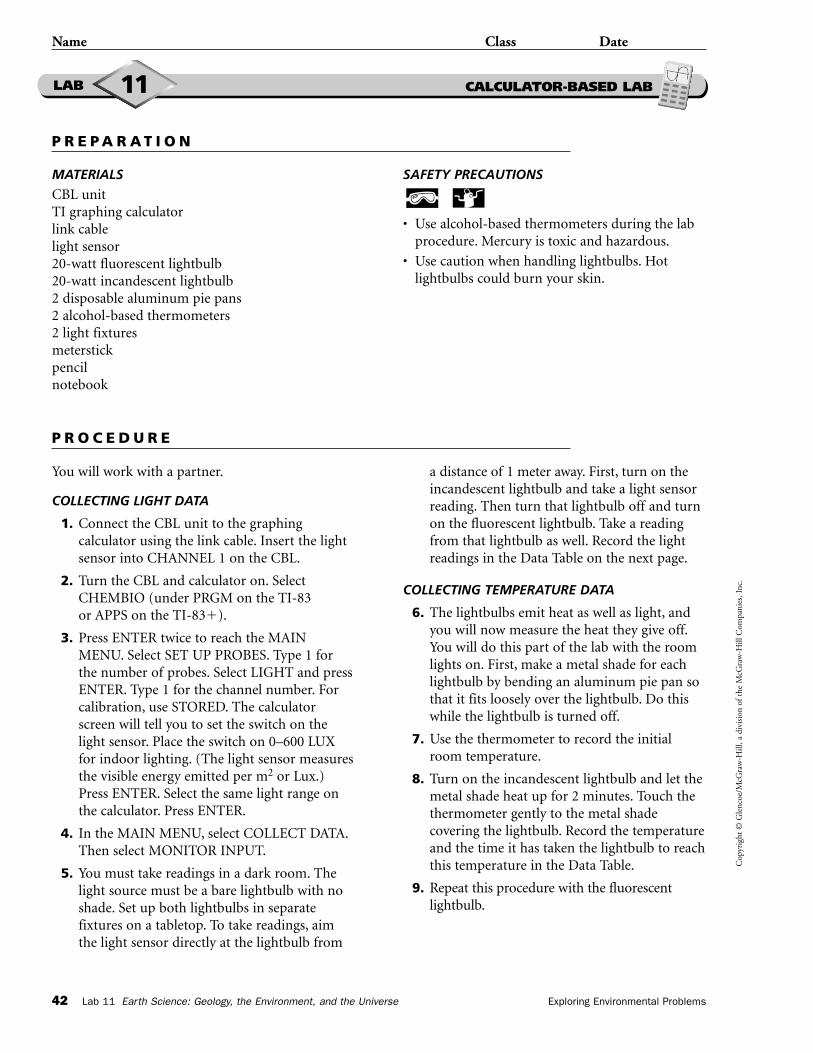
Cop
yrig
ht ©
Gle
ncoe
/McG
raw
-Hill
, a d
ivis
ion
of t
he M
cGra
w-H
ill C
ompa
nies
, Inc
.
Name Class Date
42 Lab 11 Earth Science: Geology, the Environment, and the Universe Exploring Environmental Problems
P R E P A R A T I O N
MATERIALS
CBL unitTI graphing calculatorlink cablelight sensor20-watt fluorescent lightbulb20-watt incandescent lightbulb2 disposable aluminum pie pans2 alcohol-based thermometers2 light fixturesmeterstickpencilnotebook
SAFETY PRECAUTIONS
• Use alcohol-based thermometers during the labprocedure. Mercury is toxic and hazardous.
• Use caution when handling lightbulbs. Hot lightbulbs could burn your skin.
P R O C E D U R E
You will work with a partner.
COLLECTING LIGHT DATA
1. Connect the CBL unit to the graphingcalculator using the link cable. Insert the lightsensor into CHANNEL 1 on the CBL.
2. Turn the CBL and calculator on. SelectCHEMBIO (under PRGM on the TI-83or APPS on the TI-83�).
3. Press ENTER twice to reach the MAINMENU. Select SET UP PROBES. Type 1 forthe number of probes. Select LIGHT and pressENTER. Type 1 for the channel number. Forcalibration, use STORED. The calculatorscreen will tell you to set the switch on thelight sensor. Place the switch on 0–600 LUXfor indoor lighting. (The light sensor measuresthe visible energy emitted per m2 or Lux.)Press ENTER. Select the same light range onthe calculator. Press ENTER.
4. In the MAIN MENU, select COLLECT DATA.Then select MONITOR INPUT.
5. You must take readings in a dark room. Thelight source must be a bare lightbulb with noshade. Set up both lightbulbs in separatefixtures on a tabletop. To take readings, aimthe light sensor directly at the lightbulb from
a distance of 1 meter away. First, turn on theincandescent lightbulb and take a light sensorreading. Then turn that lightbulb off and turnon the fluorescent lightbulb. Take a readingfrom that lightbulb as well. Record the lightreadings in the Data Table on the next page.
COLLECTING TEMPERATURE DATA
6. The lightbulbs emit heat as well as light, andyou will now measure the heat they give off.You will do this part of the lab with the roomlights on. First, make a metal shade for eachlightbulb by bending an aluminum pie pan sothat it fits loosely over the lightbulb. Do thiswhile the lightbulb is turned off.
7. Use the thermometer to record the initialroom temperature.
8. Turn on the incandescent lightbulb and let themetal shade heat up for 2 minutes. Touch thethermometer gently to the metal shadecovering the lightbulb. Record the temperatureand the time it has taken the lightbulb to reachthis temperature in the Data Table.
9. Repeat this procedure with the fluorescentlightbulb.
LAB CALCULATOR-BASED LAB11

Cop
yrig
ht ©
Gle
ncoe
/McG
raw
-Hill
, a d
ivis
ion
of t
he M
cGra
w-H
ill C
ompa
nies
, Inc
.
Name Class Date
Exploring Environmental Problems Lab 11 Earth Science: Geology, the Environment, and the Universe 43
A N A LY Z E A N D C O N C L U D E
1. Which lightbulb gives off more light?
2. How much more efficient is the brighter lightbulb? To find which is more efficient,use the following formula:
� 100 � % more efficient
3. Which lightbulb heats the metal shade to a higher temperature?
4. Which lightbulb raises the temperature more quickly?
Lux of brighter lightbulb � Lux of dimmer lightbulbLux of dimmer lightbulb
(or energy of lightbulb)
D A T A A N D O B S E R V A T I O N S
Data Table
LAB CALCULATOR-BASED LAB11
Initial Final Time for Temperature Lux Temperature Temperature to Stabilize
Fluorescent
Incandescent
C H E C K Y O U R H Y P O T H E S I S
Did your data help you support your hypothesis? Explain your answer.

Cop
yrig
ht ©
Gle
ncoe
/McG
raw
-Hill
, a d
ivis
ion
of t
he M
cGra
w-H
ill C
ompa
nies
, Inc
.
Name Class Date
44 Lab 11 Earth Science: Geology, the Environment, and the Universe Exploring Environmental Problems
F U R T H E R I N V E S T I G A T I O N
Are there incandescent lightbulbs in use in your home? Could your family savemoney by replacing all or some of them with fluorescent lightbulbs? Find out andcompare your findings with those of other students in your class.
A P P LY A N D A S S E S S
1. Because both lightbulbs use the same wattage but produce different amounts of light, how is the extra energy lost? Explain your answer.
2. In order to have equivalent luminosity to a 25-watt fluorescent lightbulb, an incandescentlightbulb must be 100 watts. This fluorescent lightbulb costs $14 and uses $25 in electricityover its 10,000-hour life span. The 100-watt lightbulb costs $.40 but uses $100 in electricity if it had an equivalent life span. Actually, because the 100-watt lightbulb only lasts 750 hours,13 lightbulbs would be used per fluorescent lightbulb.
a. What is the cost of using the fluorescent lightbulb? (price � cost of electricity � ?)
b. What is the cost of using the incandescent lightbulb? (price � cost of electricity � ?)
c. How much did you save by using the fluorescent lightbulb?
3. Taking into account what you found out about the two types of lightbulbs in this lab,why are incandescent lightbulbs used much more widely than fluorescent lightbulbs?
LAB CALCULATOR-BASED LAB11

Cop
yrig
ht ©
Gle
ncoe
/McG
raw
-Hill
, a d
ivis
ion
of t
he M
cGra
w-H
ill C
ompa
nies
, Inc
.
Exploring Environmental Problems Lab 12 Earth Science: Geology, the Environment, and the Universe 45
Name Class Date
O B J E C T I V E S
• Hypothesize how knowing your loca-tion could be useful.
• Determine your location using a GPSreceiver.
• Record your location’s latitude,longitude, and elevation using theGPS receiver.
• Use a table to record data showingyour location.
P R O B L E M
How can you use a GPS unit to find your exact location on Earth’s surface?
LAB GLOBAL POSITIONING SYSTEM LAB12Use with Chapter 2
Section 2.3
How can you use a GPS receiver to find your position on Earth’ssurface?
Global Positioning System, or GPS, is a satellite system for locating your position onEarth. It was developed by the U.S. military to provide navigation information for
the armed forces. The U.S. government now provides the system to anyone in the worldwho wants to use it, free of charge. As a result, GPS now has many uses worldwide. Forexample, GPS units are now standard equipment in ambulances, as well as in some carsand boats. GPS also has many applications in mapmaking, science, and aviation.
GPS has three parts: ground monitoring stations, satellites, and receivers. Groundmonitoring stations keep track of the 24 GPS satellites and beam information up to themto correct any errors in their orbits. The satellites orbit Earth, sending signals to the groundthat allow receivers to determine a user’s location. The receiver is an electronic unit thatshows the user’s location on Earth’s surface. You will learn how to use a GPS receiver in this lab.
H Y P O T H E S I S
P R E P A R A T I O N
Hypothesize how GPS can be used to determine location.
MATERIALS
GPS unit notebook pencil

Cop
yrig
ht ©
Gle
ncoe
/McG
raw
-Hill
, a d
ivis
ion
of t
he M
cGra
w-H
ill C
ompa
nies
, Inc
.
Name Class Date
46 Lab 12 Earth Science: Geology, the Environment, and the Universe Exploring Environmental Problems
P R O C E D U R E
1. Turn on the GPS unit. You will see a displaysuch as the one below. As the unit receivessatellite signals, they will appear on the circles(representing the sky) relative to their positionin the sky. Gray signal bars, such as thosebelow, will appear on the bottom of the screen.The gray bars turn black when the receiver getsfour strong signals.
2. On the diagram above, record the number ofeach satellite that appears on your display anddraw in the satellites.
3. Observe the black bars on the display. Thetaller the bar, the stronger the satellite signal.Show the strengths of the signals by drawingblack bars on the diagram.
4. You must receive strong signals from foursatellites. After the bars become black, look atthe top of the screen. If the unit reads 2DNAVIGATION, it is not getting a strong signal.Make sure you are not near a building thatwould obstruct the signal. If you see 3D, youare getting four strong signals. Decide whetheryou are receiving strong signals from enoughsatellites to determine your location.
5. Press the PAGE key to move to the positionpage, as you see in the next column. You willsee your latitude, longitude, and elevation onthe GPS display. Record them in the space
provided under Data and Observations.The screen also displays the direction in whichyou are moving (heading), your speed, thetime, and the date. The graphic compass tapeacross the top of the display shows yourheading only while you are moving.
6. Walk in any direction for about 10 seconds.Observe what happens to the display as youwalk. Record your observations on the nextpage. Also record your direction and speed asyou walk.
7. Page to MAIN MENU. Select SETUP MENU.Press ENTER and highlight NAVIGATION.
8. Press ENTER. Under POSITION FRMT, youshould see your location displayed in one ofthe three ways shown in the table below.Record your location in all three ways in thetable in Data and Observations.
LAB GLOBAL POSITIONING SYSTEM LAB12
Acquiring EPE
F
E
N
02 07 11 15 19
POSITION PAGE330 345 N 01
SPEED
AVERAGE SPEED
TRIP TIMER
HEIGHT
KPH
KPH
MT
UT
0.00.0 16:01
0.0 136.25
N 38° 51.4382'W 094° 47.940'
14:04:4118-JUN-02
Reading Example Meaning
hddd°mm'ss.s N36°00'50.4" North 36 degrees 0 minutes and 50.4 sec
hddd°mm.mmm N36°00.840' North 36 degrees and.84 minutes
hddd.ddddd N36.01399° North 36.01399 degrees
Latitude and Longitude

Cop
yrig
ht ©
Gle
ncoe
/McG
raw
-Hill
, a d
ivis
ion
of t
he M
cGra
w-H
ill C
ompa
nies
, Inc
.
Name Class Date
Exploring Environmental Problems Lab 12 Earth Science: Geology, the Environment, and the Universe 47
A N A LY Z E A N D C O N C L U D E
1. Why should you record elevation as well as latitude and longitude?
2. What happened to the GPS display as you walked?
LAB GLOBAL POSITIONING SYSTEM LAB12
D A T A A N D O B S E R V A T I O N S
1. What are your latitude, longitude, and elevation? (step 5)
2. What was your direction and speed as you walked? (step 6)
3. Record your position in the three ways described in the table below.
P R O C E D U R E , continued
9. Press PAGE again and move to MAP PAGE.This page allows you to locate nearby cities ordraw maps that you can display on the screen.(We will use this in Lab 13.) The receiverstores locations as “waypoints.” To save alocation, press MARK. The receiver will savethe latitude and longitude of the location andstore it in numerical order.
10. Press PAGE again to get to the NAVIGATIONPAGE. This page looks like a compass. It showsthe destination waypoint with the bearing
(BRG) or the direction in which you should go,as well as the distance (DST) to the waypoint.Both are at the top of the page. The centercontains a compass ring and an arrow to showyou the direction of the waypoint in relationto the direction in which you are moving.
11. Press PAGE again and move back to the MAINMENU page. You should now be familiar withthe GPS unit and ready to go on to other labassignments.
hddd°mm'ss.s
hddd°mm.mmm
hddd.ddddd

Cop
yrig
ht ©
Gle
ncoe
/McG
raw
-Hill
, a d
ivis
ion
of t
he M
cGra
w-H
ill C
ompa
nies
, Inc
.
Name Class Date
48 Lab 12 Earth Science: Geology, the Environment, and the Universe Exploring Environmental Problems
F U R T H E R I N V E S T I G A T I O N
Find the latitude and longitude of the school. Visit sites listed on the Glencoe Science Web Site for more information.
LAB GLOBAL POSITIONING SYSTEM LAB12
A P P LY A N D A S S E S S
1. Why might scientists find it useful to use a GPS unit to find latitude, longitude, or elevation?
2. What conditions might make it difficult to use a GPS unit to find location?
C H E C K Y O U R H Y P O T H E S I S
Did your data support your hypothesis? Explain your answer.

Cop
yrig
ht ©
Gle
ncoe
/McG
raw
-Hill
, a d
ivis
ion
of t
he M
cGra
w-H
ill C
ompa
nies
, Inc
.
Exploring Environmental Problems Lab 13 Earth Science: Geology, the Environment, and the Universe 49
Name Class Date
O B J E C T I V E S
• Hypothesize how a GPS unit can beused as a tool for making maps andfinding direction.
• Measure latitude and longitude oflocations using a GPS unit.
• Make a map based on observations.
• Make a map using data from the GPS unit.
• Compare and contrast a map madeby observation with one made usingGPS data.
• Use a GPS unit to find direction.
P R O B L E M
How can you use a GPS unit as a mapmaking or direction-finding tool?
LAB GLOBAL POSITIONING SYSTEM LAB13Use with Chapter 2
Section 2.1
How can you use GPS to make a map and find direction?
Amap is a bird’s-eye view of the landscape. If you were able to fly over an area,mapping it would be fairly easy. You would be able to see the buildings, streets,
and major landforms in their proper shapes and in the correct locations. When youare on the ground, you have to use other means to find locations and map objects.One means is to use a tool that can give you data on locations, almost as if you had abird’s-eye view of an area. Using a GPS unit allows you to stay on the ground whileusing satellite data that determines the exact locations of the objects around you. Howdo you think this would affect your ability to make an accurate map or find your wayfrom one location to another?
H Y P O T H E S I S
Hypothesize how a GPS unit can be used to produce a map and find direction.
P R E P A R A T I O N
MATERIALS
GPS unitmedium-size rock or other markerpencilnotebook

Cop
yrig
ht ©
Gle
ncoe
/McG
raw
-Hill
, a d
ivis
ion
of t
he M
cGra
w-H
ill C
ompa
nies
, Inc
.
Name Class Date
50 Lab 13 Earth Science: Geology, the Environment, and the Universe Exploring Environmental Problems
P R O C E D U R E
PART I: MAKING THE MAP
1. Make a rough sketch of the overall site youwish to map in your notebook. Decide whereyou will take GPS readings. Place an X on themap to mark the sites of these readings.Number the locations X1, X2, X3, and so on.
2. Turn on your GPS unit. Wait until you acquirefour good satellite signals and the bars at thebottom of the display turn black. This is thesame procedure you used at the beginning ofLab 12.
3. Select a “home” site. This might be your schoolentrance. When you have a good signal, pressthe MARK key, then press ENTER. The receiverstores the latitude and longitude of the site as awaypoint. Record the latitude and longitude inyour notebook.
4. To draw a map on your GPS unit, press PAGEuntil you return to the MAIN MENU page.Highlight WAYPOINT. Press ENTER. Thewaypoint number you just entered ishighlighted. Press ENTER again. If there areother waypoints stored, this latest waypointshould be the last number that appears.
5. The first digit in the three-digit number ishighlighted. Press the UP or DOWN arrow keyuntil you get to “H.” Press the RIGHT arrow tomove to the second digit. Repeat the procedureto spell HOME. (You can skip this step and justrecord the waypoint number in your notebook.)
6. Press ENTER to save and end the name. PressENTER again to highlight the small symbol tothe right of HOME. Press ENTER again and atable with symbols will appear. Highlight thelittle house. Press ENTER. Arrow to DONEand press ENTER again.
7. Press ENTER until you return to the mapscreen. You should see a little house near thecenter of the screen.
8. Walk to the spot where you have drawn X1.Press MARK, then press ENTER. You mayrename the point as you did with HOME instep 5 above, or record the waypoint numberin your notebook. Record the latitude andlongitude for X1 in your notebook. Place amarker here.
9. Continue the procedure by walking to andmarking all of the planned X points for yourmap. Record the latitude and longitude foreach waypoint in Table 1 on the next page.
10. Return to the spot you called HOME. Mark awaypoint at the return site for comparison. Donot delete the waypoints. You will use them inthe next lab.
11. On the sketch of the map you drew in step 1above, add the latitude and longitude of eachwaypoint to complete your map. Sketch themap displayed on the GPS screen forcomparison.
PART II: FINDING DIRECTION ON YOUR MAP
12. Go to the starting point above called HOME.Turn on the GPS unit and wait for a strongsignal.
13. Press GO TO. A list of waypoints shouldappear.
14. Press the DOWN arrow key to get to thewaypoint your teacher has assigned you.
15. Press ENTER. A screen will appear that hasBRG (bearing) and DST (distance) at the top.Bearing tells you the direction in which to goin order to get to the assigned waypoint.Distance tells you how far you are from thewaypoint.
16. Walk in the direction as given by BRG and the compass. Observe and take notes on whathappens as you walk. Locate the marker left by the last group.
17. Trade GPS units with another group. See ifyou can find your way to their waypoint 2 byfollowing the BRG and compass. Take notes on how you decided which way to walk.
18. Press PAGE repeatedly to return to the map page.
19. Press ENTER. Use the arrow keys to increasethe distance covered by the map (located at thetop of the screen). After you change the scale,the GPS unit draws a new map. Record thecities that appear on the screen within 200 kmof your location in Table 2 on the next page.
LAB GLOBAL POSITIONING SYSTEM LAB13
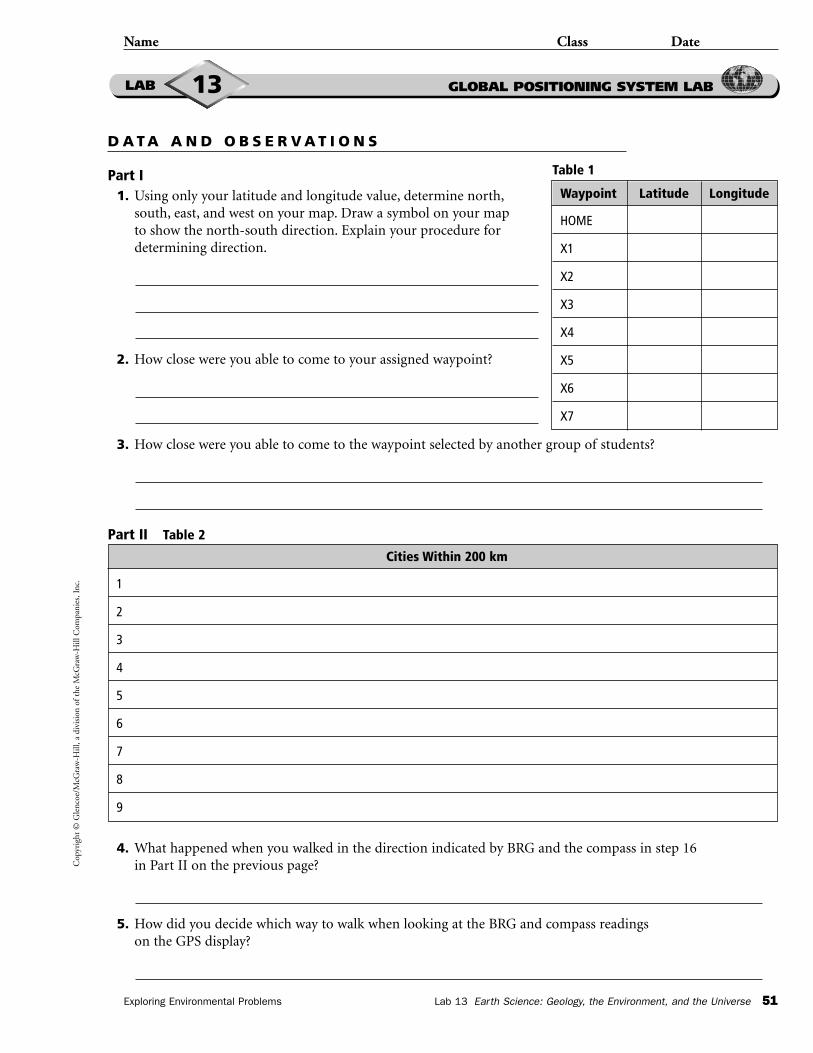
Cop
yrig
ht ©
Gle
ncoe
/McG
raw
-Hill
, a d
ivis
ion
of t
he M
cGra
w-H
ill C
ompa
nies
, Inc
.
Name Class Date
Exploring Environmental Problems Lab 13 Earth Science: Geology, the Environment, and the Universe 51
LAB GLOBAL POSITIONING SYSTEM LAB13
4. What happened when you walked in the direction indicated by BRG and the compass in step 16 in Part II on the previous page?
5. How did you decide which way to walk when looking at the BRG and compass readings on the GPS display?
D A T A A N D O B S E R V A T I O N S
Part I1. Using only your latitude and longitude value, determine north,
south, east, and west on your map. Draw a symbol on your map to show the north-south direction. Explain your procedure for determining direction.
2. How close were you able to come to your assigned waypoint?
3. How close were you able to come to the waypoint selected by another group of students?
Part II Table 2
Waypoint Latitude Longitude
HOME
X1
X2
X3
X4
X5
X6
X7
Cities Within 200 km
1
2
3
4
5
6
7
8
9
Table 1

Cop
yrig
ht ©
Gle
ncoe
/McG
raw
-Hill
, a d
ivis
ion
of t
he M
cGra
w-H
ill C
ompa
nies
, Inc
.
Name Class Date
52 Lab 13 Earth Science: Geology, the Environment, and the Universe Exploring Environmental Problems
F U R T H E R I N V E S T I G A T I O N
LAB GLOBAL POSITIONING SYSTEM LAB13
A P P LY A N D A S S E S S
1. In this activity, you constructed a map using the GPS unit and then used the GPS unit to locate an object. What would you expect to see on the GPS-drawn map if a fence stood between waypoints 2 and 3 that you had walked around?
A N A LY Z E A N D C O N C L U D E
Part I1. How does your map compare to the map drawn by the GPS receiver?
2. How closely did your last waypoint’s latitude and longitude match that of your home latitude and longitude? Explain.
Part II3. Write instructions that someone else could use to find a location using bearing (BRG reading)
on the GPS receiver.
4. What happened to the map when you changed the map scale?
C H E C K Y O U R H Y P O T H E S I S
Did your data support your hypothesis? Why or why not?
How is GPS used by police officers and firefighters in your area? Interview someone at your localpolice or fire department to find out. Write a short report on what you learn.

Cop
yrig
ht ©
Gle
ncoe
/McG
raw
-Hill
, a d
ivis
ion
of t
he M
cGra
w-H
ill C
ompa
nies
, Inc
.
Exploring Environmental Problems Lab 14 Earth Science: Geology, the Environment, and the Universe 53
Name Class Date
O B J E C T I V E S
• Apply knowledge of the GPS unit toplan and draw a map.
• Use a map to create and complete ascavenger hunt.
• Apply knowledge of the GPS unit tofind direction to hidden objects.
P R O B L E M S
How can you use GPS to draw and store a map that other students can use in ascavenger hunt? How can you use a stored map drawn by other students to find theobjects they have hidden?
P R E P A R A T I O N
MATERIALS
GPS unit6 medium-size rockslarge marking pennotebook
LAB GLOBAL POSITIONING SYSTEM LAB14Use with Chapter 2
Section 2.2
GPS Scavenger Hunt
In this activity, you will use GPS to plan a scavenger hunt, then use it again for asecond hunt to find hidden objects. The activity is a game. But it allows you to use
two skills you have learned with the GPS receiver: making maps and finding direction.Scientists also use this procedure to pinpoint a certain site and then return manytimes to it to collect data. In the first part of the activity, you will make a map thatshows where you have hidden six objects. In the activity’s second part, you will useyour ability to read a map and find direction with a GPS receiver to find six objectshidden by classmates.
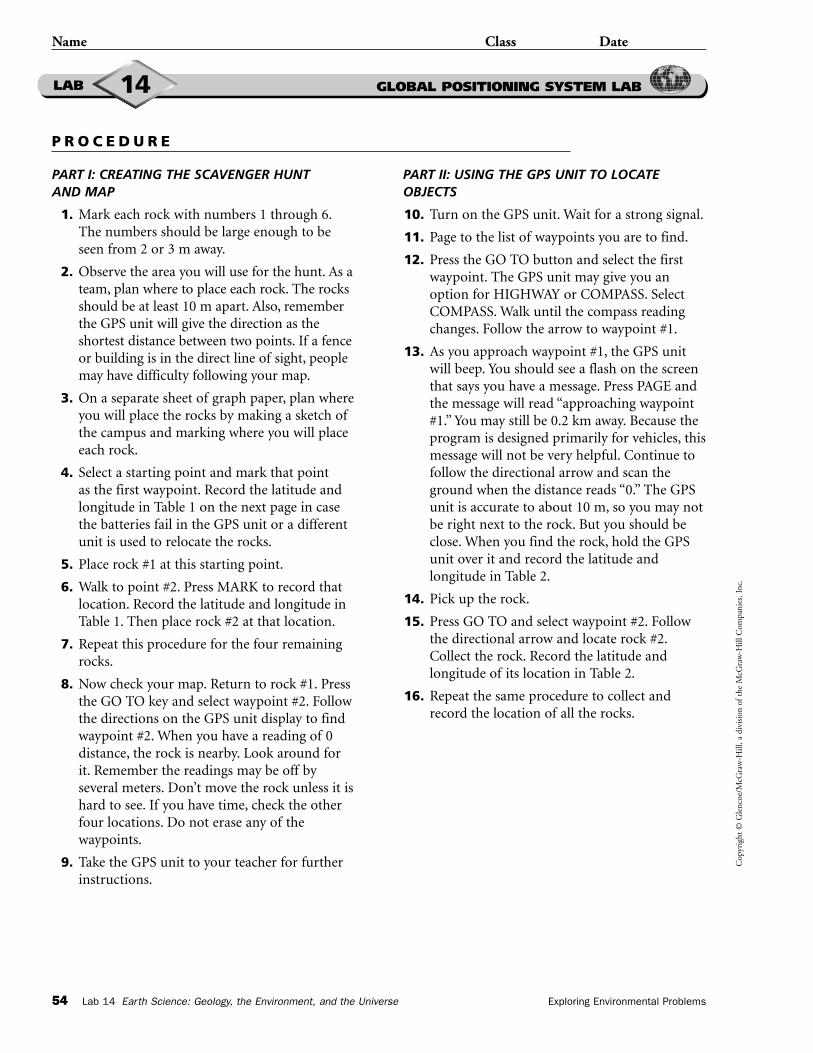
Cop
yrig
ht ©
Gle
ncoe
/McG
raw
-Hill
, a d
ivis
ion
of t
he M
cGra
w-H
ill C
ompa
nies
, Inc
.
Name Class Date
54 Lab 14 Earth Science: Geology, the Environment, and the Universe Exploring Environmental Problems
P R O C E D U R E
PART I: CREATING THE SCAVENGER HUNT AND MAP
1. Mark each rock with numbers 1 through 6.The numbers should be large enough to beseen from 2 or 3 m away.
2. Observe the area you will use for the hunt. As ateam, plan where to place each rock. The rocksshould be at least 10 m apart. Also, rememberthe GPS unit will give the direction as theshortest distance between two points. If a fenceor building is in the direct line of sight, peoplemay have difficulty following your map.
3. On a separate sheet of graph paper, plan whereyou will place the rocks by making a sketch ofthe campus and marking where you will placeeach rock.
4. Select a starting point and mark that pointas the first waypoint. Record the latitude andlongitude in Table 1 on the next page in casethe batteries fail in the GPS unit or a differentunit is used to relocate the rocks.
5. Place rock #1 at this starting point.
6. Walk to point #2. Press MARK to record thatlocation. Record the latitude and longitude inTable 1. Then place rock #2 at that location.
7. Repeat this procedure for the four remainingrocks.
8. Now check your map. Return to rock #1. Pressthe GO TO key and select waypoint #2. Followthe directions on the GPS unit display to findwaypoint #2. When you have a reading of 0distance, the rock is nearby. Look around forit. Remember the readings may be off byseveral meters. Don’t move the rock unless it ishard to see. If you have time, check the otherfour locations. Do not erase any of thewaypoints.
9. Take the GPS unit to your teacher for furtherinstructions.
PART II: USING THE GPS UNIT TO LOCATEOBJECTS
10. Turn on the GPS unit. Wait for a strong signal.
11. Page to the list of waypoints you are to find.
12. Press the GO TO button and select the firstwaypoint. The GPS unit may give you anoption for HIGHWAY or COMPASS. SelectCOMPASS. Walk until the compass readingchanges. Follow the arrow to waypoint #1.
13. As you approach waypoint #1, the GPS unitwill beep. You should see a flash on the screenthat says you have a message. Press PAGE andthe message will read “approaching waypoint#1.” You may still be 0.2 km away. Because theprogram is designed primarily for vehicles, thismessage will not be very helpful. Continue tofollow the directional arrow and scan theground when the distance reads “0.” The GPSunit is accurate to about 10 m, so you may notbe right next to the rock. But you should beclose. When you find the rock, hold the GPSunit over it and record the latitude andlongitude in Table 2.
14. Pick up the rock.
15. Press GO TO and select waypoint #2. Followthe directional arrow and locate rock #2.Collect the rock. Record the latitude andlongitude of its location in Table 2.
16. Repeat the same procedure to collect andrecord the location of all the rocks.
LAB GLOBAL POSITIONING SYSTEM LAB14
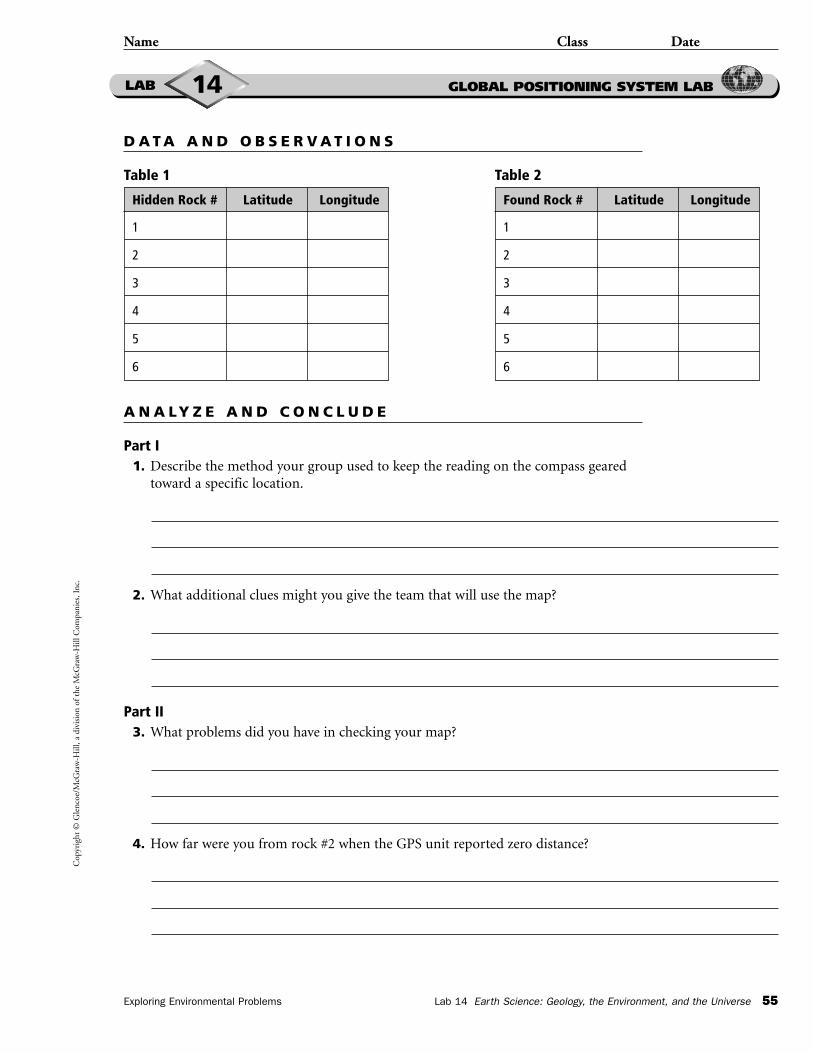
Cop
yrig
ht ©
Gle
ncoe
/McG
raw
-Hill
, a d
ivis
ion
of t
he M
cGra
w-H
ill C
ompa
nies
, Inc
.
Name Class Date
Exploring Environmental Problems Lab 14 Earth Science: Geology, the Environment, and the Universe 55
D A T A A N D O B S E R V A T I O N S
Table 1
A N A LY Z E A N D C O N C L U D E
Part I1. Describe the method your group used to keep the reading on the compass geared
toward a specific location.
2. What additional clues might you give the team that will use the map?
Part II3. What problems did you have in checking your map?
4. How far were you from rock #2 when the GPS unit reported zero distance?
LAB GLOBAL POSITIONING SYSTEM LAB14
Hidden Rock # Latitude Longitude
1
2
3
4
5
6
Found Rock # Latitude Longitude
1
2
3
4
5
6
Table 2

Cop
yrig
ht ©
Gle
ncoe
/McG
raw
-Hill
, a d
ivis
ion
of t
he M
cGra
w-H
ill C
ompa
nies
, Inc
.
Name Class Date
56 Lab 14 Earth Science: Geology, the Environment, and the Universe Exploring Environmental Problems
A P P LY A N D A S S E S S
Part I1. Using the GPS unit, view the map by pressing PAGE repeatedly. How does this map compare
to your planned sketch?
2. How could you make your scavenger hunt easier?
3. Other than making the rocks harder to find, how could you make your hunt more challenging?
Part II4. What could the makers of the map have told you, other than the waypoints, that would have
made this task easier?
5. Describe two ways GPS might be used to locate something.
F U R T H E R I N V E S T I G A T I O N
Using the same waypoints from the scavenger hunt, draw a map of the area to scale that shows where the rocks were hidden.
LAB GLOBAL POSITIONING SYSTEM LAB14
C H E C K Y O U R H Y P O T H E S I S
Did your data support your hypothesis? Why or why not?

Cop
yrig
ht ©
Gle
ncoe
/McG
raw
-Hill
, a d
ivis
ion
of t
he M
cGra
w-H
ill C
ompa
nies
, Inc
.
Exploring Environmental Problems Lab 15 Earth Science: Geology, the Environment, and the Universe 57
Name Class Date
O B J E C T I V E
Demonstrate an understanding oflatitude and longitude when using a GPS unit to find objects.
P R O B L E M
P R E P A R A T I O N
How can you use a GPS receiver tocomplete an advanced scavenger hunt?
LAB GLOBAL POSITIONING SYSTEM LAB15Use with Chapter 2
Section 2.1
GPS Scavenger Hunt for Experts
Here is an opportunity for even more practice with the GPSreceiver. Find out how good you are at using the unit to find
your way from point to point in a really advanced scavengerhunt. When you finish, you should have mastered the skill ofusing maps and finding direction with GPS.
MATERIALS
GPS unitpencilnotebook6 rocks
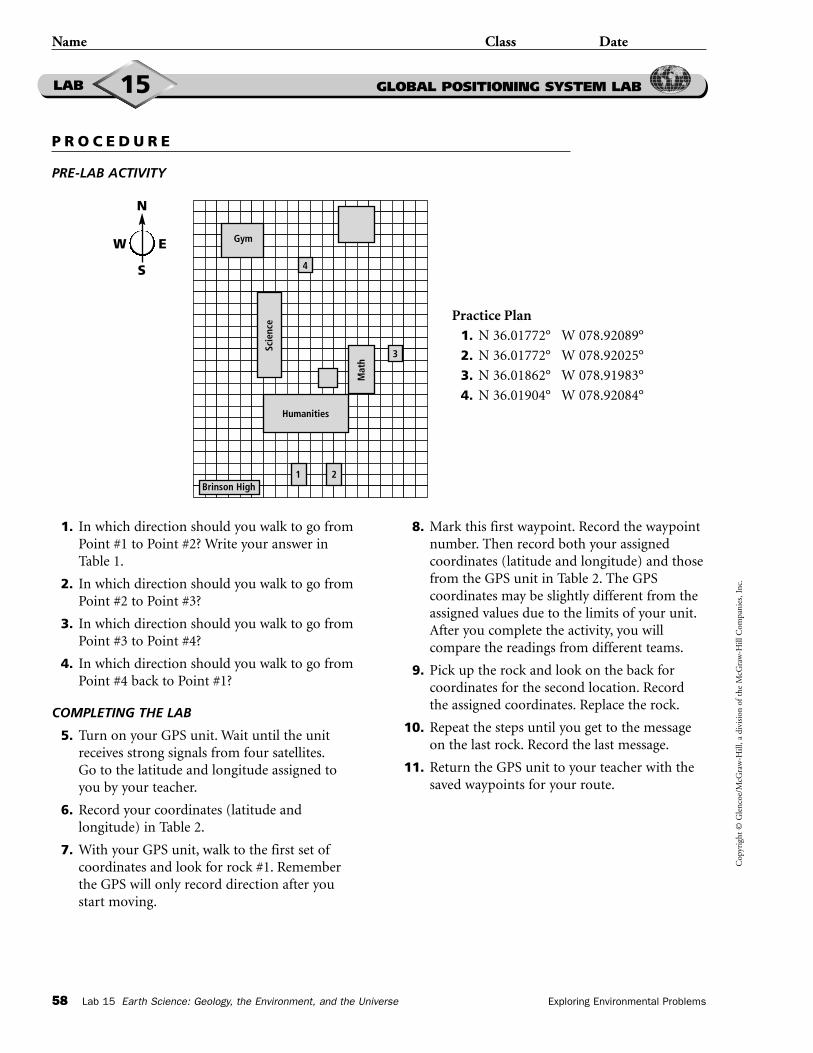
Cop
yrig
ht ©
Gle
ncoe
/McG
raw
-Hill
, a d
ivis
ion
of t
he M
cGra
w-H
ill C
ompa
nies
, Inc
.
Name Class Date
58 Lab 15 Earth Science: Geology, the Environment, and the Universe Exploring Environmental Problems
LAB GLOBAL POSITIONING SYSTEM LAB15
P R O C E D U R E
PRE-LAB ACTIVITY
Practice Plan
1. N 36.01772° W 078.92089°
2. N 36.01772° W 078.92025°
3. N 36.01862° W 078.91983°
4. N 36.01904° W 078.92084°
1. In which direction should you walk to go fromPoint #1 to Point #2? Write your answer inTable 1.
2. In which direction should you walk to go fromPoint #2 to Point #3?
3. In which direction should you walk to go fromPoint #3 to Point #4?
4. In which direction should you walk to go fromPoint #4 back to Point #1?
COMPLETING THE LAB
5. Turn on your GPS unit. Wait until the unitreceives strong signals from four satellites.Go to the latitude and longitude assigned toyou by your teacher.
6. Record your coordinates (latitude andlongitude) in Table 2.
7. With your GPS unit, walk to the first set ofcoordinates and look for rock #1. Rememberthe GPS will only record direction after youstart moving.
8. Mark this first waypoint. Record the waypointnumber. Then record both your assignedcoordinates (latitude and longitude) and thosefrom the GPS unit in Table 2. The GPScoordinates may be slightly different from theassigned values due to the limits of your unit.After you complete the activity, you willcompare the readings from different teams.
9. Pick up the rock and look on the back forcoordinates for the second location. Recordthe assigned coordinates. Replace the rock.
10. Repeat the steps until you get to the messageon the last rock. Record the last message.
11. Return the GPS unit to your teacher with thesaved waypoints for your route.
Brinson High
Gym
4
3
1 2
Humanities
Scie
nce
Mat
h
N
S
EW

Cop
yrig
ht ©
Gle
ncoe
/McG
raw
-Hill
, a d
ivis
ion
of t
he M
cGra
w-H
ill C
ompa
nies
, Inc
.
Name Class Date
Exploring Environmental Problems Lab 15 Earth Science: Geology, the Environment, and the Universe 59
D A T A A N D O B S E R V A T I O N S
1. In the pre-lab, how did you decide the direction in which to walk to get from point #1 to point #2?
2. In the lab, how did you decide the direction in which to walk to get from rock #1 to rock #2?
3. How far off was rock #2 from the assigned latitude and longitude?
LAB GLOBAL POSITIONING SYSTEM LAB15
Table 1
Route Traveled Direction Walked
Point #1 to Point #2
Point #2 to Point #3
Point #3 to Point #4
Point #4 to Point #1
Waypoint Assigned Assigned Actual ActualNumber Latitude Longitude Latitude Longitude
Starting point
Table 2
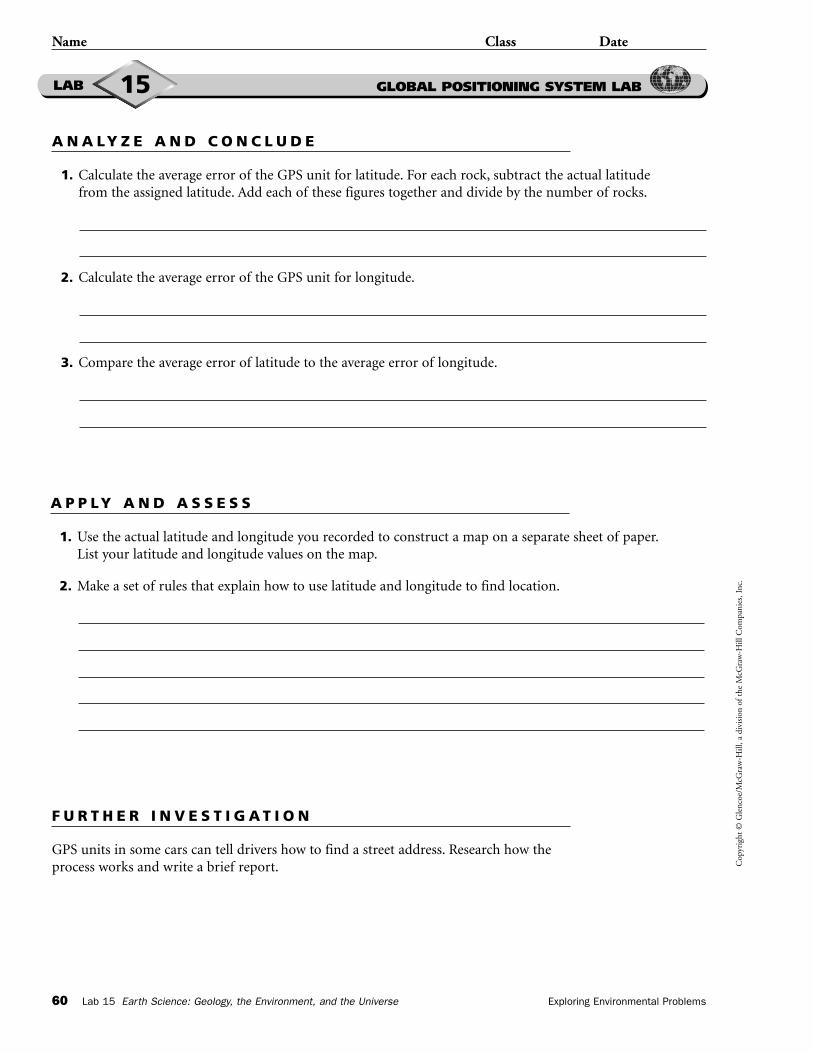
Cop
yrig
ht ©
Gle
ncoe
/McG
raw
-Hill
, a d
ivis
ion
of t
he M
cGra
w-H
ill C
ompa
nies
, Inc
.
Name Class Date
60 Lab 15 Earth Science: Geology, the Environment, and the Universe Exploring Environmental Problems
A P P LY A N D A S S E S S
1. Use the actual latitude and longitude you recorded to construct a map on a separate sheet of paper.List your latitude and longitude values on the map.
2. Make a set of rules that explain how to use latitude and longitude to find location.
F U R T H E R I N V E S T I G A T I O N
GPS units in some cars can tell drivers how to find a street address. Research how theprocess works and write a brief report.
LAB GLOBAL POSITIONING SYSTEM LAB15
A N A LY Z E A N D C O N C L U D E
1. Calculate the average error of the GPS unit for latitude. For each rock, subtract the actual latitude from the assigned latitude. Add each of these figures together and divide by the number of rocks.
2. Calculate the average error of the GPS unit for longitude.
3. Compare the average error of latitude to the average error of longitude.

Cop
yrig
ht ©
Gle
ncoe
/McG
raw
-Hill
, a d
ivis
ion
of t
he M
cGra
w-H
ill C
ompa
nies
, Inc
.
Exploring Environmental Problems Lab 16 Earth Science: Geology, the Environment, and the Universe 61
Name Class Date
O B J E C T I V E S
• Hypothesize how land use around awetland watershed affects the amountof nitrogen, phosphorus, and sedi-ment in the water.
• Measure latitude and longitude oflocations using a GPS unit.
• Make a map using GPS latitude,longitude, and distance between waypoints.
P R O B L E M
How do adjacent land uses affect the water quality of a wetland watershed?
H Y P O T H E S I S
Hypothesize how different land uses around a wetland watershed affect its water quality.
LAB GLOBAL POSITIONING SYSTEM LAB16Use with Chapter 2
Section 2.3
Awatershed is the area around a wetland that contributes surface runoff to the wetland. Thetype of runoff that enters a wetland depends on the land uses in its watershed. Rainwater
washing over farmland or golf courses may produce polluted runoff that includes fertilizers andpesticides. There is a good chance that urban runoff contains pollutants such as grease, oil, streetwaste, and toxic chemicals used in vehicles and households.
Wetlands are among the most productive of ecosystems. The types of substances that enterwetland watersheds in runoff affect the health of these ecosystems. In this lab, you will determinethe water quality in a wetland watershed by analyzing the types of runoff that enter it. You willwork in groups to assess sources of pollution and water quality in part of a wetland watershed.
How does runoff in a watershedaffect the water quality of awetland?
P R E P A R A T I O N
MATERIALS
GPS unitpencil
notebookcalculatorinternet access

Cop
yrig
ht ©
Gle
ncoe
/McG
raw
-Hill
, a d
ivis
ion
of t
he M
cGra
w-H
ill C
ompa
nies
, Inc
.
Name Class Date
62 Lab 16 Earth Science: Geology, the Environment, and the Universe Exploring Environmental Problems
P R O C E D U R E
PART I: IDENTIFYING THE WATERSHED
• Choose a specific part of a watershed for study.
• Find an aerial photo and a topographic map ofthe watershed. Visit sites listed on the GlencoeScience Web Site for more information on aerialphotos or topographic maps. Select SEARCH.Enter your latitude and longitude and press GOfor a map of your area. On the menu bar at theleft, select TOPOGRAPHIC, AERIAL, andSATELLITE to see all three views.
PART II: FINDING THE AREA AROUND THEWATERSHED THAT CONTRIBUTES RUNOFF
1. Make a draft land use map for your study area,similar to the sketch below.
Map
2. Find the area of each type of land thatcontributes runoff to the body of water in thewatershed. To do this, you must measure theboundaries of each land-use area. You willneed to walk these boundaries, so make sureyou have permission to enter private property.Record the latitude and longitude of eachland-use type at the intersections, not along itsboundary lines. Press MARK to record thesespots as waypoints. Record each land-use typeand waypoint number in your notebook.
3. Determine the area of each land-use type.Some GPS units have a feature that willcalculate the area for you. If your unit doesthis, follow the instructions in the manual.Then go to Part III. If your unit does not calculate area, continue with step 4.
4. In your notebook, list each waypoint in yourstudy area, with its latitude and longitude.
5. Visit a site listed on the Glencoe Science WebSite for a calculator to determine distancesbetween waypoints. This calculator will use the latitude and longitude figures you enter for each waypoint to determine the distancesbetween them. Record the distance betweenwaypoints on your map. You may also use thefollowing formula to determine the distancebetween the waypoints on your map:
The great circle distance, d, between twopoints with coordinates {lat1, lon1} and {lat2, lon2} is given by:
d � acos(sin(lat1) � sin(lat2) � cos(lat2) �cos(lat2) � cos(lon1 � lon2)
A mathematically equivalent formula, which isless subject to rounding error for shortdistance is:
d � 2 � asin(sqrt((lat1 � lat2)/2))2 �cos(lat1) � cos(lat2) � (sin((lon1 �lon2)/2))2))
6. Use the length of each boundary line (distancebetween waypoints) to calculate the area ofeach land-use type. Record your results in your notebook. Ask your teacher for help ifnecessary.
PART III: CALCULATING THE NUTRIENT LOSSINDEX FOR THE WATERSHED
7. Use Table 1 to calculate the Nitrogen LossIndex for the watershed. This index indicateshow much nitrogen enters the water throughrunoff. Fill in the third and fourth columns.
8. Use Table 2 to calculate the Phosphorus LossIndex for the watershed. This index indicateshow much phosphorus enters the water throughrunoff. Fill in the third and fourth columns.
9. Calculate the Sediment Risk Index for thewatershed. This index indicates how muchsediment is lost through runoff. Use theformula Sediment Risk � F � G where
F � area of all agricultural land �total area of land � 100% and
G � area of all agricultural land adjacent towatershed � total area of land � 100%.
LAB GLOBAL POSITIONING SYSTEM LAB16
1
1 1
1
8
9
6
J
N
LM
Mostly naturalNatural vegetation
UrbanMostly agricultural
Agricultural
7
1
I
1
43
H
2 5
K
11
11

Cop
yrig
ht ©
Gle
ncoe
/McG
raw
-Hill
, a d
ivis
ion
of t
he M
cGra
w-H
ill C
ompa
nies
, Inc
.
Name Class Date
Exploring Environmental Problems Lab 16 Earth Science: Geology, the Environment, and the Universe 63
D A T A A N D O B S E R V A T I O N S
1. What is the predominant type of land use in your watershed?
2. What land-use type has the highest nitrogen and phosphorus loss?
3. Explain how you determined the area for each land-use type.
4. What was the Nitrogen Loss Index for the watershed?
5. What was the Phosphorus Loss Index?
6. What was the Sediment Risk Index?
LAB GLOBAL POSITIONING SYSTEM LAB16
Table 1
Nitrogen Loss Rate (A) Area (B) Nitrogen Loss (C) km2 � 1 000 000 m2
Land Type (in kg/ha/yr) (in ha) C = A � B (in kg/yr) C � 100 � kg/ha/yr
Natural vegetation 0.44
Mostly natural 0.45
Agricultural 0.98
Mostly agricultural 0.63
Mostly urban 0.79
Mixed 0.55
Total —
Table 2
Nitrogen Loss Index � CTotal / (Btotal � 0.44)
Phosphorus Loss Rate (D) Area (B) Phosphorus Loss (E) km2 � 1 000 000 m2
Land Type (in kg/ha/yr) (in ha) E = D � B (in kg/yr) E � 100 � kg/ha/yr
Natural vegetation 0.0085
Mostly natural 0.018
Agricultural 0.031
Mostly agricultural 0.028
Mostly urban 0.030
Mixed 0.019
Total —Phosphorus Loss Index � ETotal / (Btotal � 0.0085)
(March 1998)Natural vegetation > 75% forest and/or grasslandMostly natural 50–75% forest and/or grasslandAgricultural > 75% agriculture
Mostly agricultural 50–75% agricultureMostly urban > 40% developedMixed—does not fall into one of the above categories

F U R T H E R I N V E S T I G A T I O N
Research the land-use changes in the watershed area you studied over a period ofseveral years. Research water-quality monitoring data for this body of water over thesame period. Consult the Environmental Protection Agency or Natural ResourcesConservation Service for information. Write a report that suggests how changes inland use affected water quality.
Cop
yrig
ht ©
Gle
ncoe
/McG
raw
-Hill
, a d
ivis
ion
of t
he M
cGra
w-H
ill C
ompa
nies
, Inc
.
Name Class Date
64 Lab 16 Earth Science: Geology, the Environment, and the Universe Exploring Environmental Problems
C H E C K Y O U R H Y P O T H E S I S
Did your data support your hypothesis? Explain your answer.
LAB GLOBAL POSITIONING SYSTEM LAB16
A P P LY A N D A S S E S S
You can predict the amount of annual nitrogen or phosphorus loss by converting your area to hectares (ha).One ha equals 10 000 m2. You can multiply the loss factor for nitrogen or phosphorus by the number ofhectares to estimate the annual loss in kilograms.
For example, if your watershed has 870 000 m2 of natural vegetation, then870 000 m2 � 10 000 m2/ha � 87 ha; 87 ha � 0.44 kg/ha/yr � 38 kg/yr nitrogen lost.
1. Predict the amount of nitrogen lost annually for each land-use type. Then calculate the total loss for your area of study. Record your calculations in the fifth column on Table 1.
2. Predict the amount of phosphorus lost annually for each land-use type. Then calculate the total loss for your area of study. Record your calculations in the fifth column on Table 2.
3. An increase in nitrogen and phosphorus in waterways can cause plants in the water to grow too quickly and extensively. Explain why this would be a problem.
A N A LY Z E A N D C O N C L U D E
1. What can you conclude from your data?
2. Infer why agricultural land is the only factor used in the Sediment Risk Index.