Embed Size (px)
Citation preview
Exploratory data analysis:clustering
Benedikt BrorsDept. Intelligent Bioinformatics Systems
German Cancer Research Center
Acknowledgment
This talk is based on material obtainedcourtesy of Anja v. Heydebreck, MPI-MG.
Exploratory data analysis/unsupervised learning
• “Look at the data”; identify structures in the data and visualizethem.
• Can we see biological/experimental parameters; are thereoutliers?
• Find groups of genes and/or samples sharing similarity.
• Unsupervised learning: The analysis makes no use ofgene/sample annotations.
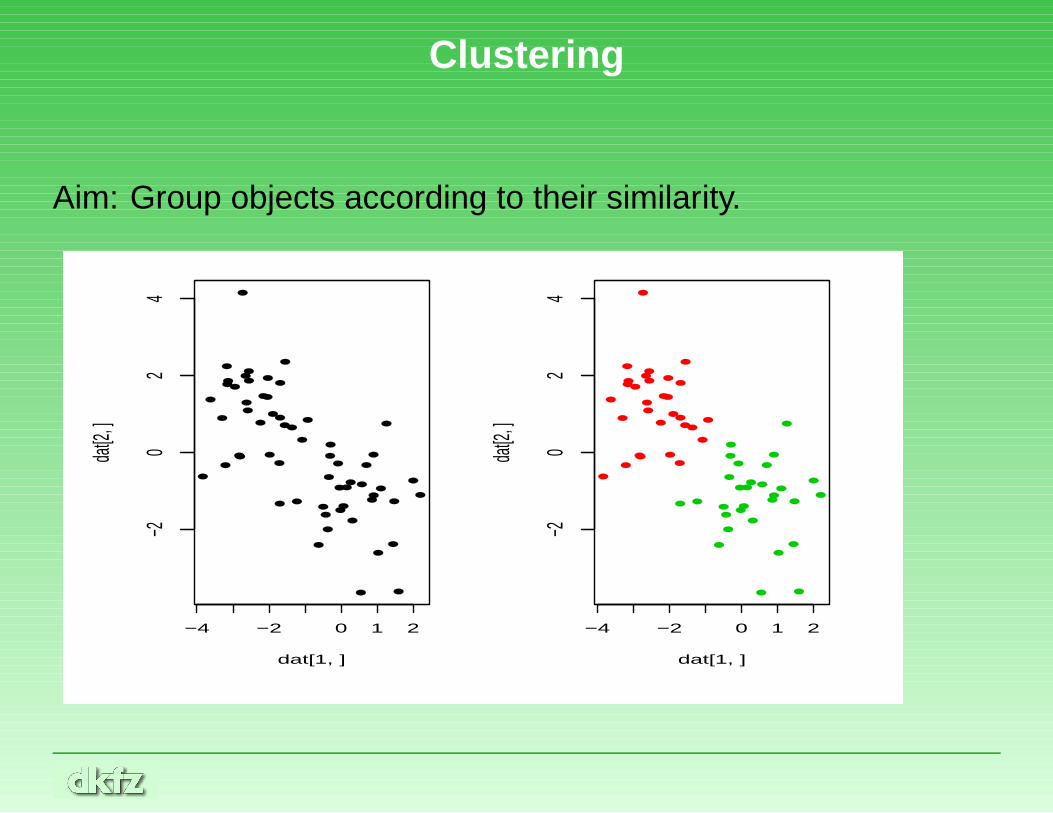
Clustering
Aim: Group objects according to their similarity.
�
�
�
�
�
�
�
��
�
�
� �
�
��
�
�
�
�
�
�
� �
�
�
�
�
�
�
� �
�
�
�
�
�
�
�
�
�
�
�
�
�
�
�
�
�
�
�
�
���
�
�
�
�
�
−4 −2 0 1 2
−20
24
dat[1, ]
dat[2
, ]
�
�
�
�
�
�
�
��
�
�
� �
�
��
�
�
�
�
�
�
� �
�
�
�
�
�
�
� �
�
�
�
�
�
�
�
�
�
�
�
�
�
�
�
�
�
�
�
�
���
�
�
�
�
�
−4 −2 0 1 2
−20
24
dat[1, ]
dat[2
, ]
Clustering gene expression data
• Clustering can be applied to rows (genes) and/or columns(samples/arrays) of an expression data matrix.
• Clustering may allow for reordering of the rows/columns of anexpression data matrix which is appropriate for visualization (heatmap).
Clustering genes
Aims:
• identify groups of co-regulated genes
• identify typical spatial or temporal expression patterns (e.g. yeastcell cycle data)
• arrange a set of genes in a linear order which is at least not totallymeaningless
Clustering samples
Aims:
• detect experimental artifacts/bad hybridizations (quality control)
• check whether samples are grouped according to knowncategories (meaning that these are clearly visible in terms of geneexpression)
• identify new classes of biological samples (e.g. tumor subtypes)
Clustering: Distance measures
• Aim: Group objects according to their similarity.
• Clustering requires a definition of distance between the objects,quantifying a notion of (dis)similarity. After this has been specified,a clustering algorithm may be applied.
• The result of a cluster analysis may strongly depend on thechosen distance measure.
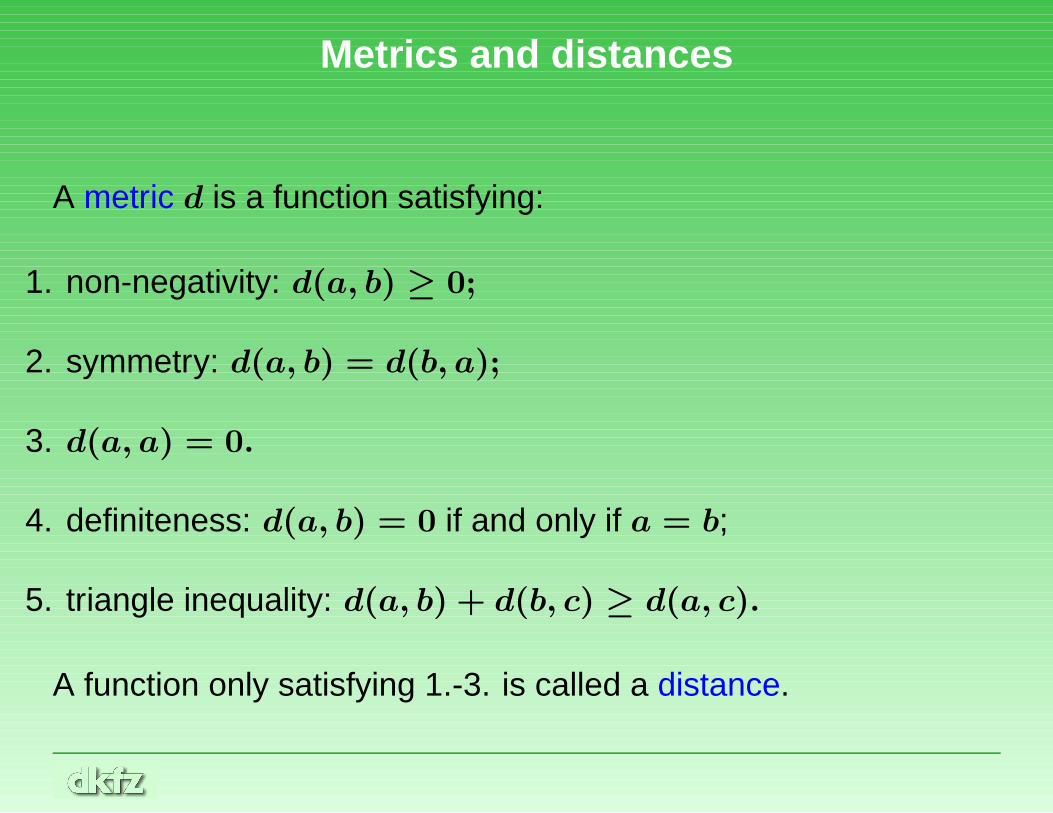
Metrics and distances
A metric d is a function satisfying:
1. non-negativity: d(a, b) ≥ 0;
2. symmetry: d(a, b) = d(b, a);
3. d(a, a) = 0.
4. definiteness: d(a, b) = 0 if and only if a = b;
5. triangle inequality: d(a, b) + d(b, c) ≥ d(a, c).
A function only satisfying 1.-3. is called a distance.
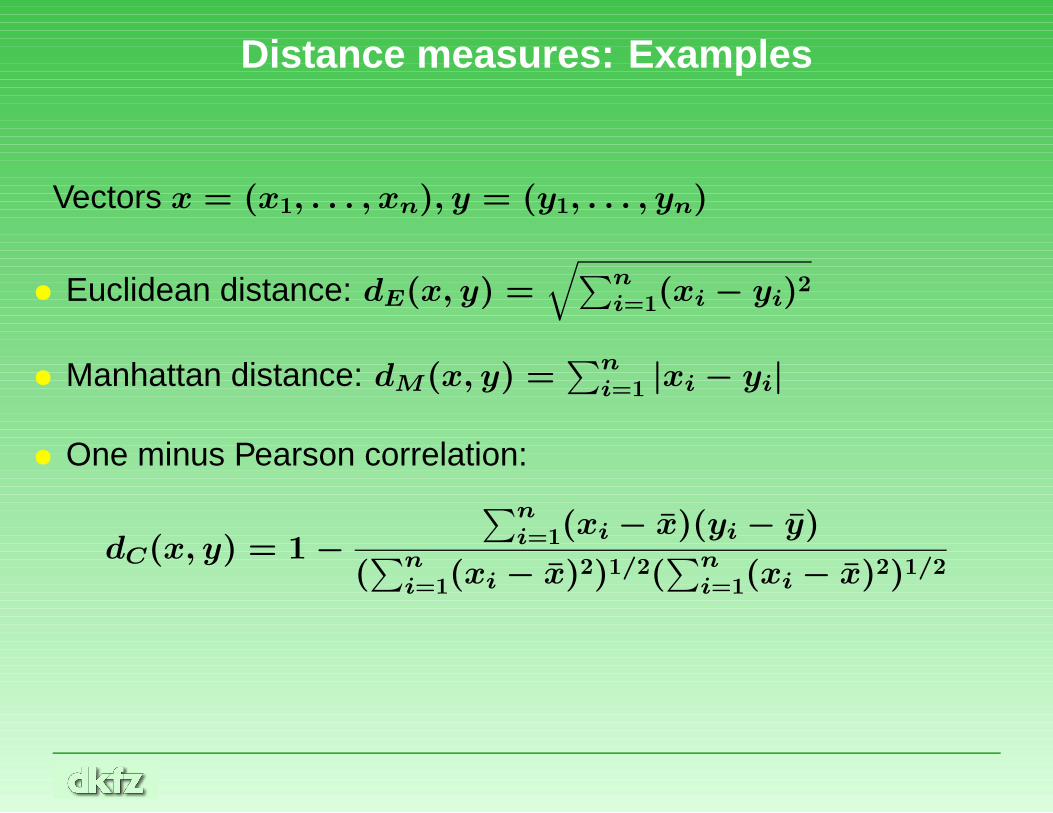
Distance measures: Examples
Vectors x = (x1, . . . , xn), y = (y1, . . . , yn)
• Euclidean distance: dE(x, y) =√∑n
i=1(xi − yi)2
• Manhattan distance: dM(x, y) =∑ni=1 |xi − yi|
• One minus Pearson correlation:
dC(x, y) = 1−∑ni=1(xi − x)(yi − y)
(∑ni=1(xi − x)2)1/2(
∑ni=1(xi − x)2)1/2
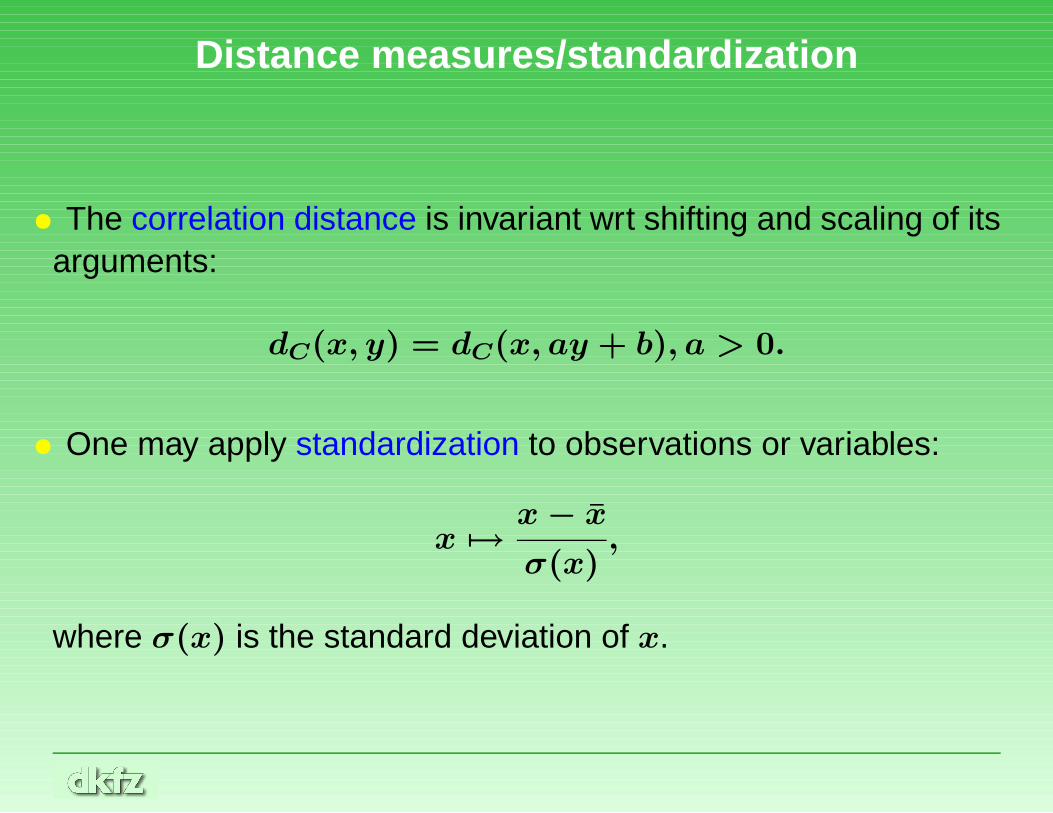
Distance measures/standardization
• The correlation distance is invariant wrt shifting and scaling of itsarguments:
dC(x, y) = dC(x, ay + b), a > 0.
• One may apply standardization to observations or variables:
x 7→x− xσ(x)
,
where σ(x) is the standard deviation of x.
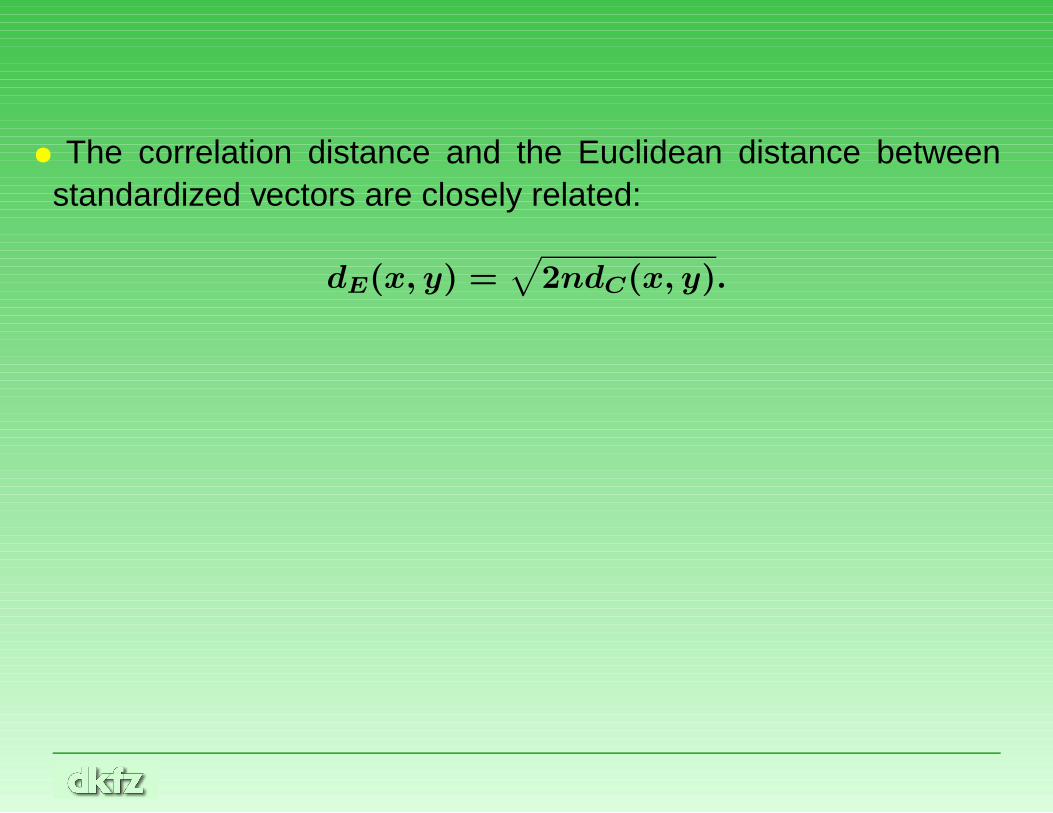
• The correlation distance and the Euclidean distance betweenstandardized vectors are closely related:
dE(x, y) =√
2ndC(x, y).
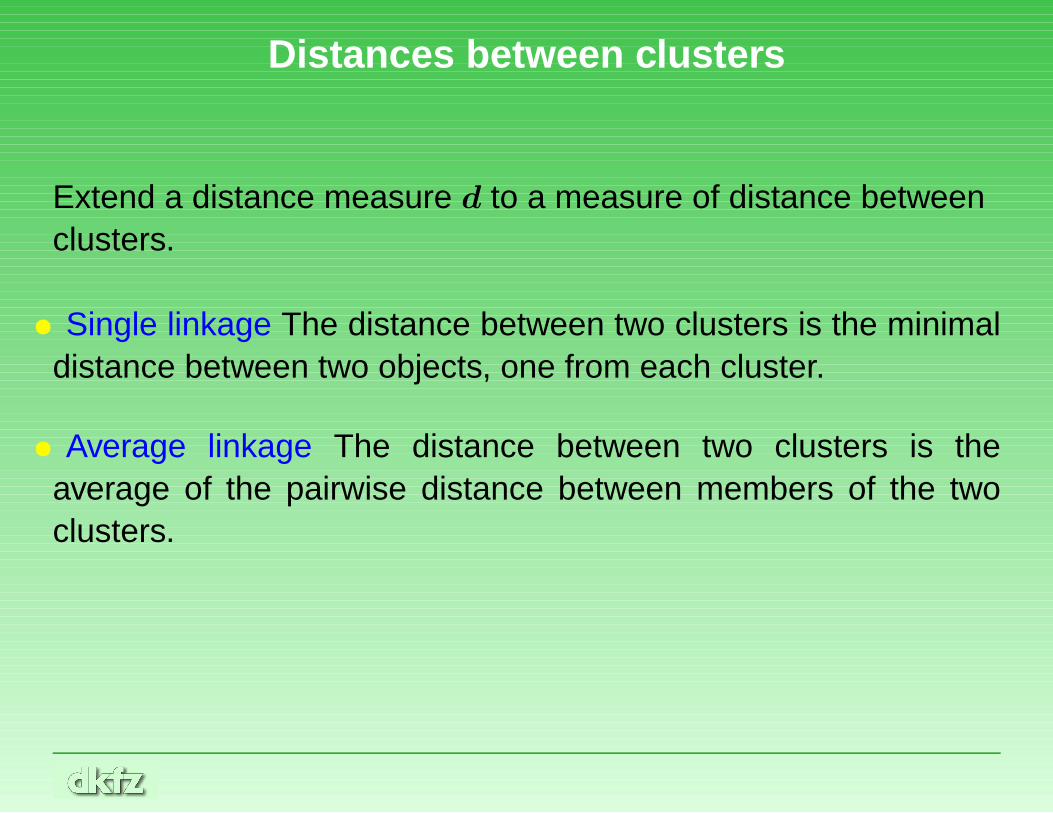
Distances between clusters
Extend a distance measure d to a measure of distance betweenclusters.
• Single linkage The distance between two clusters is the minimaldistance between two objects, one from each cluster.
• Average linkage The distance between two clusters is theaverage of the pairwise distance between members of the twoclusters.
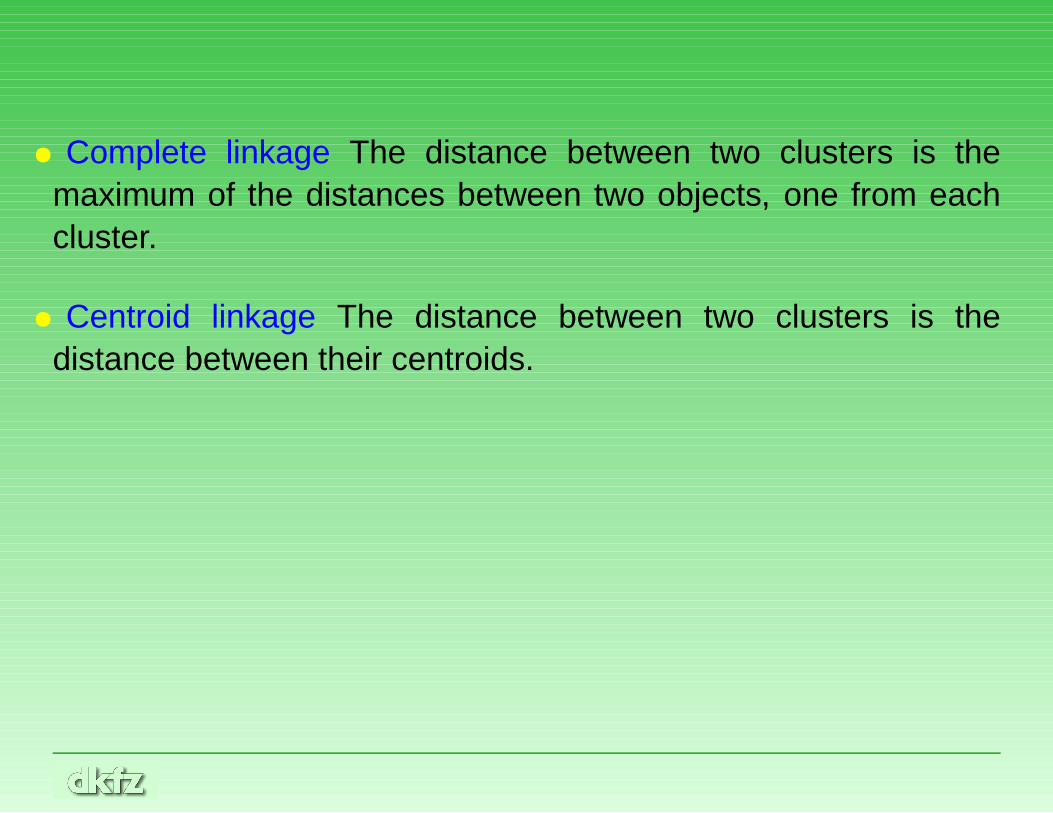
• Complete linkage The distance between two clusters is themaximum of the distances between two objects, one from eachcluster.
• Centroid linkage The distance between two clusters is thedistance between their centroids.
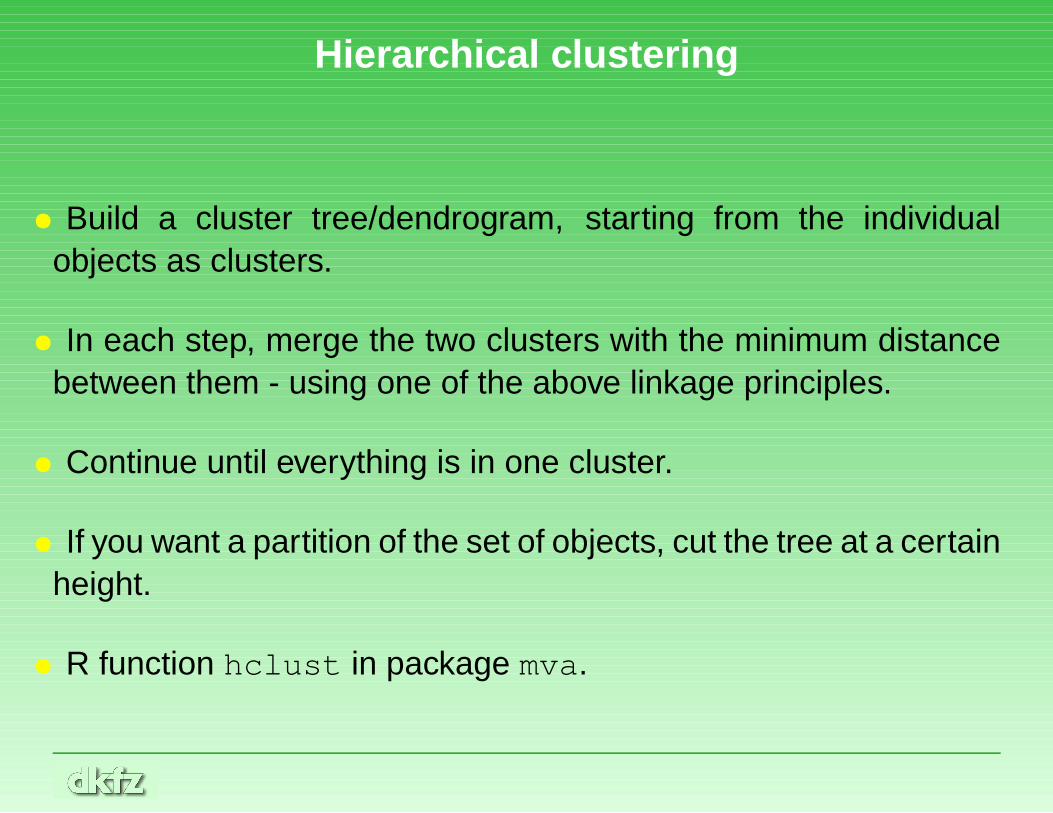
Hierarchical clustering
• Build a cluster tree/dendrogram, starting from the individualobjects as clusters.
• In each step, merge the two clusters with the minimum distancebetween them - using one of the above linkage principles.
• Continue until everything is in one cluster.
• If you want a partition of the set of objects, cut the tree at a certainheight.
• R function hclust in package mva.
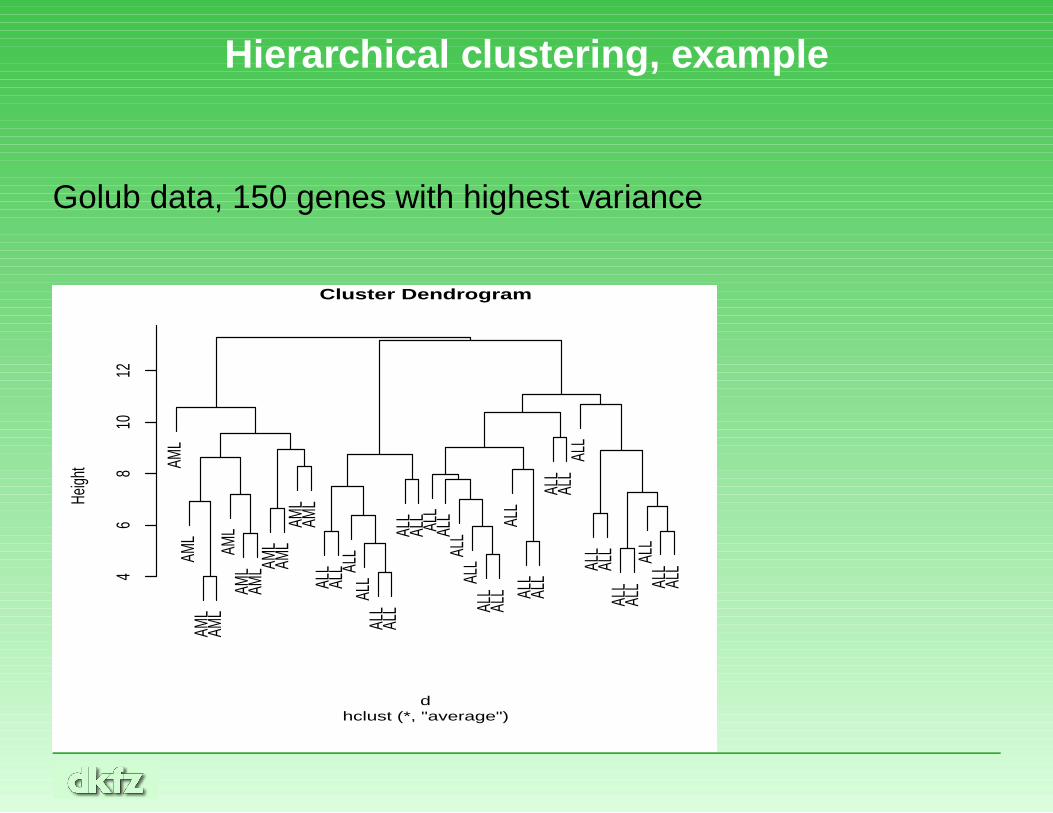
Hierarchical clustering, example
Golub data, 150 genes with highest varianceAM
LAM
LAM
LAM
LAM
LAM
LAM
L AML
AML
AML
AML
ALL
ALL AL
LAL
LAL
LAL
LAL
LAL
L ALL
ALL
ALL
ALL
ALL
ALL
ALL
ALL
ALL
ALL
ALL
ALL
ALL
ALL
ALL
ALL
ALL
ALL
ALL4
68
1012
Cluster Dendrogram
hclust (*, "average")d
Heigh
t
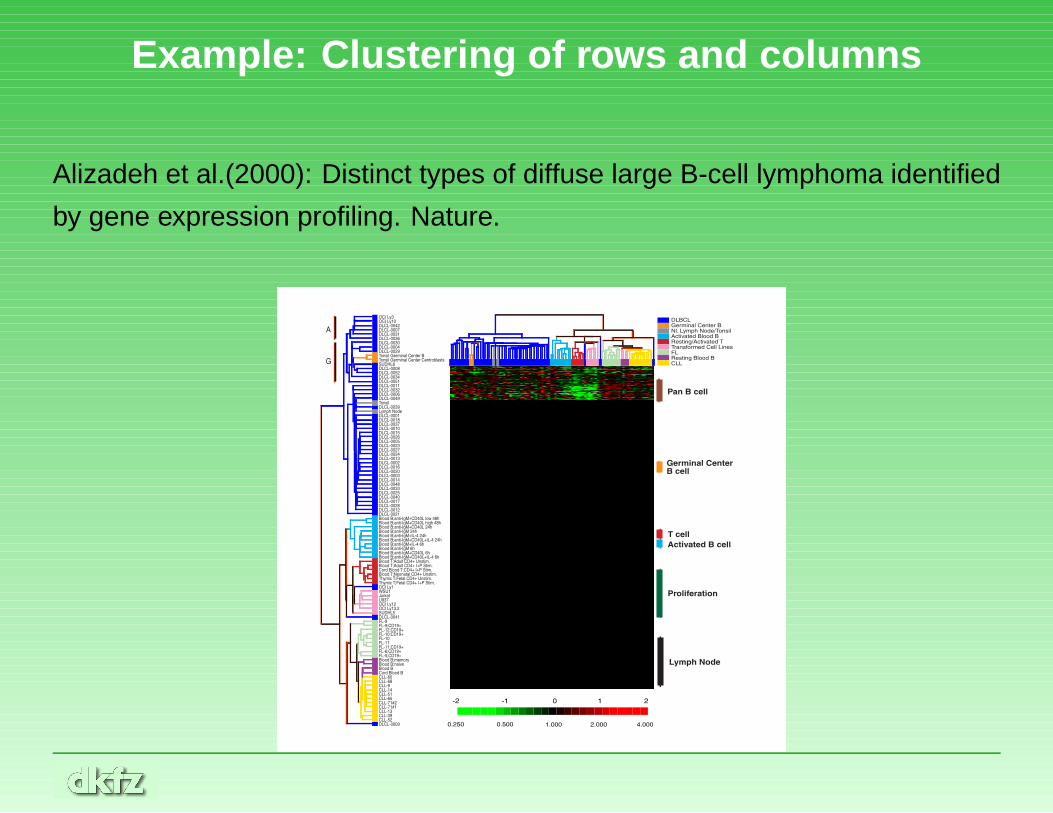
Example: Clustering of rows and columns
Alizadeh et al.(2000): Distinct types of diffuse large B-cell lymphoma identified
by gene expression profiling. Nature.
OCI Ly3OCI Ly10DLCL-0042DLCL-0007DLCL-0031DLCL-0036DLCL-0030DLCL-0004DLCL-0029Tonsil Germinal Center BTonsil Germinal Center CentroblastsSUDHL6DLCL-0008DLCL-0052DLCL-0034DLCL-0051DLCL-0011DLCL-0032DLCL-0006DLCL-0049TonsilDLCL-0039Lymph NodeDLCL-0001DLCL-0018DLCL-0037DLCL-0010DLCL-0015DLCL-0026DLCL-0005DLCL-0023DLCL-0027DLCL-0024DLCL-0013DLCL-0002DLCL-0016DLCL-0020DLCL-0003DLCL-0014DLCL-0048DLCL-0033DLCL-0025DLCL-0040DLCL-0017DLCL-0028DLCL-0012DLCL-0021Blood B;anti-IgM+CD40L low 48hBlood B;anti-IgM+CD40L high 48hBlood B;anti-IgM+CD40L 24hBlood B;anti-IgM 24hBlood B;anti-IgM+IL-4 24hBlood B;anti-IgM+CD40L+IL-4 24hBlood B;anti-IgM+IL-4 6hBlood B;anti-IgM 6hBlood B;anti-IgM+CD40L 6hBlood B;anti-IgM+CD40L+IL-4 6hBlood T;Adult CD4+ Unstim.Blood T;Adult CD4+ I+P Stim.Cord Blood T;CD4+ I+P Stim.Blood T;Neonatal CD4+ Unstim.Thymic T;Fetal CD4+ Unstim.Thymic T;Fetal CD4+ I+P Stim.OCI Ly1WSU1JurkatU937OCI Ly12OCI Ly13.2SUDHL5DLCL-0041FL-9FL-9;CD19+FL-12;CD19+FL-10;CD19+FL-10FL-11FL-11;CD19+FL-6;CD19+FL-5;CD19+Blood B;memoryBlood B;naiveBlood BCord Blood BCLL-60CLL-68CLL-9CLL-14CLL-51CLL-65CLL-71#2CLL-71#1CLL-13CLL-39CLL-52DLCL-0009
2 1 0-1-2
4.0002.0001.0000.5000.250
DLBCLGerminal Center BNl. Lymph Node/TonsilActivated Blood BResting/Activated TTransformed Cell LinesFLResting Blood BCLL
Germinal CenterB cell
Lymph Node
T cell
Pan B cell
Activated B cell
Proliferation
A
G
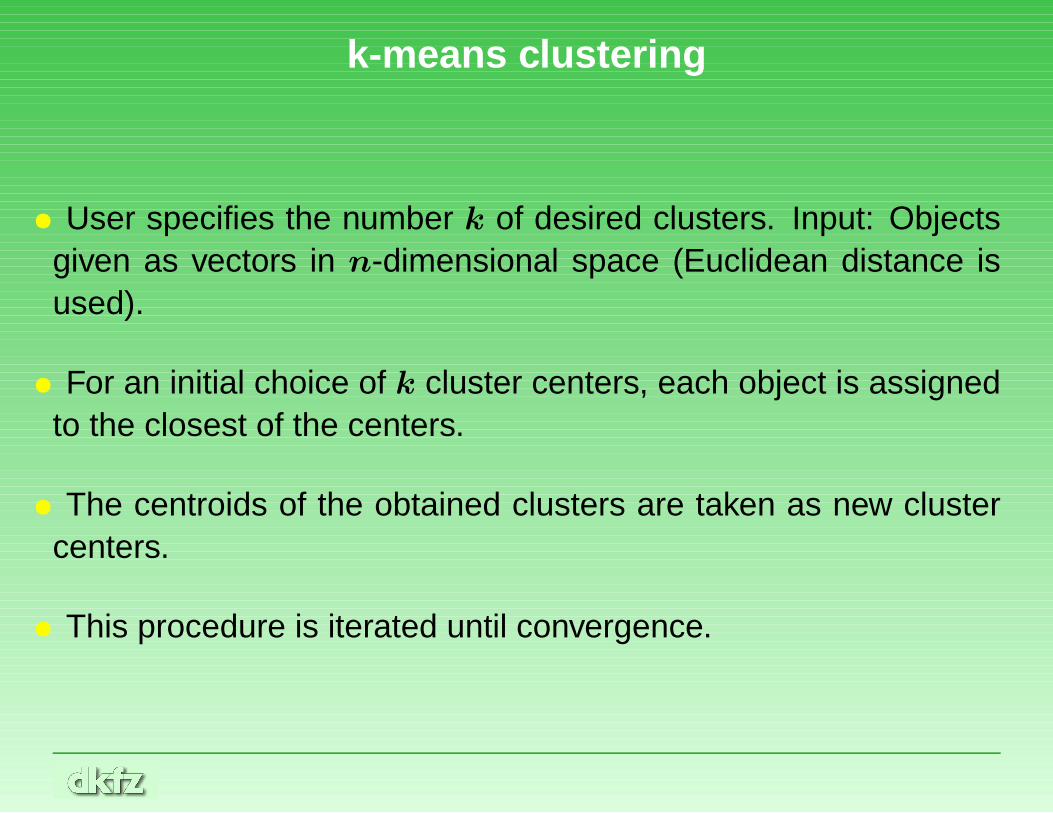
k-means clustering
• User specifies the number k of desired clusters. Input: Objectsgiven as vectors in n-dimensional space (Euclidean distance isused).
• For an initial choice of k cluster centers, each object is assignedto the closest of the centers.
• The centroids of the obtained clusters are taken as new clustercenters.
• This procedure is iterated until convergence.
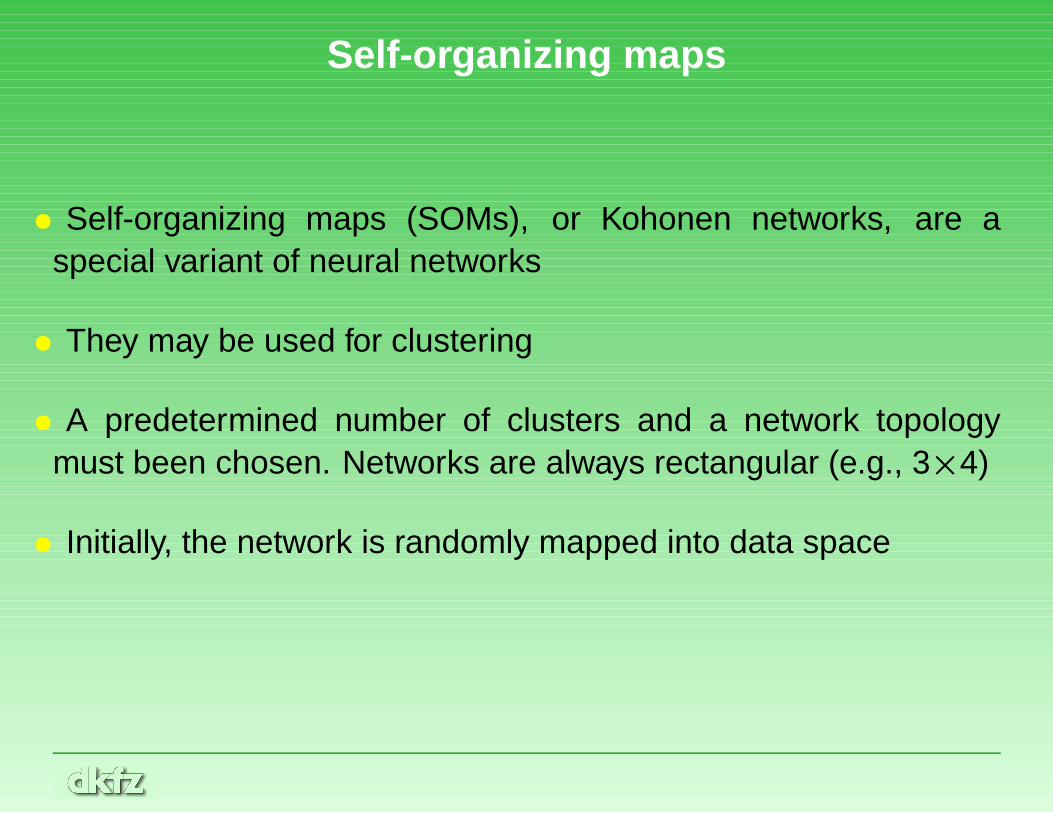
Self-organizing maps
• Self-organizing maps (SOMs), or Kohonen networks, are aspecial variant of neural networks
• They may be used for clustering
• A predetermined number of clusters and a network topologymust been chosen. Networks are always rectangular (e.g., 3×4)
• Initially, the network is randomly mapped into data space
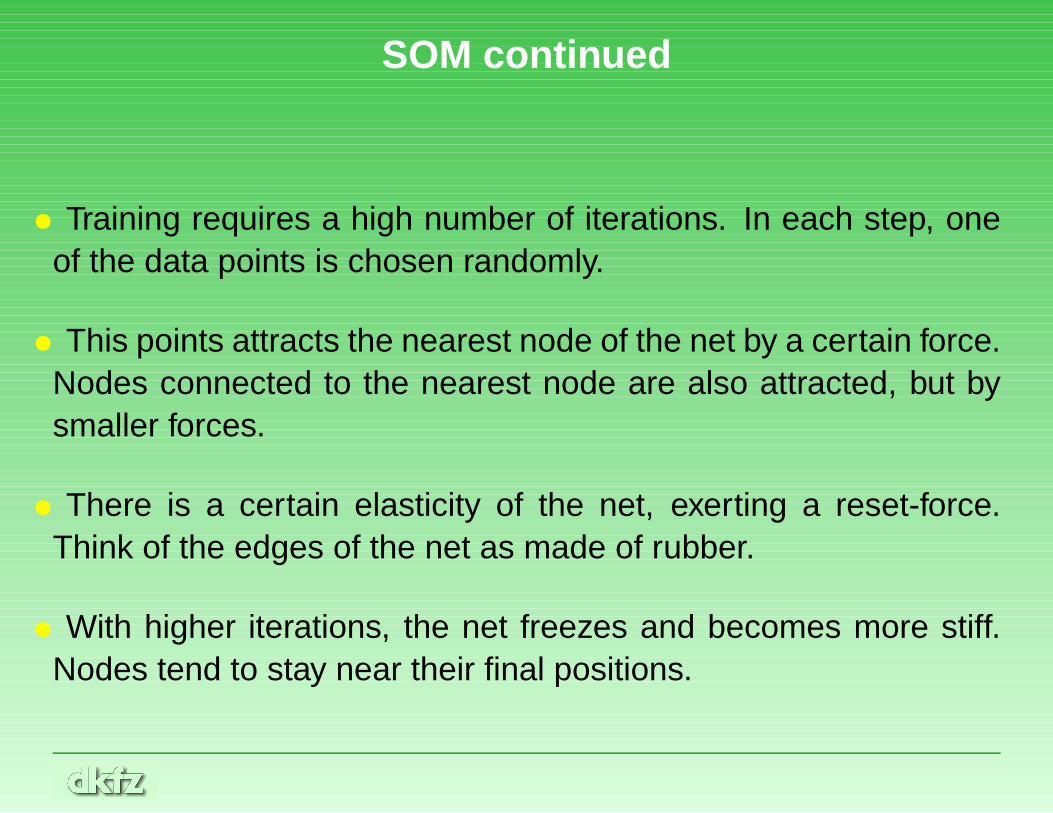
SOM continued
• Training requires a high number of iterations. In each step, oneof the data points is chosen randomly.
• This points attracts the nearest node of the net by a certain force.Nodes connected to the nearest node are also attracted, but bysmaller forces.
• There is a certain elasticity of the net, exerting a reset-force.Think of the edges of the net as made of rubber.
• With higher iterations, the net freezes and becomes more stiff.Nodes tend to stay near their final positions.
SOM continued
• In the end, the nodes should ideally mark cluster centers. Datapoints may be assigned to clusters by a number of methods, e.g.Voronoi tesselation, fixed-radius hyperspheres, or non-exclusivemethods (which allow points to be in different clusters).
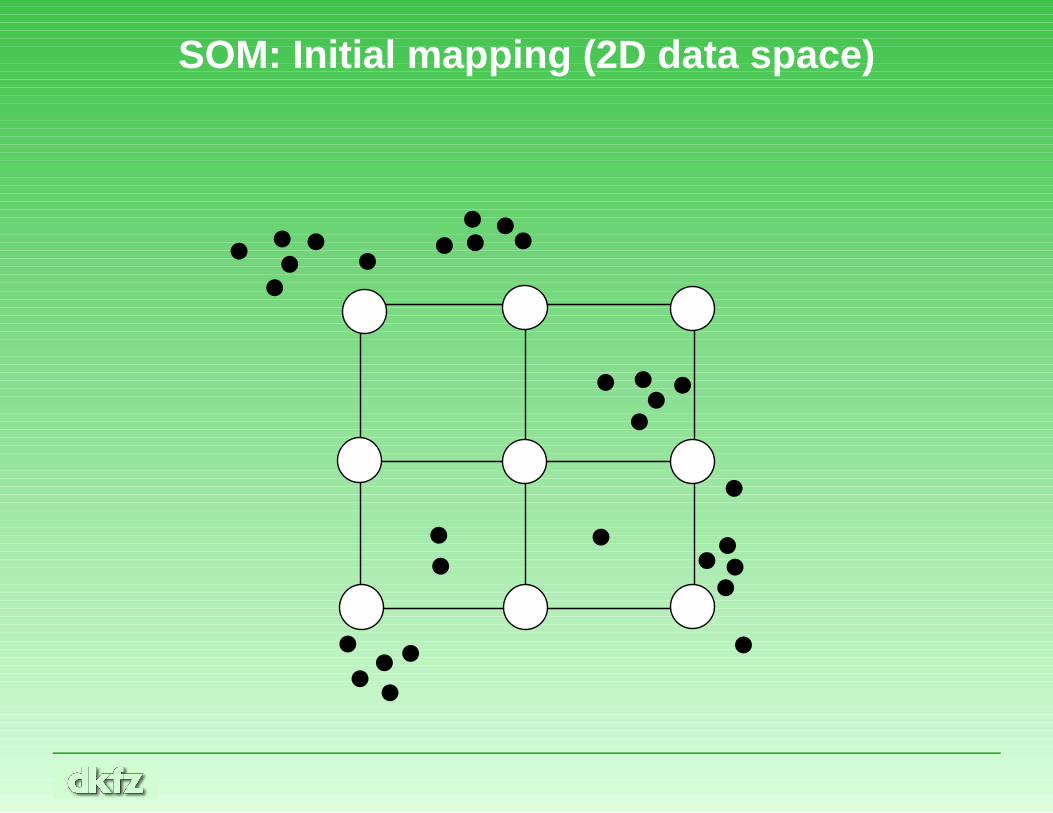
SOM: Initial mapping (2D data space)
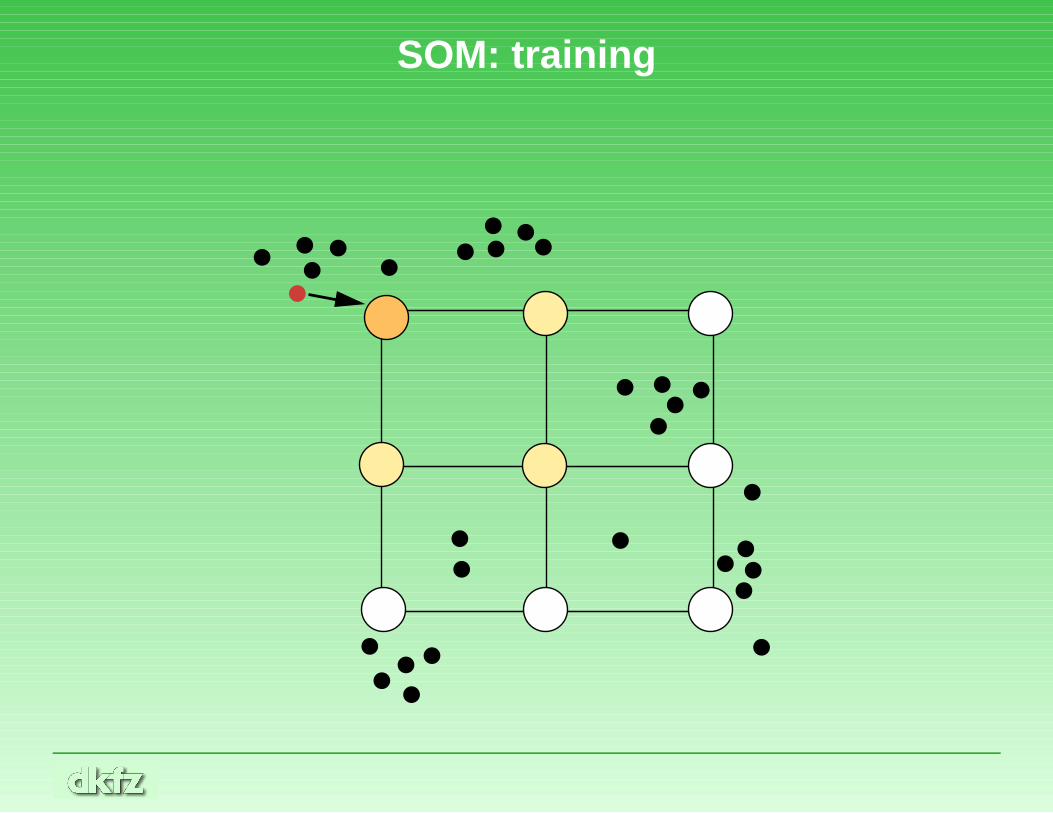
SOM: training
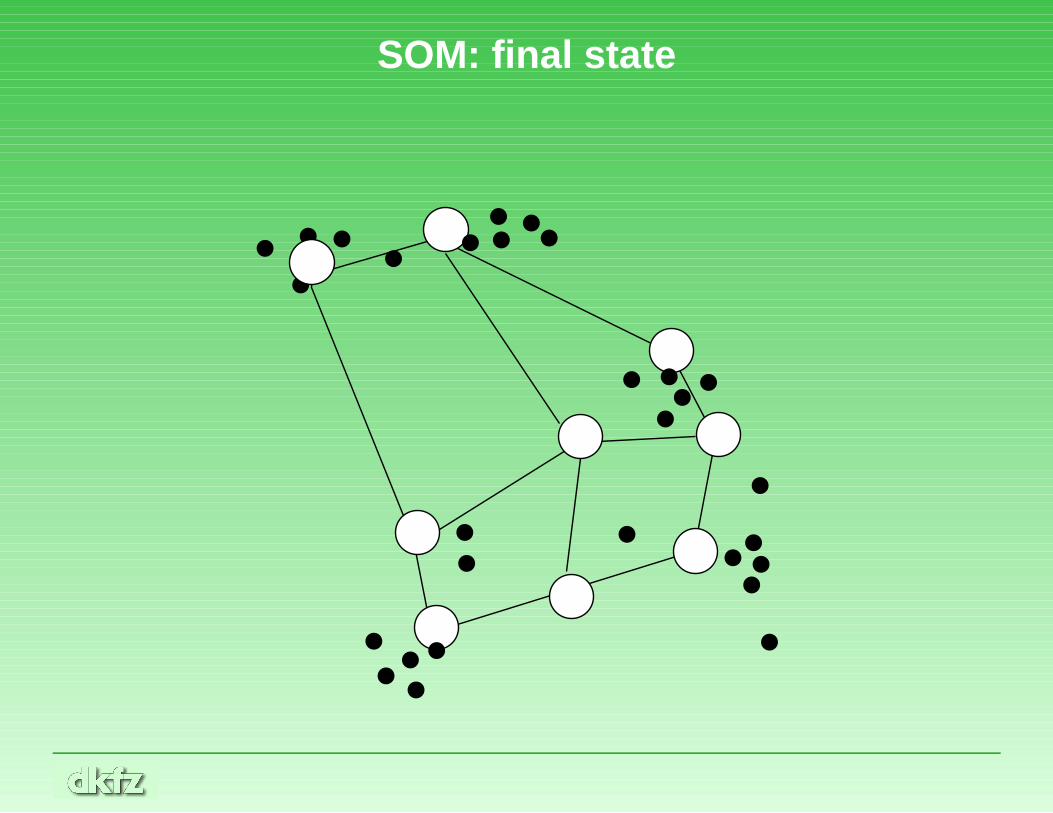
SOM: final state
fuzzy clustering
• The concept of fuzzy clustering abandons the idea of fixed clustermembership. Instead, there is a certain probability for any objectto belong to one of the clusters.
• This allows to judge how reliable an assignment to a cluster is.
• There are certain variants of fuzzy clustering, mainly build on k-means or c-means (fuzzy c-means, Gath-Geva-Algorithm). Someof them are available from R packages e1071 and cluster(routine fanny ).
• Fuzzy c-means or k-means assumes spherical clusters of samesize, while more advanced algorithms allow for ellipsoidal clustersof differing sizes.
How many clusters?
• Many methods require the user to specify the number of clusters.Generally it is not clear which number is appropriate for the dataat hand.
• Several authors have proposed criteria for determining thenumber of clusters, see Dudoit and Fridlyand 2002.
• Sometimes there may not be a clear answer to this question -there may be a hierarchy of clusters.
Which scale, which distance measure to use forclustering?
• Data should be normalized and transformed to an appropriatescale before clustering (log or the generalized log resulting fromvariance stabilization (R package vsn )).
• Clustering genes: Standardization of gene vectors or the useof the correlation distance is useful when looking for patterns ofrelative changes - independent of their magnitude.
• Clustering samples: Standardizing genes gives relatively smallerweight for genes with high variance across the samples - notgenerally clear whether this is desirable.
• Gene filtering (based on intensity/variability) may be reasonable- also for computational reasons.
Some remarks on clustering
• A clustering algorithm will always yield clusters, whether the dataare organized in clusters or not.
• The bootstrap may be used to assess the variability of aclustering (Kerr/Churchill 2001, Pollard/van der Laan 2002).
• If a class distinction is not visible in cluster analysis, it may stillbe accessible for supervised methods (e.g. classification).
References
• Duda, Hart and Stork (2000). Pattern Classification. 2nd Edition. Wiley.
• Dudoit and Fridlyand (2002). A prediction-based resampling method forestimating the number of clusters in a dataset. Genome Biology, Vol. 3(7),research 0036.1–0036.21.
• Eisen et al. (1998). Cluster analysis and display of genome-wide expressionpatterns. PNAS, Vol 95, 14863–14868.
• Kerr and Churchill (2001). Bootstrapping cluster analysis: Assessing thereliability of conclusions from microarray experiments. PNAS, Vol. 98, p. 8961–8965.
• Pollard and van der Laan (2002). Statistical inference for simultaneousclustering of gene expression data. Mathematical Biosciences, Vol. 176, 99–121.