Embed Size (px)
Citation preview
Exploration potential for stratigraphic traps in Field X, Malay BasinMuhammad Hazmi Abdul Malik*, Lo Shyh Zung & Abdul Ghani Md Rafek
Petroleum Geoscience Department, Universiti Teknologi PETRONAS, 32610, Bandar Seri Iskandar, Perak Darul Ridzuan, Malaysia
*Corresponding author email address: [email protected]
Abstract: Interpretation and recognition of stratigraphic features using 3-D seismic data requires good understanding on structural geology, geophysics and stratigraphy. The objective was to re-evaluate the hydrocarbon potential in Field X, Malay Basin focusing on the Early to Middle Miocene succession. The field is located offshore about 200+ km north – east from the Kemaman supply base, Terengganu. Based on the generated time slice of the seismic attribute, several geomorphological features were observed including channel direction, type of channels, sinuosity, channel width, meandering wavelength, crevasse splay and point bar within Group F, H and I formation. The fluvial sandstone might be promising for stratigraphic hydrocarbon traps for Field X since this field is in low structural traps as confirmed by previous exploration. Furthermore, high resolution 3D seismic data assisted the author in diagnosing the depositional environment and predicting the channel pattern throughout the vertical seismic successions. The identification of reservoir potential was determined through several methods such as seismic interpretation, well log correlation, attribute analysis and spectral decomposition. Subtle feature in seismic slices became more visible through spectral decomposition. Finally, structural modeling aided the interpreter in the interpretation of the seismic section as well as reducing the geological uncertainty of the field.
Keywords: Geomorphological features, channels, spectral decomposition, well log correlation
Abstrak: Tafsiran dan pengiktirafan dalam pengenalpastian dalam ciri stratigrafi melalui 3-D data seismik memerlukan pemahaman yang baik mengenai struktur geologi, geofizik dan stratigrafi. Tujuan utama adalah untuk menilai semula potensi hidrokarbon dalam medan X, di Lembangan Melayu pada usia Awal Miosen ke Pertengahan Miosen. Medan ini terletak kira-kira 200+ km dari timur laut dari pangkalan bekalan Kemaman di luar pantai Terengganu. Berdasarkan ciri-ciri potongan masa yang dihasilkan melalui seismik atribut, beberapa ciri geomorfologi yang dikenalpasti termasuk arah alur, bentuk alur, kadar pembentukkan alur, lebar alur, panjang bermeander, megar krevas dan beting liku dalam formasi Kumpulan F, H dan I. Fluvis batu pasir berpotensi untuk memerangkap hidrokarbon melalui perangkap stratigrafi di medan X kerana medan ini mempunyai bentuk struktur geologi yang kecil berdasarkan explorasi terdahulu. Selain itu, resolusi tinggi data seismik 3D membantu penulis dalam mentafsir persekitaran mendapan dan meramal perubahan corak alur menerusi tahap kedalaman berbeza oleh potongan seismik. Pengenalpastian potensi reservoir adalah menerusi beberapa kaedah seperti tafsiran seismik, korelasi pengelogan telaga, analisis atribut dan penguraian spektrum. Struktur geomorfologi yang tidak jelas dapat dilihat lebih baik melalui penguraian spektrum. Akhir sekali, pemodelan struktur membantu penulis dalam menterjemahkan imej seismik disamping mengurangkan ketidakpastian di medan X.
Kata kunci: ciri geomorfologi, alur-alur, penguraian spektrum, korelasi log
INTRODUCTION The Malay basin province has high exploration potential
because of the presence of a good lacustrine shale source and reservoir rocks. The basin is Oligocene – Miocene in age and is situated between the eastern part of Peninsular Malaysia and Vietnam, in the southern part of the Gulf of Thailand.
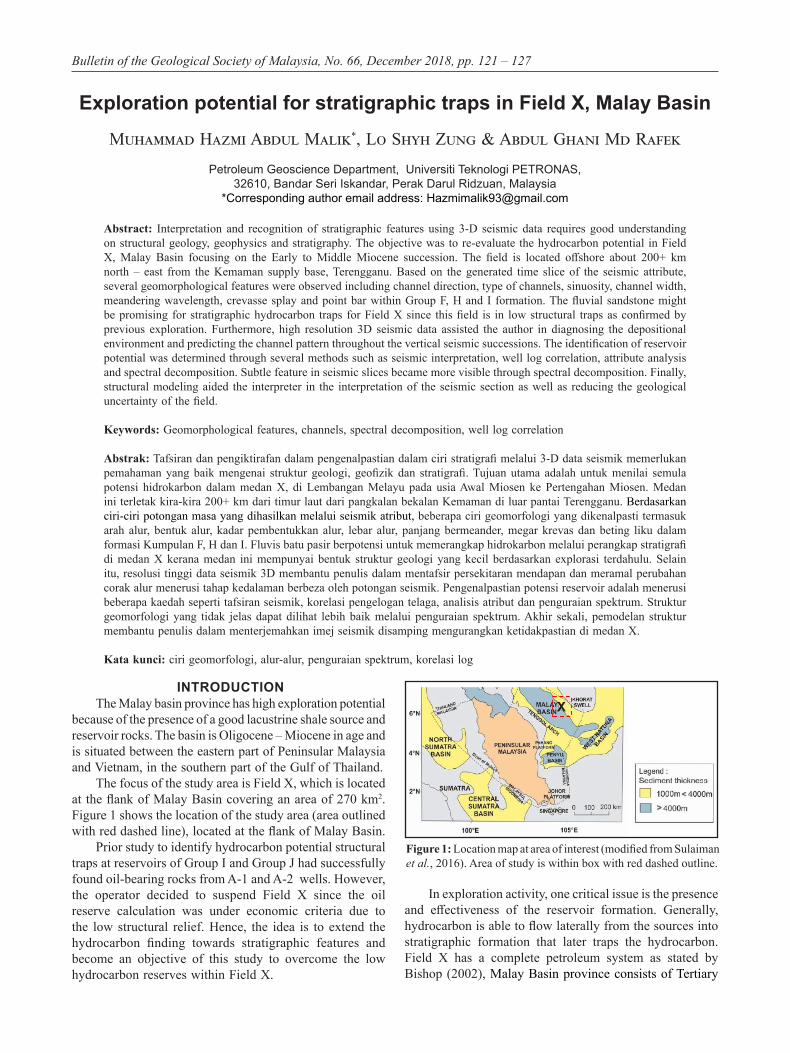
The focus of the study area is Field X, which is located at the flank of Malay Basin covering an area of 270 km2. Figure 1 shows the location of the study area (area outlined with red dashed line), located at the flank of Malay Basin.
Prior study to identify hydrocarbon potential structural traps at reservoirs of Group I and Group J had successfully found oil-bearing rocks from A-1 and A-2 wells. However, the operator decided to suspend Field X since the oil reserve calculation was under economic criteria due to the low structural relief. Hence, the idea is to extend the hydrocarbon finding towards stratigraphic features and become an objective of this study to overcome the low hydrocarbon reserves within Field X.
Figure 1: Location map at area of interest (modified from Sulaiman et al., 2016). Area of study is within box with red dashed outline.
In exploration activity, one critical issue is the presence and effectiveness of the reservoir formation. Generally, hydrocarbon is able to flow laterally from the sources into stratigraphic formation that later traps the hydrocarbon. Field X has a complete petroleum system as stated by Bishop (2002), Malay Basin province consists of Tertiary
X
Bulletin of the Geological Society of Malaysia, No. 66, December 2018, pp. 121 – 127

Muhammad Hazmi Abdul Malik, Lo Shyh Zung & Abdul Ghani Md Rafek
Bulletin of the Geological Society of Malaysia, No. 66, December 2018122
transtensional extensional basins with at least two total petroleum systems which are Oligocene-Miocene Lacustrine Total Petroleum System with lacustrine shale source and reservoir rocks and the Miocene-Coaly Strata Total Petroleum System with coal and coaly shale source and nearshore marine, deltaic, fluvial, and offshore marine bar reservoirs. However, the potential source rock tends to be under mature at the edge of Malay basin compare to central part of Malay Basin (Bishop, 2002).
Attribute analysis and spectral decomposition methods are used to predict stratigraphy formation, fluid content, fault sets, fractures and lithology in order to identify presence of hydrocarbon. Exploration software such as Petrel 2013 provides visual aid for understanding the geological behaviour and have the capability to digitize the channel architecture followed by generation of a 3D structural model within area of study to reduce risks and uncertainties in exploration. Basically, primary stratigraphic traps such as distributary channel sandstones are related to sediment erosion or deposition that is related to sea water level changes and is bounded by finer grained sediments (low permeability) that may act as source or seal rocks (Thamrujikul, n.d).
Well log data also helps the interpreter to predict depositional environments, depositional elements and thus identify the lithological formation and reservoir quality assessment. The dominant seismic frequency of 39.6 Hz is considered good but the resolution quality decreases with increasing depth, hence it is impossible to interpret thin bed formation that is less than 10m thick in deeper formations. Furthermore, some lithologies have identical value of electrical properties and radioactivity as it affects Gamma Ray and resistivity log value. A further investigation on channel path and petrophysical parameter could be done by conducting seismic attribute and well log analysis.
GEOLOGICAL SETTINGGeology of Malay Basin
Malay Basin is a northwest south-east trending elongated basin with 500 km long and 200 km wide and total area of 83,000 km2. The estimated depth of the Malay Basin based on seismic data is around 14 km whereby it contains at least 8 km of Oligocene to younger Cenozoic deposits. The basin trends continue from northwest to southeast with Natuna Basin and north-westwards to merge with Thailand’s Pattani Trough (Bishop, 2002).
Three major tectonic events that lead to the formation of the Malay Basin. The first tectonic event happened during late Cretaceous to Early Miocene as there was a form of extension. This extension moved at WE axis pull a part due to NW-SE sinistral transtensional faults (Madon, 1997). Although many different types of basins have been proposed, all agrees that extensional forces are the major factor in the formation of the Malay Basin. After the extension, the second phase of tectonic event was compressional due to stress regime and formed anticlines and reverse faults during Middle to Late Miocene time (Tjia, 1994). The third tectonic
event consisted of regional subsidence during Pliocene. Tectonic strain that accumulated in the anticlines during the second tectonic activity was released during the last phase which caused in north-striking normal faults perpendicular to the crests of the anticlines (Tjia, 1994). The presence of folding in the Malay Basin as seen in seismic sections justifies the presence of compressional forces. Along its cross section and length, the Malay basin is asymmetrical with its south-eastern flank slightly steeper than its north-eastern flank. In the south-eastern and central parts of the basin, basement faults mostly trend E-W.
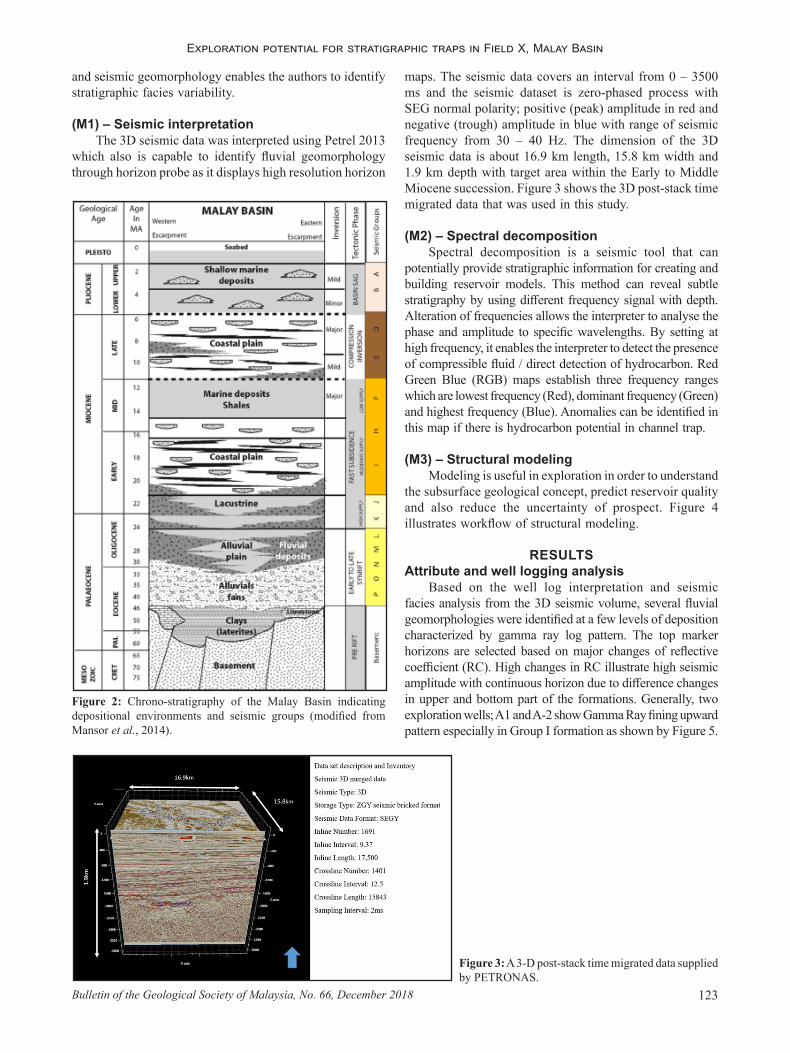
Stratigraphy and basin resourcesUnconformities, micropaleontology data such as
palynology and global eustatic sea level change were used for stratigraphic correlation and identification of lithological age (Wakefield & Monteil, 2002). Stratigraphic development is directly related to the structural evolution which are extension followed by thermal subsidence and ending with a tectonic inactive period. As mentioned earlier, reservoir target depth is from Group F till Group I even though the formations are young.
However, our main focus is on Group I since there were oil discoveries in X-1 and X-2. The sequence of Malay Basin petroleum system began to deposit at Group K as fast subsidence phase happened due to thermal cooling of Sunda Block crust (Mansor et al., 2014). Group K has a significant lithologic horizon cap known as Terengganu Shale lacustrine source rock. Thermal subsidence occurred during Early Miocene to Middle Miocene and it caused a thick tidal channel sands, tidal mudflats and coals were deposited in Group I. Thermal subsidence happens when hot mantle becomes cooled through conductive cooling thus thickens it and causing it to be heavier and decrease in elevation. Generally, reservoir quality for Group I is excellent as the rock have 25% – 30% porosity and 1000 mD permeability (Bishop, 2002). Hence, the author believes high possibility of hydrocarbon trap in Group I formation.
According to EPIC (1994), the presence of coal beds is distinctive on wireline log, averaging from 2 till 5 m thickness thus the formation can be correlated across the south-central Malay Basin. Meanwhile, Group H formed a good seal formation consists of thick shales and the following upper Group H is mainly shales and siltstones with biostratigraphic data (Yakzan et al., 1994). Depositional environments for Group F is almost entirely marine shales as a results extensive and thick basin fill was marked in this formation. Figure 2 shows the summary of chrono-stratigraphy according to depositional environment of the Malay Basin.
METHODOLOGYHard data in the study area consisted of a field 3-D
seismic data, well reports with several wireline logs. For channel identification and delineation, attribute analysis and spectral decomposition were used. The product is to build a structural and stratigraphic model throughout the whole Field X area. Combination of seismic stratigraphy
Exploration potential for stratigraphic traps in Field X, Malay Basin
123Bulletin of the Geological Society of Malaysia, No. 66, December 2018
Figure 2: Chrono-stratigraphy of the Malay Basin indicating depositional environments and seismic groups (modified from Mansor et al., 2014).
and seismic geomorphology enables the authors to identify stratigraphic facies variability.
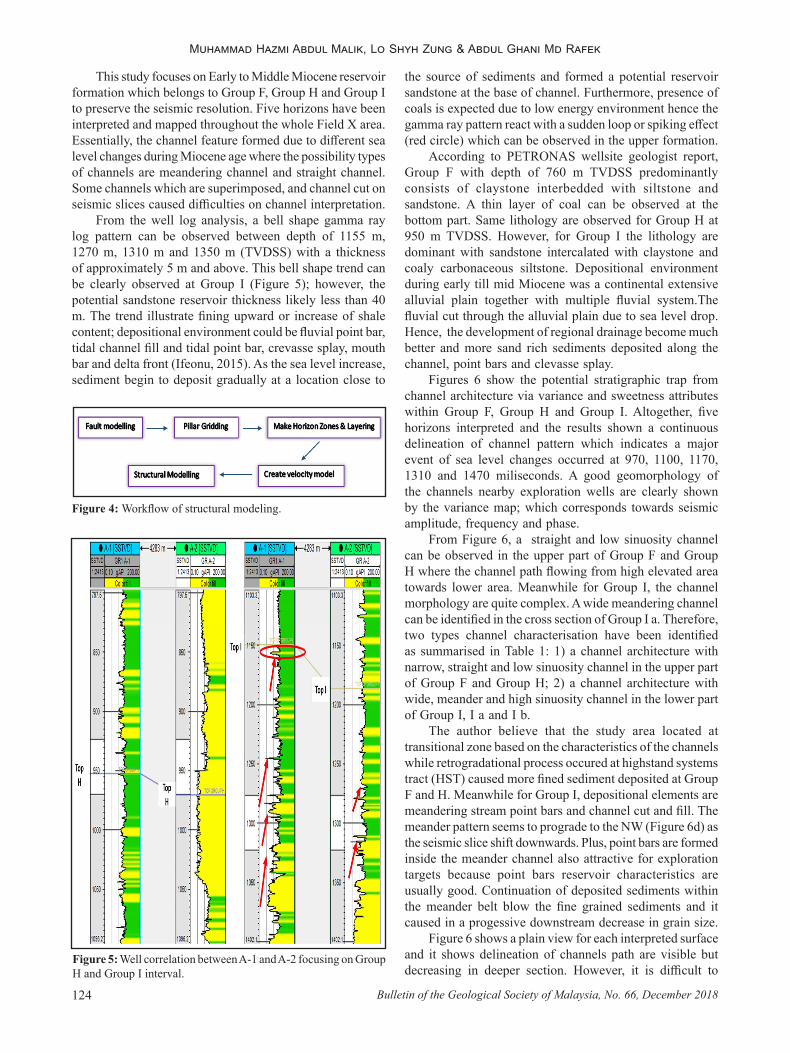
(M1) – Seismic interpretationThe 3D seismic data was interpreted using Petrel 2013
which also is capable to identify fluvial geomorphology through horizon probe as it displays high resolution horizon
Figure 3: A 3-D post-stack time migrated data supplied by PETRONAS.
maps. The seismic data covers an interval from 0 – 3500 ms and the seismic dataset is zero-phased process with SEG normal polarity; positive (peak) amplitude in red and negative (trough) amplitude in blue with range of seismic frequency from 30 – 40 Hz. The dimension of the 3D seismic data is about 16.9 km length, 15.8 km width and 1.9 km depth with target area within the Early to Middle Miocene succession. Figure 3 shows the 3D post-stack time migrated data that was used in this study.
(M2) – Spectral decompositionSpectral decomposition is a seismic tool that can
potentially provide stratigraphic information for creating and building reservoir models. This method can reveal subtle stratigraphy by using different frequency signal with depth. Alteration of frequencies allows the interpreter to analyse the phase and amplitude to specific wavelengths. By setting at high frequency, it enables the interpreter to detect the presence of compressible fluid / direct detection of hydrocarbon. Red Green Blue (RGB) maps establish three frequency ranges which are lowest frequency (Red), dominant frequency (Green) and highest frequency (Blue). Anomalies can be identified in this map if there is hydrocarbon potential in channel trap.
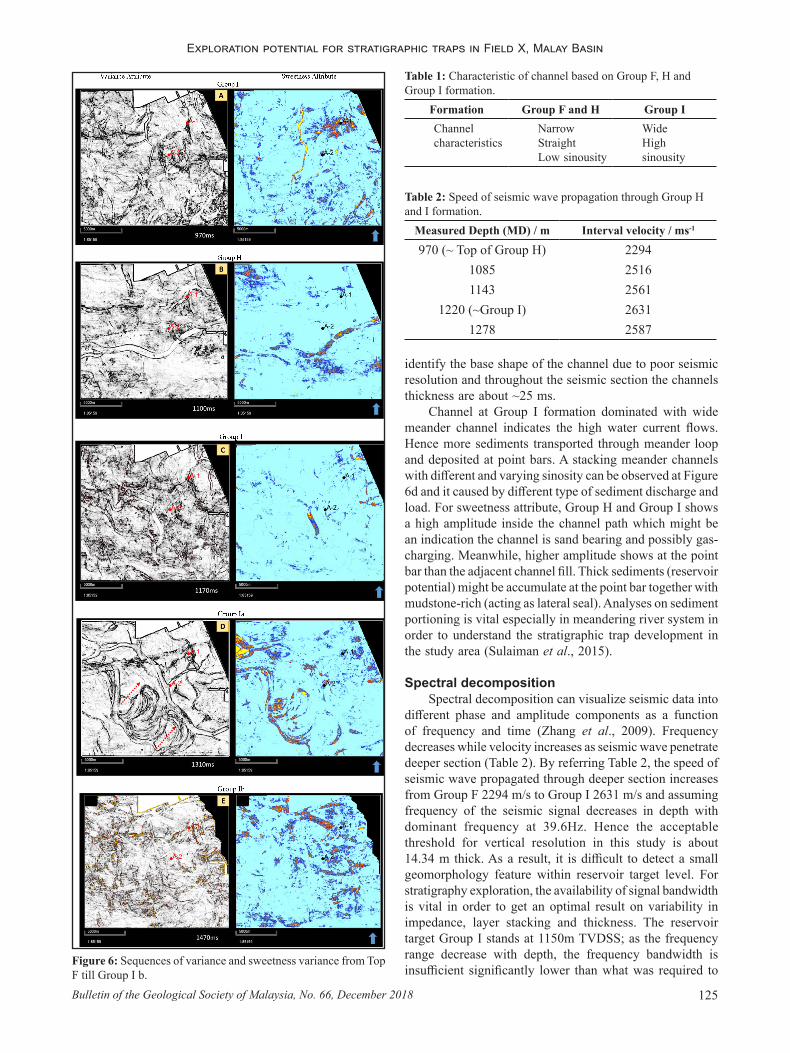
(M3) – Structural modeling Modeling is useful in exploration in order to understand
the subsurface geological concept, predict reservoir quality and also reduce the uncertainty of prospect. Figure 4 illustrates workflow of structural modeling.
RESULTSAttribute and well logging analysis
Based on the well log interpretation and seismic facies analysis from the 3D seismic volume, several fluvial geomorphologies were identified at a few levels of deposition characterized by gamma ray log pattern. The top marker horizons are selected based on major changes of reflective coefficient (RC). High changes in RC illustrate high seismic amplitude with continuous horizon due to difference changes in upper and bottom part of the formations. Generally, two exploration wells; A1 and A-2 show Gamma Ray fining upward pattern especially in Group I formation as shown by Figure 5.
Muhammad Hazmi Abdul Malik, Lo Shyh Zung & Abdul Ghani Md Rafek
Bulletin of the Geological Society of Malaysia, No. 66, December 2018124
Figure 5: Well correlation between A-1 and A-2 focusing on Group H and Group I interval.
This study focuses on Early to Middle Miocene reservoir formation which belongs to Group F, Group H and Group I to preserve the seismic resolution. Five horizons have been interpreted and mapped throughout the whole Field X area. Essentially, the channel feature formed due to different sea level changes during Miocene age where the possibility types of channels are meandering channel and straight channel. Some channels which are superimposed, and channel cut on seismic slices caused difficulties on channel interpretation.
From the well log analysis, a bell shape gamma ray log pattern can be observed between depth of 1155 m, 1270 m, 1310 m and 1350 m (TVDSS) with a thickness of approximately 5 m and above. This bell shape trend can be clearly observed at Group I (Figure 5); however, the potential sandstone reservoir thickness likely less than 40 m. The trend illustrate fining upward or increase of shale content; depositional environment could be fluvial point bar, tidal channel fill and tidal point bar, crevasse splay, mouth bar and delta front (Ifeonu, 2015). As the sea level increase, sediment begin to deposit gradually at a location close to
the source of sediments and formed a potential reservoir sandstone at the base of channel. Furthermore, presence of coals is expected due to low energy environment hence the gamma ray pattern react with a sudden loop or spiking effect (red circle) which can be observed in the upper formation.
According to PETRONAS wellsite geologist report, Group F with depth of 760 m TVDSS predominantly consists of claystone interbedded with siltstone and sandstone. A thin layer of coal can be observed at the bottom part. Same lithology are observed for Group H at 950 m TVDSS. However, for Group I the lithology are dominant with sandstone intercalated with claystone and coaly carbonaceous siltstone. Depositional environment during early till mid Miocene was a continental extensive alluvial plain together with multiple fluvial system.The fluvial cut through the alluvial plain due to sea level drop. Hence, the development of regional drainage become much better and more sand rich sediments deposited along the channel, point bars and clevasse splay.
Figures 6 show the potential stratigraphic trap from channel architecture via variance and sweetness attributes within Group F, Group H and Group I. Altogether, five horizons interpreted and the results shown a continuous delineation of channel pattern which indicates a major event of sea level changes occurred at 970, 1100, 1170, 1310 and 1470 miliseconds. A good geomorphology of the channels nearby exploration wells are clearly shown by the variance map; which corresponds towards seismic amplitude, frequency and phase.
From Figure 6, a straight and low sinuosity channel can be observed in the upper part of Group F and Group H where the channel path flowing from high elevated area towards lower area. Meanwhile for Group I, the channel morphology are quite complex. A wide meandering channel can be identified in the cross section of Group I a. Therefore, two types channel characterisation have been identified as summarised in Table 1: 1) a channel architecture with narrow, straight and low sinuosity channel in the upper part of Group F and Group H; 2) a channel architecture with wide, meander and high sinuosity channel in the lower part of Group I, I a and I b.
The author believe that the study area located at transitional zone based on the characteristics of the channels while retrogradational process occured at highstand systems tract (HST) caused more fined sediment deposited at Group F and H. Meanwhile for Group I, depositional elements are meandering stream point bars and channel cut and fill. The meander pattern seems to prograde to the NW (Figure 6d) as the seismic slice shift downwards. Plus, point bars are formed inside the meander channel also attractive for exploration targets because point bars reservoir characteristics are usually good. Continuation of deposited sediments within the meander belt blow the fine grained sediments and it caused in a progessive downstream decrease in grain size.
Figure 6 shows a plain view for each interpreted surface and it shows delineation of channels path are visible but decreasing in deeper section. However, it is difficult to
Figure 4: Workflow of structural modeling.
Exploration potential for stratigraphic traps in Field X, Malay Basin
125Bulletin of the Geological Society of Malaysia, No. 66, December 2018
Figure 6: Sequences of variance and sweetness variance from Top F till Group I b.
identify the base shape of the channel due to poor seismic resolution and throughout the seismic section the channels thickness are about ~25 ms.
Channel at Group I formation dominated with wide meander channel indicates the high water current flows. Hence more sediments transported through meander loop and deposited at point bars. A stacking meander channels with different and varying sinosity can be observed at Figure 6d and it caused by different type of sediment discharge and load. For sweetness attribute, Group H and Group I shows a high amplitude inside the channel path which might be an indication the channel is sand bearing and possibly gas-charging. Meanwhile, higher amplitude shows at the point bar than the adjacent channel fill. Thick sediments (reservoir potential) might be accumulate at the point bar together with mudstone-rich (acting as lateral seal). Analyses on sediment portioning is vital especially in meandering river system in order to understand the stratigraphic trap development in the study area (Sulaiman et al., 2015).
Spectral decompositionSpectral decomposition can visualize seismic data into
different phase and amplitude components as a function of frequency and time (Zhang et al., 2009). Frequency decreases while velocity increases as seismic wave penetrate deeper section (Table 2). By referring Table 2, the speed of seismic wave propagated through deeper section increases from Group F 2294 m/s to Group I 2631 m/s and assuming frequency of the seismic signal decreases in depth with dominant frequency at 39.6Hz. Hence the acceptable threshold for vertical resolution in this study is about 14.34 m thick. As a result, it is difficult to detect a small geomorphology feature within reservoir target level. For stratigraphy exploration, the availability of signal bandwidth is vital in order to get an optimal result on variability in impedance, layer stacking and thickness. The reservoir target Group I stands at 1150m TVDSS; as the frequency range decrease with depth, the frequency bandwidth is insufficient significantly lower than what was required to
Table 1: Characteristic of channel based on Group F, H andGroup I formation.
Formation Group F and H Group IChannelcharacteristics
NarrowStraightLow sinousity
WideHighsinousity
Table 2: Speed of seismic wave propagation through Group H and I formation.
Measured Depth (MD) / m Interval velocity / ms-1
970 (~ Top of Group H)10851143
1220 (~Group I)1278
22942516256126312587
Muhammad Hazmi Abdul Malik, Lo Shyh Zung & Abdul Ghani Md Rafek
Bulletin of the Geological Society of Malaysia, No. 66, December 2018126
Figure 8: RGB Spectral decomposition result for Horizon I a.
Figure 9: Result of structural modeling in depth domain.
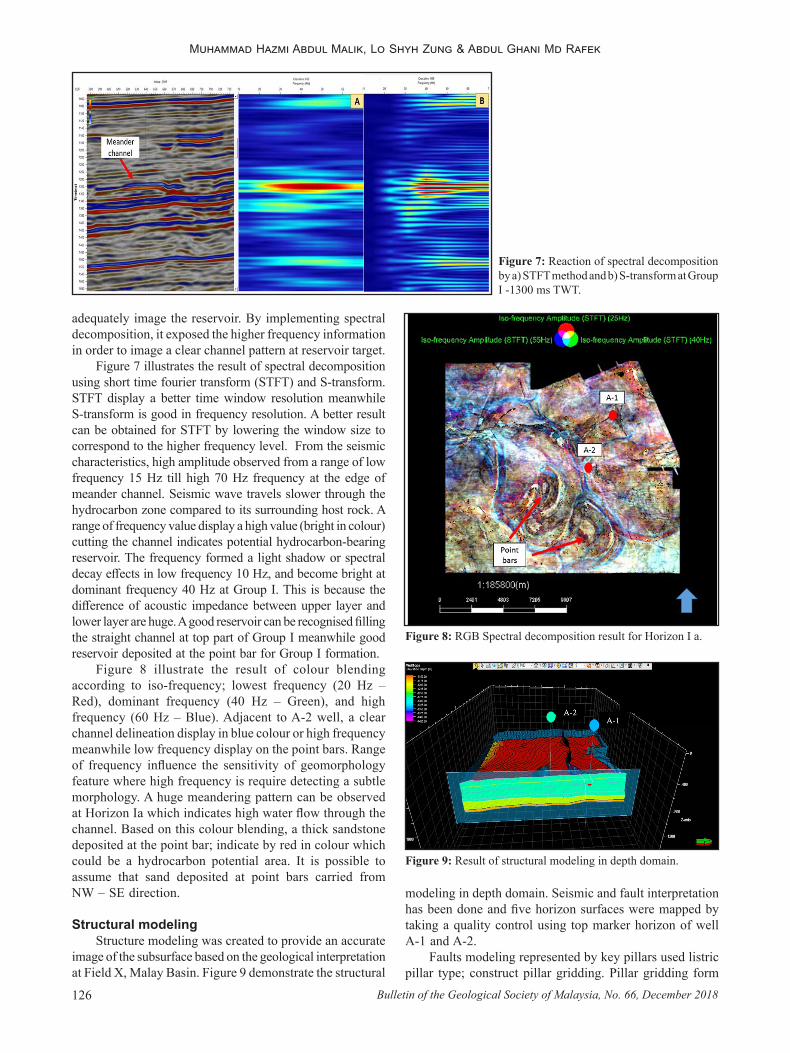
adequately image the reservoir. By implementing spectral decomposition, it exposed the higher frequency information in order to image a clear channel pattern at reservoir target.
Figure 7 illustrates the result of spectral decomposition using short time fourier transform (STFT) and S-transform. STFT display a better time window resolution meanwhile S-transform is good in frequency resolution. A better result can be obtained for STFT by lowering the window size to correspond to the higher frequency level. From the seismic characteristics, high amplitude observed from a range of low frequency 15 Hz till high 70 Hz frequency at the edge of meander channel. Seismic wave travels slower through the hydrocarbon zone compared to its surrounding host rock. A range of frequency value display a high value (bright in colour) cutting the channel indicates potential hydrocarbon-bearing reservoir. The frequency formed a light shadow or spectral decay effects in low frequency 10 Hz, and become bright at dominant frequency 40 Hz at Group I. This is because the difference of acoustic impedance between upper layer and lower layer are huge. A good reservoir can be recognised filling the straight channel at top part of Group I meanwhile good reservoir deposited at the point bar for Group I formation.
Figure 8 illustrate the result of colour blending according to iso-frequency; lowest frequency (20 Hz – Red), dominant frequency (40 Hz – Green), and high frequency (60 Hz – Blue). Adjacent to A-2 well, a clear channel delineation display in blue colour or high frequency meanwhile low frequency display on the point bars. Range of frequency influence the sensitivity of geomorphology feature where high frequency is require detecting a subtle morphology. A huge meandering pattern can be observed at Horizon Ia which indicates high water flow through the channel. Based on this colour blending, a thick sandstone deposited at the point bar; indicate by red in colour which could be a hydrocarbon potential area. It is possible to assume that sand deposited at point bars carried from NW – SE direction.
Structural modelingStructure modeling was created to provide an accurate
image of the subsurface based on the geological interpretation at Field X, Malay Basin. Figure 9 demonstrate the structural
modeling in depth domain. Seismic and fault interpretation has been done and five horizon surfaces were mapped by taking a quality control using top marker horizon of well A-1 and A-2.
Faults modeling represented by key pillars used listric pillar type; construct pillar gridding. Pillar gridding form
Figure 7: Reaction of spectral decomposition by a) STFT method and b) S-transform at Group I -1300 ms TWT.

Exploration potential for stratigraphic traps in Field X, Malay Basin
127Bulletin of the Geological Society of Malaysia, No. 66, December 2018
Figure 10: Skeleton grid with fault pillar gridding in the X-Y dimensions.
a skeleton framework at area of interest. Adjustment on pillar gridding is required in order to get a better geological model. Figure 10 shows the top skeleton grid in the X – Y dimensions. The field area undergone low tectonic activity hence only several major faults were detected throughout the whole area.
The final step in structural modeling is to insert the five stratigraphic successions into the pillar grid. All the fault modeling and horizon surfaces to be incorporated into the model that have been defined. Structural modeling represents in time domain need to convert to depth domain by using velocity function. A specified velocity parameter is used to convert two-way-time into depth. Structural modeling is the first step before proceeding to property modeling. Later, property modeling will be conducted based on the petrophysical parameter from exploration wells nearby. A lot of information can be shown from modeling such as channel path, facies distribution and reduce uncertainty about geological feature at target zone.
CONCLUSIONSSeismic geomorphology is difficult to study and to
understand. Nowadays, a lot of exploration tools can be used to interpret geological features. Five horizons succession have been interpreted and many channel architectures were identified. Well tops are selected based on log-based facies interpretation where low Gamma Ray log value indicates as sand-prone. Cut off value is set between 50 till 80 API which is higher than standard values due to marine depositional environment.
Several methods such as attribute analysis, altering the frequency spectrum (Spectral Decomposition) and well log analysis was used to explore hydrocarbon potential at stratigraphic feature as results there were many channel
distributions throughout Group F, Group H, Group I, I a and I b. Other challenges were to identify the type of lithologies, fluid properties and capability of seal / trap to avoid bypass of hydrocarbon from reservoir. Structural modelling illustrates the real structures of the subsurface. However, several modifications are needed in order to achieve better outcome.
ACKNOWLEDGEMENTSI extend my appreciation to my senior lectures for their
guidance and helpful discussions. I would like to thank Universiti Teknologi PETRONAS and PETRONAS for giving opportunity for doing my research study and provide 3D seismic post stack data.
REFERENCESBishop, M.G., 2002. Petroleum systems of the Malay Basin province,
Malaysia, USGS. Retrieve from https://pubs.usgs.gov/of/1999/ofr-99-0050/OF99-50T/index.html.
EPMI-PETRONAS EPIC Study (unpublished report), 1994. Regional Study of the Malay Basin, Final Portfolios.
Ifeonu, I. E., 2015. Fault seal attributes as parameters for hydrocarbon column prediction in central swamp of the Niger delta. Master of Science thesis, University of London.
Madon, M.B., 1997. The Kinematics of extension and inversion in the Malay basin, offshore Peninsular Malaysia. Bulletin of the Geol. Soc. of Malaysia, 41, 127-138.
Mansor, M.Y., Hadi, A., Menier, D. & Pubellier, M., 2014. Structural evolution of Malay Basin, its link to Sunda Block tectonics. Marine and Petroleum Geology, 58, 736-748.
Sulaiman, N., Hamzah, U. & Samsudin A. R., 2015. Analysis of ancient-river systems by 3D seismic time-slice technique: A case study in northeast Malay Basin, offshore Terengganu, Malaysia. AIP Conference Proceedings, 1614(1).
Thamrujikul, P. (n.d). Petroleum Geology: Stratigraphic trap. Retrieved from http://petgeo.weebly.com/stratigraphic-trap.html.
Tjia, H.D., 1994. Inversion tectonics in the Malay Basin: evidence and timing of events. Bulletin of the Geological Society of Malaysia, 36, 119-126.
Wakefield, M.I. & Monteil, E., 2002. Biosequence stratigraphical and palaeoenvironmental findings from the Cretaceous through Tertiary succession, Central Indus Basin, Pakistan. Jounal of Micropalaeontology, 21, 115-130.
Yakzan, A.M., Nasib, B.Md., Harum, A. & Morley, R.J., 1994. Integrated Biostratigraphic Zonation for the Malay Basin. Article #90982, AAPG International Conference and Exhibition, Kuala Lumpur, Malaysia.
Zhang, K., Marfurt, K.J., Slatt, R. M. & Guo, Y., 2009. Spectral decomposition illumination of reservoir facies, in SEG Technical Program Expanded Abstracts. Society of Exploration Geophysicists, 3515-3519.
Manuscript received 7 October 2017 Revised manuscript received 3 October 2018
Manuscript accepted 12 October 2018