Embed Size (px)
Citation preview

Exploration of unstructured narrative crime reports: an unsupervised neural network and pointpattern analysis approach
Marco Helbicha*, Julian Hagenauera, Michael Leitnerb and Ricky Edwardsc
aInstitute of Geography, University of Heidelberg, Berliner Straße 48, Heidelberg D-69120, Germany; bDepartment of Geography andAnthropology, Louisiana State University, Baton Rouge, LA 70803, USA; cLouisiana Sheriffs Association, 1175 Nicholson Drive, Baton
Rouge, LA 70802, USA
(Received 10 November 2012; accepted 9 February 2013)
Crime intelligence analysis and criminal investigations are increasingly making use of geospatial methodologies to improvetactical and strategic decision-making. However, the full potential of geospatial technologies is yet to be exploited. Inparticular, geospatial technology currently applied by law enforcement is somewhat limited in handling the increasingvolume of police recorded and relatively unstructured narrative crime reports, such as observations and interviews ofeyewitnesses, the general public, or other relevant persons. The main objective of this research is to promote text mining,particularly the self-organizing map algorithm and its visualization capabilities, in combination with point pattern analysis,to explore the value of otherwise hidden information in a geographical context and to gain further insight into the complexbehavior of the geography of crime. This methodological approach is applied to a high-profile and still unsolved homicideseries in the city of Jennings, Louisiana. In a collaborative effort with the Jennings Police Task Force, the analysis is basedupon a range of information sources, including email correspondence, transcribed face-to-face interviews, and phone callsthat have been stored as “Information Packages” in the Orion database, which is maintained by the Federal Bureau ofInvestigation. Close to 200 individual information packages related to Necole Guillory, the eighth and last victim whosedead and dumped body was discovered in August 2009, are analyzed and resulted in new geographic patterns andrelationships previously unknown to the Task Force.
Keywords: crime mapping; information packages; text mining; word cloud; self-organizing map; point pattern analysis
Background
Crime in all its facets including robberies, cybercrime, andterrorism is an integral part of our daily life and affectssociety as a whole (Costa 2010). Because crime impactsour sense of security, affects our quality of life, and has farreaching economic consequences, crime protection andcrime combat has gained significant importance in thegeneral public, police agencies, politics, and science. Tocounteract the impact of crime throughout society, crimeagencies, among other things, have reverted to the appli-cation of modern intelligence and geospatial technologies,which have quickly become an emerging scientificresearch field for tackling such security needs. The devel-opment of such technologies is often founded on a solidtheoretical basis that includes such well-known theories asroutine activities (Cohen and Felson 1979), rational choice(Clarke and Cornish 1985), and environmental criminol-ogy (Brantingham and Brantingham 1981).
One of the main challenges that law enforcement isincreasingly facing is the proliferation of crime and crime-related data (Chen et al. 2004; Chen and Wang 2005;Hagenauer, Helbich, and Leitner 2011). Profiling meth-odologies and geographic information systems (GIS)-based methods (Chainey and Ratcliffe 2005) have already
been successfully applied retrospectively and prospec-tively in day-to-day operations by law enforcement agen-cies (e.g., Leitner and Helbich 2011; Helbich and Leitner2012). However, these methods are not capable of explor-ing large amounts of unstructured narrative crime reportsor protocols that are increasingly stored in criminal justicedatabases. A large part of these data is provided volunta-rily to the police by eyewitnesses, the general public, orother relevant persons, who report hints and narrativedescriptions of observations associated with particularcrime events. As such, this corresponds to Goodchild’s(2007) “human as sensors paradigm”, where peoplevoluntarily collect and share geographic and textual infor-mation with the police. Major serial crimes, especiallyserial homicides or rapes, usually receive much mediacoverage and the number of such protocols can easilyexceed hundreds to thousands of unstructured items inthe form of emails, written statements, and transcribedtelephone recordings. In contrast to standard structureddata, which can be explored by basic queries, such crimereports are stored in the form of plain text documents,which require alternative and novel methods for theiranalysis (Jones and Purves 2008). Chen et al. (2004)also note that such unstructured data are further affected
*Corresponding author. Email: [email protected]
Cartography and Geographic Information Science, 2013http://dx.doi.org/10.1080/15230406.2013.779780
© 2013 Cartography and Geographic Information Society
Dow
nloa
ded
by [
Uni
vers
itaet
sbib
lioth
ek H
eide
lber
g] a
t 23:
17 2
9 A
pril
2013

by noisy content, resulting from spelling mistakes in addi-tion to typographical and grammatical errors.
Although, such unstructured documents are often veryimportant for crime analysis and are useful in providingvaluable insights into the complex behavior of crime, theyhave rarely been investigated comprehensively in empiri-cal analysis, and thus have played a marginal and lesssignificant role in criminal investigations. The explorationof unstructured documents requires text data mining tech-niques (Delen and Crossland 2008; Manning, Raghavan,and Schütze 2008) to extract and discover previouslyunknown, potentially useful, and hidden information,which would not be readily apparent when sifting throughthe data manually (Han and Kamber 2011).
At present, only a few studies exist that focus on themining of narrative crime reports and more research isneeded to evaluate the capability of text miningapproaches for law enforcement. For instance, Chau, Xu,and Chen (2002) automatically extracted entities, includ-ing names and addresses, from a sample of 36 narrativereports from the Phoenix police department using a neuralnetwork-based approach. The authors concluded that theaccuracy of the empirical results varied depending on thekind of entity mined. For example, in contrast to names,which can be precisely extracted, addresses show a loweraccuracy rate. Similarly, Ku, Iriberri, and Leroy (2008)analyzed police and witness reports with an informationextraction system, combining several algorithms from nat-ural language processing. They reported a high proportionof correctly extracted features. More relevant for thisresearch is the work by Chen et al. (2003) and Alruily,Ayesh, and Al-Marghilani (2010), who used self-organiz-ing maps (SOMs) for clustering and visualization of crimedata from public media. The latter study successfullyextracted crime phrases, such as keywords, from Arabicnews articles in order to characterize diverse crime types.Common to these studies is that they are solely based ontext exploration and neglect the ability to link the miningoutput to geographical space. This is clearly an importantlimitation, since “space” is seen as an inherent property ofcrime (see Leitner and Helbich 2011). Therefore, the pre-sent research applies a multistage methodology whichprojects the mining output to geographical space andthen analyzes this output with spatial statistical methods.To summarize, while the mining of (unstructured) crimereports is still in its infancy, it represents a vibrant andemerging research field that has not yet been linked to aGIS and its analysis and visualization capabilities.
Hence, the main objective of this study is to propose atext mining approach to expand upon the spatial analyticalcapabilities of the investigative effort carried out by lawenforcement personnel. In particular, this research minesan already available subsidiary textual data source, namely“Information Packages (IPs)” stored in the Orion databasewhich is operated by the US Federal Bureau of
Investigation (FBI). All IP’s are related to a much pub-licized, yet unsolved, serial homicide case in the city ofJennings, located in Jefferson Davis Parish (JDP), LA.This novel approach allows uncovering certain aspects ofthe information content and possible relationships betweenIPs, previously unknown to the Jennings Police TaskForce. Additionally, both the content and relationshipscan be linked to their geographic context. To the bestknowledge of the authors, using such a data miningapproach to investigative an important on-going crimeseries has never been done before. The remainder of thisarticle is organized as follows: In the “Study area anddata” section the study area and the data set are intro-duced. In the “Methodology” section, the methodology isreviewed. Important results are presented in the “Results”section. Finally, the “Conclusions” section draws conclu-sions and suggests valuable directions for future research.
Study area and data
Between May 2005 and August 2009 eight women werekilled and dumped in rural areas just outside of Jennings,the largest city and seat of JDP, LA. All but the lastvictim’s body dump site are located in JDP. The lastvictim’s body was found in Acadia Parish, which neigh-bors JDP immediately to the east. The Task Force beingassigned to this crime series assumes that all homicidesare linked to the same perpetrator. All body dump sites(numbered from 1 through 8) and the date of recovery (inparenthesis) are shown in Figure 1. In the middle top partof Figure 1 the city of Jennings can be seen. The age ofthe women ranged from 17 to 30 years, six of the womenwere whites and the other two were blacks. All eightwomen were residents of Jennings. They were drug-addicts and made their living mostly from prostitution,making them highly vulnerable and relative easy targetsfor the serial killer. Unfortunately, the Jennings homicideseries is not unique and a large number of very similardrug-involved prostitute crime series exist around the US(Fox and Levin 2010; Quinet 2011).
JDP is a poor and mostly rural parish with a medianfamily income of US$30,783 and dominated by agricul-tural products, such as sugar cane, rice, cotton, sweetpotato, etc. The city of Jennings has a population of10,986 according to the 2010 US census. The ethniccomposition of Jennings is about 70% white and 28%black, with the majority of the black population livingsouth and the majority of the white population north of arailroad track that runs through the city from northwest tosoutheast. Interstate I-10 crosses Jennings in the north.
The Jennings Police Task Force uses the Orion data-base of “Information Packages (IPs)” to store email corre-spondence, transcribed face-to-face interviews, and phonecalls associated with its homicide series. For this studyonly the 172 IPs related to the last of the eight victims,
2 M. Helbich et al.
Dow
nloa
ded
by [
Uni
vers
itaet
sbib
lioth
ek H
eide
lber
g] a
t 23:
17 2
9 A
pril
2013

Necole Guillory, were extracted from Orion and subse-quently analyzed. One example of a rather short IP used inthis research is shown in the appendix. For reasons ofconfidentiality, personal information, such as names andaddresses, are masked. Obviously, such a vast number ofunstructured data records can only be efficiently analyzedwith a text data mining approach.
Methodology
This section illustrates our methodological workflow.Following necessary pre-processing tasks of the IPs(“Data pre-processing” section), the SOM algorithm isapplied to derive meaningful clusters and for visualizingthe results (“Self-organizing maps” section). Finally, theclusters are linked back to the geographic space, whichpermits the exploration of the spatial distribution of theclusters using point pattern analysis methods (“Bivariate K(d)-function” section).
Data pre-processing
In order to analyze the IPs, basically text documents, it isnecessary to transform them into a data representation,which enables computational processing. To achieve thistask, this study employs information retrieval methods(e.g., Manning, Raghavan, and Schütze 2008). At thebeginning, all words are extracted from the IP documentsand stored as plain text. For computational reasons, theorder of words is neglected. All words that are not part ofthe main text (e.g., headings) are discarded. Additionally,very frequently and rarely occurring words are removedbecause they do not affect the clustering of the reports, butreduce the dimensionality of the data set considerably.
Testing several cut-off values, words shorter than threecharacters and that occur less than 5 times or more than100 times per IP are removed. Furthermore, commas,article prepositions, conjunctions, and non-informativestop words (e.g., “and”, “which”, “that”) are eliminated.The remaining words are set to lower case. These para-meter settings were empirically determined from prelimin-ary experiments. Note that the document’s metadata werenot removed, because they can also be valuable sources ofinformation.
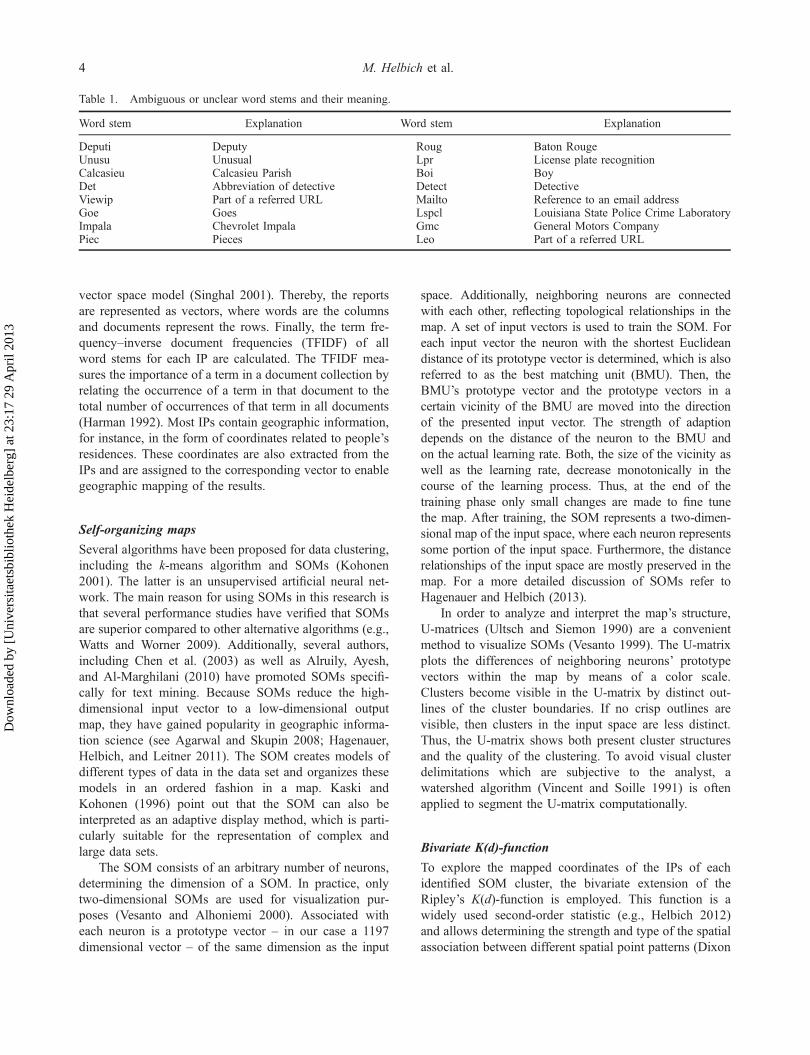
After this filtering process, a stemming algorithm isemployed (Porter 1980). A word stem represents the partof the word that is common to all its inflected variants.By removing the affixes of the words, the terms aretransformed to their roots, which carry the crucial aspectsof the semantic content (Singhal 2001). As an example,the three words “maps”, “mapped”, and “mapping” arereduced to their common root “map”. The stemmingalgorithm sometimes alters the orthography of words,e.g., the letter “y” is often substituted by “i”. Thismakes it sometimes difficult to directly infer the originalword from a word stem with the consequence that theactual meaning of such a word stem may become unclear.Table 1 provides a list of ambiguous or unclear wordstems that are relevant for this research, their correspond-ing words, and a brief explanation of their meaning, ifnecessary. Due to privacy reasons, word stems of firstand last names of persons other than the victims’ areanonymized and coded. For example, the code “fn1”refers to the first name of a person with the number 1assigned to it and “ln3” to a person’s last name with thenumber 3 assigned to it.
In order to represent word stems as an algebraicmodel, the data are transformed in accordance with the
7 (15 November 2008)
3 (18 March 2007)
1 (20 May 2005)
4 (12 May 2007)
2 (18 June 2005)
6 (11 September 2008)
5 (29 May 2008)
8 (19 August 2009)
Figure 1. The location of Jefferson Davis Parish in the State of Louisiana and the location of all eight body dump sites superimposedover a satellite image by Google.
Cartography and Geographic Information Science 3
Dow
nloa
ded
by [
Uni
vers
itaet
sbib
lioth
ek H
eide
lber
g] a
t 23:
17 2
9 A
pril
2013
vector space model (Singhal 2001). Thereby, the reportsare represented as vectors, where words are the columnsand documents represent the rows. Finally, the term fre-quency–inverse document frequencies (TFIDF) of allword stems for each IP are calculated. The TFIDF mea-sures the importance of a term in a document collection byrelating the occurrence of a term in that document to thetotal number of occurrences of that term in all documents(Harman 1992). Most IPs contain geographic information,for instance, in the form of coordinates related to people’sresidences. These coordinates are also extracted from theIPs and are assigned to the corresponding vector to enablegeographic mapping of the results.
Self-organizing maps
Several algorithms have been proposed for data clustering,including the k-means algorithm and SOMs (Kohonen2001). The latter is an unsupervised artificial neural net-work. The main reason for using SOMs in this research isthat several performance studies have verified that SOMsare superior compared to other alternative algorithms (e.g.,Watts and Worner 2009). Additionally, several authors,including Chen et al. (2003) as well as Alruily, Ayesh,and Al-Marghilani (2010) have promoted SOMs specifi-cally for text mining. Because SOMs reduce the high-dimensional input vector to a low-dimensional outputmap, they have gained popularity in geographic informa-tion science (see Agarwal and Skupin 2008; Hagenauer,Helbich, and Leitner 2011). The SOM creates models ofdifferent types of data in the data set and organizes thesemodels in an ordered fashion in a map. Kaski andKohonen (1996) point out that the SOM can also beinterpreted as an adaptive display method, which is parti-cularly suitable for the representation of complex andlarge data sets.
The SOM consists of an arbitrary number of neurons,determining the dimension of a SOM. In practice, onlytwo-dimensional SOMs are used for visualization pur-poses (Vesanto and Alhoniemi 2000). Associated witheach neuron is a prototype vector – in our case a 1197dimensional vector – of the same dimension as the input
space. Additionally, neighboring neurons are connectedwith each other, reflecting topological relationships in themap. A set of input vectors is used to train the SOM. Foreach input vector the neuron with the shortest Euclideandistance of its prototype vector is determined, which is alsoreferred to as the best matching unit (BMU). Then, theBMU’s prototype vector and the prototype vectors in acertain vicinity of the BMU are moved into the directionof the presented input vector. The strength of adaptiondepends on the distance of the neuron to the BMU andon the actual learning rate. Both, the size of the vicinity aswell as the learning rate, decrease monotonically in thecourse of the learning process. Thus, at the end of thetraining phase only small changes are made to fine tunethe map. After training, the SOM represents a two-dimen-sional map of the input space, where each neuron representssome portion of the input space. Furthermore, the distancerelationships of the input space are mostly preserved in themap. For a more detailed discussion of SOMs refer toHagenauer and Helbich (2013).
In order to analyze and interpret the map’s structure,U-matrices (Ultsch and Siemon 1990) are a convenientmethod to visualize SOMs (Vesanto 1999). The U-matrixplots the differences of neighboring neurons’ prototypevectors within the map by means of a color scale.Clusters become visible in the U-matrix by distinct out-lines of the cluster boundaries. If no crisp outlines arevisible, then clusters in the input space are less distinct.Thus, the U-matrix shows both present cluster structuresand the quality of the clustering. To avoid visual clusterdelimitations which are subjective to the analyst, awatershed algorithm (Vincent and Soille 1991) is oftenapplied to segment the U-matrix computationally.
Bivariate K(d)-function
To explore the mapped coordinates of the IPs of eachidentified SOM cluster, the bivariate extension of theRipley’s K(d)-function is employed. This function is awidely used second-order statistic (e.g., Helbich 2012)and allows determining the strength and type of the spatialassociation between different spatial point patterns (Dixon
Table 1. Ambiguous or unclear word stems and their meaning.
Word stem Explanation Word stem Explanation
Deputi Deputy Roug Baton RougeUnusu Unusual Lpr License plate recognitionCalcasieu Calcasieu Parish Boi BoyDet Abbreviation of detective Detect DetectiveViewip Part of a referred URL Mailto Reference to an email addressGoe Goes Lspcl Louisiana State Police Crime LaboratoryImpala Chevrolet Impala Gmc General Motors CompanyPiec Pieces Leo Part of a referred URL
4 M. Helbich et al.
Dow
nloa
ded
by [
Uni
vers
itaet
sbib
lioth
ek H
eide
lber
g] a
t 23:
17 2
9 A
pril
2013
2002). In this case, it is tested whether the IPs which areseparated by the SOM in distinct clusters, relate to eachother in geographic space. Following Rowlingson andDiggle (1993), the bivariate K(d)-function is formallydefined as the expected number of points of pattern A,i.e., points of SOM cluster 1, within a distance d of anarbitrary point of pattern B, i.e., points of SOM cluster 2,divided by the overall density of the points in pattern A. Inaccordance to Helbich (2012) and for ease of interpreta-tion and practicality, the function is often transformed tothe so-called L(d)-function. Thus, positive L(d)-functionvalues represent attraction between the two point patterns,while L(d)-function values below 0 indicate repulsion ofthe two point distributions at a given distance d. If L(d) equals 0, the null hypothesis of non-spatial interactionmust be accepted. The significance level represented byconfidence envelopes is determined through simulations oftoroidal shifts (Dixon 2002).
Results
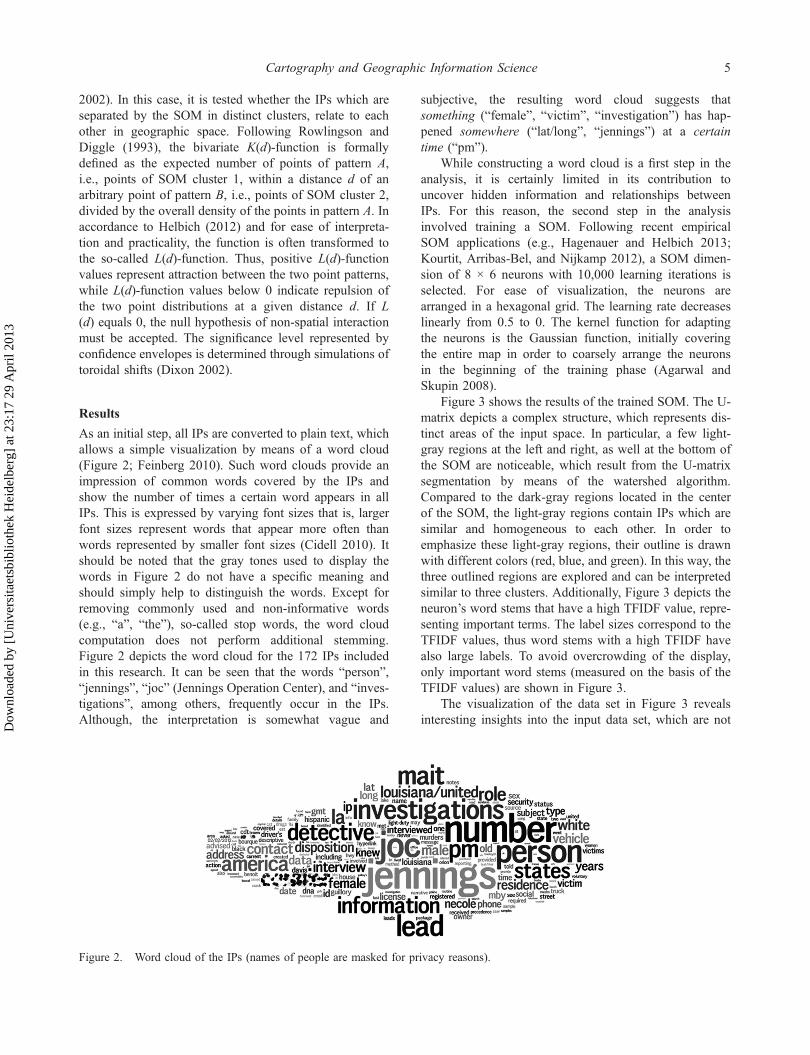
As an initial step, all IPs are converted to plain text, whichallows a simple visualization by means of a word cloud(Figure 2; Feinberg 2010). Such word clouds provide animpression of common words covered by the IPs andshow the number of times a certain word appears in allIPs. This is expressed by varying font sizes that is, largerfont sizes represent words that appear more often thanwords represented by smaller font sizes (Cidell 2010). Itshould be noted that the gray tones used to display thewords in Figure 2 do not have a specific meaning andshould simply help to distinguish the words. Except forremoving commonly used and non-informative words(e.g., “a”, “the”), so-called stop words, the word cloudcomputation does not perform additional stemming.Figure 2 depicts the word cloud for the 172 IPs includedin this research. It can be seen that the words “person”,“jennings”, “joc” (Jennings Operation Center), and “inves-tigations”, among others, frequently occur in the IPs.Although, the interpretation is somewhat vague and
subjective, the resulting word cloud suggests thatsomething (“female”, “victim”, “investigation”) has hap-pened somewhere (“lat/long”, “jennings”) at a certaintime (“pm”).
While constructing a word cloud is a first step in theanalysis, it is certainly limited in its contribution touncover hidden information and relationships betweenIPs. For this reason, the second step in the analysisinvolved training a SOM. Following recent empiricalSOM applications (e.g., Hagenauer and Helbich 2013;Kourtit, Arribas-Bel, and Nijkamp 2012), a SOM dimen-sion of 8 × 6 neurons with 10,000 learning iterations isselected. For ease of visualization, the neurons arearranged in a hexagonal grid. The learning rate decreaseslinearly from 0.5 to 0. The kernel function for adaptingthe neurons is the Gaussian function, initially coveringthe entire map in order to coarsely arrange the neuronsin the beginning of the training phase (Agarwal andSkupin 2008).
Figure 3 shows the results of the trained SOM. The U-matrix depicts a complex structure, which represents dis-tinct areas of the input space. In particular, a few light-gray regions at the left and right, as well at the bottom ofthe SOM are noticeable, which result from the U-matrixsegmentation by means of the watershed algorithm.Compared to the dark-gray regions located in the centerof the SOM, the light-gray regions contain IPs which aresimilar and homogeneous to each other. In order toemphasize these light-gray regions, their outline is drawnwith different colors (red, blue, and green). In this way, thethree outlined regions are explored and can be interpretedsimilar to three clusters. Additionally, Figure 3 depicts theneuron’s word stems that have a high TFIDF value, repre-senting important terms. The label sizes correspond to theTFIDF values, thus word stems with a high TFIDF havealso large labels. To avoid overcrowding of the display,only important word stems (measured on the basis of theTFIDF values) are shown in Figure 3.
The visualization of the data set in Figure 3 revealsinteresting insights into the input data set, which are not
Figure 2. Word cloud of the IPs (names of people are masked for privacy reasons).
Cartography and Geographic Information Science 5
Dow
nloa
ded
by [
Uni
vers
itaet
sbib
lioth
ek H
eide
lber
g] a
t 23:
17 2
9 A
pril
2013

apparent when simply using the word cloud. As far as thethree revealed clusters are concerned, 17 IPs are assignedto cluster 1, 11 IPs to cluster 2, and 44 IPs to cluster 3.All other IPs cannot be mapped to a distinct cluster, suchas the central area of the SOM. At first it is noticeablethat some metadata word stems like “viewip” appear inthe map, which indicates that they exhibit high TFIDFvalues. Further, some relationships between differentterms are apparent. Words, such as “sex”, “boyfriend”,and “blood” are all located in the same cluster, indicatingthat IPs that include these words share many similarities.Also the murder victims “Kristen” (Kristen Lopez) and“Brittnei” (Brittney Gary) are mapped to regions in themap (in the lower right) that are close to each other. Itthus can be concluded that the criminal investigationsregarding both victims tended to be closely related. Incontrast, the word “laconia” referring to another victim(Laconia Brown), is located far away from the two pre-viously mentioned victims. This indicates that for somereason there is some difference in the conducted criminalinvestigations between this last and the two previouslymentioned victims. It is interesting to note that not allmurder victims are represented in Figure 3. The reasonfor this is that the records that have high TFIDF valuesfor such victims’ name stems are mostly dissimilar to
each other, so that the emergence of high values for thevictims’ name stems is prevented by the training algo-rithm of the SOM.
In order to characterize the outlined clusters in amore general fashion, the mean of the cluster’s proto-type vectors are calculated. The five highest TFIDFvalues and the corresponding word stems of the result-ing mean vectors for the different clusters are shown inTable 2 (higher mean TFIDF values refer to moreimportant terms).
Cluster 1 shows a notable high value for “ln1”, whichrefers to the word stem of a common last name. In fact,many interrogations of different people with that last namehave been made in the course of the criminal investigationof the last victim, Necole Guillory. It is noticeable, that theword stem of “ln1” is closely related to “laconia”, which ismapped just outside the boundaries of cluster 1. Comparedto cluster 1 and 3, cluster 2 has medium TFIDF values.Cluster 3 has the highest mean TFIDF value for the wordstem of the first name “fn1”. Furthermore, cluster 3 hasalso a high mean TFIDF value for the word stem of thelast name “ln3”. It should be noted that the criminalinvestigations refer to people with that particular lastname quite often. The word stem of the last name “ln3”is mapped to the same neuron as the words “lafayette” and
Figure 3. U-matrix. The borders of three clusters are shown in different colors (cluster 1 = red, cluster 2 = green, cluster 3 = blue).
6 M. Helbich et al.
Dow
nloa
ded
by [
Uni
vers
itaet
sbib
lioth
ek H
eide
lber
g] a
t 23:
17 2
9 A
pril
2013
the stem of the first name “fn2”, suggesting that there is aclose relationship between these three words. “Lafayette”refers to the name of a city and a parish in Louisiana.Lafayette Parish is very close to JDP and both the city ofLafayette and Jennings are located on interstate I-10.Furthermore, the three clusters listed in Table 2 havehigh mean TFIDF values for general word stems that arelikely to appear often when transcribing police recordeddata and information that is voluntarily provided and/orsourced from eyewitness accounts and other publicsources (e.g., chief, obtain, involve, prepare, info).Moreover, the mean TFIDF values of these word stemsnotably differ between the three clusters. Thus, it can besummarized that distinctive patterns appear in the IPsrelated to the homicide.
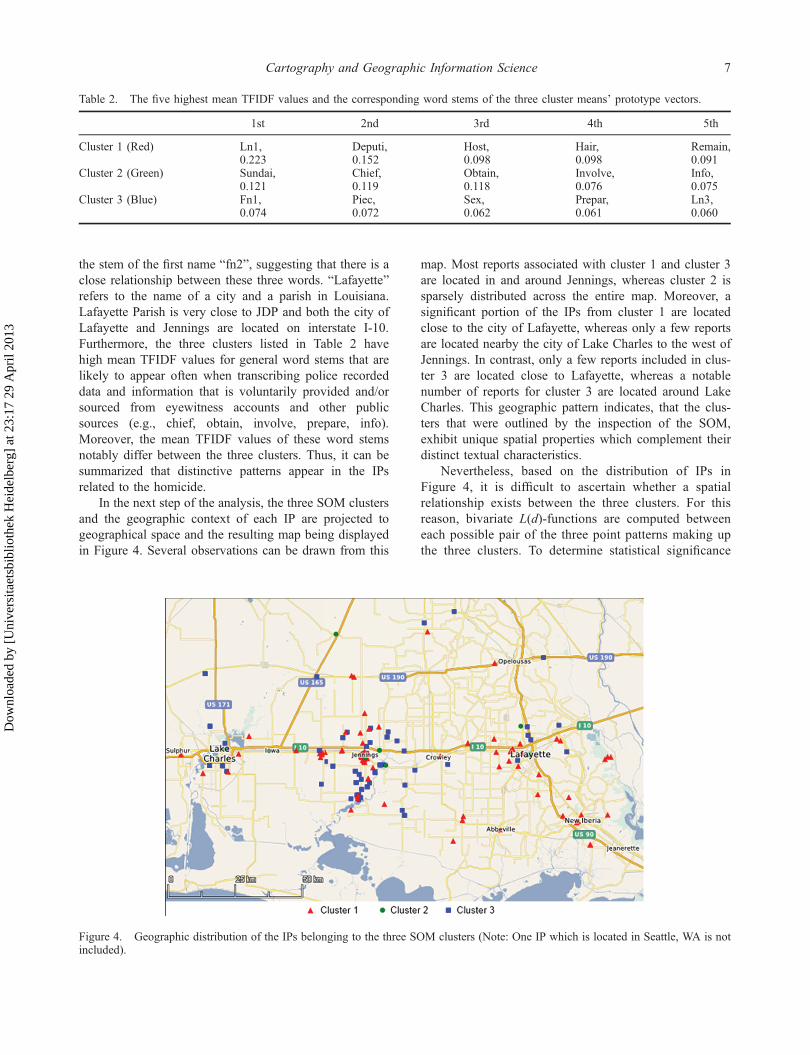
In the next step of the analysis, the three SOM clustersand the geographic context of each IP are projected togeographical space and the resulting map being displayedin Figure 4. Several observations can be drawn from this
map. Most reports associated with cluster 1 and cluster 3are located in and around Jennings, whereas cluster 2 issparsely distributed across the entire map. Moreover, asignificant portion of the IPs from cluster 1 are locatedclose to the city of Lafayette, whereas only a few reportsare located nearby the city of Lake Charles to the west ofJennings. In contrast, only a few reports included in clus-ter 3 are located close to Lafayette, whereas a notablenumber of reports for cluster 3 are located around LakeCharles. This geographic pattern indicates, that the clus-ters that were outlined by the inspection of the SOM,exhibit unique spatial properties which complement theirdistinct textual characteristics.
Nevertheless, based on the distribution of IPs inFigure 4, it is difficult to ascertain whether a spatialrelationship exists between the three clusters. For thisreason, bivariate L(d)-functions are computed betweeneach possible pair of the three point patterns making upthe three clusters. To determine statistical significance
Figure 4. Geographic distribution of the IPs belonging to the three SOM clusters (Note: One IP which is located in Seattle, WA is notincluded).
Table 2. The five highest mean TFIDF values and the corresponding word stems of the three cluster means’ prototype vectors.
1st 2nd 3rd 4th 5th
Cluster 1 (Red) Ln1, Deputi, Host, Hair, Remain,0.223 0.152 0.098 0.098 0.091
Cluster 2 (Green) Sundai, Chief, Obtain, Involve, Info,0.121 0.119 0.118 0.076 0.075
Cluster 3 (Blue) Fn1, Piec, Sex, Prepar, Ln3,0.074 0.072 0.062 0.061 0.060
Cartography and Geographic Information Science 7
Dow
nloa
ded
by [
Uni
vers
itaet
sbib
lioth
ek H
eide
lber
g] a
t 23:
17 2
9 A
pril
2013
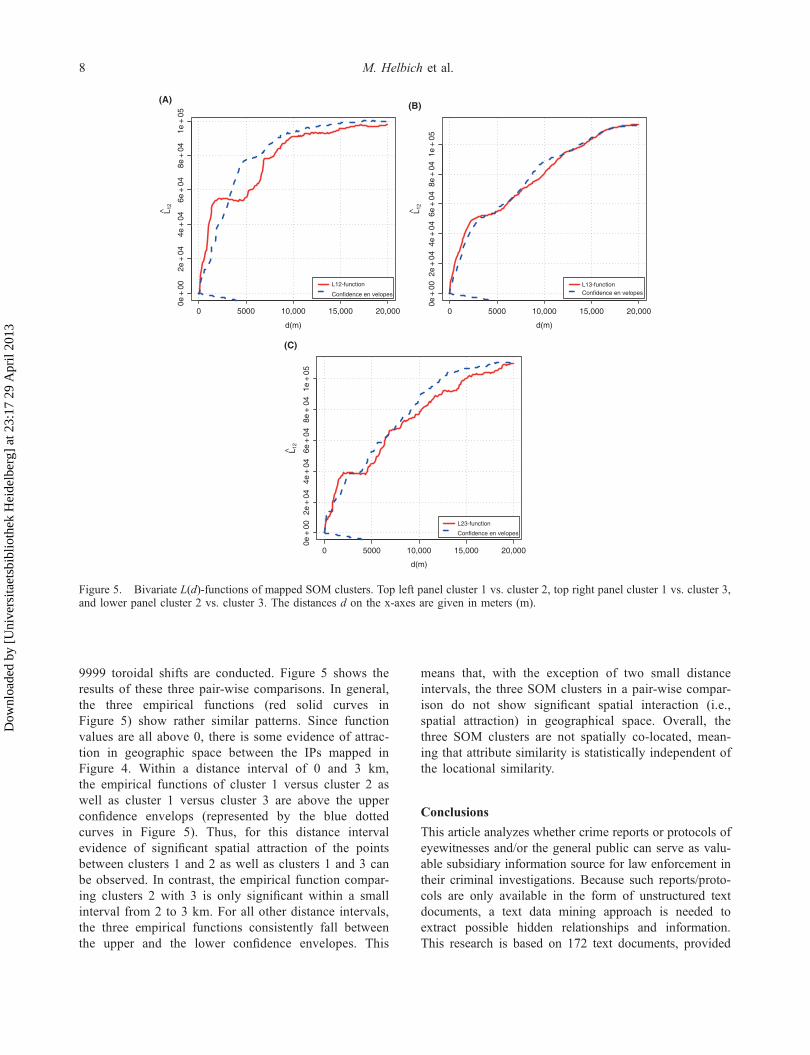
9999 toroidal shifts are conducted. Figure 5 shows theresults of these three pair-wise comparisons. In general,the three empirical functions (red solid curves inFigure 5) show rather similar patterns. Since functionvalues are all above 0, there is some evidence of attrac-tion in geographic space between the IPs mapped inFigure 4. Within a distance interval of 0 and 3 km,the empirical functions of cluster 1 versus cluster 2 aswell as cluster 1 versus cluster 3 are above the upperconfidence envelops (represented by the blue dottedcurves in Figure 5). Thus, for this distance intervalevidence of significant spatial attraction of the pointsbetween clusters 1 and 2 as well as clusters 1 and 3 canbe observed. In contrast, the empirical function compar-ing clusters 2 with 3 is only significant within a smallinterval from 2 to 3 km. For all other distance intervals,the three empirical functions consistently fall betweenthe upper and the lower confidence envelopes. This
means that, with the exception of two small distanceintervals, the three SOM clusters in a pair-wise compar-ison do not show significant spatial interaction (i.e.,spatial attraction) in geographical space. Overall, thethree SOM clusters are not spatially co-located, mean-ing that attribute similarity is statistically independent ofthe locational similarity.
Conclusions
This article analyzes whether crime reports or protocols ofeyewitnesses and/or the general public can serve as valu-able subsidiary information source for law enforcement intheir criminal investigations. Because such reports/proto-cols are only available in the form of unstructured textdocuments, a text data mining approach is needed toextract possible hidden relationships and information.This research is based on 172 text documents, provided
0 5000 10,000 15,000
(C)
20,000
0e +
00
2e +
04
4e +
04
6e +
04
8e +
04
1e +
05
d(m)
L23-function
Confidence en velopes
L̂ 12
(B)(A)
0 5000 10,000 15,000 20,000
0e +
00
2e +
04
4e +
04
6e +
04
8e +
04
1e +
05
d(m)
L13-functionConfidence en velopes
0 5000 10,000 15,000 20,000
0e +
00
2e +
04
4e +
04
6e +
04
8e +
04
1e +
05
d(m)
L̂ 12
L̂ 12
L12-function
Confidence en velopes
Figure 5. Bivariate L(d)-functions of mapped SOM clusters. Top left panel cluster 1 vs. cluster 2, top right panel cluster 1 vs. cluster 3,and lower panel cluster 2 vs. cluster 3. The distances d on the x-axes are given in meters (m).
8 M. Helbich et al.
Dow
nloa
ded
by [
Uni
vers
itaet
sbib
lioth
ek H
eide
lber
g] a
t 23:
17 2
9 A
pril
2013
as IPs by the Task Force investigating a serial homicidecase in the city of Jennings, LA. The methodologicalapproach analyzing the content of these text documentsfocuses on the visualization and clustering capabilities ofan unsupervised neural network approach, specifically theSOM algorithm.
Based on the word content of each text document, theSOM analysis resulted in three distinct clusters of all 172IPs. The mapping of the IPs from each cluster as pointpatterns in geographical space allows the spatial arrange-ment of such IPs to be explored further. The results provideevidence that the three attribute-based IP clusters that wereoriginally extracted by the SOM show only a partiallysignificant spatial association in geographic space. Theresults from this data mining exercise have already beenpresented to and shared with the Jennings Task Force,which confirmed that this information was previouslyunknown and may provide new and important clues inthis criminal investigation. However, due to confidentialityreasons and this being still an open criminal investigation,the authors of this research cannot go into more detail as faras the specifics of this “previously unknown information”and “new and important clues” are concerned.
This research demonstrates that such “collective surveil-lance” by individuals who serve as “human crime sensors”providing voluntary information have the potential tobecome a powerful data source to possibly revolutionizecrime protection and crime combat methods. Besides theinterpretation of the results, it should be noted that theeffectiveness and the impact of the proposed multistepapproach to eventually solving a crime is partly affectedby the subjective interpretation of the analyst and difficult toevaluate, unless it would directly lead to the apprehensionof the serial offender. However, criminal investigations thathave already been solved would allow the evaluation of themultistep approach applied in this research. This can bedone by comparing trends, relationships, novel information,etc. derived from the data mining results with the specificinformation that led to the arrest of the offender. Althoughthe evaluation of exploratory spatial data analysis results isinherently challenging and remains an active research topic,the results from this research recommend law enforcementagencies to undertake an ex post evaluation as soon as thecase is solved. As a matter of fact, one future researchdirection that the authors of this article take is to evaluatethe proposed multistep approach using “collective surveil-lance” information from the community (students, faculty,and staff) of the Louisiana State University (LSU) in BatonRouge with solved crime cases that have been collected andinvestigated by the LSU police.
AcknowledgementsMarco Helbich and Julian Hagenauer have been funded by theGerman Research Foundation’s (DFG) Global Networks
Initiative of Excellence of the University of Heidelberg. MarcoHelbich also acknowledges the Alexander von Humboldt-Foundation for funding. We gratefully acknowledge support forthis research from Jerry Ratcliffe and Spencer Chainey. We alsothank Maxim Rylov, who helped us with the visualization of thecontent of the information packages using the MapSurfer.NETsoftware and the AutoCarto 2012 program committee for select-ing this article for possible inclusion in this Special Issueof CaGIS.
ReferencesAgarwal, P., and A. Skupin, eds. 2008. Self-Organising Maps:
Applications in Geographic Information Science. Hoboken:Wiley.
Alruily, M., A. Ayesh, and A. Al-Marghilani. 2010. “Using SelfOrganizing Map to Cluster Arabic Crime Documents.” InProceedings of the International Multiconference onComputer Science and Information Technology, 357–363.Los Alamitos, CA: IEEE Computer Society Press.
Brantingham, P. J., and P. L. Brantingham, eds. 1981.Environmental Criminology. Beverly Hills, CA: Sage.
Chainey, S., and J. H. Ratcliffe. 2005. GIS and Crime Mapping.Chichester: Wiley.
Chau, M., J. J. Xu, and H. Chen. 2002. “Extracting MeaningfulEntities from Police Narrative Reports.” In Proceedings ofthe National Conference for Digital Government Research,271–275 Los Angeles, CA: Digital Government Society ofNorth America.
Chen, H., H. Atabakhsh, T. Petersen, J. Schroeder, T. Buetow, L.Chaboya, C. O’Toole, et al. 2003. “COPLINK: Visualizationfor Crime Analysis.” In Proceedings of the 2003 AnnualNational Conference on Digital Government Research,1–6. Boston, MA: Digital Government Society of NorthAmerica.
Chen, H., W. Chung, J. J. Xu, G. W. Y. Qin, and M. Chau. 2004.“Crime Data Mining: A General Framework and SomeExamples.” Computer 37: 50–56.
Chen, H., and F.-Y. Wang. 2005. “Artificial Intelligencefor Homeland Security.” IEEE Intelligent Systems 20:12–16.
Cidell, J. 2010. “Content Clouds as Exploratory Qualitative DataAnalysis.” Area 42: 514–523.
Clarke, R., and D. Cornish. 1985. “Modeling Offenders’Decisions: A Framework for Research and Policy.” CrimeJustice 6: 147–185.
Cohen, L., and M. Felson. 1979. “Social Change and Crime RateTrends: A Routine Activity Approach.” AmericanSociological Review 44: 588–608.
Costa, A. M. 2010. “The Economics of Crime: A Discipline tobe Invented and a Nobel Prize to be Awarded.” Journal ofPolicy Modeling 32: 648–661.
Delen, D., and M. D. Crossland. 2008. “Seeding the Survey andAnalysis of Research Literature with Text Mining.” ExpertSystems and Applications 34: 1707–1720.
Dixon, P. 2002. “Ripley’s K Function.” In Encyclopedia ofEnvironmetrics, edited by A. El-Shaarawi, and W.Piegorsch, Vol. 3, 1796–1803. Chichester: Wiley.
Feinberg, J. 2010. “Wordle.” In Beautiful Visualization. Lookingat Data through the Eyes of Experts, edited by J. Steele, andN. Iliinsky, 37–58. Sebastopol: O’Reilly.
Fox, J. A., and J. Levin. 2010. Extreme Killing: UnderstandingSerial and Mass Murder. 2nd ed. Thousand Oaks: Sage.
Goodchild, M. 2007. “Citizens as Sensors: The World ofVolunteered Geography.” GeoJournal 69: 211–221.
Cartography and Geographic Information Science 9
Dow
nloa
ded
by [
Uni
vers
itaet
sbib
lioth
ek H
eide
lber
g] a
t 23:
17 2
9 A
pril
2013
Hagenauer, J., and M. Helbich. 2013. “Contextual Neural Gasfor Spatial Clustering and Analysis.” International Journalof Geographical Information Science 27: 251–266.
Hagenauer, J., M. Helbich, and M. Leitner. 2011. “Visualizationof Crime Trajectories with Self-Organizing Maps: A CaseStudy on Evaluating the Impact of Hurricanes onSpatiotemporal Crime Hotspots.” 25th. International carto-graphic conference, Paris, July 3–8.
Han, J., and M. Kamber. 2011. Data Mining. Concepts &Techniques. Amsterdam: MK.
Harman, D. 1992. “Ranking Algorithms.” In Information Retrieval.Data Structures & Algorithms, edited by W. B. Frakes, and R.Baeza-Yates, 363–392. Upper Saddle River, NJ: Prentice Hall.
Helbich, M. 2012. “Beyond Postsuburbia? MultifunctionalService Agglomeration in Vienna’s Urban Fringe.” Journalof Economic & Social Geography 103: 39–52.
Helbich, M., and M. Leitner. 2012. “Evaluation of SpatialCluster Detection Algorithms for Crime Locations.” InChallenges at the Interface of Data Analysis, ComputerScience, and Optimization. Studies in Classification, DataAnalysis, and Knowledge Organization, edited by W. A.Gaul, A. Geyer-Schulz, L. Schmidt-Thieme, and J. Kunze193–201. Heidelberg: Springer.
Jones, C. B., and R. S. Purves. 2008. “Geographical InformationRetrieval.” International Journal of GeographicalInformation Science 22: 219–228.
Kaski, S., and T. Kohonen. 1996. “Exploratory Data Analysis byThe Self-Organizing Map: Structures of Welfare and Poverty.”In: Proceedings of the Third International Conference onNeural Networks in the Capital Markets, 498–507.Singapore: World Scientific.
Kohonen, T. 2001. Self-Organizing Maps. New York: Springer.Kourtit, K., D. Arribas-Bel, and P. Nijkamp. 2012. “High
Performers in Complex Spatial Systems: A Self-OrganizingMapping Approach with Reference to the Netherlands.”Annals of Regional Science 48: 501–527.
Ku, C. H., A. Iriberri, and G. Leroy. 2008. “Crime InformationExtraction from Police and Witness Narrative Reports.”
IEEE international conference on technologies for homelandsecurity, May 12–13.
Leitner, M., and M. Helbich. 2011. “The Impact of Hurricanes onCrime: A Spatio-Temporal Analysis in the City of Houston,Texas.” Cartography and Geographic Information Science38: 214–222.
Manning, C. D., P. Raghavan, and H. Schütze. 2008.Introduction to Information Retrieval. Cambridge:Cambridge University Press.
Porter, M. F. 1980. “An Algorithm for Suffix Stripping.”Program 14: 130–137.
Quinet, K. 2011. “Prostitutes as Victims of Serial Homicide:Trends and Case Characteristics, 1970-2009.” HomicideStudies 15: 74–100.
Rowlingson, B., and P. Diggle. 1993. “SPLANCS: Spatial PointPattern Analysis Code in S-Plus.” Computers andGeosciences 19: 627–655.
Singhal, A. 2001. “Modern Information Retrieval: A BriefOverview.” IEEE Data Engineering Bulletin 24: 35–43.
Ultsch, A., and H. P. Siemon. 1990. “Kohonen’s SelfOrganizing Feature Maps for Exploratory DataAnalysis.” In: Proceedings of International NeuralNetworks Conference, 305–308. Paris: KluwerAcademic Press.
Vesanto, J. 1999. “SOM-Based Data Visualization Methods.”Intelligent Data Analysis 3: 111–126.
Vesanto, J., and E. Alhoniemi. 2000. “Clustering of the Self-Organizing Map.” IEEE Transactions on Neural Networks11: 586–600.
Vincent, L., and P. Soille. 1991. “Watersheds in Digital Spaces:An Efficient Algorithm Based on Immersion Simulations.”IEEE Transactions on Pattern Analysis and MachineIntelligence 13: 583–598.
Watts, M. J., and S. Worner. 2009. “Estimating the Risk ofInsect Species Invasion: Kohonen Self-Organising MapsVersus k-Means Clustering.” Ecological Modeling 220:821–829.
10 M. Helbich et al.
Dow
nloa
ded
by [
Uni
vers
itaet
sbib
lioth
ek H
eide
lber
g] a
t 23:
17 2
9 A
pril
2013
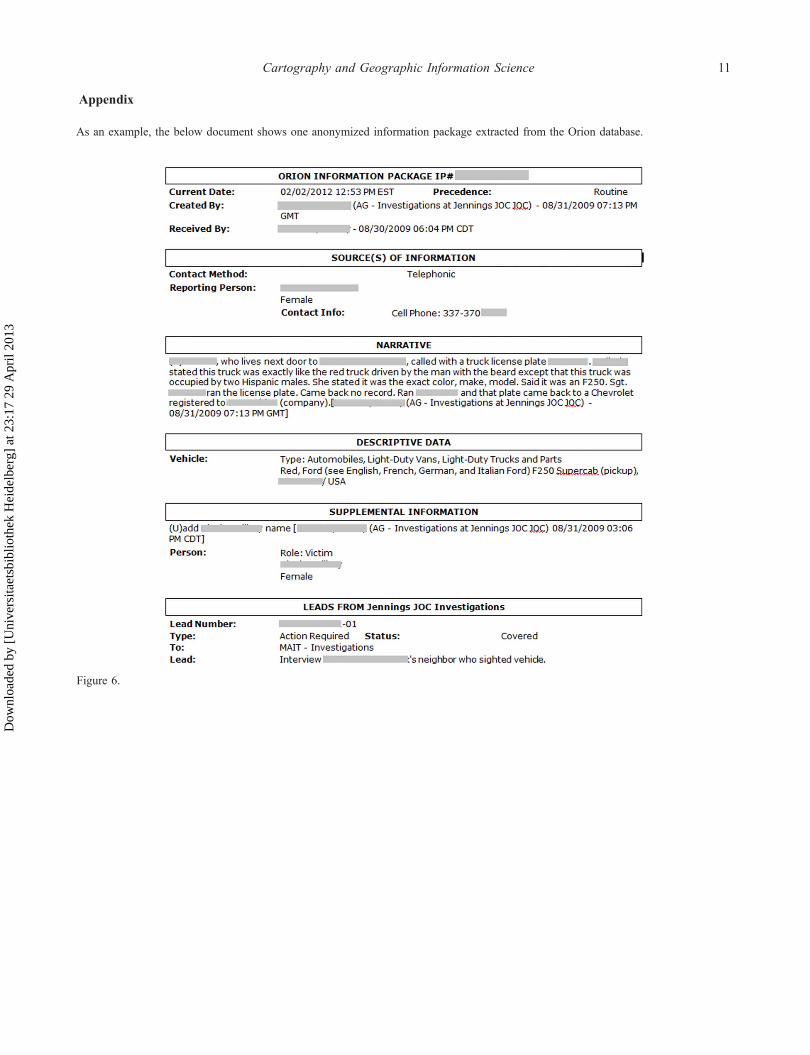
Appendix
Figure 6.
As an example, the below document shows one anonymized information package extracted from the Orion database.
Cartography and Geographic Information Science 11
Dow
nloa
ded
by [
Uni
vers
itaet
sbib
lioth
ek H
eide
lber
g] a
t 23:
17 2
9 A
pril
2013