Embed Size (px)
Citation preview
Potsdam Institute for Climate Impact ResearchResearch Domain Sustainable Solutions
Exploration of the SSP space with the ReMIND-MAgPIE
integrated assessment frameworkElmar Kriegler, Nico Bauer, Alexander Popp, David Klein
Marian Leimbach, Franziska Piontek, Lena Reuster, Gunnar Luderer, Jan-Philipp Dietrich, Benjamin Bodirsky, Lavinia Baumstark,
Jessica Strefler, Jana Schwanitz, Florian Humpenöder,Christoph Bertram, Christoph Schmitz, Hermann Lotze-Campen
SSP workshop, Snowmass, 25 July 2012

Elmar KrieglerPotsdam Institute for Climate Impact Research
Exploring the SSP space
• What IAM input assumptions tovary across SSP1, 2, 5 (beyondGDP & Pop)?
• What fossil fuel use / energydemand / emissions / forcingrange (relating to challenges formitigation) is spanned betweenSSP1 &5?
All results are preliminary!
Challenges to Adaptation
Challenges to
Mitigatio
n
SSP 2 SSP 4
SSP 3 SSP 1
Increasing
socio‐econo
mic
challenges fo
r mitigatio
n
Increasing socio‐economic challenges for adaptation
SSP 2
SSP 4SSP 1
SSP 5 SSP 3
Focus on SSP1, 2, 5 because of global market assumption in model framework

Elmar KrieglerPotsdam Institute for Climate Impact Research
Cer
eals
Oils
eeds
Puls
es
Suga
r bee
ts
Crop yieldsLand & Water constraints
LPJ (50x50 km grid)
Bioenergy price, land use emissions
MAgPIE – global land use optimisation model• spatially explicit (0.5°), 10 economic regions• 30 production activities (13 crops, livestock,
irrigation, bioenergy, land conversion)• internal feed balances, international trade• endogenous land expansion• endogenous technological change
Bioe
nerg
y
Lotze-Campen , Popp et al. (2008), Agricultural Economics
LPJmL - global vegetation and hydrology model
Model framework
ReMIND - global energy-economy-climate model• Ramsey optimal growth model• 11 economic regions• detailed energy sector (~70 conversion techs)• international trade (capital, emissions allowances, oil, coal, gas, biomass)
Biophysical inputs
Bioenergy demand, emissions price
Climate projection
Leimbach, Bauer, Baumstark, Edenhofer (2009) Environ. Modeling and AssessmentBauer, Baumstark, Leimbach (2012) Climatic ChangeLuderer, Pietzcker, Kriegler, Haller, Bauer (2012) Energy Economics
Elmar KrieglerPotsdam Institute for Climate Impact Research
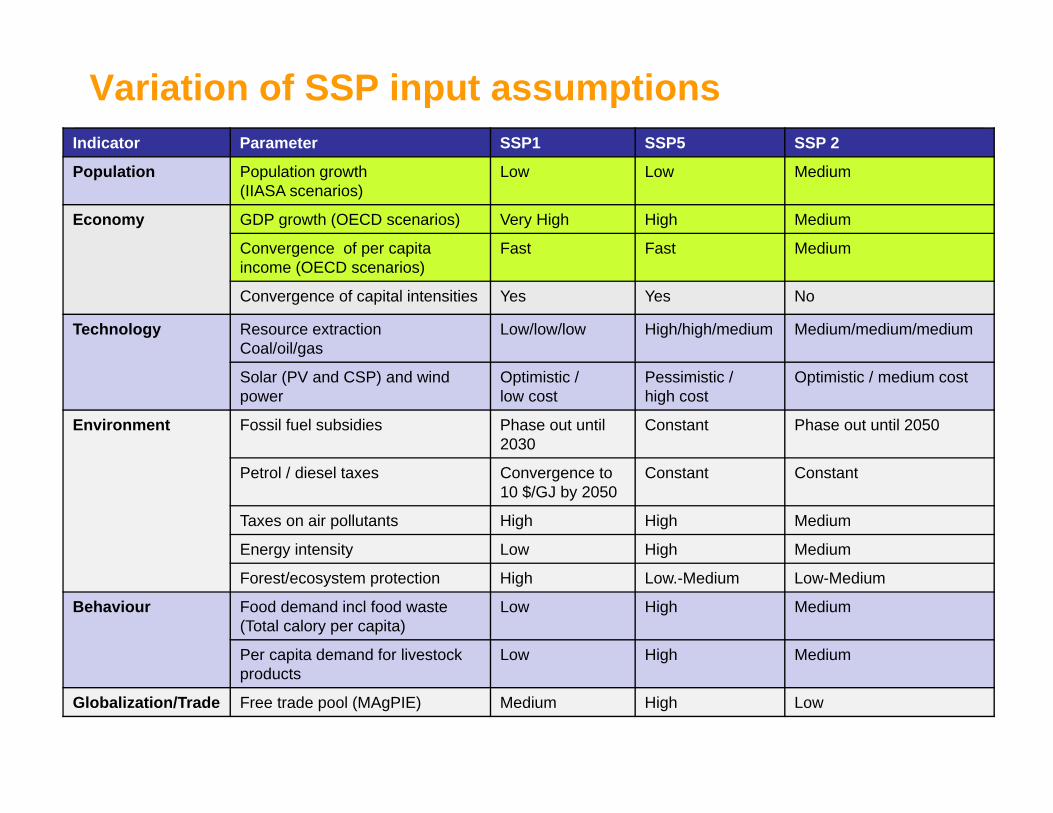
Variation of SSP input assumptionsIndicator Parameter SSP1 SSP5 SSP 2
Population Population growth(IIASA scenarios)
Low Low Medium
Economy GDP growth (OECD scenarios) Very High High Medium
Convergence of per capitaincome (OECD scenarios)
Fast Fast Medium
Convergence of capital intensities Yes Yes No
Technology Resource extractionCoal/oil/gas
Low/low/low High/high/medium Medium/medium/medium
Solar (PV and CSP) and wind power
Optimistic / low cost
Pessimistic /high cost
Optimistic / medium cost
Environment Fossil fuel subsidies Phase out until2030
Constant Phase out until 2050
Petrol / diesel taxes Convergence to10 $/GJ by 2050
Constant Constant
Taxes on air pollutants High High Medium
Energy intensity Low High Medium
Forest/ecosystem protection High Low.-Medium Low-Medium
Behaviour Food demand incl food waste(Total calory per capita)
Low High Medium
Per capita demand for livestock products
Low High Medium
Globalization/Trade Free trade pool (MAgPIE) Medium High Low

Elmar KrieglerPotsdam Institute for Climate Impact Research
SSP Population Scenarios (IIASA)
0
1000
2000
3000
4000
5000
6000
7000
8000
9000
2010 2020 2030 2040 2050 2060 2070 2080 2090 2100
SSP1 AFR
LAM
MEA
OAS
USA
RUS
JPN
IND
CHN
EUR
ROW 0
2000
4000
6000
8000
10000
12000
2010 2020 2030 2040 2050 2060 2070 2080 2090 2100
SSP2
0
1000
2000
3000
4000
5000
6000
7000
8000
9000
2010 2020 2030 2040 2050 2060 2070 2080 2090 2100
SSP5
Population in million

Elmar KrieglerPotsdam Institute for Climate Impact Research
SSP GDP scenarios (OECD)
0
50000
100000
150000
200000
250000
300000
350000
400000
450000
500000
2010 2020 2030 2040 2050 2060 2070 2080 2090 2100
SSP1 AFR
LAM
MEA
OAS
USA
RUS
JPN
IND
CHN
EUR
ROW 0
50000
100000
150000
200000
250000
300000
350000
400000
2010 2020 2030 2040 2050 2060 2070 2080 2090 2100
SSP2
0
100000
200000
300000
400000
500000
600000
700000
800000
2010 2020 2030 2040 2050 2060 2070 2080 2090 2100
SSP5
GDP in billion USD(2005) at MER
Elmar KrieglerPotsdam Institute for Climate Impact Research
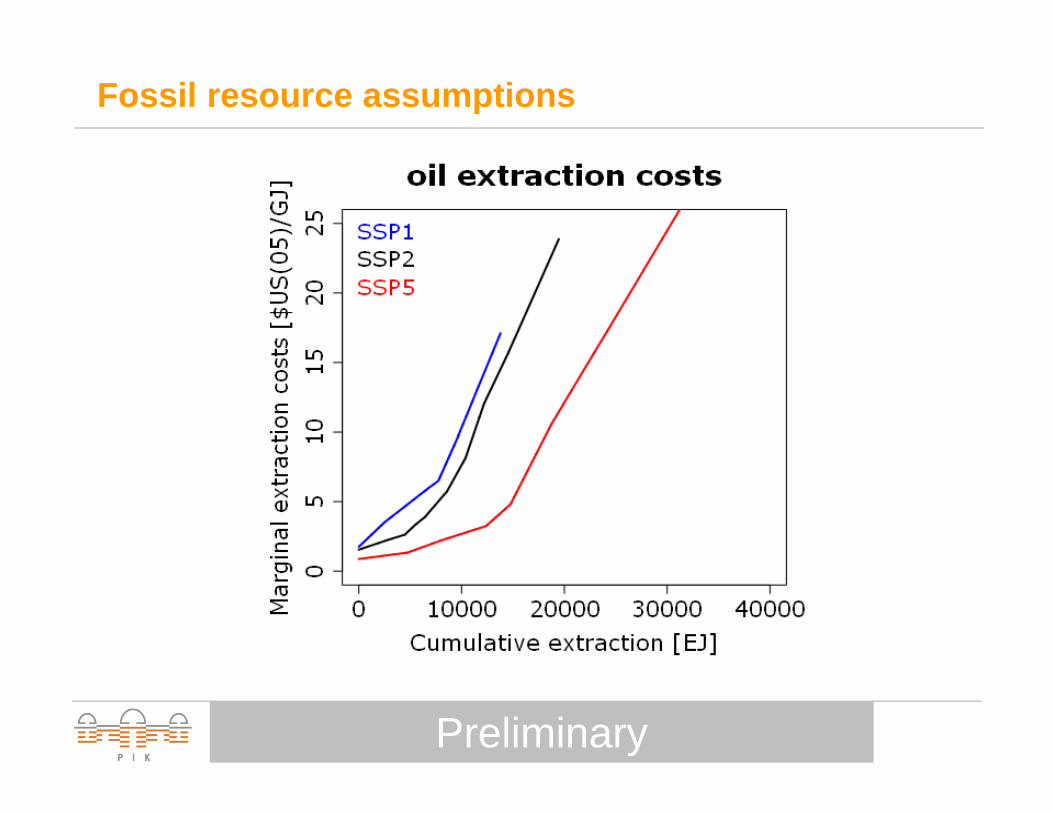
Fossil resource assumptions
Oil
Preliminary

Elmar KrieglerPotsdam Institute for Climate Impact Research
Assumptions on final energy intensity improvements
Preliminary

Elmar KrieglerPotsdam Institute for Climate Impact Research
Energy intensity improvements – Regional pattern
SSAEU27
CHN
USA
Preliminary
SSA EU27
CHN
USA

Elmar KrieglerPotsdam Institute for Climate Impact Research
Forest/ecoystem protection SSP1 vs SSP5
Elmar KrieglerPotsdam Institute for Climate Impact Research
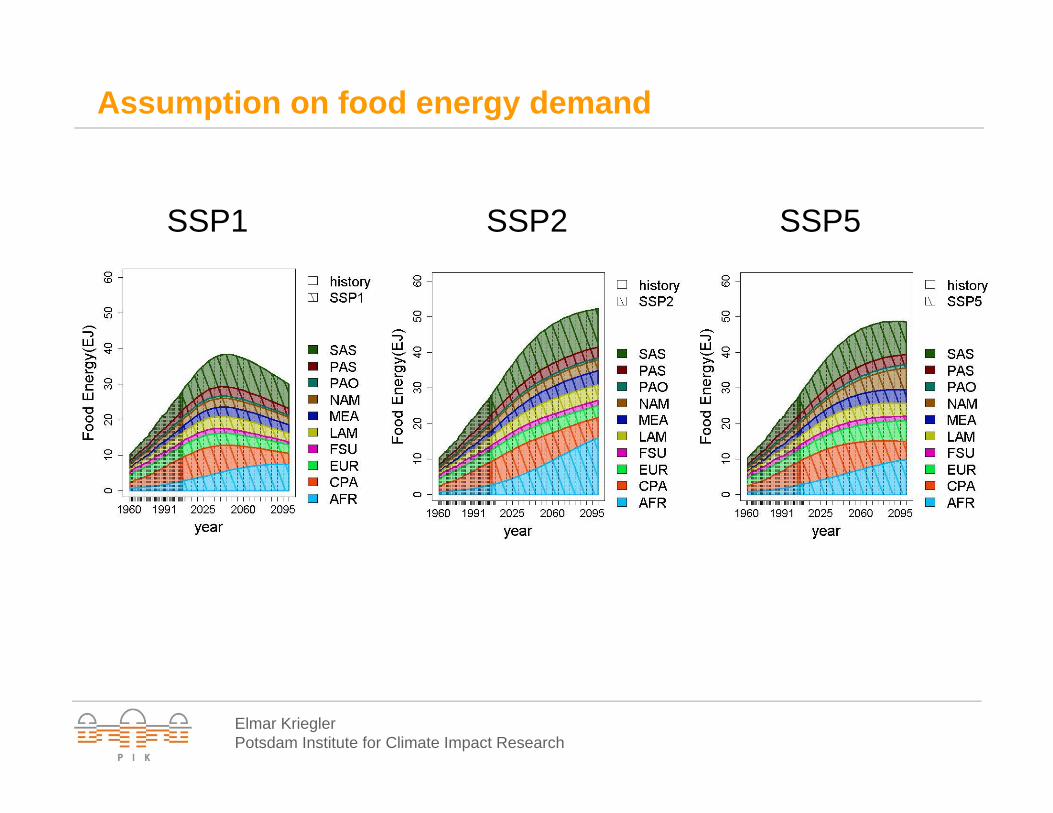
Assumption on food energy demand
SSP1 SSP2 SSP5

Elmar KrieglerPotsdam Institute for Climate Impact Research
Preliminary results
from ReMIND-MAgPIE
based on these input assumptions

Elmar KrieglerPotsdam Institute for Climate Impact Research
SSP1 SSP2 SSP5
Reference
Energy demand in SSP reference cases
Preliminary results

Elmar KrieglerPotsdam Institute for Climate Impact Research
SSP1 SSP2 SSP5
450ppm
Reference
Energy demand in SSP reference and policy cases
Preliminary results
Elmar KrieglerPotsdam Institute for Climate Impact ResearchPreliminary results
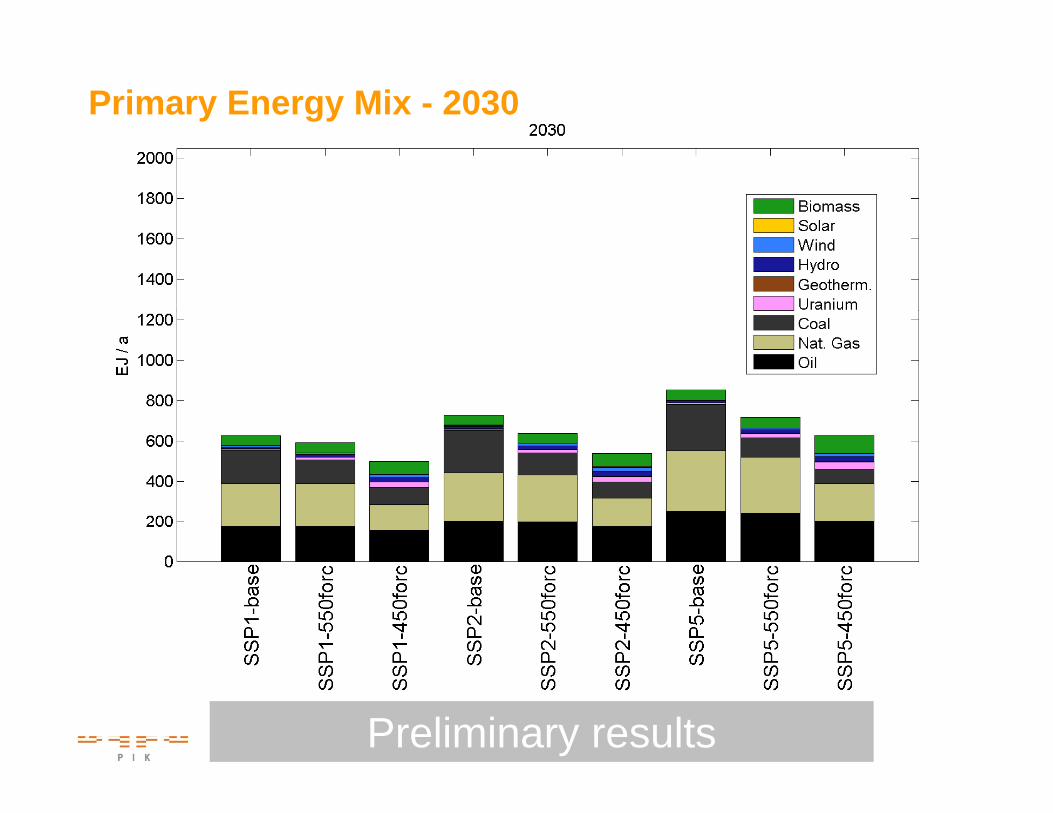
Primary Energy Mix - 2030

Elmar KrieglerPotsdam Institute for Climate Impact ResearchPreliminary results
Primary Energy Mix – 2050

Elmar KrieglerPotsdam Institute for Climate Impact ResearchPreliminary results
Primary Energy Mix - 2070
Elmar KrieglerPotsdam Institute for Climate Impact Research
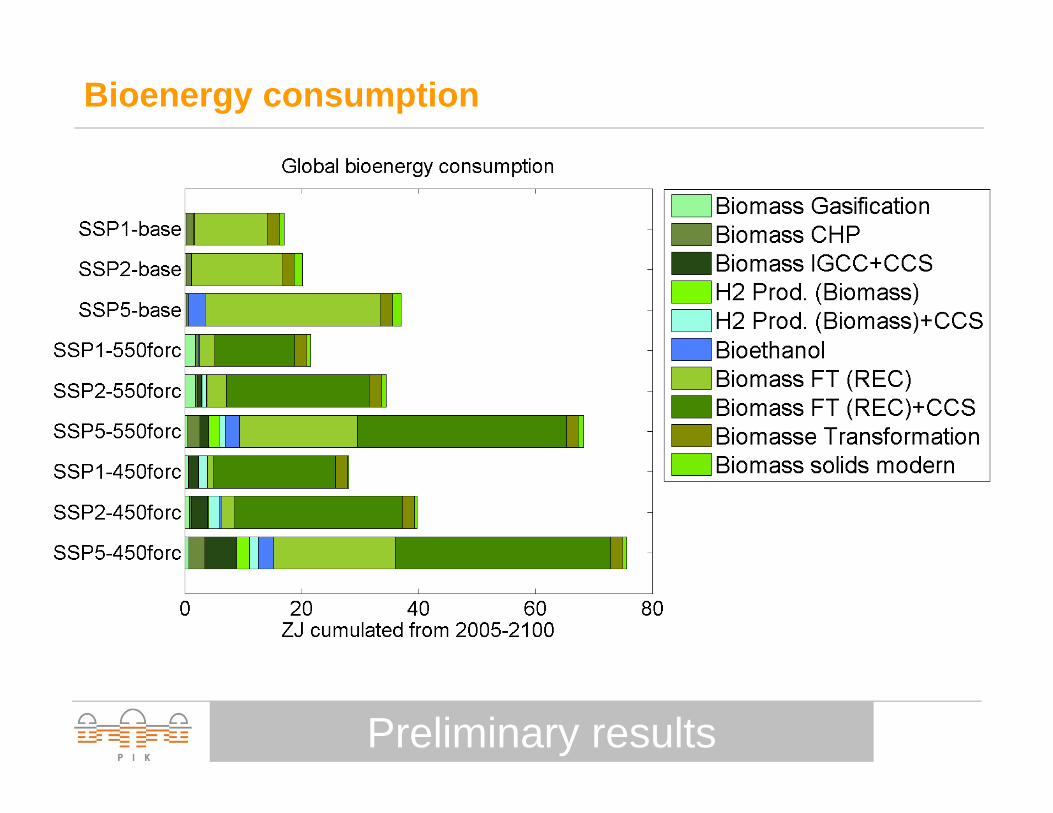
Bioenergy consumption
Preliminary results

Elmar KrieglerPotsdam Institute for Climate Impact Research
Global Regional (SSP2)
Bioenergy supply curve (MAgPIE emulation)
Purpose-grown energy crops only
Purpose-grown bioenergy use in year 2100 in 450 ppm scenario
Preliminary results

Elmar KrieglerPotsdam Institute for Climate Impact Research
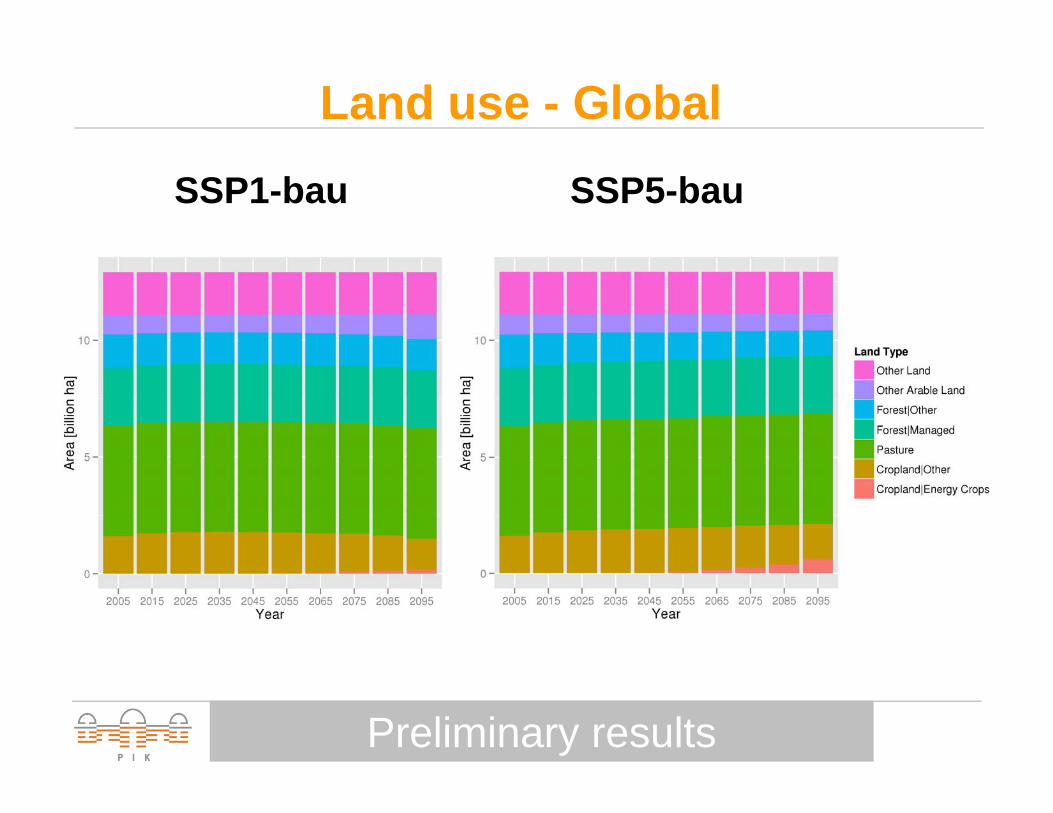
Land use - Global
Preliminary results
SSP1-bau SSP5-bau

Elmar KrieglerPotsdam Institute for Climate Impact Research
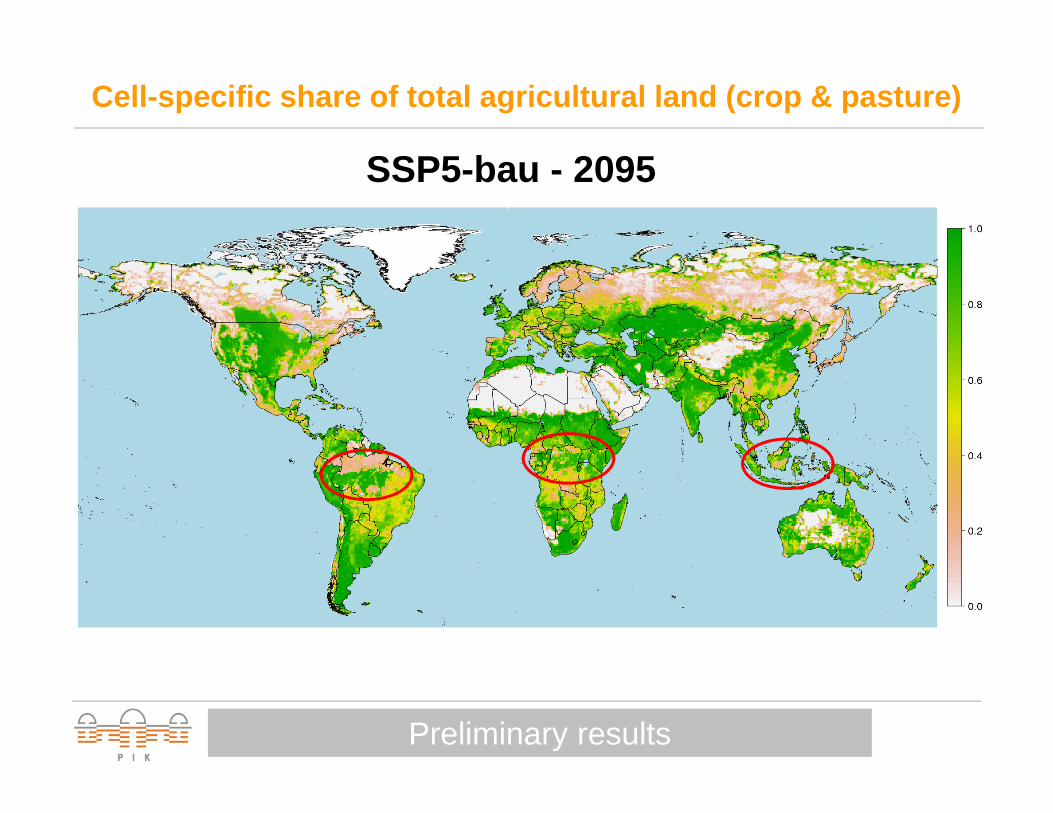
Cell-specific share of total agricultural land (crop & pasture)
Preliminary results
SSP1-bau - 2095
Elmar KrieglerPotsdam Institute for Climate Impact Research
Cell-specific share of total agricultural land (crop & pasture)
Preliminary results
SSP5-bau - 2095
Elmar KrieglerPotsdam Institute for Climate Impact Research
Land use - Global
Preliminary results
SSP1-bau SSP5-bau
Elmar KrieglerPotsdam Institute for Climate Impact Research
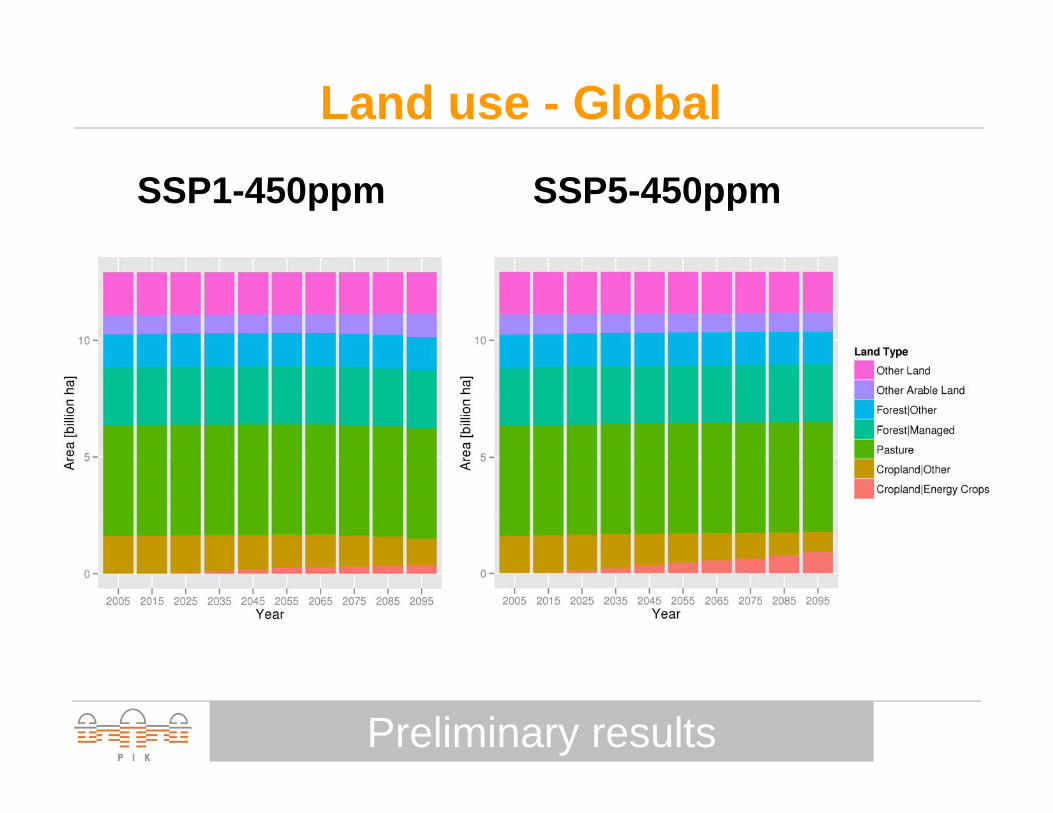
Land use - Global
Preliminary results
SSP1-450ppm SSP5-450ppm
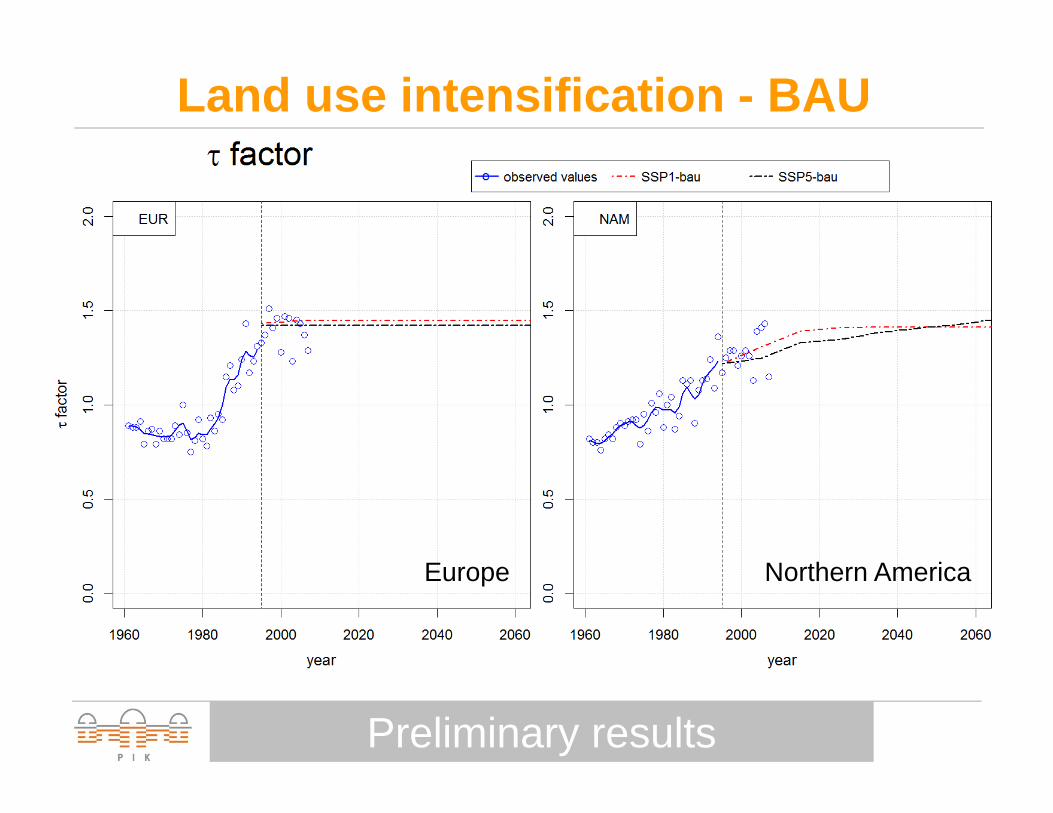
Elmar KrieglerPotsdam Institute for Climate Impact ResearchPreliminary results
Europe
Land use intensification - BAU
Northern America

Elmar KrieglerPotsdam Institute for Climate Impact ResearchPreliminary results
Europe
Land use intensification - 450ppm
Northern America

Elmar KrieglerPotsdam Institute for Climate Impact Research
CO2 emissions – ReMIND-MAgPIE SSP vs. RCP
Preliminary results
Please add SSP2 and update

Elmar KrieglerPotsdam Institute for Climate Impact Research
CO2 emissions – Reference and 450 ppm
Preliminary results
Please add SSP2 and update

Elmar KrieglerPotsdam Institute for Climate Impact Research
Radiative forcing – ReMIND-MAgPIE SSP vs. RCP
Preliminary results

Elmar KrieglerPotsdam Institute for Climate Impact Research
Conclusions
• SSP5 reference scenarios reaches RCP8.5. SSP1 is in the area of RCP6. Can it go lower? Assumptions used were already very optimistic.
• Large variation in mitigation challenges between SSP1 & 5 already under 1st best climate policy assumptions, if a variety of SSP differences beyond GDP and population is implemented
• Key assumptions impacting emissions: fossil resources, energy intensity
• Further assumptions impacting mitigation costs: renewable energy costs (mediated via food demand and forest protection in case of bioenergy)
• Effect of assumptions on capital intensity convergence, globalization of food trade, fossil fuel taxes / subsidies need to be further explored.
• Land use assumptions likely will have increased significance for high population scenarios (SSP3 & 4). Effect on food prices need to be explored (ongoing work)
Elmar KrieglerPotsdam Institute for Climate Impact Research
SSP TEAM AT PIKElmar Kriegler, Alexander Popp, David Klein, Lena Reuster, Jana Schwanitz, Nico Bauer, Gunnar Luderer, Marian Leimbach, Franziska Piontek, Benjamin Bodirsky, Lavinia Baumstark, Jessica Strefler, Jan Philipp Dietrich, Christoph Bertram, Hermann Lotze-Campen, Christoph Schmitz, Florian Humpenöder
Thank you

Elmar KrieglerPotsdam Institute for Climate Impact Research
Backup Slides on Model Framework
Elmar KrieglerPotsdam Institute for Climate Impact Research 33
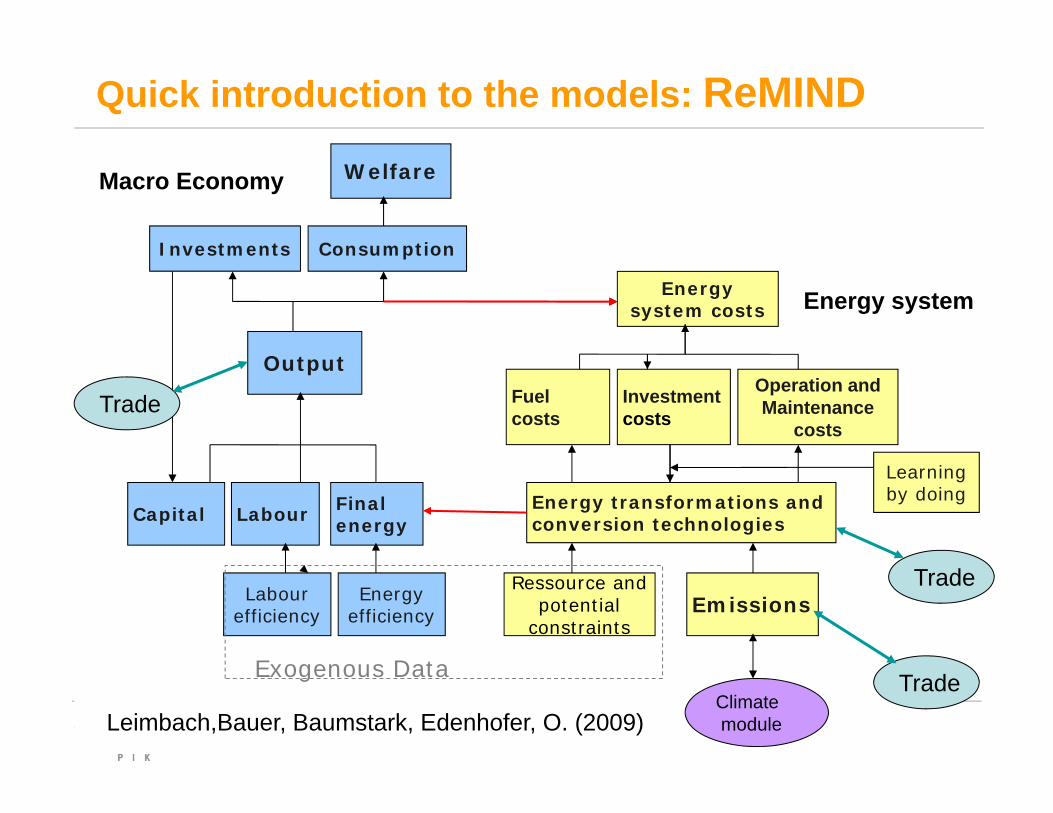
Welfare
LabourCapital
Energy system costs
Output
ConsumptionInvestments
Final energy
Energy transformations and conversion technologies
Fuelcosts
Investment costs
Operation and Maintenance
costs
Labour efficiency Emissions
Learning by doing
Ressource and potential
constraints
Macro Economy
Energy system
Exogenous Data
Energy efficiency
Trade
Trade
Trade
Climatemodule
Quick introduction to the models: ReMIND
Leimbach,Bauer, Baumstark, Edenhofer, O. (2009)

Elmar KrieglerPotsdam Institute for Climate Impact Research
Quick introduction to the models used: ReMIND
ReMIND Energy System / Macro Interface
Elmar KrieglerPotsdam Institute for Climate Impact Research
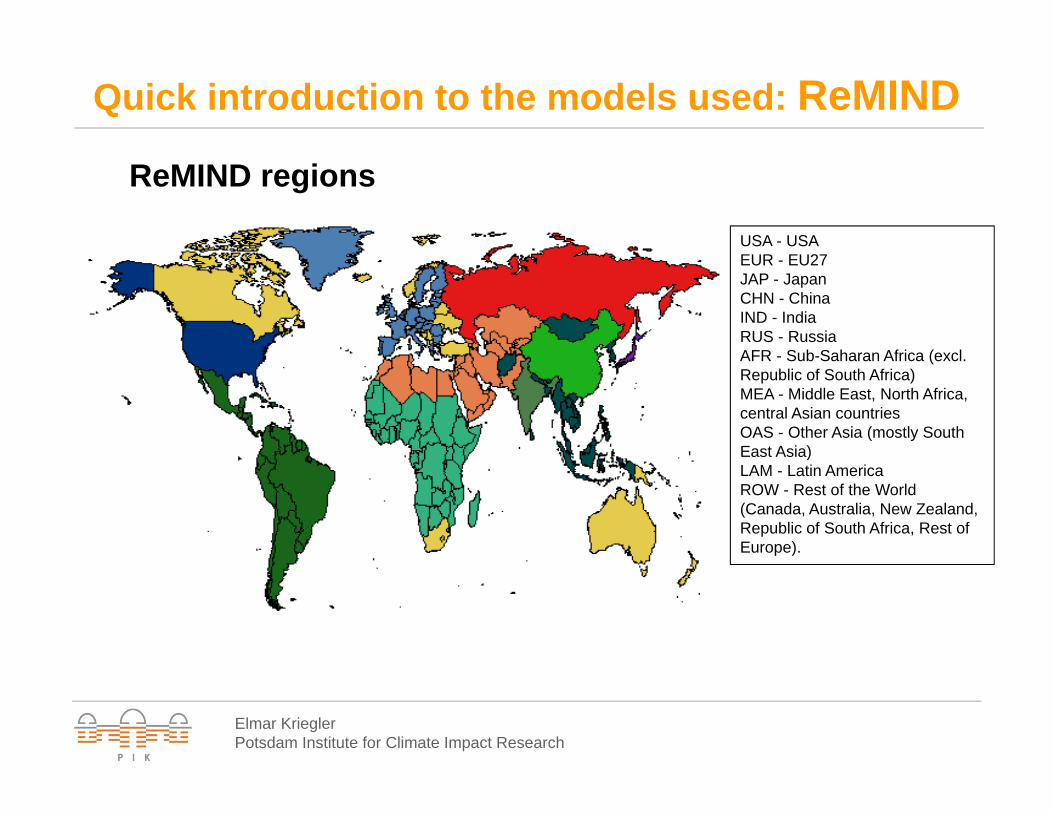
ReMIND regions
USA - USA EUR - EU27 JAP - Japan CHN - China IND - India RUS - Russia AFR - Sub-Saharan Africa (excl. Republic of South Africa) MEA - Middle East, North Africa, central Asian countriesOAS - Other Asia (mostly South East Asia)LAM - Latin America ROW - Rest of the World (Canada, Australia, New Zealand, Republic of South Africa, Rest of Europe).
Quick introduction to the models used: ReMIND
Elmar KrieglerPotsdam Institute for Climate Impact Research
Cer
eals
Oils
eeds
Puls
es
Suga
r bee
ts
Crop yieldsLand & Water constraints
+200 mm-200 -100 0 +100
CCSR
ECHAM4
Climate
LPJ (50x50 km grid)
Biophysical inputs
Income vs. Food consumption
0
500
1000
1500
2000
2500
3000
3500
4000
0 5000 10000 15000 20000 25000 30000 35000 40000
GDP / Cap / Year
Kca
l / C
ap /
Day
kcal_cap (105 countries, 1990/2000) kcal_cap (fitted values)
kcal = 802 * gdp^(0.142327) [R^2 = 0.66]
0
2
4
6
8
10
12
14
16
1900 1920 1940 1960 1980 2000 2020 2040 2060 2080 2100
Bill
ion
Low fertility, low mortality High fertility, high mortality Central fertility, central mortality (Lutz et al. 2001)
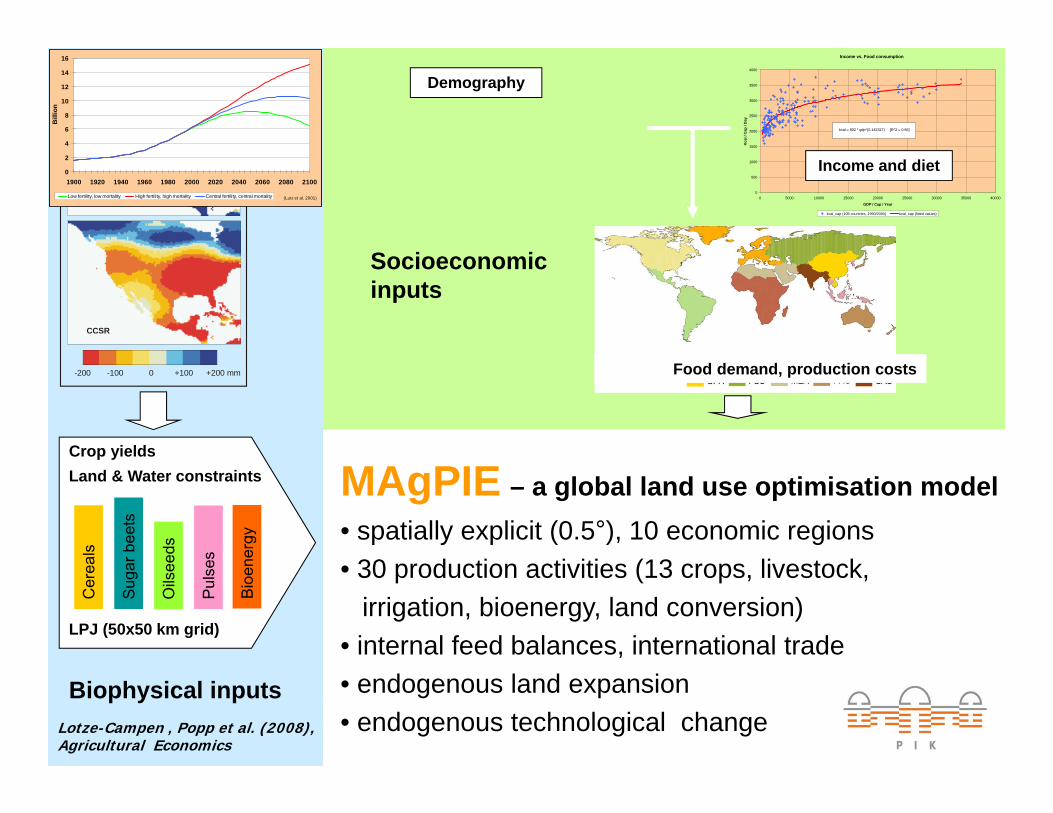
Demography
Income and diet
Food demand, production costs
Socioeconomic inputs
MAgPIE – a global land use optimisation model• spatially explicit (0.5°), 10 economic regions• 30 production activities (13 crops, livestock,
irrigation, bioenergy, land conversion)• internal feed balances, international trade• endogenous land expansion• endogenous technological change
Bioe
nerg
y
Lotze-Campen , Popp et al. (2008), Agricultural Economics
Elmar KrieglerPotsdam Institute for Climate Impact Research
Land
use
dyn
amic
s
Income vs. Food consumption
0
500
1000
1500
2000
2500
3000
3500
4000
0 5000 10000 15000 20000 25000 30000 35000 40000
GDP / Cap / Year
Kca
l / C
ap /
Day
kcal_cap (105 countries, 1990/2000) kcal_cap (fitted values)
kcal = 802 * gdp^(0.142327) [R^2 = 0.66]
0
2
4
6
8
10
12
14
16
1900 1920 1940 1960 1980 2000 2020 2040 2060 2080 2100
Bill
ion
Low fertility, low mortality High fertility, high mortality Central fertility, central mortality (Lutz et al. 2001)
Cer
eals
Oils
eeds
Puls
es
Suga
r bee
ts
Crop yieldsLand & Water constraints
+200 mm-200 -100 0 +100
CCSR
ECHAM4
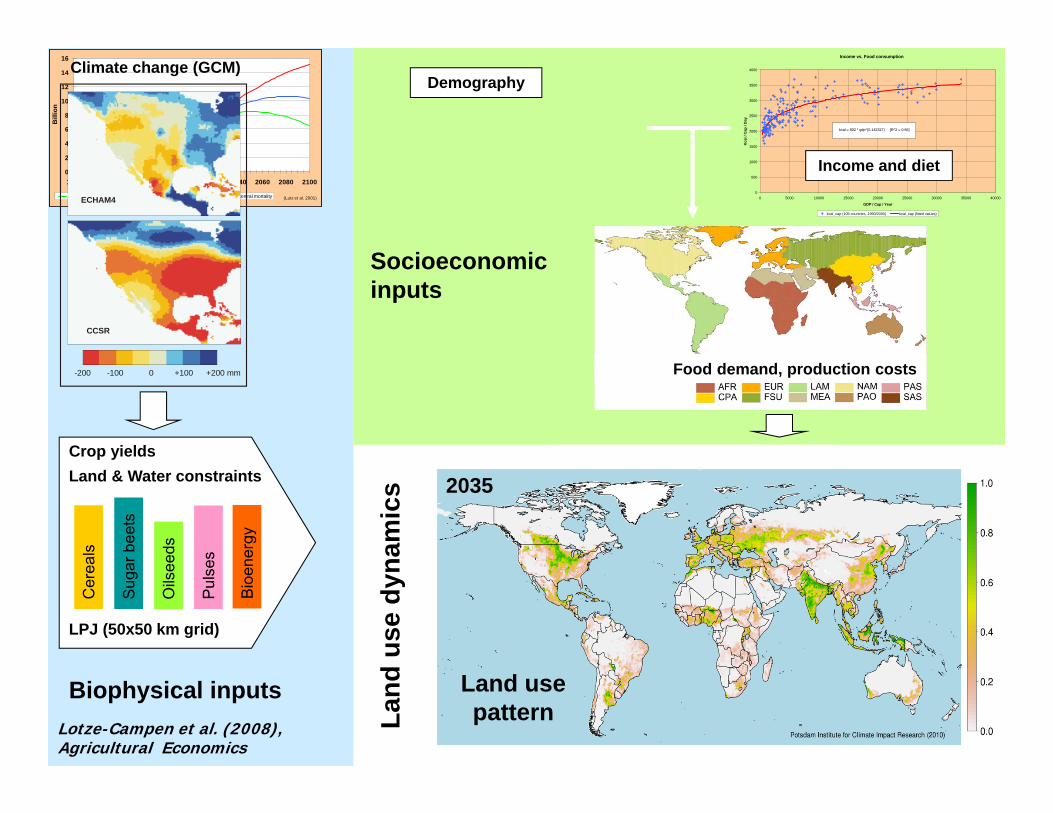
Climate change (GCM)Demography
Income and diet
Food demand, production costs
LPJ (50x50 km grid)
Biophysical inputs
Socioeconomic inputs
Bioe
nerg
y
Lotze-Campen et al. (2008), Agricultural Economics
Land use pattern
2035

Elmar KrieglerPotsdam Institute for Climate Impact Research
Income vs. Food consumption
0
500
1000
1500
2000
2500
3000
3500
4000
0 5000 10000 15000 20000 25000 30000 35000 40000
GDP / Cap / Year
Kca
l / C
ap /
Day
kcal_cap (105 countries, 1990/2000) kcal_cap (fitted values)
kcal = 802 * gdp^(0.142327) [R^2 = 0.66]
0
2
4
6
8
10
12
14
16
1900 1920 1940 1960 1980 2000 2020 2040 2060 2080 2100
Bill
ion
Low fertility, low mortality High fertility, high mortality Central fertility, central mortality (Lutz et al. 2001)
+200 mm-200 -100 0 +100
CCSR
ECHAM4
Climate change (GCM)Demography
Income and diet
Food demand, production costs
Biophysical inputs
Socioeconomic inputs
Lotze-Campen and Popp, World Development Report 2010
Cer
eals
Oils
eeds
Puls
es
Suga
r bee
ts
Crop yieldsLand & Water constraints
LPJ (50x50 km grid)
Bioe
nerg
y
Elmar KrieglerPotsdam Institute for Climate Impact Research
Income vs. Food consumption
0
500
1000
1500
2000
2500
3000
3500
4000
0 5000 10000 15000 20000 25000 30000 35000 40000
GDP / Cap / Year
Kca
l / C
ap /
Day
kcal_cap (105 countries, 1990/2000) kcal_cap (fitted values)
kcal = 802 * gdp^(0.142327) [R^2 = 0.66]
0
2
4
6
8
10
12
14
16
1900 1920 1940 1960 1980 2000 2020 2040 2060 2080 2100
Bill
ion
Low fertility, low mortality High fertility, high mortality Central fertility, central mortality (Lutz et al. 2001)
+200 mm-200 -100 0 +100
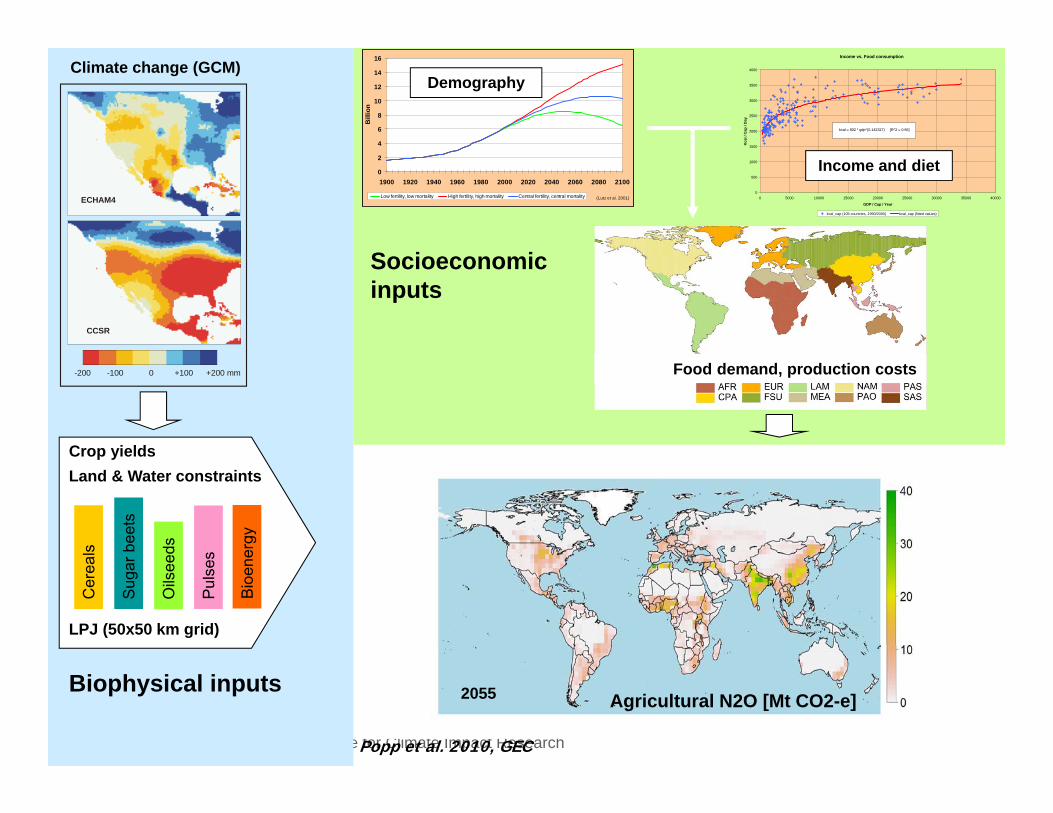
CCSR
ECHAM4
Climate change (GCM)Demography
Income and diet
Food demand, production costs
Biophysical inputs
Socioeconomic inputs
Popp et al. 2010, GEC
Cer
eals
Oils
eeds
Puls
es
Suga
r bee
ts
Crop yieldsLand & Water constraints
LPJ (50x50 km grid)
Bioe
nerg
y
2055 Agricultural N2O [Mt CO2-e]

Elmar KrieglerPotsdam Institute for Climate Impact Research
MAgPIE world regions
Elmar KrieglerPotsdam Institute for Climate Impact Research
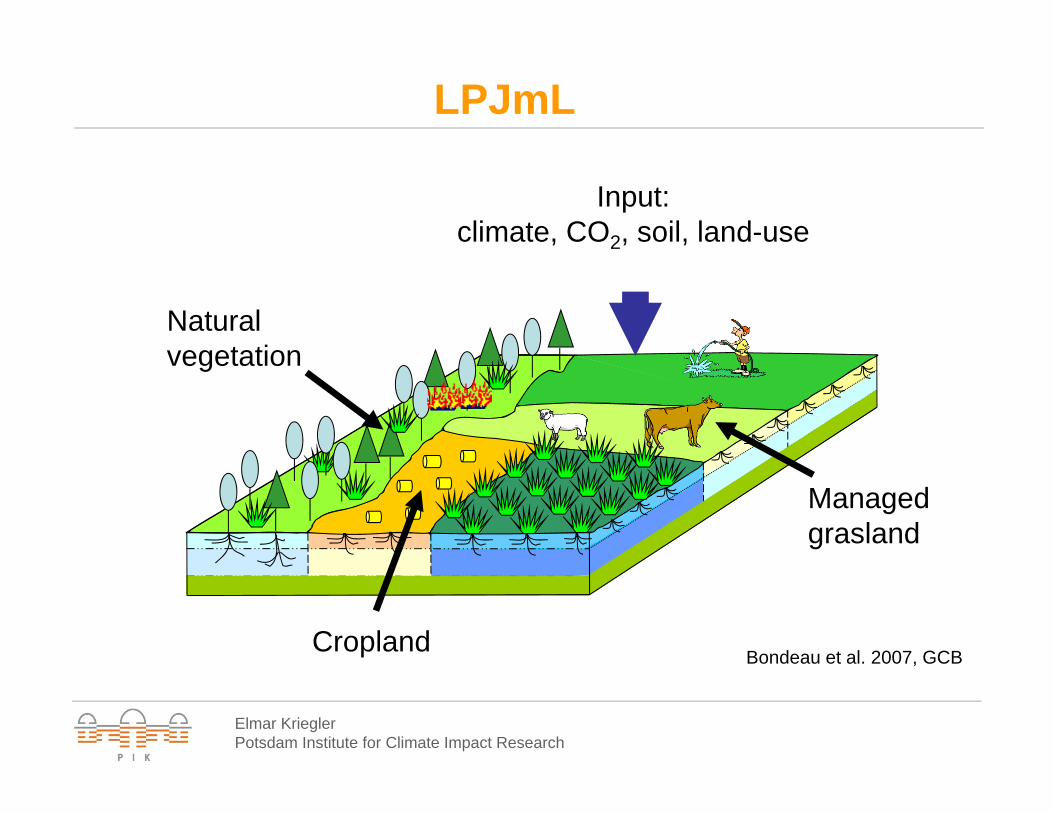
Bondeau et al. 2007, GCB
Input: climate, CO2, soil, land-use
Natural vegetation
Managed grasland
Cropland
LPJmL
Elmar KrieglerPotsdam Institute for Climate Impact Research
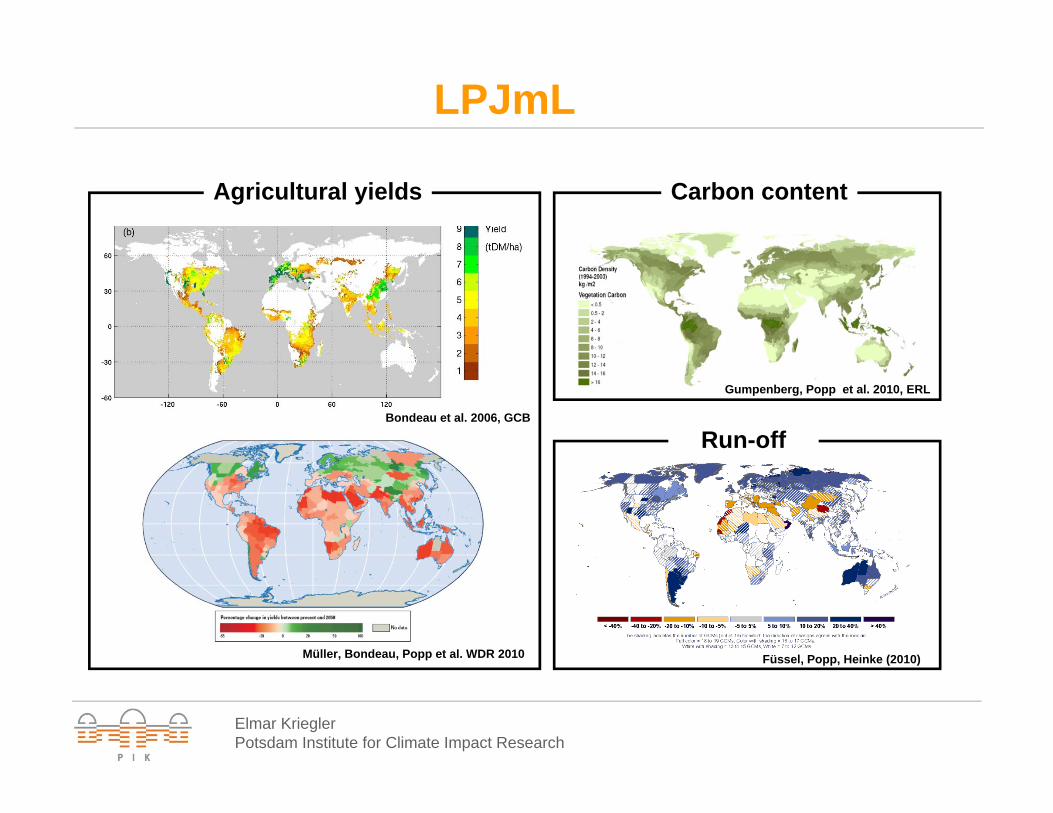
Agricultural yields Carbon content
Run-off
Müller, Bondeau, Popp et al. WDR 2010
Bondeau et al. 2006, GCB
Füssel, Popp, Heinke (2010)
Gumpenberg, Popp et al. 2010, ERL
LPJmL