Embed Size (px)
Citation preview
Information Retrieval, 1, 193–216 (1999)c© 1999 Kluwer Academic Publishers. Manufactured in The Netherlands.
Exploiting Hierarchy in Text Categorization
ANDREAS S. WEIGEND [email protected]; www.weigend.comDepartment of Information Systems, Leonard N. Stern School of Business, New York University,44 West Fourth Street, New York, NY 10012, USA
ERIK D. WIENER
JAN O. PEDERSENInfoSeek Corp., 1399 Moffet Park Drive, Sunnyvale, CA 94089, USA
Received September 15, 1998; Revised April 23, 1999; Accepted May 7, 1999
Abstract. With the recent dramatic increase in electronic access to documents, text categorization—the taskof assigning topics to a given document—has moved to the center of the information sciences and knowledgemanagement. This article uses the structure that is present in the semantic space of topics in order to improveperformance in text categorization: according to their meaning, topics can be grouped together into “meta-topics”,e.g., gold, silver, and copper are all metals. The proposed architecture matches the hierarchical structure of thetopic space, as opposed to a flat model that ignores the structure. It accommodates both single and multipletopic assignments for each document. Its probabilistic interpretation allows its predictions to be combined in aprincipled way with information from other sources. The first level of the architecture predicts the probabilitiesof the meta-topic groups. This allows the individual models for each topic on the second level to focus on finerdiscriminations within the group. Evaluating the performance of a two-level implementation on the Reuters-22173testbed of newswire articles shows the most significant improvement for rare classes.
Keywords: information retrieval, text mining, topic spotting, text categorization, knowledge management, prob-lem decomposition, machine learning, neural networks, probabilistic models, hierarchical models, performanceevaluation
1. Introduction
The goal of text categorization is to assign documents to one or more predefined subjectcategories. This goal is central to information access tasks such as spotting topics, routingdocuments, assigning subject headings, and for organizing documents into hierarchicalcatalogs or directory-like structures.
Methods for text categorization differ in the form of the classifier, the technique fortraining, and the representation of the documents. However, most approaches treat thecategorization problem as a set ofK independent binary classification tasks, one for eachcategory, where the information used to train each classifier consists of the set of positiveand negative example documents for that class. Our baseline results and comparative resultsfrom the literature (Yang 1999) show that the best categorization methods differ only slightlyin accuracy: It has become very difficult to improve performance significantly when usingsimilar representation of the topics.
194 WEIGEND, WIENER, AND PEDERSEN
This article exploits the internal structure of the categories in order to improve textcategorization performance over baseline models that ignore category structure. The cate-gorization problem is decomposed into subtasks based on acategory hierarchy.Problemdecomposition is widely applied to reduce a larger problem into several smaller, hopefullyeasier, problems. The idea very naturally applies to classification with hierarchical structurein the classes, ranging from personal e-mail folders to Yahoo!-like catalogs of the Web. Weimplement the model as a hierarchical neural network.
First, we provide the methodological background. Then we explain the architecture andparameter estimation (or training) of the hierarchical neural network. Next we describeseveral approaches to represent the documents (input space) and discuss their advantagesand disadvantages. After showing the basic results of the hierarchical models comparedto flat baseline models, we present a few in-depth illustrations of the superior performanceof the hierarchical network. The final section concludes with a summary and outlook tofurther research.
2. Framework
2.1. A Probabilistic Approach
In text categorization, each documentd is represented throughx(d), the input vector, andhas an associatedK -dimensional output vector whose dimensions correspond to a given,fixed set ofK possible categories or topics. The target value for a topic is unity if thedocument has been assigned that topic, and zero otherwise. The goal of text categorizationis to obtain a decision rule. This rule is extracted from a training set consisting ofNdocuments with correct assignments for each category. The decision rule, when appliedto a new document (presented to the classifier in the same representation as the trainingdocuments), predicts for each of theK topics its presence or absence. For example, rulelearning methods, such as Swap-1 (Apte et al. 1994) and Ripper (Cohen and Singer 1996)strive to derive sets of simple rules that best separate documents based on topic assignment.Our own focus is on methods that are statistically motivated and can be interpreted in aprobabilistic framework.
In particular, we assume a loss functionLk(i, j ). It describes the cost of assigning thevaluei instead ofj to thekth output variable,tk. With these definitions, the task correspondsto minimizing the total expected loss:∑
k
∑j
Lk(i, j ) P(tk = j | x). (1)
The individual losses are weighted with the probability of the outputtk taking the valuejgiven the inputx), P(tk = j | x). The inner sum extends over the outcomesj (for thekthoutput), the outer sum over the outputsk. Since there are no interactions between the top-ics, the overall sum is minimized when each term is minimized. This yields the usual casewhere each output variabletk is treated separately. For each topic, the following expressionis minimized:∑
j
Lk(i, j ) P(tk = j | x).
EXPLOITING HIERARCHY IN TEXT CATEGORIZATION 195
In addition to this separation of the classes, many problems have binary decisions,i, j ∈{0, 1}. Furthermore, assuming no cost for correct classification,L(0, 0) = L(1, 1) = 0,and unit cost for both Type I and Type II misclassification,L(1, 0) = L(0, 1) = 1, then theoptimal decision rule assignstk = 1 if
P(tk = 1 | x) > P(tk = 0 | x). (2)
Details on statistical decision theoretic can be found in Berger (1985).Equation (2) shows that the key quantity is the probabilityP(tk | x). It can be estimated
in several conceptually different approaches. The first approach, discussed in detail inSection 4.3.1, frames the problem as function approximation for the posterior probabilityP: P(tk | x) = E[tk | x]. E[·] denotes the expected value. It depends on the inputx andcan, for example, be expressed as a nonlinear neural network, as explained in Section 4.3.2.The second approach is indirect. It begins by estimating the probability of an input vectorfor each class,P(x | tk = 1). Bayes rule is then used to flip the conditioning to obtainP(tk = 1 | x) and the decision rule, again assuming unit cost for misclassification, yields
P(x | tk = 1)P(tk = 1) > P(x | tk = 0)P(tk = 0)
whereP(tk = 1) is the unconditional probability of classtk. For high-dimensional inputspaces, the indirect approach tends to give inferior results in comparison to the direct ap-proach due to the problems that arise from combining often poorly approximated individualdensities. A third approach does not try to give probabilistic estimates but focuses on theboundaries between the classes. For separating hyperplanes, this simplifies to the Fisherlinear discriminant, as well as the iteratively estimated perceptron (Hertz et al. 1991, Haykin1998). Recent approaches include support vector machines that are based on selecting arelevant subset of patterns in high-dimensional spaces, and large margin classifiers thatfind class boundaries that maximize the distance between classes (Vapnik 1998). Excellentbooks on classification are Cherkassky and Mulier (1998), Kennedy et al. (1998), and Dudaet al. (1999).
2.2. Related Work
Some of the early work in information retrieval (Rocchio 1971), although originally pro-posed for relevance feedback, can be re-interpreted as a density estimation method. TheRocchio method treats the average of the feature vectors that represent the documents as-signed to a specific topic as a prototype of that topic. Distances from the prototype expressthe likelihood that a new document belongs to the topic. If a Euclidean metric is chosen, theunderlying data generating process models the noise with spherical Gaussians. This methodis inappropriate when the distribution of documents for a given topic is very different fromthe assumed Gaussian. For example, a term with two distinct meanings is not representedwell by an average of these two distinct samples.
On the Reuters-22173 corpus, Lewis and Ringuette (1994) contrasted “naive Bayes”classification with “Classification and Regression Trees” (CART) (Breiman et al. 1984).Wiener et al. (1995) compared logistic regression with nonlinear neural networks. On a
196 WEIGEND, WIENER, AND PEDERSEN
different corpus, Schuetze et al. (1995) compared several classification methods (includingneural networks and logistic regression) on several reasonable document representationsthat included the two representations used here (described in Section 4.4). The bottom lineof these experiments on document routing is: a neural network implementation of logisticregression, as used here, outperforms the Rocchio approach.
A few text categorization methods directly minimize the joint loss given by Eq. (1). Forexample, Yang and Chute (1992) propose a least squares approach to solve the simultaneousregression problemE(t | x). This idea is developed further in Yang and Chute (1994).Taking also another approach, Yang (1994) frames the problem ask nearest neighborclassification and simultaneously estimatesE(tk | x) for all k. This approach does not in-clude constraints on the output variablest and is primarily a computationally efficient wayfor solving theK independent problems.
It has been noted that category labels are typically not flat but exhibit hierarchical struc-ture. The hierarchy used here was first proposed in Wiener et al. (1995). In other work,Dagan et al. (1996) use the latent hierarchical structure to improve cross-classification per-formance, and Koller and Sahami (1997) focus on word selection for classifiers based onbinary inputs (presence or absence of each word).
A hierarchical classifier for documents that contain exactly one topic has been developedby D’Alessio et al. (1998). It requires hard assignments at each branch. To end up at theright leaf, every decisions in the hierarchy has to be accurate. Wiener (1995) discusses amethod for improving classification by exploiting hierarchical structure. We here providea probabilistic framework that allows several topics to be present in a given document.
3. Data Set
As a test bed for our categorization experiments we used the Reuters-22173 corpus offinancial news stories from 1987, a standard evaluation data set in the text categorizationliterature.1 While there are 22,173 full news stories total in the corpus, different sets ofresearchers have used somewhat different subsets for both training and evaluation. In par-ticular, Lewis’ original experiments with the corpus (Lewis 1992) used all of the documents,while later work by other authors used subsets consisting of a little less than half of thedocuments (Apte et al. 1994, Wiener et al. 1995, Cohen and Singer 1996). The subsetchosen here (identical to Wiener et al. (1995)) has 9610 documents in the training set and3662 in the test set. This is the result of selecting those topics that occur at least twice inthe training set (and any number of times including zero in the test set), and all documentsthat have at least one of these topics assigned.
In more detail, there are 92 topics that occur at least twice in the training set. The frequencyof the topics varies greatly. The most frequent topic is assigned to about a third of thedocuments. Documents may be assigned multiple topics. The maximum number of topicsassigned to a document in the corpus was twelve. The average number of topics assignedis 1.24. This small value of this mean can be traced back to the fact that the two highestfrequent topics (earningsandacquisitions) tend to occur by themselves. [To clarify whethera word denotes an input term, a topic, or a meta-topic, we use the following typographicalconvention: A term or word from the document is typeset in teletype. A
EXPLOITING HIERARCHY IN TEXT CATEGORIZATION 197
topic, generically called class and corresponding to the leaf of a tree is typeset in bold.A META-TOPIC, GENERICALLY CALLED GROUP AND CORRESPONDING TO A NODE IS TYPESET
IN SMALL CAPS.]While no explicit hierarchical structure was provided with the distribution of the data, an
exploratory cluster analysis suggested an implicit hierarchical structure. In particular, theclustering revealed that when topics do co-occur, they tend to co-occur with other topicsfalling under the same meta-topic. Based on the cluster analysis, we manually groupedthe topics into the following meta-topics:AGRICULTURE, ENERGY, FOREIGN EXCHANGE,METALS, and a fifth group for the remaining topics. For brevity, we call itGOVERNMENT,but do not report any results on this meta-topic it here. The Appendix lists all the topicsand their assignments.2
4. The Model
Performance on a learning task can often be improved by decomposing the task into a setof smaller subtasks, each one easier than the whole, see, e.g., Russell and Norvig (1995),and Nilsson (1998). Our analysis of earlier categorization experiments suggested that sucha decomposition could potentially be advantageous for topic spotting. This section firstmotivates and describes our hierarchical model, then discusses the specific implementationin terms of a neural network, and ends by describing the document representation.
4.1. Motivation
An analysis of the types of errors typically made by flat (non-hierarchical) models showedthat a large portion of the high scoringnon-relevant documents were on topics semanticallyrelated to the actually assigned topic. These false-positive stories used vocabulary related tothe topic, but only incidentally. In order to predict the Reuters topics correctly, fine-graineddistinctions between incidental and actual topics are essential.
For example, while the termgold is a good predictor for the topicgold, gold also tendsto appear incidentally in documents about other precious metals, leading to false positivepredictions within the group. In contrast,gold appears much less frequently in othergroups, such as agricultural or energy stories. A hierarchical structure provides the highresolution within a group where it is needed, but drops to a more coarse resolution betweengroups where confusion is unlikely (and too high a resolution might lead to overfitting).
Using a hierarchical category structure allows the decomposition of the problem: first,determine the general topic group, then within that group, distinguish among topics. In theexperiments with the Reuters data reported here we use a single level of hierarchy only.However, this type of decomposition can be generalized to any number of levels.
4.2. Hierarchical Model
The key quantity in Eq. (2) isP(tk | x), the probability that topick is present given theinput x. When constructing the hierarchy, we assume that eachtk appears exactly once,i.e., each topic is assigned to one and only one meta-topic. This mutually exclusive and
198 WEIGEND, WIENER, AND PEDERSEN
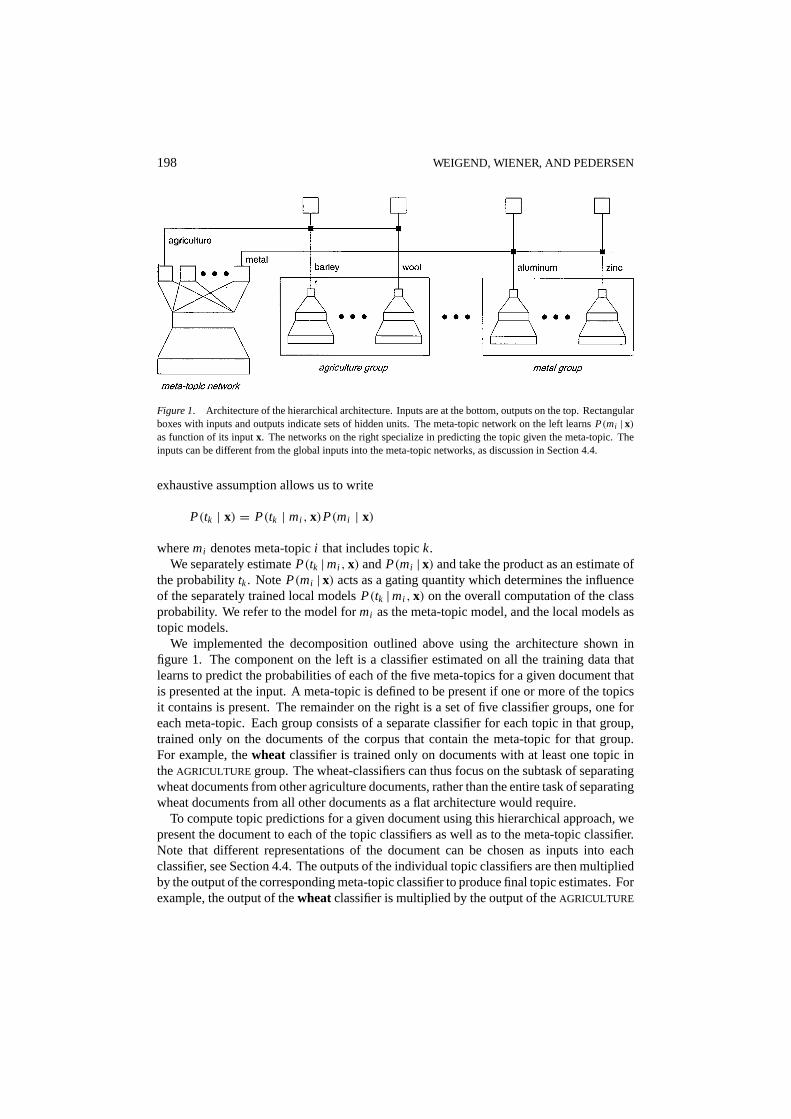
Figure 1. Architecture of the hierarchical architecture. Inputs are at the bottom, outputs on the top. Rectangularboxes with inputs and outputs indicate sets of hidden units. The meta-topic network on the left learnsP(mi | x)as function of its inputx. The networks on the right specialize in predicting the topic given the meta-topic. Theinputs can be different from the global inputs into the meta-topic networks, as discussion in Section 4.4.
exhaustive assumption allows us to write
P(tk | x) = P(tk | mi , x)P(mi | x)
wheremi denotes meta-topici that includes topick.We separately estimateP(tk |mi , x) andP(mi | x) and take the product as an estimate of
the probabilitytk. Note P(mi | x) acts as a gating quantity which determines the influenceof the separately trained local modelsP(tk |mi , x) on the overall computation of the classprobability. We refer to the model formi as the meta-topic model, and the local models astopic models.
We implemented the decomposition outlined above using the architecture shown infigure 1. The component on the left is a classifier estimated on all the training data thatlearns to predict the probabilities of each of the five meta-topics for a given document thatis presented at the input. A meta-topic is defined to be present if one or more of the topicsit contains is present. The remainder on the right is a set of five classifier groups, one foreach meta-topic. Each group consists of a separate classifier for each topic in that group,trained only on the documents of the corpus that contain the meta-topic for that group.For example, thewheat classifier is trained only on documents with at least one topic intheAGRICULTURE group. The wheat-classifiers can thus focus on the subtask of separatingwheat documents from other agriculture documents, rather than the entire task of separatingwheat documents from all other documents as a flat architecture would require.
To compute topic predictions for a given document using this hierarchical approach, wepresent the document to each of the topic classifiers as well as to the meta-topic classifier.Note that different representations of the document can be chosen as inputs into eachclassifier, see Section 4.4. The outputs of the individual topic classifiers are then multipliedby the output of the corresponding meta-topic classifier to produce final topic estimates. Forexample, the output of thewheatclassifier is multiplied by the output of theAGRICULTURE
EXPLOITING HIERARCHY IN TEXT CATEGORIZATION 199
meta-topic classifier. The role of the meta-topic classifier is to “turn on” each classifiergroup to the degree the incoming document is judged to be relevant for the correspondingmeta-topic. If, for instance, an incoming document is about precious metals but not foreignexchange, the meta-topic classifier will “shut off” the foreign exchange classifiers becausetheir predictions are neither needed nor meaningful—the foreign exchange classifiers werenot trained on metal documents.
4.3. Implementation
We write the hierarchical approach as a neural network. Section 4.3.1 briefly reviews theframework of neural networks for classification in relation to standard logistic regression.Section 4.3.2 suggests several architectures for text classification, outlines the dimensionsof variation, and justifies the architecture we chose. Background references for this sectioninclude the excellent book by Bishop (1996), and, emphasizing the statistical perspectiveon neural networks, Rumelhart et al. (1996) and Cherkassky and Mulier (1998). The codeused for the experiemnts was written in MATLAB.
4.3.1. Cost or Objective Function, and Search or Parameter Estimation.A neural net-work implements a functional mapping from an input or feature vectorx to an outputy,x→ y. In the trivial case of direct connections between input and output, this architectureis identical tolinear regressionif the output is linear, and identical tologistic regressionifthe output maps the real axis onto(0, 1) through
y = 1
2(tanh(ξ)+ 1) (3)
whereξ is a linear combination of the inputs.3
Neural networks are trained by gradient descent on a cost function. This cost functioncan be interpreted as the negative logarithm of the likelihood of the data given the model.
Classification tasks can be classified into 1-of-K andk-of-K tasks. 1-of-K tasks can beviewed as competition. This is not the case here, since a document can havek = 1, 2, . . .meta-topics assigned to it. Similarly, the task for each meta-topic classifier is alsok-of-Klearning, since given more than one topic from the subset of topics corresponding to themeta-topic may be present a document.
k-of-K classifications are equivalent toK independent 1-of-2 classifications. For eachof these 1-of-2 classifications, the appropriate cost function is given by the “cross-entropy”(McCullagh and Nelder 1989, Rumelhart et al., 1996, Bishop 1996)
−∑
d
{tdk log yd
k +(1− td
k
)log (1− yk(xd))
}.
In this double sum,d extends over all documents. For each document,k denotes one specificclass,y denotes the prediction, andt ∈ {0, 1} is the target value that indicates membership.Interpreting the formula: when the document is assigned to the class (td
k = 1), the first termcontributes log(1/y) as an error (which gets smaller the closery is to unity), and when it isnot assigned (td
k = 0); only the second term contributes log(1/(1− y)) towards the error.
200 WEIGEND, WIENER, AND PEDERSEN
Mathematically identical, consider reversing the order of the summations. Beginning withthe first topic, all documents that contain the topics have a target value of 1, and all thosethat do not contain the topics have a target value of 0. From this perspective it can be seenthat the output will give the expected value, corresponding to the probability that the topicis present in response to a certain input. The hard constraint that the probability has to takevalues in (0, 1) is automatically fulfilled if a sigmoid is taken as output activation function.Note that this cost function is used for both the topics in the individual classifiers, and forthe meta-topics in the meta-topic classifier.
This objective function is identical to the one used in logistic regression (apart from a signchange and sometimes a factor of two). Viewed in a maximum likelihood framework, thisobjective reflects an underlying binomial distribution for the errors and allows the outputsy to be interpreted as conditional probabilities.
Note that in practice, the user typically needs to go beyond a probabilistic assignmentand needs to make a decision, often with a very asymmetric loss function (see Section 2).For example, missing a document in a search for prior work for a patent application ismuch worse than bringing up an irrelevant document. Luckily, this does not change theproblem fundamentally—a different decision threshold is taken into account through alinear transformation of the cost function. In the evaluation part of this paper, Section 6,we consider several decision thresholds and average over them in order to obtain singleperformance measures.
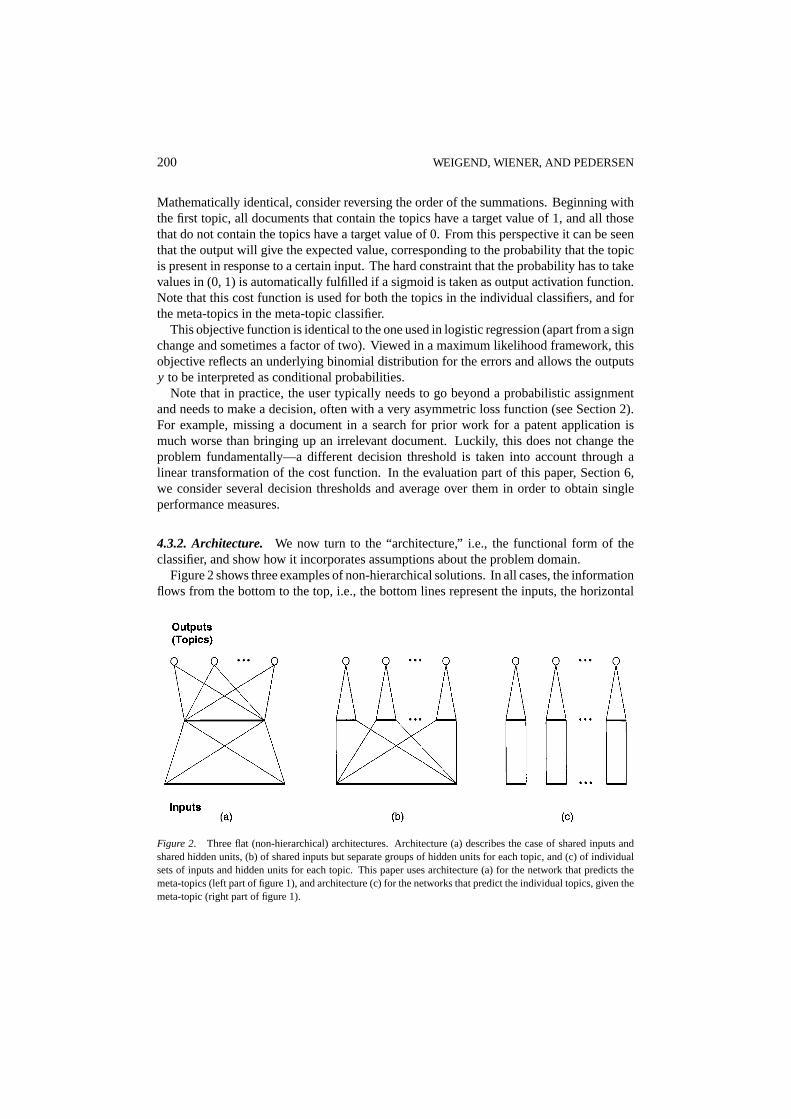
4.3.2. Architecture. We now turn to the “architecture,” i.e., the functional form of theclassifier, and show how it incorporates assumptions about the problem domain.
Figure 2 shows three examples of non-hierarchical solutions. In all cases, the informationflows from the bottom to the top, i.e., the bottom lines represent the inputs, the horizontal
Figure 2. Three flat (non-hierarchical) architectures. Architecture (a) describes the case of shared inputs andshared hidden units, (b) of shared inputs but separate groups of hidden units for each topic, and (c) of individualsets of inputs and hidden units for each topic. This paper uses architecture (a) for the network that predicts themeta-topics (left part of figure 1), and architecture (c) for the networks that predict the individual topics, given themeta-topic (right part of figure 1).
EXPLOITING HIERARCHY IN TEXT CATEGORIZATION 201
lines in the middle represent the hidden units, and the top circles represent the outputs(the predictions for the topics). Connections between these lines indicate the parameters orweights that are estimated from the training set by minimizing the cost function discussed inSection 4.3.1 above. The hidden units are given tanh activation functions (centered aroundzero), and the output units are given sigmoid activation functions (Eq. (3)) that incorporatethe hard constraint for the range of a probability.
Figure 2(a) uses a common set of inputs that feed into one single set of shared hiddenunits. This global re-representation of the inputs in the hidden units space is followed byindividual logit models on the hidden units.
Figure 2(b) still uses one common set of inputs. The hidden units, however, are brokeninto non-interacting subsets, each corresponding to one of the output classes. Both thesearchitectures have the same inputs. This allows them to operate on a single set of selectedterms, or a representation such as LSI (Latent Semantic Indexing), discussed in Section 4.4.
In contrast, figure 2(c) gives each classifier a different set of inputs, chosen to be parti-cularly useful for that specific class. The overall architecture in (c) is a parallel estimationof all the probabilities—there is no (positive or negative) interaction between the classes.Note that this complete independence allows the easy addition of new classes, since eachnetwork is trained separately. Furthermore, the size of the weights between inputs andhidden units in each network indicates the importance of individual terms for the individualtasks. Since sharing hidden units does not make sense in this case, there are no furtherpossibilities for nonhierarchical architectures.
We use both architectures (a) and (c) as “flat” baseline models in this article, enablingus to gauge the relative performance of our hierarchical models for both shared and class-specific representations. We do not use architecture (b) since, as noted above, nonlinearitydoes not appear to play a major role in this problem. Previous work (Wiener 1995) hasshown that architecture (c) performs best on the Reuters data but that architecture (a) isadequate for the coarse-grained distinctions exemplified by the high-frequency topic labels.
The hierarchical architecture we propose in this article is shown in figure 1. Within eachgroup, the sub-models correspond to figure 2(c), i.e., individual networks with relevantterms selected for each individual prediction task. The important difference is the “groupnetwork” on the left. It has a single shared set of inputs, a set of shared hidden units, andone output for eachmeta-topic, such asAGRICULTURE andENERGY. In summary, we usearchitecture (a) for the meta-topic, and architecture (c) for the individual topics.
We train the networks using a fully supervised approach: Every document has explicittargets for the meta-topics and for the individual topics. As discussed above, each topichad been manually assigned to exactly one meta-topic. This allows for completely separatetraining of all networks, using cross-entropy errors on all levels.
4.4. Document Representation
To build the classifier, we still need to address the question of how to represent the text,i.e., how do we show each document to the classifier? The total number of terms (order of50,000, the exact value depending on preprocessing such as stemming and truncation) is toolarge as input space: in such high-dimensional spaces almost all points (i.e., documents)
202 WEIGEND, WIENER, AND PEDERSEN
are very far apart, making generalization from the training set to the test set very difficult(“curse of dimensionality”). The dimensionality of the large space needs to be reduced forthe input into the classifier.
We use two statistical techniques to reduce the number of inputs. The first projects the fullterm vector linearly onto a hyperplane and only retains the coordinates along that hyperlane.The hyperplane is chosen such that the sum of the squared distances between the originalpoints and their projections is as small as possible. This standard technique, known instatistics and engineering as principal component analysis, as singular value decomposition,and as Karhunen-Lo´eve transformation, is called in the information retrieval fieldLatentSemantic Indexing(LSI) (Deerwester et al. 1990). It works well to the degree that most ofthe “signal” can indeed be captured by a hyperplane of about 1 percent of the total number ofdimensions, and that the remaining 99 percent of the dimensions mainly capture the “noise.”
Within this first technique, the remaining decision is whether to use all of the documents ofthe corpus (“global”), or only a specific subset (“local”). We use LSI for both. In the globalcase, the input into the first classifier (which predicts meta-topics) is determined by applyingLSI on the document-term matrix of the entire corpus. In the local case, the inputs intothe other classifiers (which predict the individual topics given the meta-topic) are obtainedby applying LSI on the document-term matrix that contains only the documents in a topicgroup. This local representation for each topic group (meta-topic) varies across groups.
While LSI captures as much variance as possible for any given number of retainedvariables, its dimensions are typically linear superpositions of the original terms. Thisproblem is addressed in the second technique we use. The goal of term selection is tochoose a small subset of highly discriminating terms from the full set of terms and usethese terms as input dimensions. More specifically, we use the chi-squared statistic toestimate the predictive power of the terms with respect to topics, and then select the highestranked terms. The chi-squared statistic measures the discrepancy between the observedcounts in a contingency table of topic-term co-occurrence, and the expected counts underthe assumption that the terms are distributed uniformly in all of the documents:
χ2 =∑
all cells
(observed− expected)2
expected
Details and interpretation of the chi-squared measure are given, for example, in Collett(1991).
We use the chi-squared term selection approach for the networks that predict the individualtopics. We compute a separate input representation for each topic based upon analyzingthe predictive power of each term with respect to the particular topic. These separaterepresentations allow us to keep the number of inputs for each of these networks small.
When determining the chi-squared values for a given topic, the remaining choice iswhether to compute the expected values from the entire corpus, or from the meta-topicunder which the topic under consideration falls. For example, to select a local set of termsfor predicting the topiccrude, the selection technique can either analyze topic-term co-occurrence over the entire training set or over just the documents in theENERGYmeta-topic.The difference is best illustrated by comparing the top fifty terms selected forcrude usingthe chi-squared measure on the full training set versus just on theENERGY set. Using the
EXPLOITING HIERARCHY IN TEXT CATEGORIZATION 203
entire corpus, we obtain the following predictors:
barrel oil crude bpd opec petroleumenergy exploration refinery bbl gasdistillate gasoline sea drill productionsaudi offshore day iraq api kuwait arabiaecuador tanker petroleos wti exxon cubiciranian earthquake gulf iran naturalpipeline texaco grisanti hernandez xonshell crudes field venezuela petrobrasal escort herrington output sour iraqi
If we do not use the entire corpus, but only on the documents in theENERGYset, the bestpredictors are:
oil crude harbor file gallon octanepound barrel resin unlead bpdpetrochemical last thermoplastic butanemidland barge fall customer effectiveopec houston super pel beaumontethylene polypropylene widely propanedow modernization component adhesivejet cgp pittsburgh convert heat dieselpetrol regular tonne day co sulphurcts he subsidiary corp cent
Note, for example, that the termspetroleum andenergy are considered good predictorsfor crude in the full training set, but are not considered good predictors within the contextof ENERGY documents. Overall, local representations tend to give better performance inthe hierarchical network because they pick out the relevant discriminating features.4 Thisis why we use the highest ranked terms for a given topic from the given local comparisonwith the meta-topic only, and not with the entire corpus.
5. Results
5.1. Evaluation Measures
To present a single number evaluation of a classifier for a particular topic, one summarizeseffectiveness over a range of potential decision thresholds. We do this by computingPavg,the average precision over a fixed set of evenly spaced recall levels. For a given topic, onecan rank test documents by the predicted probability that they belong to that topic. The truetopic assignments for test documents are known. Two numbers can be computed for any cutpoint. The first number,precision, is given by the following ratio: the number of documentsthat are correctly assigned to the topic divided by the number of documents retrieved. Thesecond number,recall, is given by the following ratio: the number of documents that arecorrectly assigned to the topic divided by the total number of documents that have that topic.
204 WEIGEND, WIENER, AND PEDERSEN
To achieve one single number for one topic from the entire precision recall curve, it iscustomary to average precision over a number of recall points. All the numbers reportedhere are the arithmetic mean of the precision values at eleven evenly spaced recall pointsof 0%, 10%, 20%, . . . ,90%, 100%. If no exact cutoffs were available, we used linearinterpolation to obtain an approximate value. In this computation, the specific decisionthreshold to achieve a particular recall point can vary by topic. We only report this measurehere, it is highly correlated (order of 0.95) with other evaluation measures, such as the so-calledF-measure (van Rijsbergen 1979). A detailed discussion of measures for evaluationis given in Yang (1999), and the exhaustive compilation of our experimental results usinga variety of evaluation measures is given in Wiener (1995).
The Pavg measure characterizes the average performance for each topic. If we want tosummarize the performance over a whole set of topics, two ways of averaging are used in theliterature: The effectiveness can be computed for each topic separately and then averagedover the topics, or the topic decisions can be computed for each document and then averagedacross documents. The following two terms are used to describe these situations:
• Macroaveragingtakes the expectation where the topics are given even weight. A topicthat only appears a couple of times in the test set influences the results as much as a topicthat appear thousands of times as often.• Microaveragingtakes the expectation where the documents are given even weight. The
resulting value is dominated by the frequent topics, since they appear much more oftenthan the rare ones.
Microaveraging essentially measures performance for the easy-to-predict high-frequencytopics. This is also a main reason of the similarity between the microaveraged results ofmost text categorizations methods on the Reuters data. In comparison, macroaveraging em-phasizes the medium and low frequency topics. This is harder but bears more information.This paper thus focuses on macroaveraged results.
Some systems report performance only using microaveraging. Lewis (1992) uses pro-portional assignment rather than fixed recall points for finding decision thresholds. Whennecessary for a clear comparison, we also microaverage.
5.2. Baseline Performance
The first step in our empirical evaluation establishes baseline figures for non-hierarchical,flat models. We show that the results of our baseline model compare favorably with thoseof previously published results for the same corpus, as well as with standard alternative textcategorization models.
5.2.1. Baseline Model. For the flat network, we used architecture (c) from figure 2, wherea separate classifier was trained for each topic. We tried both a global LSI representation(retaining 200 dimensions) and global selected term representations (using the top 20 termsfor each topic). Each of the networks had six hidden units.
EXPLOITING HIERARCHY IN TEXT CATEGORIZATION 205
5.2.2. Comparison to Published Results.Our experimental setting is most similar to theone used by Apte et al. (1994), hence we can directly compare results. While there isa difference in the training/test split of the Reuters data, Yang (1999) provides evidencethat this difference in splitting the data has no major effect on the performance. The bestexperiment reported by Apte et al. (1994) (excluding experiments with extra weight givento headline terms) microaveraged over all 92 topics and resulted in a breakeven point of.789.5 The breakeven points for our flat models, microaveraged over the same 92 topics,are .801 for the LSI network and .775 for the selected term network. This, combined withthe careful cross-system comparison given in Yang (1999), suggests that our flat modelsare competitive with the best results reported for text categorization over the Reuters data.
5.2.3. Comparison to Other Methods.To establish the baseline performance further, wealso compared it to two other standard categorization methods on the same data:k-nearestneighbors (Masand et al. 1992) and prototype-based classification (Hull 1994, Ittner et al.1995). For these experiments, we macroaveraged over the top 58 most frequent topics.This attempts a compromise between too much emphasis on the high-frequency topics (asmicro-averaging would have done) and too much variance from the low-frequency topics(below 16 occurrences in the training set).
The best results we achieved fork-nearest neighbors were 0.644 average precision usingLSI and 0.756 average precision using selected terms, compared with 0.765 for the networkusing LSI and 0.771 using selected terms.
We also established a benchmark performance for a prototype-based approach. Using theBuckley et al. (1994) variant of the Rocchio (1971) algorithm, we first built a prototype foreach topic, and subsequently assigned topic scores based on the cosines between documentsand prototypes. The best results we achieved were 0.637 average precision for an LSIrepresentation and 0.678 average precision for a term representation, which is below the0.765 for the LSI and the and 0.771 for the selected term networks, reported above.
These results show that our baseline models are at least competitive with other standardtext categorization techniques.
5.3. Hierarchical Performance
For our experiments with the hierarchical model, we decided to exclude the umbrella meta-topic that we had calledGOVERNMENT. As can be seen from the detailed list in the Appendix,this meta-topic had little semantic coherence (ranging fromt-bond and housing to ship) andwould have watered down the results since its breadth is similar to the non-hierarchical case.Applying this cut along with the requirement to have at least 16 positive examples in thetraining set leaves the final set of 37 topics for the experiments. This set is used throughoutthe experiments reported here. On this set, we used topic-specific term selection for thetopic networks, trying both local and global chi-squared selection (retaining the top 20 termsas inputs). We also tried both local and global LSI representations for the topic networks,in each case using the first 200 dimensions as inputs. For the meta-topic network, we useda global LSI representation, retaining the first 200 dimensions as inputs into the network.In all networks, we used six hidden units, as in the baseline case.
206 WEIGEND, WIENER, AND PEDERSEN
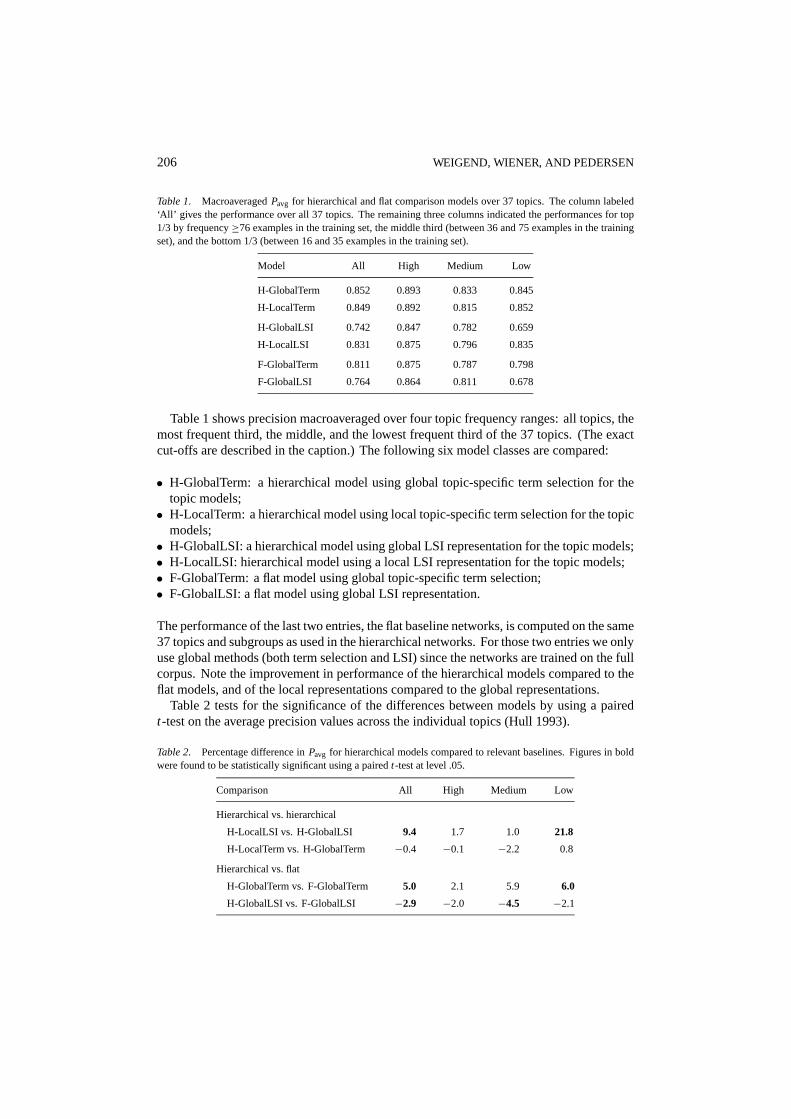
Table 1. MacroaveragedPavg for hierarchical and flat comparison models over 37 topics. The column labeled‘All’ gives the performance over all 37 topics. The remaining three columns indicated the performances for top1/3 by frequency≥76 examples in the training set, the middle third (between 36 and 75 examples in the trainingset), and the bottom 1/3 (between 16 and 35 examples in the training set).
Model All High Medium Low
H-GlobalTerm 0.852 0.893 0.833 0.845
H-LocalTerm 0.849 0.892 0.815 0.852
H-GlobalLSI 0.742 0.847 0.782 0.659
H-LocalLSI 0.831 0.875 0.796 0.835
F-GlobalTerm 0.811 0.875 0.787 0.798
F-GlobalLSI 0.764 0.864 0.811 0.678
Table 1 shows precision macroaveraged over four topic frequency ranges: all topics, themost frequent third, the middle, and the lowest frequent third of the 37 topics. (The exactcut-offs are described in the caption.) The following six model classes are compared:
• H-GlobalTerm: a hierarchical model using global topic-specific term selection for thetopic models;• H-LocalTerm: a hierarchical model using local topic-specific term selection for the topic
models;• H-GlobalLSI: a hierarchical model using global LSI representation for the topic models;• H-LocalLSI: hierarchical model using a local LSI representation for the topic models;• F-GlobalTerm: a flat model using global topic-specific term selection;• F-GlobalLSI: a flat model using global LSI representation.
The performance of the last two entries, the flat baseline networks, is computed on the same37 topics and subgroups as used in the hierarchical networks. For those two entries we onlyuse global methods (both term selection and LSI) since the networks are trained on the fullcorpus. Note the improvement in performance of the hierarchical models compared to theflat models, and of the local representations compared to the global representations.
Table 2 tests for the significance of the differences between models by using a pairedt-test on the average precision values across the individual topics (Hull 1993).
Table 2. Percentage difference inPavg for hierarchical models compared to relevant baselines. Figures in boldwere found to be statistically significant using a pairedt-test at level .05.
Comparison All High Medium Low
Hierarchical vs. hierarchical
H-LocalLSI vs. H-GlobalLSI 9.4 1.7 1.0 21.8
H-LocalTerm vs. H-GlobalTerm −0.4 −0.1 −2.2 0.8
Hierarchical vs. flat
H-GlobalTerm vs. F-GlobalTerm 5.0 2.1 5.9 6.0
H-GlobalLSI vs. F-GlobalLSI −2.9 −2.0 −4.5 −2.1
EXPLOITING HIERARCHY IN TEXT CATEGORIZATION 207
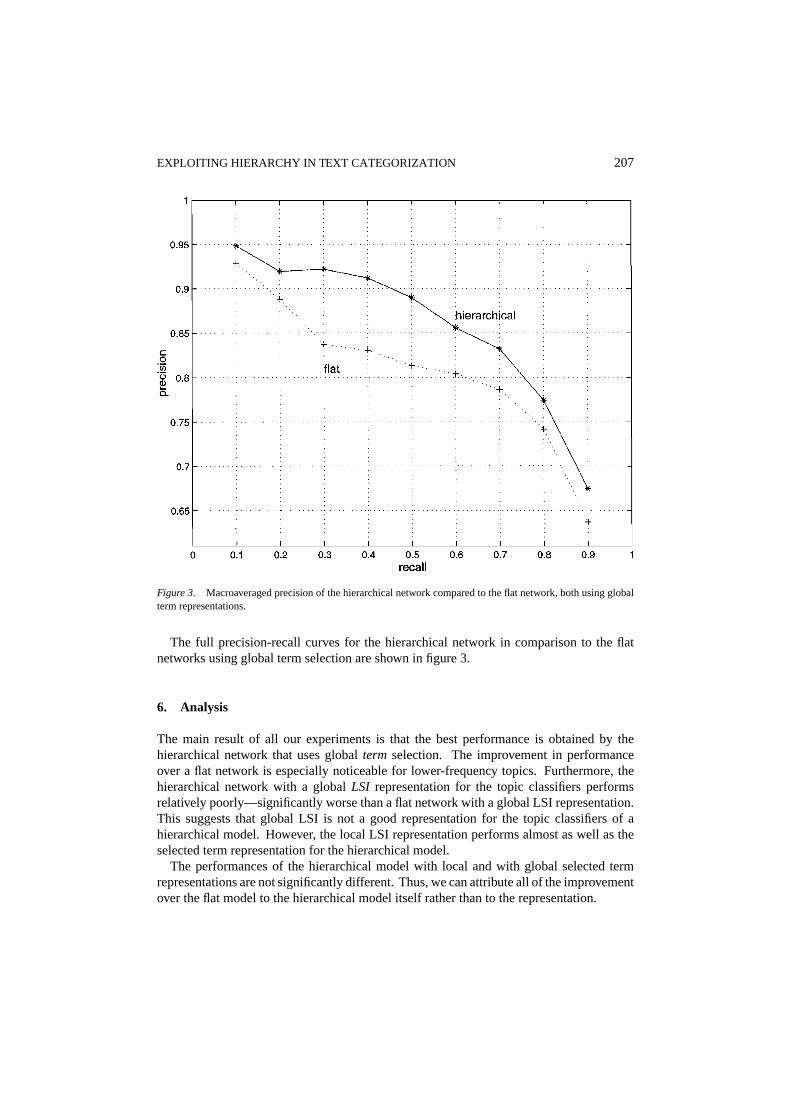
Figure 3. Macroaveraged precision of the hierarchical network compared to the flat network, both using globalterm representations.
The full precision-recall curves for the hierarchical network in comparison to the flatnetworks using global term selection are shown in figure 3.
6. Analysis
The main result of all our experiments is that the best performance is obtained by thehierarchical network that uses globalterm selection. The improvement in performanceover a flat network is especially noticeable for lower-frequency topics. Furthermore, thehierarchical network with a globalLSI representation for the topic classifiers performsrelatively poorly—significantly worse than a flat network with a global LSI representation.This suggests that global LSI is not a good representation for the topic classifiers of ahierarchical model. However, the local LSI representation performs almost as well as theselected term representation for the hierarchical model.
The performances of the hierarchical model with local and with global selected termrepresentations are not significantly different. Thus, we can attribute all of the improvementover the flat model to the hierarchical model itself rather than to the representation.
208 WEIGEND, WIENER, AND PEDERSEN
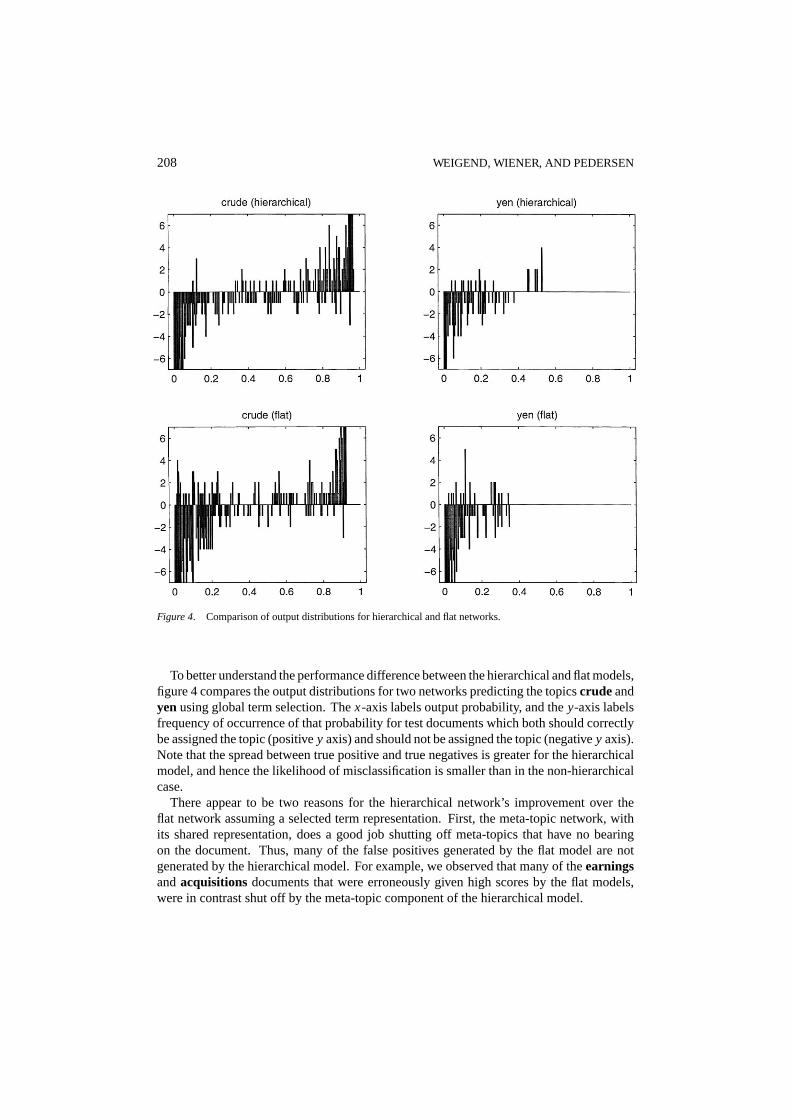
Figure 4. Comparison of output distributions for hierarchical and flat networks.
To better understand the performance difference between the hierarchical and flat models,figure 4 compares the output distributions for two networks predicting the topicscrude andyenusing global term selection. Thex-axis labels output probability, and they-axis labelsfrequency of occurrence of that probability for test documents which both should correctlybe assigned the topic (positivey axis) and should not be assigned the topic (negativey axis).Note that the spread between true positive and true negatives is greater for the hierarchicalmodel, and hence the likelihood of misclassification is smaller than in the non-hierarchicalcase.
There appear to be two reasons for the hierarchical network’s improvement over theflat network assuming a selected term representation. First, the meta-topic network, withits shared representation, does a good job shutting off meta-topics that have no bearingon the document. Thus, many of the false positives generated by the flat model are notgenerated by the hierarchical model. For example, we observed that many of theearningsandacquisitions documents that were erroneously given high scores by the flat models,were in contrast shut off by the meta-topic component of the hierarchical model.
EXPLOITING HIERARCHY IN TEXT CATEGORIZATION 209
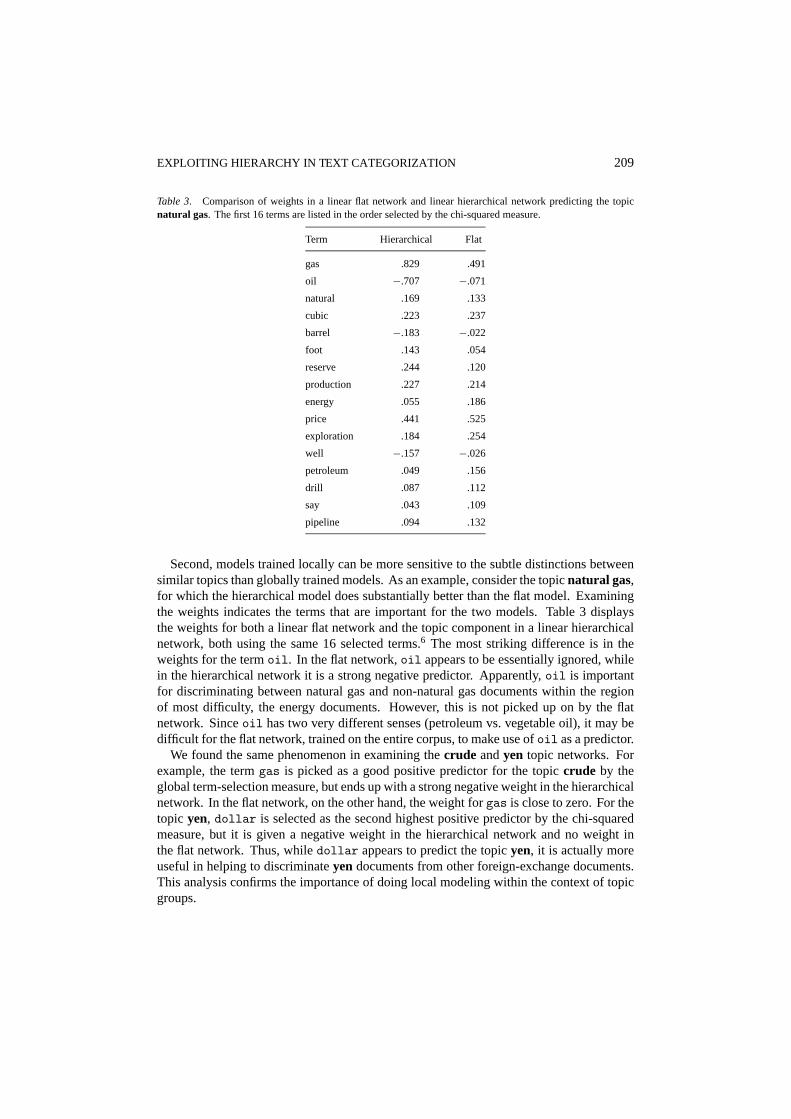
Table 3. Comparison of weights in a linear flat network and linear hierarchical network predicting the topicnatural gas. The first 16 terms are listed in the order selected by the chi-squared measure.
Term Hierarchical Flat
gas .829 .491
oil −.707 −.071
natural .169 .133
cubic .223 .237
barrel −.183 −.022
foot .143 .054
reserve .244 .120
production .227 .214
energy .055 .186
price .441 .525
exploration .184 .254
well −.157 −.026
petroleum .049 .156
drill .087 .112
say .043 .109
pipeline .094 .132
Second, models trained locally can be more sensitive to the subtle distinctions betweensimilar topics than globally trained models. As an example, consider the topicnatural gas,for which the hierarchical model does substantially better than the flat model. Examiningthe weights indicates the terms that are important for the two models. Table 3 displaysthe weights for both a linear flat network and the topic component in a linear hierarchicalnetwork, both using the same 16 selected terms.6 The most striking difference is in theweights for the termoil. In the flat network,oil appears to be essentially ignored, whilein the hierarchical network it is a strong negative predictor. Apparently,oil is importantfor discriminating between natural gas and non-natural gas documents within the regionof most difficulty, the energy documents. However, this is not picked up on by the flatnetwork. Sinceoil has two very different senses (petroleum vs. vegetable oil), it may bedifficult for the flat network, trained on the entire corpus, to make use ofoil as a predictor.
We found the same phenomenon in examining thecrude andyen topic networks. Forexample, the termgas is picked as a good positive predictor for the topiccrude by theglobal term-selection measure, but ends up with a strong negative weight in the hierarchicalnetwork. In the flat network, on the other hand, the weight forgas is close to zero. For thetopic yen, dollar is selected as the second highest positive predictor by the chi-squaredmeasure, but it is given a negative weight in the hierarchical network and no weight inthe flat network. Thus, whiledollar appears to predict the topicyen, it is actually moreuseful in helping to discriminateyen documents from other foreign-exchange documents.This analysis confirms the importance of doing local modeling within the context of topicgroups.
210 WEIGEND, WIENER, AND PEDERSEN
7. Conclusion and Outlook
Many problems in information systems and knowledge engineering have some domainstructure of hierarchical nature. Examples range from cataloging systems in traditionallibraries to hierarchical directories on the Web. Most published algorithms for text catego-rization do not take any advantage of the inherent hierarchical structure. The task, to obtainestimates of the probabilities of the individual categories, is very difficult to achieve for flat,non-hierarchical architectures. On the input side, a flat architecture requires a large numberof predictors to contain sufficient information for the potentially very subtle distinctions inbetween very close categories. The finer the required distinctions are, the worse the curseof dimensionality becomes. On the output side, many categories have a very low ratio ofpositive to negative examples, often only one positive for tens of thousands of negativeexamples.
This paper addresses these problems by using a divide-and-conquer strategy that mimicsthe hierarchical structure of knowledge that is ignored in flat inference models. On the first(coarse) level of the hierarchy, the task is to assign the probabilities of the meta-topics toeach document. We have manually divided all topics into five meta-topics. Each meta-topiccontains a reasonable number of positive examples in comparison to the negative examples.Since this level does not require particularly fine distinctions between individual topics,Latent Semantic Indexing (LSI) turns out to be an appropriate input representation. We usea 200-dimensional linear subspace of the original term space.
On the next level of the hierarchy, each model has to learn to differentiate only within themeta-topic it belongs to, and no longer against the other meta-topics. Note that this againavoids too small ratios of positive to negative examples in training. For the inputs of thesesub-models, we compared several choices for the inputs, consisting of individual terms aswell as of LSI. In both cases, we computed the optimal sets both on a group basis (whereevery sub-model had the same set of inputs), as well as individual sets for each subset orcategory.
The improvement is robust: Differences between these 2×2 choices were small comparedto the gain obtained through the hierarchical approach in comparison to a non-hierarchicalapproach. We presented a statistically significant overall improvement of five percent foraveraged precision. The strongest gains are on rare categories that otherwise suffer fromthe lack of relevant inputs and a too small ratio of positive to negative examples. Beside theperformance improvements, we gave several insights into the specific solutions the networkhas found.
This paper used a hierarchy of two levels. The extension to more than two levels isstraightforward and can be carried out recursively. From a practical perspective, this makessense as long as a sufficient number of positive training example per category is available.For the Reuters corpus, two levels were appropriate. For most Web search catalogues ordirectories, deeper hierarchies can (and should) be used. The main result of this paper isthat a hierarchical structure helps to improve predictions for rare classes. Furthermore, thedifferent parts of the hierarchical architecture can be trained independently. This solvesthe otherwise very serious problem of scaling up to very large and heterogeneous textcollections such as the Web.
EXPLOITING HIERARCHY IN TEXT CATEGORIZATION 211
The approach presented here is based on a solid statistical framework that allows theinterpretation of the results as probabilities. This is important since it allows the combinationof topic predictions from our model in a principled way with information from other models.
Appendix: The Topics and Their Hierarchy
The Appendix presents all of the topics with additional information in form of a table.
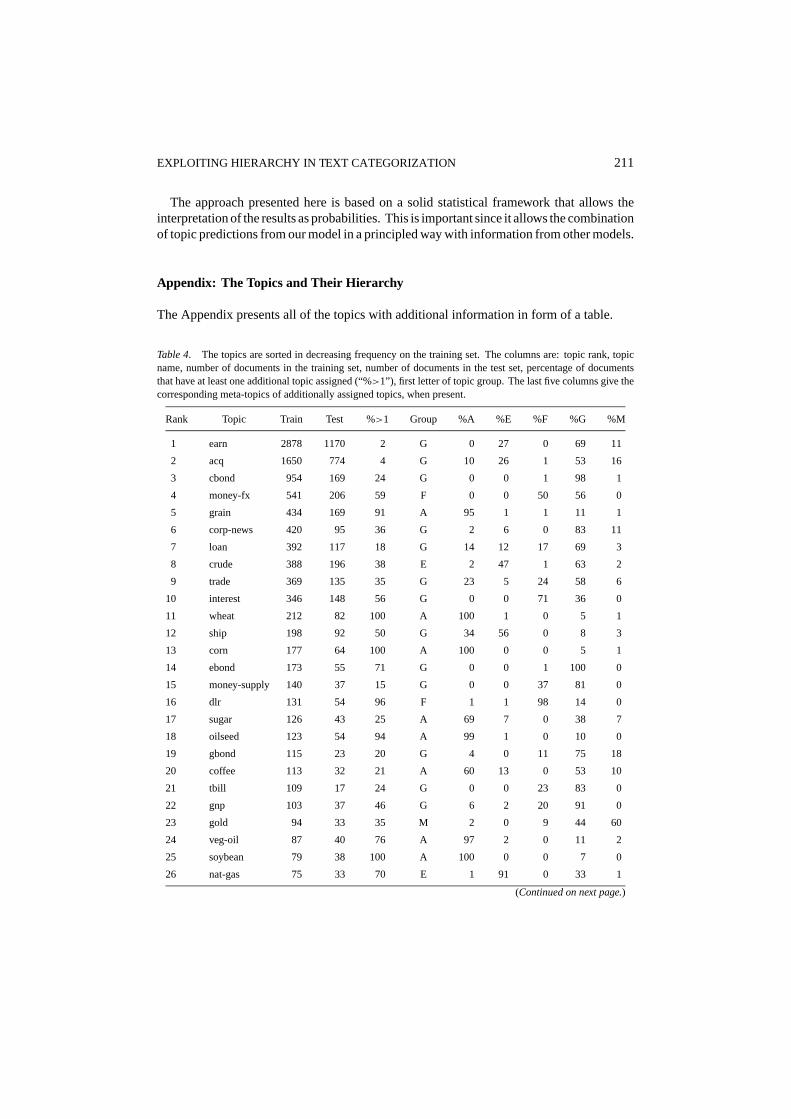
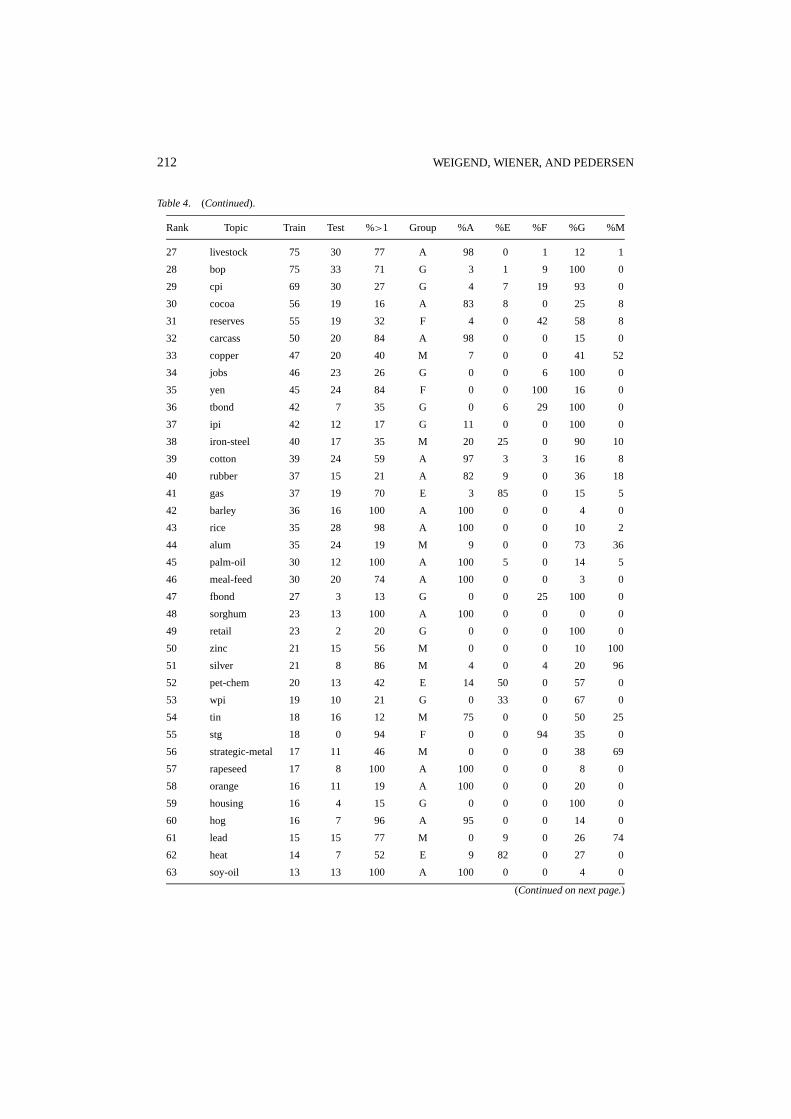
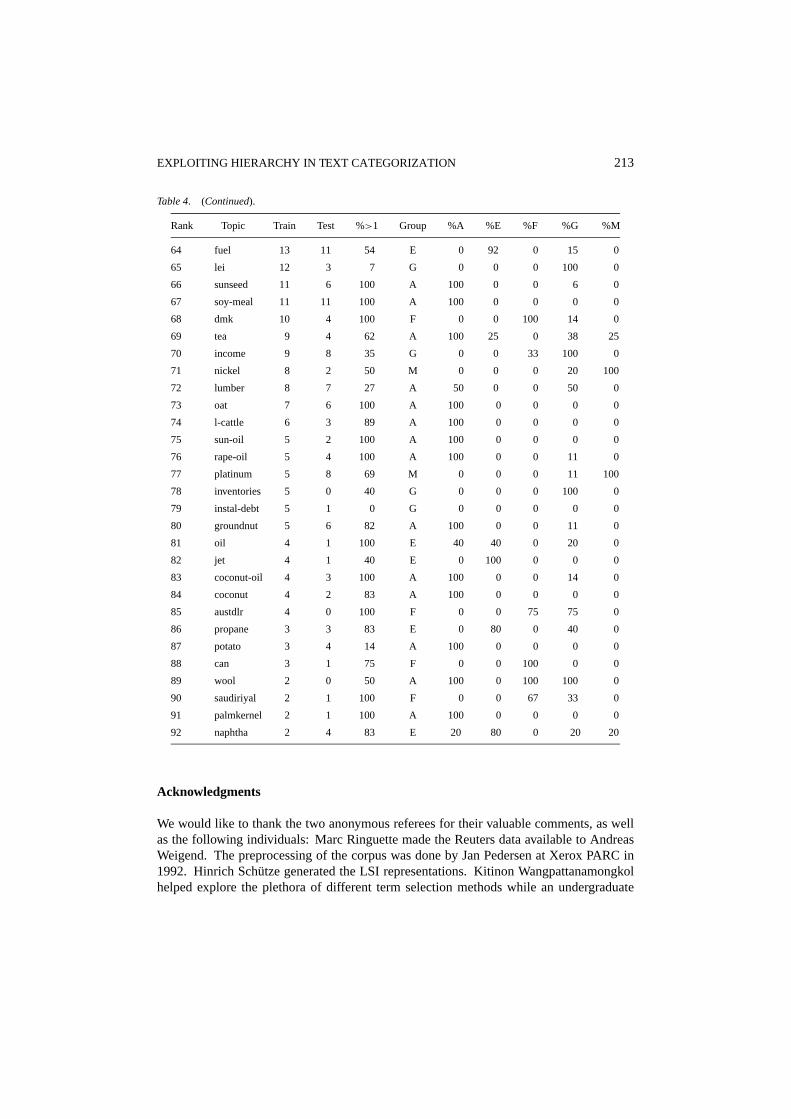
Table 4. The topics are sorted in decreasing frequency on the training set. The columns are: topic rank, topicname, number of documents in the training set, number of documents in the test set, percentage of documentsthat have at least one additional topic assigned (“%>1”), first letter of topic group. The last five columns give thecorresponding meta-topics of additionally assigned topics, when present.
Rank Topic Train Test %>1 Group %A %E %F %G %M
1 earn 2878 1170 2 G 0 27 0 69 11
2 acq 1650 774 4 G 10 26 1 53 16
3 cbond 954 169 24 G 0 0 1 98 1
4 money-fx 541 206 59 F 0 0 50 56 0
5 grain 434 169 91 A 95 1 1 11 1
6 corp-news 420 95 36 G 2 6 0 83 11
7 loan 392 117 18 G 14 12 17 69 3
8 crude 388 196 38 E 2 47 1 63 2
9 trade 369 135 35 G 23 5 24 58 6
10 interest 346 148 56 G 0 0 71 36 0
11 wheat 212 82 100 A 100 1 0 5 1
12 ship 198 92 50 G 34 56 0 8 3
13 corn 177 64 100 A 100 0 0 5 1
14 ebond 173 55 71 G 0 0 1 100 0
15 money-supply 140 37 15 G 0 0 37 81 0
16 dlr 131 54 96 F 1 1 98 14 0
17 sugar 126 43 25 A 69 7 0 38 7
18 oilseed 123 54 94 A 99 1 0 10 0
19 gbond 115 23 20 G 4 0 11 75 18
20 coffee 113 32 21 A 60 13 0 53 10
21 tbill 109 17 24 G 0 0 23 83 0
22 gnp 103 37 46 G 6 2 20 91 0
23 gold 94 33 35 M 2 0 9 44 60
24 veg-oil 87 40 76 A 97 2 0 11 2
25 soybean 79 38 100 A 100 0 0 7 0
26 nat-gas 75 33 70 E 1 91 0 33 1
(Continued on next page.)
212 WEIGEND, WIENER, AND PEDERSEN
Table 4. (Continued).
Rank Topic Train Test %>1 Group %A %E %F %G %M
27 livestock 75 30 77 A 98 0 1 12 1
28 bop 75 33 71 G 3 1 9 100 0
29 cpi 69 30 27 G 4 7 19 93 0
30 cocoa 56 19 16 A 83 8 0 25 8
31 reserves 55 19 32 F 4 0 42 58 8
32 carcass 50 20 84 A 98 0 0 15 0
33 copper 47 20 40 M 7 0 0 41 52
34 jobs 46 23 26 G 0 0 6 100 0
35 yen 45 24 84 F 0 0 100 16 0
36 tbond 42 7 35 G 0 6 29 100 0
37 ipi 42 12 17 G 11 0 0 100 0
38 iron-steel 40 17 35 M 20 25 0 90 10
39 cotton 39 24 59 A 97 3 3 16 8
40 rubber 37 15 21 A 82 9 0 36 18
41 gas 37 19 70 E 3 85 0 15 5
42 barley 36 16 100 A 100 0 0 4 0
43 rice 35 28 98 A 100 0 0 10 2
44 alum 35 24 19 M 9 0 0 73 36
45 palm-oil 30 12 100 A 100 5 0 14 5
46 meal-feed 30 20 74 A 100 0 0 3 0
47 fbond 27 3 13 G 0 0 25 100 0
48 sorghum 23 13 100 A 100 0 0 0 0
49 retail 23 2 20 G 0 0 0 100 0
50 zinc 21 15 56 M 0 0 0 10 100
51 silver 21 8 86 M 4 0 4 20 96
52 pet-chem 20 13 42 E 14 50 0 57 0
53 wpi 19 10 21 G 0 33 0 67 0
54 tin 18 16 12 M 75 0 0 50 25
55 stg 18 0 94 F 0 0 94 35 0
56 strategic-metal 17 11 46 M 0 0 0 38 69
57 rapeseed 17 8 100 A 100 0 0 8 0
58 orange 16 11 19 A 100 0 0 20 0
59 housing 16 4 15 G 0 0 0 100 0
60 hog 16 7 96 A 95 0 0 14 0
61 lead 15 15 77 M 0 9 0 26 74
62 heat 14 7 52 E 9 82 0 27 0
63 soy-oil 13 13 100 A 100 0 0 4 0
(Continued on next page.)
EXPLOITING HIERARCHY IN TEXT CATEGORIZATION 213
Table 4. (Continued).
Rank Topic Train Test %>1 Group %A %E %F %G %M
64 fuel 13 11 54 E 0 92 0 15 0
65 lei 12 3 7 G 0 0 0 100 0
66 sunseed 11 6 100 A 100 0 0 6 0
67 soy-meal 11 11 100 A 100 0 0 0 0
68 dmk 10 4 100 F 0 0 100 14 0
69 tea 9 4 62 A 100 25 0 38 25
70 income 9 8 35 G 0 0 33 100 0
71 nickel 8 2 50 M 0 0 0 20 100
72 lumber 8 7 27 A 50 0 0 50 0
73 oat 7 6 100 A 100 0 0 0 0
74 l-cattle 6 3 89 A 100 0 0 0 0
75 sun-oil 5 2 100 A 100 0 0 0 0
76 rape-oil 5 4 100 A 100 0 0 11 0
77 platinum 5 8 69 M 0 0 0 11 100
78 inventories 5 0 40 G 0 0 0 100 0
79 instal-debt 5 1 0 G 0 0 0 0 0
80 groundnut 5 6 82 A 100 0 0 11 0
81 oil 4 1 100 E 40 40 0 20 0
82 jet 4 1 40 E 0 100 0 0 0
83 coconut-oil 4 3 100 A 100 0 0 14 0
84 coconut 4 2 83 A 100 0 0 0 0
85 austdlr 4 0 100 F 0 0 75 75 0
86 propane 3 3 83 E 0 80 0 40 0
87 potato 3 4 14 A 100 0 0 0 0
88 can 3 1 75 F 0 0 100 0 0
89 wool 2 0 50 A 100 0 100 100 0
90 saudiriyal 2 1 100 F 0 0 67 33 0
91 palmkernel 2 1 100 A 100 0 0 0 0
92 naphtha 2 4 83 E 20 80 0 20 20
Acknowledgments
We would like to thank the two anonymous referees for their valuable comments, as wellas the following individuals: Marc Ringuette made the Reuters data available to AndreasWeigend. The preprocessing of the corpus was done by Jan Pedersen at Xerox PARC in1992. Hinrich Sch¨utze generated the LSI representations. Kitinon Wangpattanamongkolhelped explore the plethora of different term selection methods while an undergraduate
214 WEIGEND, WIENER, AND PEDERSEN
at Chulalongkorn and a summer student at Xerox PARC in 1992. Andreas Weigendthanks David E. Rumelhart for sharing his intuitions about neural networks, and JohnW. Tukey for all the discussions about input features and his guidance in the interpretationof the clustering results that lead to the final hierarchical structure we used here. The re-sults presented here were obtained by Erik Wiener during summer 1994 at Xerox PARCand are presented in his Masters thesis at the University of Colorado (Wiener 1995). Adifferent set of questions on the same corpus was answered at SDAIR in 1995 (Wieneret al. 1995).
Notes
1. The Reuters-22173 collection has been replaced since our experiments by the Reuters-21578 collection, whichrepresents a cleaner, better documented subset of the same underlying data. The Reuters-21578 collection ismaintained by David D. Lewis at www.research.att.com/∼lewis/reuters21578.html
2. While we manually picked these groups in order to focus on the effect of a grouping onto the task of textcategorization, is also possible tolearn a hierarchical structure. Pereira et al. (1993) use an annealingapproach to clustering proposed by Rose et al. (1990) for this task. Hofmann (1998) shows that a hierarchicalmixture model can be used for clustering of documents. Note, however, that we are interested in supervisedlearning, since we start with a collection of documents where topic classes are provided and already assigned.This allows for rigid evaluation of the performance which is by nature not possible in unsupervised learning(here in the form of clustering and of competitive learning). Furthermore, many documents are not solelyabout a single topic but tend to be assigned more than one topic. This is in contrast to the assumption made inthe data generating process for clustering where each observed vector is assumed to have been generated byexactly one hidden group. An interesting area of research is the development of statistically principled methodsthat allow for overlapping groups and combine the supervised part (topics given) with an unsupervised part(groupings to be learned).
3. The comparison to logistic regression (i.e., no hidden units) is a healthy check: many standard statisticalpackages have good routines for logistic regression. The neural network without hidden units should lead thatsame results as logistic regression. When hidden units are subsequently introduced, the amount of improvementover simple logistic regression indicates the importance of the potential nonlinear structure in the data. Ourexperiments on the Reuters topic spotting data do not show significant improvement with hidden units overdirect connections. We suspect that two factors make it difficult to find nonlinearities: (1) the simple heuristicof “early stopping” has a bias towards linear models (LeBaron and Weigend 1998), (2) the high noise in thedata masks potentially more subtle nonlinearities. To focus this article on the issue of hierarchy, we use hiddenunits in the neural networks throughout this paper and eliminate the extra dimension of nonlinear vs. linearlogistic regression. The detailed comparison between linear and nonlinear performances is given in (Wiener1995).
4. It might be interesting to compare our two sets of terms for the topiccrude with the top ten terms given byKoller and Sahami (1997) (“KS”). Using the chi-squared measure based on the entire corpus, the top 50 termsinclude eight of the ten KS terms (missingship andattack). In contrast, when computing the chi-squaredmeasure based on theENERGYset, the top 50 terms include only a single KS term (barrel). This indicates thatKS’s term selection method does not exploit the local structure to the same degree as the chi-squared approachon theENERGYset does.
5. We thank one of the referees for pointing out that these results have recently been improved. The best publishedresults on the Apte et al. (1994) are now 0.85 usingk-nearest neighbors (Yang 1999). This can be interpretedas a further validation of the range of the baseline results.
6. Since we found little difference in the performance of linear and nonlinear networks, we use a linear networkfor analysis here in order to be able to more easily analyze the network weights. We could have also usedsensitivity analysis to discover the important inputs in the nonlinear networks.
EXPLOITING HIERARCHY IN TEXT CATEGORIZATION 215
References
Apte C, Damerau F and Weiss S (1994) Towards language independent automated learning of text categorizationmodels. In: Proceedings of the 17th Annual ACM/SIGIR Conference, pp. 23–30.
Berger JO (1985) Statistical Decision Theory and Bayesian Analysis. Springer Verlag.Bishop CM (1996) Neural Networks for Pattern Recognition. Oxford University Press.Breiman L, Friedman JH, Olshen RA and Stone CJ (1984) Classification and Regression Trees (CART).
Wadsworth, Pacific Grove, CA.Buckley C, Salton G and Allen J (1994) The effect of adding relevance information in a relevance feedback
environment. In: Proceedings of the 17th Annual ACM/SIGIR Conference, pp. 292–300.Cherkassky VS and Mulier FM (1998) Learning from Data: Concepts, Theory, and Methods. Wiley, New York.Cohen WW and Singer Y (1996) Context-sensitive learning metods for text categorization. In: SIGIR’96: Proceed-
ings of the 19th Annual International ACM SIGIR Conference on Research and Development in InformationRetrieval, pp. 307–315.
Collett D (1991) Modelling Binary Data. Chapman and Hall, London.Dagan I, Feldman R and Hirsh H (1996) Keyword-based browsing and analysis of large document sets. In: Fifth
Annual Symposium on Document Analysis and Information Retrieval (SDAIR’96), pp. 191–208.D’Alessio S, Kershenbaum A, Murray K and Schiaffino R (1998) Hierarchical text categorization. Technical
Report, Department of Computer Science, Polytechnic University, Brooklyn, NY.Deerwester S, Dumais S, Furnas G, Landauer T and Harshman R (1990) Indexing by latent semantic analysis.
Journal of the American Society for Information Science, 41(6):391–407.Duda RO, Hart PE and Stork DG (1999) Pattern Classification and Scene Analysis, Part I: Pattern Classification.
Wiley, New York.Haykin SS (1998) Neural Networks: A Comprehensive Foundation. Prentice Hall.Hertz J, Krogh A and Palmer RG (1991) Introduction to the Theory of Neural Computation. Addison-Wesley,
Reading, MA.Hofmann T (1998) Learning and representing topic: A hierarchical mixture model for word occurrences in
document databases. In: Conference for Automated Learning and Discovery, Workshop on Learning from Textand the Web (CMU).
Hull D (1993) Using statistical testing in the evaluation of retrieval experiments. In: Proceedings of the 16thAnnual ACM/SIGIR Conference, pp. 329–338.
Hull D (1994) Improving text retrieval for the routing problem using latent semantic indexing. In: Proceedings ofthe 17th Annual ACM/SIGIR Conference, pp. 282–291.
Ittner DJ, Lewis DD and Ahn DD (1995) Text categorization of low quality images. In: Proceedings of the FourthAnnual Symposium on Document Analysis and Information Retrieval, pp. 301–315.
Kennedy RL, Lee Y, Roy BV and Reed C (1998) Solving Data Mining Problems Through Pattern Recognition.Prentice Hall.
Koller D and Sahami M (1997) Hierarchically classifying documents using very few words. In: Proceedings ofthe 14th International Conference on Machine Learning (Nashville, Tennessee), pp. 170–178.
LeBaron B and Weigend AS (1998) A bootstrap evaluation of the effect of data splitting on financial time series.IEEE Transactions on Neural Networks, 9(1):213–220.
Lewis DD (1992) Representation and Learning in Information Retrieval. Ph.D. Thesis, Computer ScienceDepartment, Univ. of Massachussetts at Amherst.
Lewis DD and Ringuette M (1994) A comparison of two learning algorithms for text categorization. In: Proceed-ings of the Third Annual Symposium on Document Analysis and Information Retrieval, pp. 81–93.
Masand B, Linoff G and Waltz D (1992) Classifying news stories using memory based reasoning. In: Proceedingsof the 15th Annual ACM/SIGIR Conference, pp. 59–65.
McCullagh P and Nelder JA (1989) Generalized Linear Models. Chapman and Hall, London.Nilsson NJ (1998) Artificial Intelligence: A New Synthesis. Morgan Kaufmann.Pereira F, Tishby N and Lee L (1993) Distributional clustering of English words. In: Proceedings of the 31st
Annual Meeting of the Association for Computational Linguistics, pp. 183–190.Rocchio JJ (1971) Relevance feedback in information retrieval. In: The SMART Retrieval System: Experiments
in Automatic Document Processing. Prentice Hall, chap. 14, pp. 313–323.
216 WEIGEND, WIENER, AND PEDERSEN
Rose K, Gurewitz E and Fox GC (1990) Statistical mechanics and phase transitions in clustering. Physical ReviewLetters, 65:945–948.
Rumelhart DE, Durbin R, Golden R and Chauvin Y (1996) Backpropagation: The basic theory. In: SmolenskyP, Mozer MC and Rumelhart DE, eds. Mathematical Perspectives on Neural Networks. Lawrence ErlbaumAssociates, Hillsdale, NJ, pp. 533–566.
Russell SJ and Norvig P (1995) Artificial Intelligence: A Modern Approach (Prentice Hall Series in ArtificialIntelligence). Prentice Hall, Englewood Cliffs, NJ.
Schuetze H, Hull DA and Pedersen JO (1995) A comparison of classifiers and document representations for therouting problem. In: Fox EA, Ingwersen P and Fidel R, eds. Proceedings of the 18th Annual InternationalACM/SIGIR Conference on Research and Development in Information Retrieval, pp. 229–237.
van Rijsbergen CJ (1979) Information Retrieval, 2nd ed. Butterworths.Vapnik VN (1998) Statistical Learning Theory (Adaptive and Learning Systems for Signal Processing, Commu-
nications, and Control). Wiley, New York.Wiener ED (1995) A neural network approach to topic spotting in text. Master’s Thesis, Department of Computer
Science, University of Colorado at Boulderwww.stern.nyu.edu/∼aweigend/Research/Papers/TextCategorization/Wiener Thesis95.ps.
Wiener ED, Pedersen, JO and Weigend AS (1995) A neural network approach to topic spotting. In:Fourth Annual Symposium on Document Analysis and Information Retrieval (SDAIR’95), pp. 317–332.www.stern.nyu.edu/∼aweigend/Research/Papers/TextCategorization/Wiener.Pedersen.Weigend SDAIR95.ps.
Yang Y (1994) Expert network: Effective and efficient learning from human decisions in text categorization andretrieval. In: Proceedings of the 17th Annual ACM/SIGIR Conference, pp. 13–22.
Yang Y (1999) An evaluation of statistical approaches to text categorization. Information Retrieval.Yang Y and Chute CG (1992) A linear least squares fit mapping method for information retrieval from natural
language texts. In: Proceedings of the 14th International Conference on Computational Linguistics, pp. 447–453.
Yang Y and Chute CG (1994) An example-based mapping method for text categorization and retrieval. In: ACMTransaction on Information Systems (TOIS), pp. 252–277.