Embed Size (px)
Citation preview
Exploiting Contextual Correlation for Collaborative Annotation in an Online Media Sharing Social Network
Bageshree Shevade Hari Sundaram Arts Media and Engineering Program, AME-TR-2005-20
Arizona State University e-mail: {bageshree.shevade, hari.sundaram}@asu.edu
ABSTRACT This paper describes our system that enables members of an online social network to collaboratively annotate a shared media collection. Online photo-sharing networks are very popular and primarily support text based search, making robust annotation systems important. A key observation is that real-world activities of members of the social network are often correlated, within a specific context. There are four contributions of this paper: (a) experimentally verify the degree of semantic disagreement over a shared set of everyday common photos (b) develop event context models and measures for contextual correlation amongst members of the social network (c) spreading activation based group recommendation algorithms that exploit contextual correlation (d) experimental tests on real-world, everyday images. We compare our results against two baseline algorithms and our quantitative and qualitative results indicate that the context based recommendations work well.
1. INTRODUCTION In this paper, we develop a novel collaborative annotative system that exploits the correlation in user context, to enable members of a online social network to effectively annotate images. The problem is important since online image sharing frameworks such as Flickr [1] have become extremely popular. In such systems text tags are primarily used to search for photos, hence robust annotation schemes are very much desired. The annotation problem in social networks has several unique characteristics different from the traditional annotation problem.
The participants in the network are often friends, and know each other well. They participate in common activities – e.g. “going to a film” , parties etc. There is a significant correlation to their real world activities.
Social networks involve multiple users – this implies that each user may have a distinctly different annotation scheme, and different mechanisms for assigning labels. There may be significant semantic disagreement amongst the users, over the same set of images.
The traditional image annotation problem is a very challenging – only a small fraction of the images are annotated by the user, severely restricting the ground truth available. This makes the problem of developing robust classifiers hard. It may seem fruitless to develop annotation mechanisms, for social networks – where the problems seem to have multiplied. Counter intuitively, the annotation problem is helped by the formation of the social network. The key observation here is that members of the social network have highly correlated real-world activities – i.e. they will participate in common activities together, and often repeatedly. For example Jane and Mary may be good
friends who always do things together – e.g. shop together at the McAllister mall. For Jane, “shopping” and “Mary” and “McAllister” go together. Also, the shopping event may recur many times over their friendship. Since Mary and Jane’s activities are correlated, this has the effect on the data – they will often take images of the same event / activity, thus increasing the ground truth available. Detecting correlation amongst members of the social network, and the specific context in which these common activities occur, can greatly help the annotation algorithms. We now highlight the unique and novel contributions of this paper.
1. Experimental verification of disagreement: We have conducted detailed experiments on a small social network that indicates semantic disagreement on everyday photographs.
2. Contextual Correlation: We identify key facets of the event context, and develop a user event context model as well as measures to estimate contextual correlation.
3. Group recommendation algorithm: We develop a recommendation algorithm that first identifies correlated sub-groups for each user, and develop a spreading activation algorithm to determine optimal recommendations.
4. Experimental results on real-world images: Our experiments have been conducted on real-world everyday images and indicate that context based recommendation algorithms perform very well.
The rest of this paper is as follows. In the next section, we discuss related work. In Section 3, we describe our initial experiments to show lack of consensual agreement. Section 4, describes contextual correlation in detail. In Section 5, we discuss recommendations via Activation Spreading. Section 6 describes our collaborative annotation algorithm in detail. In Section 7, we present our experimental results. Finally, we present our conclusions in Section 8.
2. RELATED WORK There has been prior work in creating collaborative annotation systems [11,14]. In [14], the authors explore a collaborative annotation system for mobile devices. They allow users to annotate digital photos at the time of capture. There they used appearance based recommendations as well as location context to suggest annotations to mobile users. Though the system reduces the efforts by the user, as well as inaccuracy of meta-data because of the absence of time lag, the system has problems associated with display, navigation, searching and browsing due to limited screen size and network unpredictability. In [5], the authors describe a collaborative annotation procedure for scientific visualization tasks, that can be done remotely. The users of their system annotate the same media element. Their
system supports digital ink, voice and text annotations. They provide visual cues to notify users of upcoming frames that contain annotations. The system also allows the users to view annotations by type viz. digital ink, voice or text as well as annotations by certain specific users. However, the system does not learn from the user preferences and does not influence her annotations for the next media. Thus, there is no notion of user-context and the system does not exploit the existence of annotations made by other users. In [8], the authors conducted a preliminary study to understand how personal annotations are used in collaborative situations and the transitions the annotations undergo when they move from a personal to a shared environment such as on-line discussions, group interpretation of collected materials etc. In [9], the authors confirm – (a) that only a small fraction of annotations made while reading are directly related to those shared in discussion, (b) some types of annotations – those that consist of anchors in the text coupled with margin notes – are more apt to be the basis of public commentary and on-line discussions than other types of annotations, and (c) personal annotations undergo transitions both in content and in how they are anchored to the source document when they are shared. However, the authors do not investigate how differences in the annotations of different users influence on-line discussions, or how do the on-line discussions affect individual summaries or vice versa. Thus, they do not address issues of user-context, group semantics. In [10], the authors provide label suggestions for identities based on patterns of re-occurrence and co-occurrence of different people in different locations and events. However, they do not make use of user-context, or commonsensical and linguistic relationships and group semantics. In [2,6], the authors use sophisticated classification techniques for image annotation. However, they do not investigate collaborative annotation within a social network.
3. DO PEOPLE AGREE?
We now attempt to quantify the degree of agreement amongst members of a media sharing social network, over a common set of photographs. This is an important issue for the following reasons. Traditional annotation frameworks involve designing classifiers per concept – this assumes a consistent labeling of the images per class over the dataset. Traditional schemes can work well when applied to a single users dataset, when there is a high likelihood of consistent labeling. This strategy when applied to a social network implicitly assumes that all members of the social network are in agreement over the ground truth labels assigned to the images in each concept. It is hence important to test the consistency assumption. Empirically, we observe disagreement, particularly, on concepts that are more abstract, rather than concrete [13]. For example, abstract concepts such as “love”,
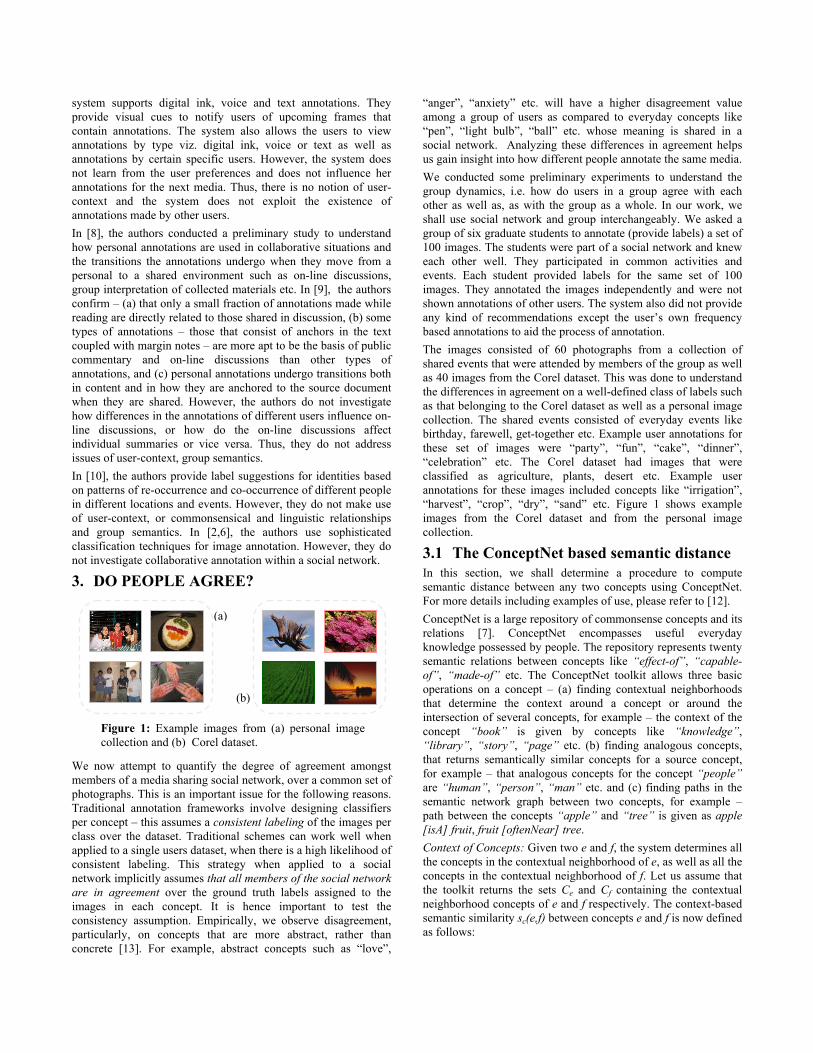
“anger”, “anxiety” etc. will have a higher disagreement value among a group of users as compared to everyday concepts like “pen”, “light bulb”, “ball” etc. whose meaning is shared in a social network. Analyzing these differences in agreement helps us gain insight into how different people annotate the same media. We conducted some preliminary experiments to understand the group dynamics, i.e. how do users in a group agree with each other as well as, as with the group as a whole. In our work, we shall use social network and group interchangeably. We asked a group of six graduate students to annotate (provide labels) a set of 100 images. The students were part of a social network and knew each other well. They participated in common activities and events. Each student provided labels for the same set of 100 images. They annotated the images independently and were not shown annotations of other users. The system also did not provide any kind of recommendations except the user’s own frequency based annotations to aid the process of annotation. The images consisted of 60 photographs from a collection of shared events that were attended by members of the group as well as 40 images from the Corel dataset. This was done to understand the differences in agreement on a well-defined class of labels such as that belonging to the Corel dataset as well as a personal image collection. The shared events consisted of everyday events like birthday, farewell, get-together etc. Example user annotations for these set of images were “party”, “fun”, “cake”, “dinner”, “celebration” etc. The Corel dataset had images that were classified as agriculture, plants, desert etc. Example user annotations for these images included concepts like “irrigation”, “harvest”, “crop”, “dry”, “sand” etc. Figure 1 shows example images from the Corel dataset and from the personal image collection.
3.1 The ConceptNet based semantic distance In this section, we shall determine a procedure to compute semantic distance between any two concepts using ConceptNet. For more details including examples of use, please refer to [12]. ConceptNet is a large repository of commonsense concepts and its relations [7]. ConceptNet encompasses useful everyday knowledge possessed by people. The repository represents twenty semantic relations between concepts like “effect-of”, “capable-of”, “made-of” etc. The ConceptNet toolkit allows three basic operations on a concept – (a) finding contextual neighborhoods that determine the context around a concept or around the intersection of several concepts, for example – the context of the concept “book” is given by concepts like “knowledge”, “library”, “story”, “page” etc. (b) finding analogous concepts, that returns semantically similar concepts for a source concept, for example – that analogous concepts for the concept “people” are “human”, “person”, “man” etc. and (c) finding paths in the semantic network graph between two concepts, for example – path between the concepts “apple” and “tree” is given as apple [isA] fruit, fruit [oftenNear] tree. Context of Concepts: Given two e and f, the system determines all the concepts in the contextual neighborhood of e, as well as all the concepts in the contextual neighborhood of f. Let us assume that the toolkit returns the sets Ce and Cf containing the contextual neighborhood concepts of e and f respectively. The context-based semantic similarity sc(e,f) between concepts e and f is now defined as follows:
(a)
(b)
Figure 1: Example images from (a) personal image collection and (b) Corel dataset.
| |( , ) ,
| |e f
ce f
C Cs e f
C C∩
=∪
<1>
where |Ce∩Cf| is the cardinality of the set consisting of common concepts in Ce and Cf and |Ce∪Cf| is the cardinality of the set consisting of union of Ce and Cf. Analogous Concepts: Given concepts e and f the system determines all the analogous concepts of concept e as well as concept f. Let us assume that the returned sets Ae and Af contain the analogous concepts for e and f respectively. The semantic distance sa(e,f) between concepts e and f based on analogous concepts is then defined as follows:
| |( , ) ,
| |e f
ae f
A As e f
A A∩
=∪
<2>
where |Ae∩Af| is the cardinality of the set consisting of common concepts in Ae and Af and |Ae∪Af| is the cardinality of the set consisting of union of Ae and Af. Number of paths between two concepts: Given concepts e and f, the system determines the path between them. The system extracts the total number of paths between the two concepts as well as the number of hops in each path. The path-based semantic distance sp(e,f) between concepts e and f is then given as follows:
1
1 1( , ) ,N
pi i
s e fN h=
= ∑ <3>
where N is the total number of paths between concepts e and f in the semantic network graph of ConceptNet and hi is the number of hops in path i. The final semantic similarity between concepts e and f is then computed as the weighted sum of the above measures. We have defined equal weight for each of the above measures. The final semantic distance is given as follows:
( , ) ( , ) ( , ) ( , ),c c a a p ps e f w s e f w s e f w s e f= + + <4>
where wc=wa=wp and wc+wa+wp =1. In this subsection, we discussed ConceptNet as well as the calculation of semantic distance measure between two concepts using ConceptNet toolkit.
3.2 Agreement of a user with group We measured how individual members within a group agreed with the rest of the members of the group as a whole. This was done to determine if there was any consistency or differences in the way individual users agreed with the group. We computed several agreement measures for the members – (a) agreement measure of each user with the group on a per image basis, (b) average agreement measure of all users per image, and (c) pair wise agreement measures among users per image. Let us assume that the user Jane has annotated image i with annotations a1…am. Let us also assume that the other members of the group have annotated the image i with annotations g1…gn. Then the group agreement measure of user U1 with respect to image i, a(U1,i) is then given as:
{ }11
1)( , max ( , ) , 1... , max( , ),
M
i kjiK
a U i s a g j N K N M=
= = =∑ <5>
where M is the number of annotations of user Jane, N is the number of annotations by other members of the group and s(ai,gj)
is the ConceptNet similarity between two annotations. ConceptNet similarity ranges from 0 to 1.
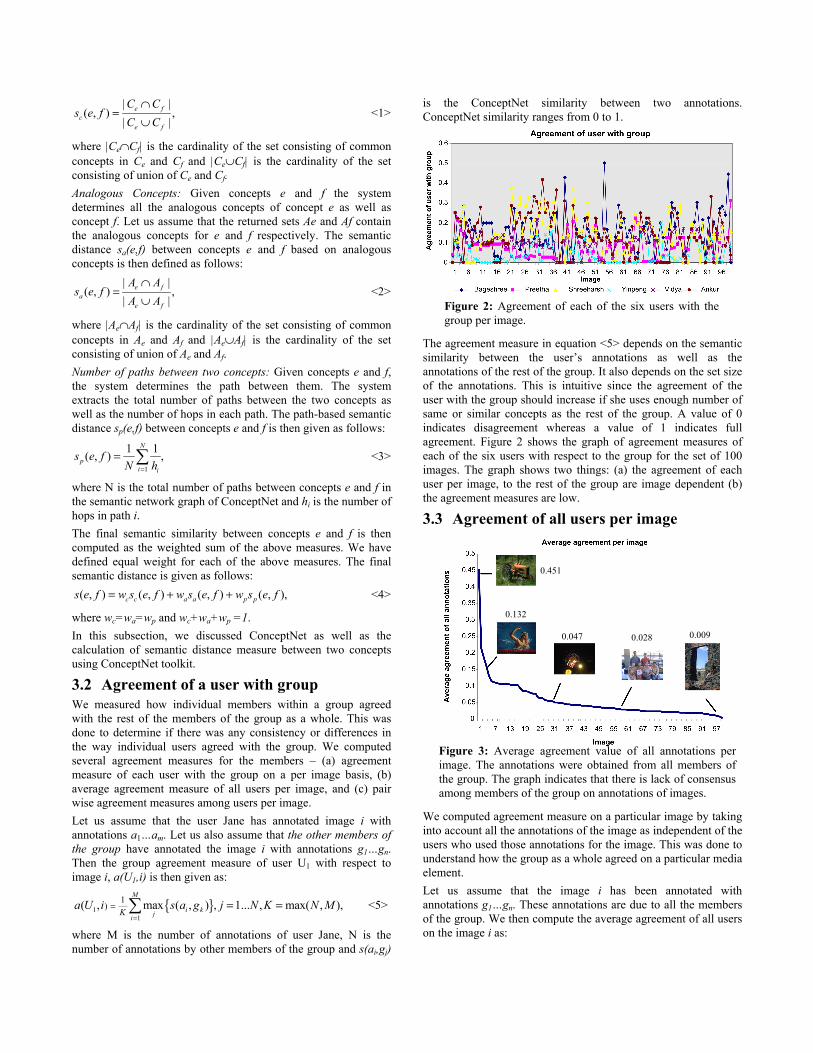
The agreement measure in equation <5> depends on the semantic similarity between the user’s annotations as well as the annotations of the rest of the group. It also depends on the set size of the annotations. This is intuitive since the agreement of the user with the group should increase if she uses enough number of same or similar concepts as the rest of the group. A value of 0 indicates disagreement whereas a value of 1 indicates full agreement. Figure 2 shows the graph of agreement measures of each of the six users with respect to the group for the set of 100 images. The graph shows two things: (a) the agreement of each user per image, to the rest of the group are image dependent (b) the agreement measures are low.
3.3 Agreement of all users per image
We computed agreement measure on a particular image by taking into account all the annotations of the image as independent of the users who used those annotations for the image. This was done to understand how the group as a whole agreed on a particular media element. Let us assume that the image i has been annotated with annotations g1…gn. These annotations are due to all the members of the group. We then compute the average agreement of all users on the image i as:
Figure 2: Agreement of each of the six users with the group per image.
0.451
0.132
0.047 0.028 0.009
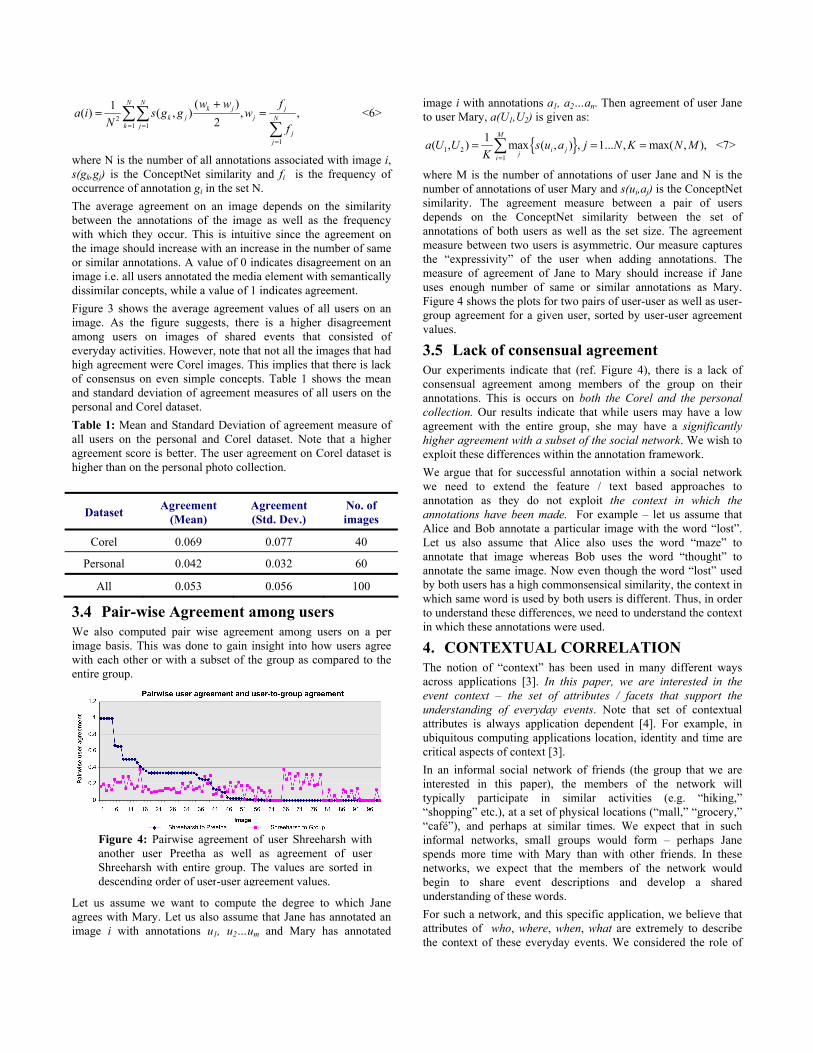
Figure 3: Average agreement value of all annotations per image. The annotations were obtained from all members of the group. The graph indicates that there is lack of consensus among members of the group on annotations of images.
21 1
1
( )1( ) ( , ) , ,2
N Nk j j
k j j Nk j
jj
w w fa i s g g w
N f= =
=
+= =∑∑
∑ <6>
where N is the number of all annotations associated with image i, s(gk,gj) is the ConceptNet similarity and fi is the frequency of occurrence of annotation gi in the set N. The average agreement on an image depends on the similarity between the annotations of the image as well as the frequency with which they occur. This is intuitive since the agreement on the image should increase with an increase in the number of same or similar annotations. A value of 0 indicates disagreement on an image i.e. all users annotated the media element with semantically dissimilar concepts, while a value of 1 indicates agreement. Figure 3 shows the average agreement values of all users on an image. As the figure suggests, there is a higher disagreement among users on images of shared events that consisted of everyday activities. However, note that not all the images that had high agreement were Corel images. This implies that there is lack of consensus on even simple concepts. Table 1 shows the mean and standard deviation of agreement measures of all users on the personal and Corel dataset. Table 1: Mean and Standard Deviation of agreement measure of all users on the personal and Corel dataset. Note that a higher agreement score is better. The user agreement on Corel dataset is higher than on the personal photo collection.
Dataset Agreement (Mean)
Agreement (Std. Dev.)
No. of images
Corel 0.069 0.077 40
Personal 0.042 0.032 60
All 0.053 0.056 100
3.4 Pair-wise Agreement among users We also computed pair wise agreement among users on a per image basis. This was done to gain insight into how users agree with each other or with a subset of the group as compared to the entire group.
Let us assume we want to compute the degree to which Jane agrees with Mary. Let us also assume that Jane has annotated an image i with annotations u1, u2…um and Mary has annotated
image i with annotations a1, a2…an. Then agreement of user Jane to user Mary, a(U1,U2) is given as:
{ }1 21
1( , ) max ( , ) , 1... , max( , ),M
i jjia U U s u a j N K N M
K =
= = =∑ <7>
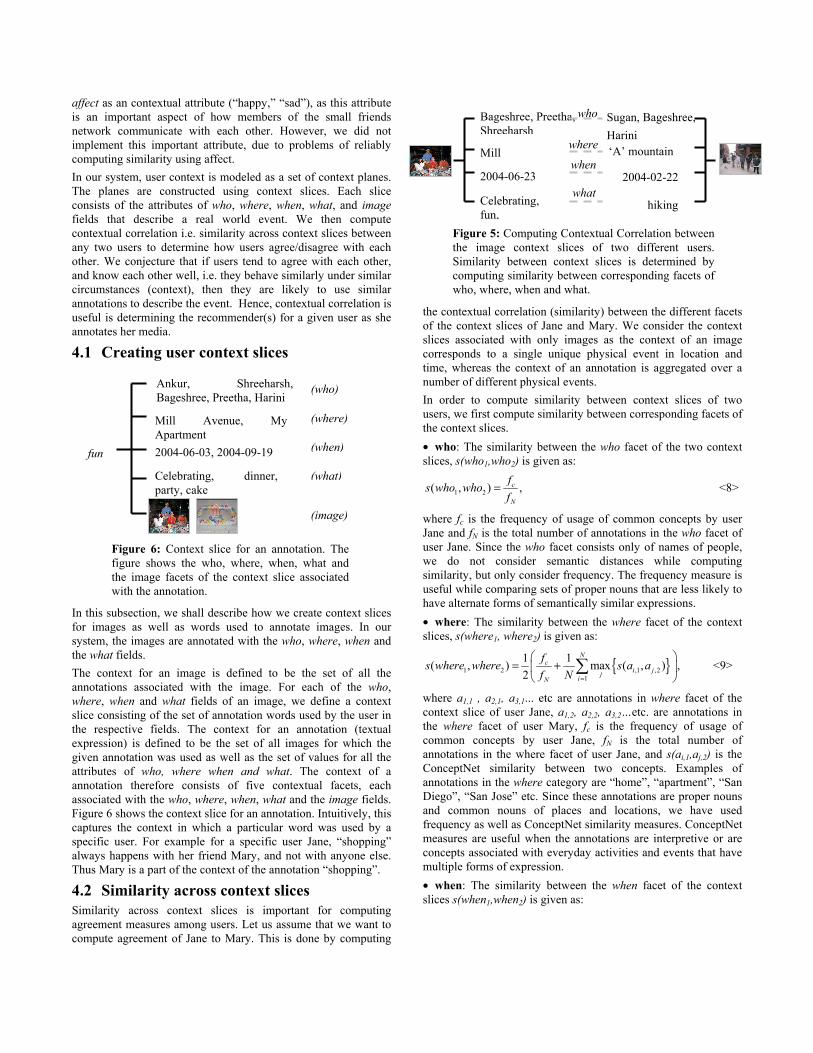
where M is the number of annotations of user Jane and N is the number of annotations of user Mary and s(ui,aj) is the ConceptNet similarity. The agreement measure between a pair of users depends on the ConceptNet similarity between the set of annotations of both users as well as the set size. The agreement measure between two users is asymmetric. Our measure captures the “expressivity” of the user when adding annotations. The measure of agreement of Jane to Mary should increase if Jane uses enough number of same or similar annotations as Mary. Figure 4 shows the plots for two pairs of user-user as well as user-group agreement for a given user, sorted by user-user agreement values.
3.5 Lack of consensual agreement Our experiments indicate that (ref. Figure 4), there is a lack of consensual agreement among members of the group on their annotations. This is occurs on both the Corel and the personal collection. Our results indicate that while users may have a low agreement with the entire group, she may have a significantly higher agreement with a subset of the social network. We wish to exploit these differences within the annotation framework. We argue that for successful annotation within a social network we need to extend the feature / text based approaches to annotation as they do not exploit the context in which the annotations have been made. For example – let us assume that Alice and Bob annotate a particular image with the word “lost”. Let us also assume that Alice also uses the word “maze” to annotate that image whereas Bob uses the word “thought” to annotate the same image. Now even though the word “lost” used by both users has a high commonsensical similarity, the context in which same word is used by both users is different. Thus, in order to understand these differences, we need to understand the context in which these annotations were used.
4. CONTEXTUAL CORRELATION The notion of “context” has been used in many different ways across applications [3]. In this paper, we are interested in the event context – the set of attributes / facets that support the understanding of everyday events. Note that set of contextual attributes is always application dependent [4]. For example, in ubiquitous computing applications location, identity and time are critical aspects of context [3]. In an informal social network of friends (the group that we are interested in this paper), the members of the network will typically participate in similar activities (e.g. “hiking,” “shopping” etc.), at a set of physical locations (“mall,” “grocery,” “café”), and perhaps at similar times. We expect that in such informal networks, small groups would form – perhaps Jane spends more time with Mary than with other friends. In these networks, we expect that the members of the network would begin to share event descriptions and develop a shared understanding of these words. For such a network, and this specific application, we believe that attributes of who, where, when, what are extremely to describe the context of these everyday events. We considered the role of
Figure 4: Pairwise agreement of user Shreeharsh with another user Preetha as well as agreement of user Shreeharsh with entire group. The values are sorted in descending order of user-user agreement values.
affect as an contextual attribute (“happy,” “sad”), as this attribute is an important aspect of how members of the small friends network communicate with each other. However, we did not implement this important attribute, due to problems of reliably computing similarity using affect. In our system, user context is modeled as a set of context planes. The planes are constructed using context slices. Each slice consists of the attributes of who, where, when, what, and image fields that describe a real world event. We then compute contextual correlation i.e. similarity across context slices between any two users to determine how users agree/disagree with each other. We conjecture that if users tend to agree with each other, and know each other well, i.e. they behave similarly under similar circumstances (context), then they are likely to use similar annotations to describe the event. Hence, contextual correlation is useful is determining the recommender(s) for a given user as she annotates her media.
4.1 Creating user context slices
In this subsection, we shall describe how we create context slices for images as well as words used to annotate images. In our system, the images are annotated with the who, where, when and the what fields. The context for an image is defined to be the set of all the annotations associated with the image. For each of the who, where, when and what fields of an image, we define a context slice consisting of the set of annotation words used by the user in the respective fields. The context for an annotation (textual expression) is defined to be the set of all images for which the given annotation was used as well as the set of values for all the attributes of who, where when and what. The context of a annotation therefore consists of five contextual facets, each associated with the who, where, when, what and the image fields. Figure 6 shows the context slice for an annotation. Intuitively, this captures the context in which a particular word was used by a specific user. For example for a specific user Jane, “shopping” always happens with her friend Mary, and not with anyone else. Thus Mary is a part of the context of the annotation “shopping”.
4.2 Similarity across context slices Similarity across context slices is important for computing agreement measures among users. Let us assume that we want to compute agreement of Jane to Mary. This is done by computing
the contextual correlation (similarity) between the different facets of the context slices of Jane and Mary. We consider the context slices associated with only images as the context of an image corresponds to a single unique physical event in location and time, whereas the context of an annotation is aggregated over a number of different physical events. In order to compute similarity between context slices of two users, we first compute similarity between corresponding facets of the context slices. • who: The similarity between the who facet of the two context slices, s(who1,who2) is given as:
1 2( , ) ,c
N
fs who whof
= <8>
where fc is the frequency of usage of common concepts by user Jane and fN is the total number of annotations in the who facet of user Jane. Since the who facet consists only of names of people, we do not consider semantic distances while computing similarity, but only consider frequency. The frequency measure is useful while comparing sets of proper nouns that are less likely to have alternate forms of semantically similar expressions. • where: The similarity between the where facet of the context slices, s(where1, where2) is given as:
{ }1 2 ,1 ,21
1 1( , ) max ( , ) ,2
Nc
i jjiN
fs where where s a af N =
⎛ ⎞= +⎜ ⎟
⎝ ⎠∑ <9>
where a1,1 , a2,1, a3,1... etc are annotations in where facet of the context slice of user Jane, a1,2, a2,2, a3,2…etc. are annotations in the where facet of user Mary, fc is the frequency of usage of common concepts by user Jane, fN is the total number of annotations in the where facet of user Jane, and s(ai,1,aj,2) is the ConceptNet similarity between two concepts. Examples of annotations in the where category are “home”, “apartment”, “San Diego”, “San Jose” etc. Since these annotations are proper nouns and common nouns of places and locations, we have used frequency as well as ConceptNet similarity measures. ConceptNet measures are useful when the annotations are interpretive or are concepts associated with everyday activities and events that have multiple forms of expression. • when: The similarity between the when facet of the context slices s(when1,when2) is given as:
hiking
2004-02-22
‘A’ mountain
Sugan, Bageshree, Harini
when
where
who
Celebrating, fun,
2004-06-23
Mill
Bageshree, Preetha, Shreeharsh
what
Figure 5: Computing Contextual Correlation between the image context slices of two different users. Similarity between context slices is determined by computing similarity between corresponding facets of who, where, when and what.
fun
Ankur, Shreeharsh, Bageshree, Preetha, Harini
Mill Avenue, My Apartment 2004-06-03, 2004-09-19
Celebrating, dinner, party, cake
(who)
(where)
(when)
(what)
(image)
Figure 6: Context slice for an annotation. The figure shows the who, where, when, what and the image facets of the context slice associated with the annotation.
,1 ,21 2
1,1 ,2
1
| |1( , ) max 1 ,| |
Ni j
Mjii j
j
d ds when when
N d d=
=
⎧ ⎫⎪ ⎪−⎪ ⎪= −⎨ ⎬⎪ ⎪−⎪ ⎪⎩ ⎭
∑∑
<10>
where d1,1, d2,1, d3,1 etc. are dates associated with the when facet of user Jane, d1,2, d2,2, d3,2 etc. are dates associated with the when facet of user Mary, and N is the number of annotations in the when facet of user Jane and M is the number of annotations in the when facet of user Mary. We consider the difference in dates (number of days) as a similarity measure as images belonging to the same shared event, will occur closer in time as compared to images across different shared events. • what: The similarity between what facet of user Jane and Mary, s(what1,what2) is given as:
{ }1 2 ,1 ,21
1( , ) max ( , ) ,N
i jjis what what s a a
N =
= ∑ <11>
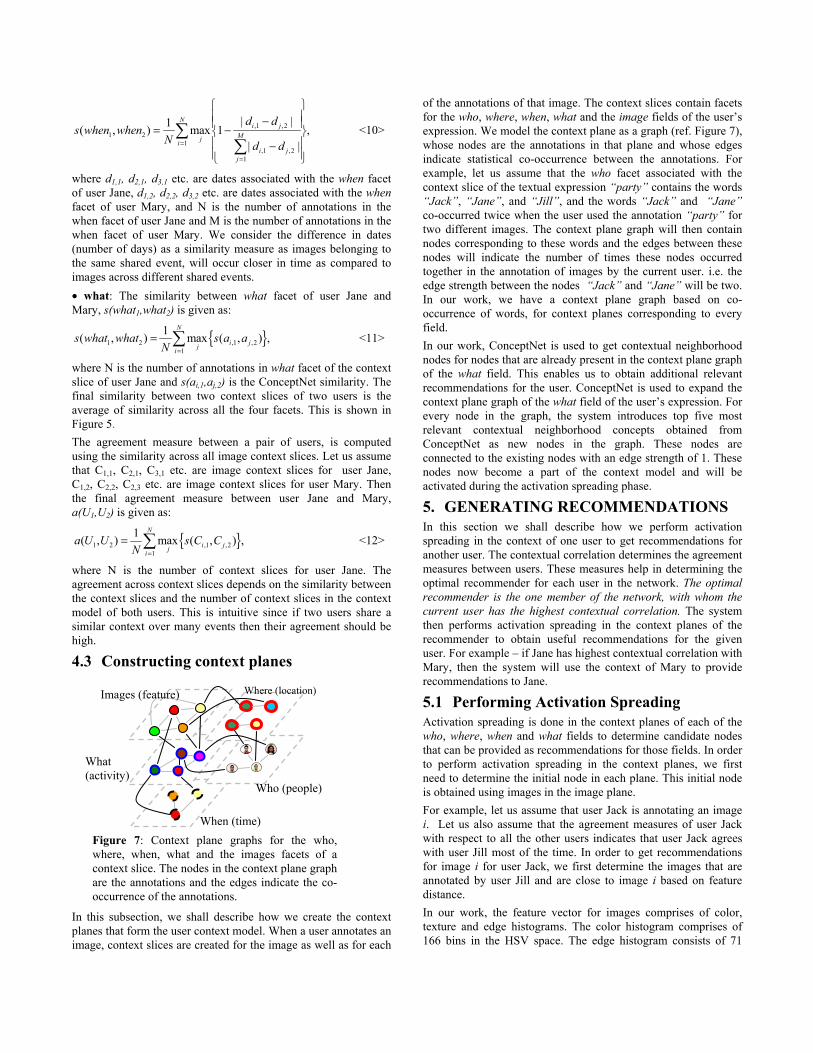
where N is the number of annotations in what facet of the context slice of user Jane and s(ai,1,aj,2) is the ConceptNet similarity. The final similarity between two context slices of two users is the average of similarity across all the four facets. This is shown in Figure 5. The agreement measure between a pair of users, is computed using the similarity across all image context slices. Let us assume that C1,1, C2,1, C3,1 etc. are image context slices for user Jane, C1,2, C2,2, C2,3 etc. are image context slices for user Mary. Then the final agreement measure between user Jane and Mary, a(U1,U2) is given as:
{ }1 2 ,1 ,21
1( , ) max ( , ) ,N
i jjia U U s C C
N =
= ∑ <12>
where N is the number of context slices for user Jane. The agreement across context slices depends on the similarity between the context slices and the number of context slices in the context model of both users. This is intuitive since if two users share a similar context over many events then their agreement should be high.
4.3 Constructing context planes
In this subsection, we shall describe how we create the context planes that form the user context model. When a user annotates an image, context slices are created for the image as well as for each
of the annotations of that image. The context slices contain facets for the who, where, when, what and the image fields of the user’s expression. We model the context plane as a graph (ref. Figure 7), whose nodes are the annotations in that plane and whose edges indicate statistical co-occurrence between the annotations. For example, let us assume that the who facet associated with the context slice of the textual expression “party” contains the words “Jack”, “Jane”, and “Jill”, and the words “Jack” and “Jane” co-occurred twice when the user used the annotation “party” for two different images. The context plane graph will then contain nodes corresponding to these words and the edges between these nodes will indicate the number of times these nodes occurred together in the annotation of images by the current user. i.e. the edge strength between the nodes “Jack” and “Jane” will be two. In our work, we have a context plane graph based on co-occurrence of words, for context planes corresponding to every field. In our work, ConceptNet is used to get contextual neighborhood nodes for nodes that are already present in the context plane graph of the what field. This enables us to obtain additional relevant recommendations for the user. ConceptNet is used to expand the context plane graph of the what field of the user’s expression. For every node in the graph, the system introduces top five most relevant contextual neighborhood concepts obtained from ConceptNet as new nodes in the graph. These nodes are connected to the existing nodes with an edge strength of 1. These nodes now become a part of the context model and will be activated during the activation spreading phase.
5. GENERATING RECOMMENDATIONS In this section we shall describe how we perform activation spreading in the context of one user to get recommendations for another user. The contextual correlation determines the agreement measures between users. These measures help in determining the optimal recommender for each user in the network. The optimal recommender is the one member of the network, with whom the current user has the highest contextual correlation. The system then performs activation spreading in the context planes of the recommender to obtain useful recommendations for the given user. For example – if Jane has highest contextual correlation with Mary, then the system will use the context of Mary to provide recommendations to Jane.
5.1 Performing Activation Spreading Activation spreading is done in the context planes of each of the who, where, when and what fields to determine candidate nodes that can be provided as recommendations for those fields. In order to perform activation spreading in the context planes, we first need to determine the initial node in each plane. This initial node is obtained using images in the image plane. For example, let us assume that user Jack is annotating an image i. Let us also assume that the agreement measures of user Jack with respect to all the other users indicates that user Jack agrees with user Jill most of the time. In order to get recommendations for image i for user Jack, we first determine the images that are annotated by user Jill and are close to image i based on feature distance. In our work, the feature vector for images comprises of color, texture and edge histograms. The color histogram comprises of 166 bins in the HSV space. The edge histogram consists of 71
Images (feature)
Who (people)
When (time)
What (activity)
Where (location)
Figure 7: Context plane graphs for the who, where, when, what and the images facets of a context slice. The nodes in the context plane graph are the annotations and the edges indicate the co-occurrence of the annotations.
bins and the texture histogram consists of 3 bins. We then concatenate these three histograms with an equal weight to get the final composite histogram. We then use the Euclidean distance between the image histograms as the low-level feature distance between two images. After determining the closest images in the image plane of user Jill, using feature based image similarity; we then activate the nodes in the different facets of the context slice of these images. These nodes become the initial nodes for activation within the plane. We then perform the standard spreading activation technique for searching relevant nodes in the context plane graph. We start with the initial node(s) and propagate weights to the neighboring nodes, depending on the edge strengths between nodes. We continue this recursively at each level and compute node weights for all the nodes in the graph. Activation spreading is done independently for all the images that are close to the query image, that the user is trying to annotate. We then aggregate the node weights at each node and consider only those nodes whose weights are above a certain threshold δ, for recommendations
6. COLLABORATIVE ANNOTATION In this section, we shall discuss the algorithm for collaborative image annotation. The goal is to provide recommendations as the user is trying to annotate images uploaded by her.
6.1 Algorithm Details In this subsection, we present the recommendation system algorithm in detail. Let us assume that the user has entered an initial user profile and that the system has been seeded with a few annotated images by members of the social network. Let us assume that the user is trying to annotate an image a with the who, where, when and the what fields. Let us also assume that the database consists of initial context model for each user which contains the context slices for each of the user’s expressions. The group recommendation is obtained from the context model of the most agreed upon user and by performing context filtering. The system first determines the contextual correlation of the current user with all the other users in the system. The system then picks that user with whom the current user has the highest contextual correlation. This is the user with which the current user agrees the most. This user will now be considered as the recommender for the current user. The system now determines the top three closest images from the set of images annotated by the recommender so far in the system. The system then activates the context slices for these images and performs activation spreading in the context planes of these context slices to get recommendations based on contextual correlations. The recommendations from context model of the recommender are then filtered by the current user’s context model. This means that the relationship between the current user’s context and the recommendation is determined and exploited so that the final recommendations are more useful to the current user. In order to do the context filtering, the system begins with the recommender’s recommendations of the who field. This is done because we believe that it is less likely that people will differ in the usage of names of people as compared to referring to commonly occurring places and activities. We then activate the
context slices of the who field textual expressions, but within the context of the current user, who is trying to annotate. The system then gets the what field recommendations from the context slice of the who textual expression. These what fields are compared with the what field recommendations from the recommender using ConceptNet similarity. If the similarity is above a certain threshold δ, then the system returns the corresponding recommendation from the recommender as colored in green, and the rest of the recommendations are shown in red. If there is no match, then all the recommendations from the recommender are shown in red. Thus, the color indicates how relevant the recommendation is to the given user. For example – let us assume that there are four users John, Mary, Todd and Kelvin in the system. Let us also assume that John is trying to annotate his images. Now, suppose that the contextual correlation indicates that John has a higher agreement ratio with Kelvin than with Mary or Todd. Therefore, Kelvin will be the recommender for John when John is annotating his images. Now, let us assume that for John’s query image, activation of Kelvin’s context model recommended “Mary” for the who field, and “fun”, “party”, “work”, “study” and “shopping” for the what field. The system now filters the recommendations of the what field through John’s context model. The system activates the context slice for the annotation “Mary” within John’s context. Now suppose the context slice of the annotation “Mary” has the words “dinner” and “movie” in the what field. The system now computes ConceptNet similarity between “dinner” and the set of words “fun”, “party”, “work”, “study”, and “shopping” and returns the words “fun” and “party” as recommendations as they are related to “dinner”. Similarly, the system computes similarity between “movie” and the rest of the concepts and returns concepts from the set that are related to “movie”. This is intuitive because even though John and Kelvin have the highest agreement value, Kelvin’s relationship to Mary also involves activities related to “work” and “study” whereas John’s relationship to Mary is only pertaining to “movie”, “dinner” etc. Hence, it is intuitive to filter Kelvin’s recommendation through John’s context.
6.2 Updating User Context After the user has annotated an image with the who, where, when and what fields, the system updates the context model for the current user. If the user has introduced a new annotation word, then the system creates a new context slice for the textual expression, else it updates the existing context slice for that expression. The system also creates a new context slice for the annotated image for the current user. Once the user has finished annotating images in a session, the system updates the contextual correlation measures between the current user and the rest of the users in the network and vice versa. Thus, as the users annotate more number of images, the recommendations accurately reflect the group dynamics.
7. EXPERIMENTS We conducted experiments to evaluate the quality of recommendations provided by measuring the utility and performance of three different recommendation methods. The three methods include our group recommendation algorithm, and two baseline algorithms – (a) frequency based recommendation (used in web browsers) and (b) single user context based recommendations.
7.1 Baseline algorithms We now briefly describe the two baseline algorithms. Frequency based recommendations: The personal
recommendation list is obtained from the frequency count of the annotation words used by the user. As the user annotates images, the system maintains a frequency count within each field for each annotation word used by the user for annotating her images. The system then picks the three most frequently used words within each field (i.e. who, where, when and what) to generate the personal list for each field.
Single user context: The user context model activated personal recommendation list is obtained from the current user’s own history of annotated images. As the user is annotating the image, the system determines top three closest images from the set of images that the user has annotated so far in the system. The system then activates the context slices associated with these images. The activation of these context slices will determine the initial nodes in the context planes of who, where, when and what fields, associated with these context slices in the current user’s context. The system now performs activation spreading to provide relevant recommendations for the four fields.
7.2 Finding Contextual Correlation
Preetha
Vidya Shreeharsh Yinpeng Ankur
Preetha 1.0 0.628 0.627 0.467 0.526
Vidya 0.604 1.0 0.586 0.365 0.516
Shreeharsh 0.514 0.533 1.0 0.327 0.449
Yinpeng 0.405 0.397 0.359 1.0 0.512
Ankur 0.540 0.576 0.514 0.391 1.0
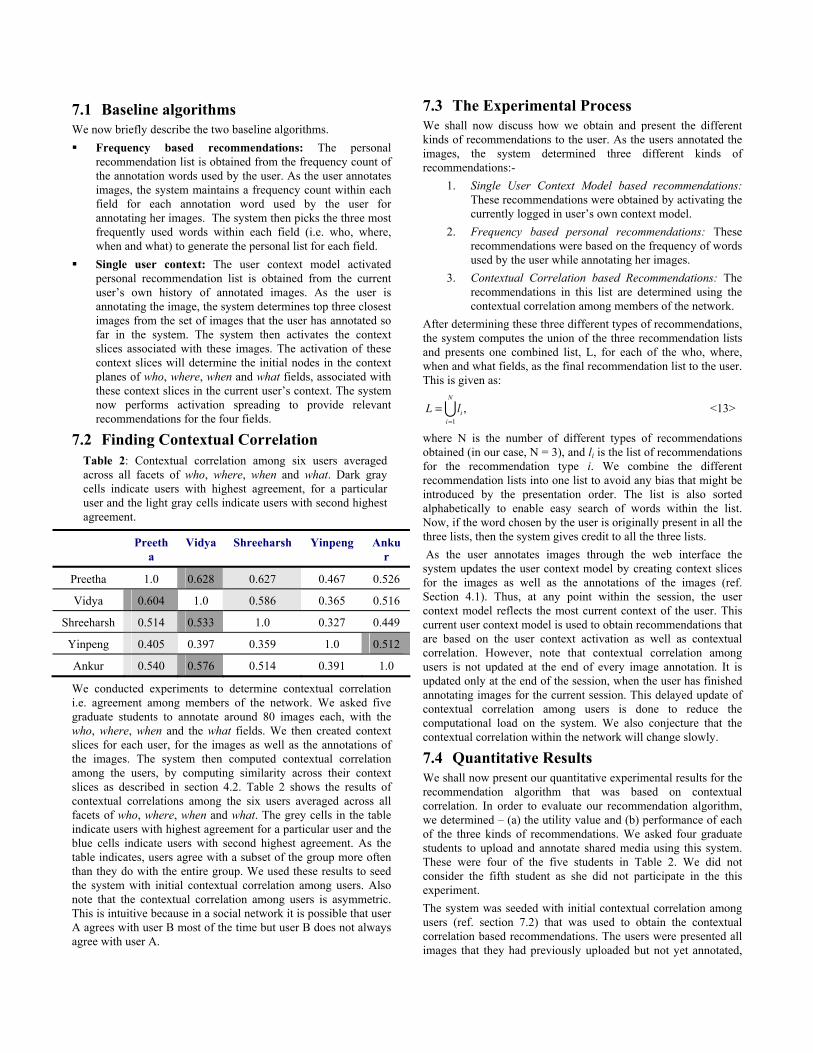
We conducted experiments to determine contextual correlation i.e. agreement among members of the network. We asked five graduate students to annotate around 80 images each, with the who, where, when and the what fields. We then created context slices for each user, for the images as well as the annotations of the images. The system then computed contextual correlation among the users, by computing similarity across their context slices as described in section 4.2. Table 2 shows the results of contextual correlations among the six users averaged across all facets of who, where, when and what. The grey cells in the table indicate users with highest agreement for a particular user and the blue cells indicate users with second highest agreement. As the table indicates, users agree with a subset of the group more often than they do with the entire group. We used these results to seed the system with initial contextual correlation among users. Also note that the contextual correlation among users is asymmetric. This is intuitive because in a social network it is possible that user A agrees with user B most of the time but user B does not always agree with user A.
7.3 The Experimental Process We shall now discuss how we obtain and present the different kinds of recommendations to the user. As the users annotated the images, the system determined three different kinds of recommendations:-
1. Single User Context Model based recommendations: These recommendations were obtained by activating the currently logged in user’s own context model.
2. Frequency based personal recommendations: These recommendations were based on the frequency of words used by the user while annotating her images.
3. Contextual Correlation based Recommendations: The recommendations in this list are determined using the contextual correlation among members of the network.
After determining these three different types of recommendations, the system computes the union of the three recommendation lists and presents one combined list, L, for each of the who, where, when and what fields, as the final recommendation list to the user. This is given as:
1
,N
ii
L l=
=∪ <13>
where N is the number of different types of recommendations obtained (in our case, N = 3), and li is the list of recommendations for the recommendation type i. We combine the different recommendation lists into one list to avoid any bias that might be introduced by the presentation order. The list is also sorted alphabetically to enable easy search of words within the list. Now, if the word chosen by the user is originally present in all the three lists, then the system gives credit to all the three lists. As the user annotates images through the web interface the system updates the user context model by creating context slices for the images as well as the annotations of the images (ref. Section 4.1). Thus, at any point within the session, the user context model reflects the most current context of the user. This current user context model is used to obtain recommendations that are based on the user context activation as well as contextual correlation. However, note that contextual correlation among users is not updated at the end of every image annotation. It is updated only at the end of the session, when the user has finished annotating images for the current session. This delayed update of contextual correlation among users is done to reduce the computational load on the system. We also conjecture that the contextual correlation within the network will change slowly.
7.4 Quantitative Results We shall now present our quantitative experimental results for the recommendation algorithm that was based on contextual correlation. In order to evaluate our recommendation algorithm, we determined – (a) the utility value and (b) performance of each of the three kinds of recommendations. We asked four graduate students to upload and annotate shared media using this system. These were four of the five students in Table 2. We did not consider the fifth student as she did not participate in the this experiment. The system was seeded with initial contextual correlation among users (ref. section 7.2) that was used to obtain the contextual correlation based recommendations. The users were presented all images that they had previously uploaded but not yet annotated,
Table 2: Contextual correlation among six users averaged across all facets of who, where, when and what. Dark gray cells indicate users with highest agreement, for a particular user and the light gray cells indicate users with second highest agreement.
in the upload order. The users could choose to annotate any number of images as well as any of the images they liked. The context model of the users was updated as and when they annotated images. The users annotated a total of 132 images, with an average of 33 images per user. These images belonged to different kinds of events (approx. 22 distinct events across all users).
7.4.1 The utility of a recommendation method We now show how to compute the utility value of the three recommendation methods. For each recommendation that was chosen by the user to annotate an image, we computed its entropy value i.e. the spread/distribution of that recommendation across the three different kinds of lists. Intuitively, a recommendation method has high utility, if its recommendation is chosen by the user, and the recommendation is unique – not common to the other methods. Conversely, if the recommendation is common to all three methods, then utility of each method is poor – the sophisticated algorithms are no better than the frequency based algorithms. The entropy H(r) of a chosen recommendation r, is given as:
1( ) log , 1/ ,
N
i i ii
H r P P P K=
= =∑ <14>
where N is the number of different kinds of recommendation lists (in our case, N = 3) and K is the number of different kinds of recommendation lists to which the chosen recommendation r belongs. For example – if a word belongs to two kinds of recommendation lists, then K=2 and N=3. The normalized entropy H’(r) is given as:
' ( )( ) ,logH rH r
N= <15>
Where H’(r)lies between 0 and 1. The utility value U(r), of a recommendation is inversely related to the entropy:
'( ) 1 (1 ) ( ),U r H rα= − − <16>
where α is a constant and is set to a small value of 0.001 and H’(r) is the normalized entropy of the chosen recommendation. When entropy is 0, its utility value is 1, whereas when entropy is 1, its utility value is α. We have chosen α as the utility value, instead of 0, for the case when entropy is 1, because we wanted to give at least some small credit to the algorithm for suggesting the chosen recommendation, even though the chosen recommendation belonged to all three lists. In order to compute the utility of a recommendation type, we computed utility value of all the recommendations that were chosen by the user for the who and what fields of the image, and that also belonged to the recommendation type list. We did this for all the images annotated by the user. We have restricted to use only the who and the what field due to consistency in their usage. We did not include the when facet as users used different data formats to annotate the when field of an image. The users also used different alternate forms of expressions to annotate the where facet (e.g. “home” “apartment” “my home”) are all used interchangeably), determining the equivalence of these concepts is complicated. We then computed the final utility value of the recommendation type, U(fi), as the average of all the utility values of the recommendations chosen from that type. U(fi) is given as:
1
1( ) ( | ),M
i j ij
U f U r fM =
= ∑ <17>
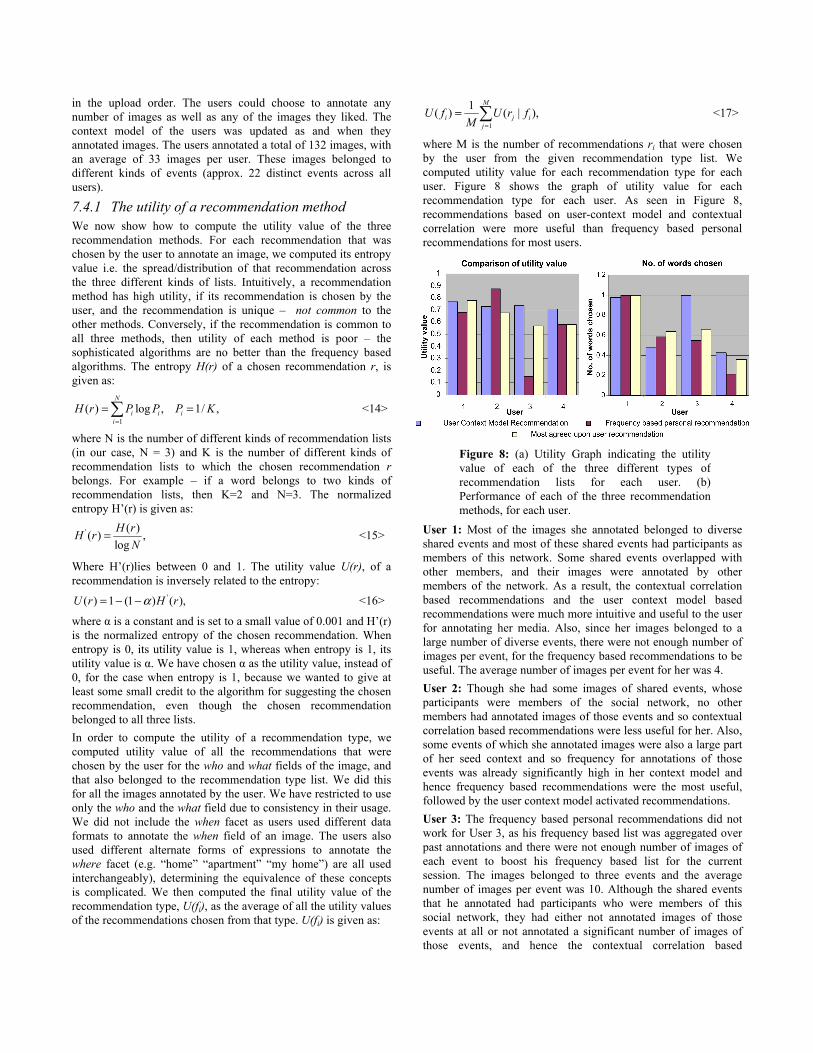
where M is the number of recommendations ri that were chosen by the user from the given recommendation type list. We computed utility value for each recommendation type for each user. Figure 8 shows the graph of utility value for each recommendation type for each user. As seen in Figure 8, recommendations based on user-context model and contextual correlation were more useful than frequency based personal recommendations for most users.
User 1: Most of the images she annotated belonged to diverse shared events and most of these shared events had participants as members of this network. Some shared events overlapped with other members, and their images were annotated by other members of the network. As a result, the contextual correlation based recommendations and the user context model based recommendations were much more intuitive and useful to the user for annotating her media. Also, since her images belonged to a large number of diverse events, there were not enough number of images per event, for the frequency based recommendations to be useful. The average number of images per event for her was 4. User 2: Though she had some images of shared events, whose participants were members of the social network, no other members had annotated images of those events and so contextual correlation based recommendations were less useful for her. Also, some events of which she annotated images were also a large part of her seed context and so frequency for annotations of those events was already significantly high in her context model and hence frequency based recommendations were the most useful, followed by the user context model activated recommendations. User 3: The frequency based personal recommendations did not work for User 3, as his frequency based list was aggregated over past annotations and there were not enough number of images of each event to boost his frequency based list for the current session. The images belonged to three events and the average number of images per event was 10. Although the shared events that he annotated had participants who were members of this social network, they had either not annotated images of those events at all or not annotated a significant number of images of those events, and hence the contextual correlation based
Figure 8: (a) Utility Graph indicating the utility value of each of the three different types of recommendation lists for each user. (b) Performance of each of the three recommendation methods, for each user.
recommendations did not work so well for him. So, for User 3 only the user context activated recommendations were the best. User 4: Majority of her images belonged to diverse personal events whose participants were not members of the social network used in this experiment and so contextual correlation based recommendations were less useful to the user in annotating her media as compared to user context model activated recommendations. Also, her context model was aggregated over more number of shared events (because of the seed context) and hence her frequency based list captured her annotations of shared events, whereas she actually annotated a large number of personal events whose participants were not members of this network and whose activities were different from those of shared events and so frequency based recommendations were less useful.
7.4.2 Comparing recommendation methods We also computed the performance of the three different recommendation types for each user, based on the number of recommendations that were chosen by the user from each of the three lists. Figure 8 shows the scaled performance of the three different lists. As the graph indicates, the performance of user context model based recommendations and contextual correlation based recommendations is much better than frequency based recommendations. There are some key observations here: (a) context based recommendations (user or group) perform very well. (b) frequency based recommendations are useful, when the users are annotating many images from the same event. This is because it is highly likely that who, when, where fields will not change much between photos. (c) when there is little event overlap between members of the social network, the single user context framework is very useful.
8. CONCLUSIONS In this paper, we described our collaborative annotation system that enables members of a social network to author shared media. The key observation in this paper was that people within a social networks often have correlated activities within a specific context. This increased the ground truth pool for the annotation system. Secondly we also observed the there may be semantic disagreement over a shared set of images. There were four key contributions in this paper – (a) we first experimentally showed that people significantly disagreed as a group, over the semantics of a shared media collection. However there were correlations amongst subsets of members (b) developed a model of event context, as well as measures for contextual correlation amongst any two members of the network. (c) A spreading activation based group recommendation system, that additionally filters based on context and (d) we conducted experiments over real-world datasets, while comparing our algorithm against two baseline algorithms using a utility based framework with very good results. We conducted experiments to evaluate the utility and performance of each of the three different recommendation types. The results indicate that the system performs well and the utility and performance of the system depends on the number of events that were annotated by the user, the number of images per event, the overlap between number of events and number of images within the event across users and annotation subjectivity. The
context based recommendation works especially well across events; within the same event a frequency based recommendation system also works well. In the future, we plan to conduct more extensive experiments, address privacy issues, and incorporate sophisticated classification techniques as well as contextual correlation across facets to improve our annotation algorithm.
9. REFERENCES [1] Flickr http://www.flickr.com. [2] E. CHANG, K. GOH, G. SYCHAY and G. WU (2003). CBSA:
content-based soft annotation for multimodal image retrieval using Bayes point machines. IEEE Transactions on Circuits and Systems for Video Technology 13(1): 26-38.
[3] A. K. DEY (2001). Understanding and Using Context. Personal and Ubiquitous Computing Journal 5(1): 4-7.
[4] P. DOURISH (2004). What we talk about when we talk about context. Personal and Ubiquitous Computing 8(1): 19-30.
[5] S. E. ELLIS and D. P. GROTH (2004). A Collaborative Annotation System for Data Visualization, Proc. of the working conference on Advanced Visual Interfaces.,
[6] B. LI, K. GOH and E. CHANG (2003.). Confidence-based Dynamic Ensemble for Image Annotation and Semantics Discovery., ACM International Conference on Multimedia., 195-206, Berkeley, CA.
[7] H. LIU and P. SINGH (2004). ConceptNet: a practical commonsense reasoning toolkit. BT Technology Journal 22(4): pp. 211-226.
[8] C. C. MARSHALL and A. J. B. BRUSH (2002). From personal to shared annotations, CHI '02 extended abstracts on Human factors in computing systems, ACM Press, pp. 812-813, Minneapolis, Minnesota, USA.
[9] C. C. MARSHALL and A. J. B. BRUSH (2004). Exploring the relationship between personal and public annotations, Proceedings of the 2004 joint ACM/IEEE conference on Digital libraries, 349--357,
[10] M. NAAMAN, H. GARCIA-MOLINA, A. PAEPCKE and R. B. YEH (2005). Leveraging Context to Resolve Identity in Photo Albums, Proc. of the 5th ACM/IEEE-CS Joint Conference on Digital Libraries (JCDL 2005), June 2005, Denver, CO.
[11] R. SARVAS, E. HERRARTE, A. WILHELM and M. DAVIS (2004). Metadata Creation System for Mobile Images, 2nd International Conference on Mobile Systems, Applications and Services - MobiSys 2004, June 2004, Boston, MA.
[12] B. SHEVADE (2005). Frameworks for Collaborative Media Annotation. Dept. Of Computer Science, Arizona State University, M.S. Thesis, also AME-TR-2005-14.
[13] B. SHEVADE, H. SUNDARAM and M.-Y. KAN (2005). A Collaborative Annotation Framework, Proc. International Conference on Multimedia and Expo 2005, also AME-TR-2005-04, Jan. 2005, Amsterdam, The Netherlands.
[14] A. WILHELM, Y. TAKHTEYEV, R. SARVAS, N. V. HOUSE and M. DAVIS (2004). Photo Annotation on a Camera Phone, ACM Conference on Human Computer Interaction, Apr. 2004, Vienna, Austria.
![ACE: exploiting correlation for energy-efficient and continuous ...lusu/cse721/papers/ACE Exploiting...Computing]: General General Terms Design, Experimentation, Measurement, Performance](https://img.pdfslide.us/doc/110x75/5ff95549ad53786de173a48c/ace-exploiting-correlation-for-energy-efficient-and-continuous-lusucse721papersace.jpg)


![Exploiting Spatial Correlation for Improved Prediction in ... · to mobile and cellular scenarios, to optimize the performance of complex networks. Reference [11] gives an overview](https://img.pdfslide.us/doc/110x75/5f92cc5e6f8ebc31284606f4/exploiting-spatial-correlation-for-improved-prediction-in-to-mobile-and-cellular.jpg)