Embed Size (px)
Citation preview
U.S. DEPARTMENT OF THE INTERIOR U.S. GEOLOGICAL SURVEY
TO ACCOMPANY MAP CP-42
EXPLANATORY NOTES FOR THEMINERAL-RESOURCES MAP
OF THE CIRCUM-PACIFIC REGIONSOUTHWEST QUADRANT
1:10,000,000
CIRCUM-PACIFIC
ENERGY AND MINERALill/ I RESOURCES
1996

CIRCUM-PACIFIC COUNCIL FOR ENERGY AND MINERAL RESOURCESMichel T. Halbouty, Chair
CIRCUM-PACIFIC MAP PROJECTJohn A. Reinemund, DirectorGeorge Gryc, General Chair
EXPLANATORY NOTES FOR THEMINERAL-RESOURCES MAP
OF THE CIRCUM-PACIFIC REGIONSOUTHWEST QUADRANT
Scale: 1:10,000,000
By
LAND RESOURCES
W.D. Palfreyman, Australian Geological Survey Organisation, Canberra, A.C.T. 2601, Australia
C.M. Mock, Australian Geological Survey Organisation, Canberra, A.C.T. 2601, Australia
R.L. Brathwaite, New Zealand Geological Survey, Department of Scientific and Industrial Research, Lower Hutt,New Zealand
R.N. Brothers, University of Auckland, Auckland, New Zealand (deceased)
George Gryc, U.S. Geological Survey, Menlo Park, California 94025, U.S.A.
SEAFLOOR RESOURCES
David Z. Piper, U.S. Geological Survey, Menlo Park, California 94025, U.S.A.
Theresa R. Swint-Iki, U.S. Geological Survey, Menlo Park, California 94025, U.S.A.
Floyd W. McCoy, Associated Scientists at Woods Hole, Woods Hole, Massachusetts 02543, U.S.A.
Frank T. Manheim, U.S. Geological Survey, Woods Hole, Massachusetts 02543, U.S.A.
Candice M. Lane-Bostwick, U.S. Geological Survey, Woods Hole, Massachusetts 02543, U.S.A.
1996
Explanatory Notes to Supplement the
MINERAL-RESOURCES MAP OF THE CIRCUM-PACIFIC REGION SOUTHWEST QUADRANT
R. W. Johnson, Chair Southwest Quadrant Panel
LAND RESOURCES
W. David Palfreyman, Australian Geological Survey Organisation, Canberra, A.C.T. 2601, Australia
H. Frederick Doutch, Australian Geological Survey Organisation, Canberra, A.C.T. 2601, Australia
Robert L. Brathwaite, New Zealand Geological Survey, Department of Scientific and Industrial Research,Lower Hutt, New Zealand
Masaharu Kamitani, Geological Survey of Japan, Ibaraki 305, Japan
SEAFLOOR RESOURCES
David Z. Piper, U.S. Geological Survey, Menlo Park, California 94025, U.S.A.
Theresa R. Swint-Iki, U.S. Geological Survey, Menlo Park, California 94025, U.S.A.
Floyd W. McCoy, Associated Scientists at Woods Hole, Woods Hole, Massachusetts 02543, U.S.A.
Lawrence G. Sullivan, Lamont-Doherty Earth Observatory, Columbia University, Palisades,New York 10964, U.S.A.
Frank T. Manheim, U.S. Geological Survey, Woods Hole, Massachusetts 02543, U.S.A.
Candice M. Lane-Bostwick, U.S. Geological Survey, Woods Hole, Massachusetts 02543, U.S.A.
Map compilation coordinated byGeorge Gryc
U.S. Geological SurveyMenlo Park, California 94025, U.S.A.
CONTENTS
Introduction 1Circum-Pacific Map Project 1 Mineral-Resources Map Series 1
Mineral-Resources Map of the Southwest Quadrant 2 Resource symbols 2
Land resources 3 Seafloor resources 4
Land resources 4 Australia 4
Archean 4Yilgarn and Pilbara Blocks 5
Gold province 5 Nickel sulfide province 5
Archean-Proterozoic transition 6 Early Proterozoic 6
Platform cover 6Hamersley Basin 6
Orogenic zones 7Pine Creek Inlier 7 Tennant Creek Mineral Field 7
Middle Proterozoic 8 Platform cover 8
Kimberley Basin 8 Victoria River and Birrindudu Basins 8 Bangemall Basin 8 McArthur Basin 8
Orogenic zones 9 Mt. Isa Inlier 9 Curnamona Province 9 Gawler Craton and Stuart Shelf 9 Georgetown-Coen Province 9 Central Australian Mobile Belts 10
Late Proterozoic 10 Platform cover 10
Adelaide Geosyncline 10 Paterson Province 10
Late Proterozoic-Phanerozoic basins 10 Lead-zinc 10 Phosphate rock 10 Uranium 11
Proterozoic-Paleozoic transition 11 Paleozoic fold belts 11
Tasman Fold Belt, South Australia 11 Lachlan Fold Belt, Tasmania 11 Lachlan Fold Belt, Victoria 11 Lachlan Fold Belt, New South Wales 12 Tasman Fold Belt, Queensland 12 New England Fold Belt, New South Wales 13 New England Fold Belt, Queensland 13
Cenozoic platform cover and regolith deposits 13 Manganese 13 Regolithic deposits 13
Mineral sands 13 Bauxite 14 Surficial uranium 14 Later itic nickel 14
in
Secondary manganese 14 Alluvial diamonds 14 Opal 14 Sapphire 14
New Zealand 15TuhuaOrogen 15
Rangitata Orogen 15Kaikoura Orogen 16
Fiji 17Preorogenic period 17Orogenic period 17Postorogenic period 17
Solomon Islands 18 Vanuatu 18
Western belt 18Eastern belt 18Central chain 19
New Caledonia 19 Papua New Guinea 19 Irian Jaya (Indonesia) 21 Southwest Pacific Ocean 21
Babelthuap Island, Palau Group 21Phosphate islands 21
Antarctica 21 Seafloor resources 22
Seafloor sediment 22 Ferromanganese nodules 22 Ferromanganese crusts 25 Polymetallic sulfides 25 Phosphorites and phosphatized rocks 26 Heavy-mineral deposits 26 References cited and additional sources of data 27
FIGURES
1. Principal morphostructural features of Australia 332. Mineral deposits of Western Australia, Australia 343. Mineral deposits of Queensland, Australia 354. Mineral deposits of New South Wales, Australia 365. Mineral deposits of Northern Territory, Australia 376. Mineral deposits of South Australia, Australia 387. Mineral deposits of Tasmania and Victoria, Australia 398. Mineral deposits of New Zealand 409. Mineral deposits of Fiji 41
10. Mineral deposits of Solomon Islands and Vanuatu 4211. Mineral deposits of New Caledonia 4312. Mineral deposits of Papua New Guinea and Irian Jaya 4413. Mineral deposits of Antarctica and Indian and Pacific Ocean islands 45
TABLES
1. Mineral deposits of Western Australia, Australia 462. Mineral deposits of Queensland, Australia 523. Mineral deposits of New South Wales, Australia 554. Mineral deposits of Northern Territory, Australia 575. Mineral deposits of South Australia, Australia 586. Mineral deposits of Tasmania, Australia 607. Mineral deposits of Victoria, Australia 60
IV
8. Mineral deposits of New Zealand 619. Mineral deposits of Fiji 63
10. Mineral deposits of Solomon Islands 6311. Mineral deposits of Vanuatu 6312. Mineral deposits of New Caledonia 6413. Mineral deposits of Papua New Guinea 6514. Mineral deposits of Irian Jaya 6615. Mineral deposits of Antarctica and Indian and Pacific Ocean islands 66

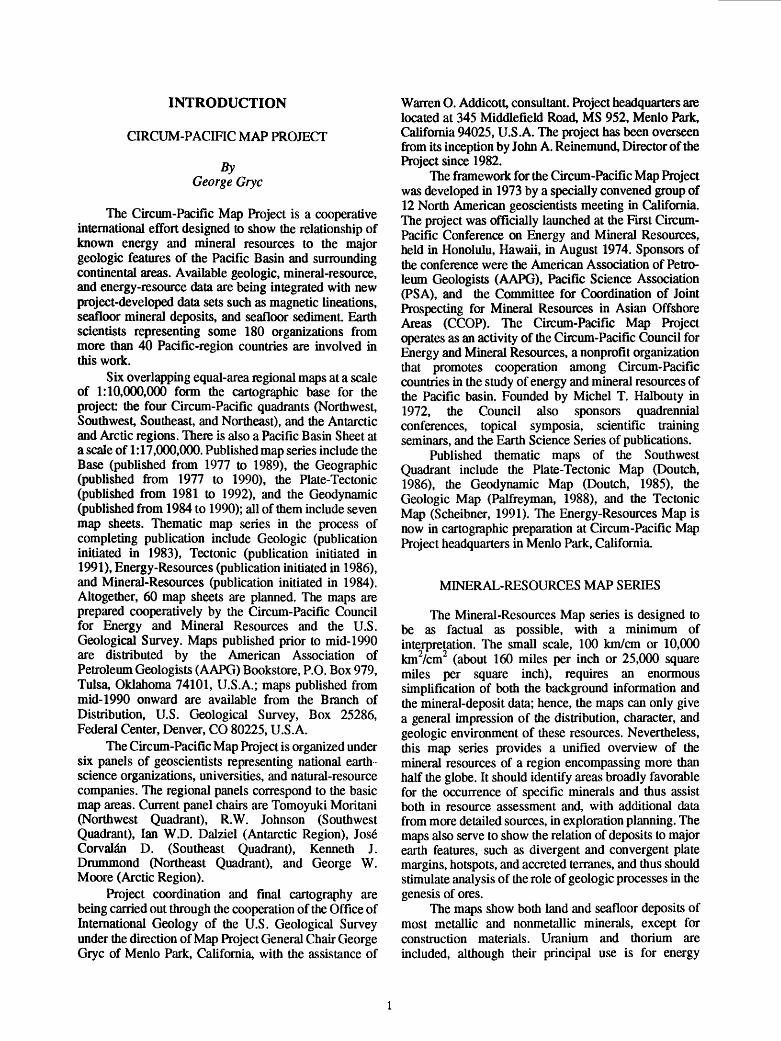
INTRODUCTION
CIRCUM-PACIFIC MAP PROJECT
By George Gryc
The Circum-Pacific Map Project is a cooperative international effort designed to show the relationship of known energy and mineral resources to the major geologic features of the Pacific Basin and surrounding continental areas. Available geologic, mineral-resource, and energy-resource data are being integrated with new project-developed data sets such as magnetic lineations, seafloor mineral deposits, and seafloor sediment. Earth scientists representing some 180 organizations from more than 40 Pacific-region countries are involved in this work.
Six overlapping equal-area regional maps at a scale of 1:10,000,000 form the cartographic base for the project: the four Circum-Pacific quadrants (Northwest, Southwest, Southeast, and Northeast), and the Antarctic and Arctic regions. There is also a Pacific Basin Sheet at a scale of 1:17,000,000. Published map series include the Base (published from 1977 to 1989), the Geographic (published from 1977 to 1990), the Plate-Tectonic (published from 1981 to 1992), and the Geodynamic (published from 1984 to 1990); all of them include seven map sheets. Thematic map series in the process of completing publication include Geologic (publication initiated in 1983), Tectonic (publication initiated in 1991), Energy-Resources (publication initiated in 1986), and Mineral-Resources (publication initiated in 1984). Altogether, 60 map sheets are planned. The maps are prepared cooperatively by the Circum-Pacific Council for Energy and Mineral Resources and the U.S. Geological Survey. Maps published prior to mid-1990 are distributed by the American Association of Petroleum Geologists (AAPG) Bookstore, P.O. Box 979, Tulsa, Oklahoma 74101, U.S.A.; maps published from mid-1990 onward are available from the Branch of Distribution, U.S. Geological Survey, Box 25286, Federal Center, Denver, CO 80225, U.S.A.
The Circum-Pacific Map Project is organized under six panels of geoscientists representing national earth- science organizations, universities, and natural-resource companies. The regional panels correspond to the basic map areas. Current panel chairs are Tomoyuki Moritani (Northwest Quadrant), R.W. Johnson (Southwest Quadrant), lan W.D. Dalziel (Antarctic Region), Jos6 Corval&i D. (Southeast Quadrant), Kenneth J. Drummond (Northeast Quadrant), and George W. Moore (Arctic Region).
Project coordination and final cartography are being carried out through the cooperation of the Office of International Geology of the U.S. Geological Survey under the direction of Map Project General Chair George Gryc of Menlo Park, California, with the assistance of
Warren O. Addicott, consultant. Project headquarters are located at 345 Middlefield Road, MS 952, Menlo Park, California 94025, U.S.A. The project has been overseen from its inception by John A. Reinemund, Director of the Project since 1982.
The framework for the Circum-Pacific Map Project was developed in 1973 by a specially convened group of 12 North American geoscientists meeting in California. The project was officially launched at the First Circum- Pacific Conference on Energy and Mineral Resources, held in Honolulu, Hawaii, in August 1974. Sponsors of the conference were the American Association of Petro leum Geologists (AAPG), Pacific Science Association (PSA), and the Committee for Coordination of Joint Prospecting for Mineral Resources in Asian Offshore Areas (CCOP). The Circum-Pacific Map Project operates as an activity of the Circum-Pacific Council for Energy and Mineral Resources, a nonprofit organization that promotes cooperation among Circum-Pacific countries in the study of energy and mineral resources of the Pacific basin. Founded by Michel T. Halbouty in 1972, the Council also sponsors quadrennial conferences, topical symposia, scientific training seminars, and the Earth Science Series of publications.
Published thematic maps of the Southwest Quadrant include the Plate-Tectonic Map (Doutch, 1986), the Geodynamic Map (Doutch, 1985), the Geologic Map (Palfreyman, 1988), and the Tectonic Map (Scheibner, 1991). The Energy-Resources Map is now in cartographic preparation at Circum-Pacific Map Project headquarters in Menlo Park, California.
MINERAL-RESOURCES MAP SERIES
The Mineral-Resources Map series is designed to be as factual as possible, with a minimum of interpretation. The small scale, 100 km/cm or 10,000 km2/cm2 (about 160 miles per inch or 25,000 square miles per square inch), requires an enormous simplification of both the background information and the mineral-deposit data; hence, the maps can only give a general impression of the distribution, character, and geologic environment of these resources. Nevertheless, this map series provides a unified overview of the mineral resources of a region encompassing more than half the globe. It should identify areas broadly favorable for the occurrence of specific minerals and thus assist both in resource assessment and, with additional data from more detailed sources, in exploration planning. The maps also serve to show the relation of deposits to major earth features, such as divergent and convergent plate margins, hotspots, and accreted terranes, and thus should stimulate analysis of the role of geologic processes in the genesis of ores.
The maps show both land and seafloor deposits of most metallic and nonmetallic minerals, except for construction materials. Uranium and thorium are included, although their principal use is for energy
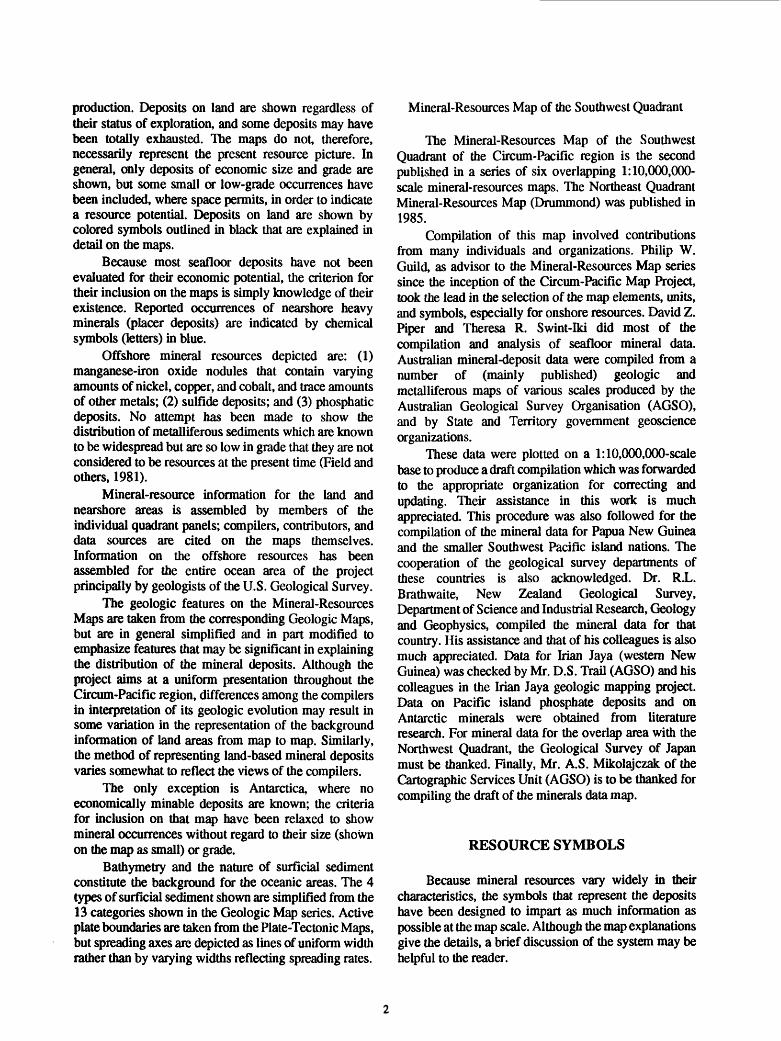
production. Deposits on land are shown regardless of their status of exploration, and some deposits may have been totally exhausted. The maps do not, therefore, necessarily represent the present resource picture. In general, only deposits of economic size and grade are shown, but some small or low-grade occurrences have been included, where space permits, in order to indicate a resource potential. Deposits on land are shown by colored symbols outlined in black that are explained in detail on the maps.
Because most seafloor deposits have not been evaluated for their economic potential, the criterion for their inclusion on the maps is simply knowledge of their existence. Reported occurrences of nearshore heavy minerals (placer deposits) are indicated by chemical symbols (letters) in blue.
Offshore mineral resources depicted are: (1) manganese-iron oxide nodules that contain varying amounts of nickel, copper, and cobalt, and trace amounts of other metals; (2) sulfide deposits; and (3) phosphatic deposits. No attempt has been made to show the distribution of metalliferous sediments which are known to be widespread but are so low in grade that they are not considered to be resources at the present time (Field and others, 1981).
Mineral-resource information for the land and nearshore areas is assembled by members of the individual quadrant panels; compilers, contributors, and data sources are cited on the maps themselves. Information on the offshore resources has been assembled for the entire ocean area of the project principally by geologists of the U.S. Geological Survey.
The geologic features on the Mineral-Resources Maps are taken from the corresponding Geologic Maps, but are in general simplified and in part modified to emphasize features that may be significant in explaining the distribution of the mineral deposits. Although the project aims at a uniform presentation throughout the Circum-Pacific region, differences among the compilers in interpretation of its geologic evolution may result in some variation in the representation of the background information of land areas from map to map. Similarly, the method of representing land-based mineral deposits varies somewhat to reflect the views of the compilers.
The only exception is Antarctica, where no economically minable deposits are known; the criteria for inclusion on that map have been relaxed to show mineral occurrences without regard to their size (shown on the map as small) or grade.
Bathymetry and the nature of surficial sediment constitute the background for the oceanic areas. The 4 types of surficial sediment shown are simplified from the 13 categories shown in the Geologic Map series. Active plate boundaries are taken from the Plate-Tectonic Maps, but spreading axes are depicted as lines of uniform width rather than by varying widths reflecting spreading rates.
Mineral-Resources Map of the Southwest Quadrant
The Mineral-Resources Map of the Southwest Quadrant of the Circum-Pacific region is the second published in a series of six overlapping 1:10,000,000- scale mineral-resources maps. The Northeast Quadrant Mineral-Resources Map (Drummond) was published in 1985.
Compilation of this map involved contributions from many individuals and organizations. Philip W. Guild, as advisor to the Mineral-Resources Map series since the inception of the Circum-Pacific Map Project, took the lead in the selection of the map elements, units, and symbols, especially for onshore resources. David Z. Piper and Theresa R. Swint-Iki did most of the compilation and analysis of seafloor mineral data. Australian mineral-deposit data were compiled from a number of (mainly published) geologic and metalliferous maps of various scales produced by the Australian Geological Survey Organisation (AGSO), and by State and Territory government geoscience organizations.
These data were plotted on a l:10,000,000-scale base to produce a draft compilation which was forwarded to the appropriate organization for correcting and updating. Their assistance in this work is much appreciated. This procedure was also followed for the compilation of the mineral data for Papua New Guinea and the smaller Southwest Pacific island nations. The cooperation of the geological survey departments of these countries is also acknowledged. Dr. R.L. Brathwaite, New Zealand Geological Survey, Department of Science and Industrial Research, Geology and Geophysics, compiled the mineral data for that country. His assistance and that of his colleagues is also much appreciated. Data for Man Jaya (western New Guinea) was checked by Mr. D.S. Trail (AGSO) and his colleagues in the Irian Jaya geologic mapping project. Data on Pacific island phosphate deposits and on Antarctic minerals were obtained from literature research. For mineral data for the overlap area with the Northwest Quadrant, the Geological Survey of Japan must be thanked. Finally, Mr. A.S. Mikolajczak of the Cartographic Services Unit (AGSO) is to be thanked for compiling the draft of the minerals data map.
RESOURCE SYMBOLS
Because mineral resources vary widely in their characteristics, the symbols that represent the deposits have been designed to impart as much information as possible at the map scale. Although the map explanations give the details, a brief discussion of the system may be helpful to the reader.
LAND RESOURCES
The legend for the land mineral resources has been modified and simplified from the Preliminary Metallogenic Map of North America (North American Metallogenic Map Committee, 1981) and described by Guild (1981), with later revisions to deposit symbology for the Southwest Quadrant Map (Guild, 1988). The map symbols show the metal or mineral content of the deposits by colored geometric shapes. The colors, insofar as possible, show metals or minerals of similar type: copper and associated metals are orange, precious metals are yellow, lead-zinc and associated minerals are blue, and so forth. The 5 shapes and 10 colors indicated on the legend of the map provide for 50 combinations, but not all of them have been used here.
Three sizes of symbols denote the relative importance of the deposits. Limits between the size categories for each commodity are, for the most part, in terms of metric tons of the substance(s) contained before exploration. These limits are obviously arbitrary; they have been selected on the basis of the worldwide abundance of the commodity concerned in deposits that are exploitable under current economic and technological conditions.
Some deposits shown as small on this map correspond only to occurrences; they have been included because they may help to identify areas broadly favorable for exploration planning of specific minerals.
Some differences from the Northeast Quadrant Mineral-Resources Map should be noted. Age of mineralization categories have changed, and three new deposit-type classification symbols have been included, in order to distinguish them more easily.
One or more ticks on the symbol indicate the general nature of the deposit-stratiform, stratabound, vein or shear-zone filling, and so forth. A description of the eleven deposit types shown on the Southwest Quadrant are as follows:
Stratiform. Deposits more or less rigorously confined to one or more layers in stratified (sedimentary or volcanic) rocks. Some are of great lateral extent in relation to thickness. May be layered (banded). Usually syngenetic with enclosing rocks. Examples: evaporites, phosphorites, iron formations. Most massive sulfide deposits belong here.
Stratabound. Deposits, generally of limited horizontal extent, that occur at more or less the same horizon in stratified rocks. May be partly concordant, partly discordant with enclosing rocks. Usually considered to be epigenetic. Examples: carbonate-hosted (Mississippi Valley) base-metal deposits, sandstone ("red bed") copper deposits, uranium deposits of Colorado Plateau, Wyoming Basin, and so forth.
Vein or shear-zone filling. Crosscutting, epigenetic deposits hi any type of host rock. The major dimensions are transverse to stratification in sedimentary or volcanic hosts. Most stockworks fit here; some in
igneous hosts are better equated with the irregular disseminated deposits.
Manto. Deposits that combine stratabound and crosscutting features. Characteristically, one or several ore horizons (of replacement origin?) are underlain and/or joined by vein or stockwork ore shoots. Examples: Leadville and Oilman, Colorado, lead-zinc- silver; Santa Eulalia, Chihuahua, lead-zinc-silver; La Encantada and others, Coahuila, fluorite.
Skarn. Contact-metamorphic (tactile) deposits. Stratified, usually carbonate rocks intruded by intermediate to acid igneous rock.
Porphyry deposits. Irregular disseminated deposits, in or associated with intrusive igneous rocks. Parts of some have been described as stockworks. Hydrothermal alteration, including greisenization, common.
Magmatic (irregular massive) deposits. Includes pegmatites. Examples: podiform chromite, some magnetite and magnetite-ilmenite deposits.
Magmatic cumulate deposits. Concordant in layered, generally mafic or ultramafic igneous rocks. Examples: stratiform chromite, ilmenite, platinum-group metals of Bush veld type; certain nickel-sulfide (komatiite-hosted) deposits.
Pipe. Includes breccia pipe. Essentially a two- dimensional deposit with long-axis vertical (crosscutting). Examples: diamondiferous kimberlite, diapir-related (salt dome) sulfur.
Surficial chemical concentration. Includes laterite, bauxite, uraniferous calcrete, and some manganese oxide deposits. The criterion is that supergene processes were responsible for producing ore- grade material.
Surficial mechanical concentration (placer) deposits. Includes "fossil" black sands.
The ticks indicating nature of deposit have been omitted on many of the small symbols either because of ignorance of their type or because it was felt unnecessary to identify all of them where they occur in clusters of deposits of the same kind.
Mineralization ages for most deposits are indicated by double ticks placed according to a clockwise order from older to younger. Where a tick to indicate the deposit type already occurs in the required position, a single tick for age is added and the two must be read together.
Space limitations on the map do not permit identifying by name all the deposits shown, but many of the larger ones are named, especially in relatively open areas. Deposits underlined in the text are listed by number keyed to page-size index maps and accompanying tables (see figs. 2-13 and tables 1-15).
SEAFLOOR RESOURCES
The potential value of manganese nodules depends on their abundance and composition. Abundance data have been derived principally from seafloor photographs, typical examples of which are reproduced in the explanation of the map. Nodule coverage of the sea floor ranges from 0 to nearly 100 percent. On the map, squares 2 mm on a side, empty to totally filled in black, indicate graphically where bottom photographs have been taken and the abundance of nodules at these points. Additional information on the occurrence of nodules was gained from core sampling; small black x's and o's indicate where nodules have been recovered or not recovered, respectively, in cores. Details of the methods used in studying these data sources and in deriving abundance contours are described later.
The composition of analyzed nodules is indicated within certain limits by different colored +'s for ranges of nickel plus copper content and by brown +'s with chemical symbol for those with high manganese. Areas of nodules averaging 1.8 percent or more nickel plus copper (considered as potentially exploitable; McKelvey and others, 1979) are outlined in red. Composition of analyzed manganese crusts is indicated by colored asterisks for four ranges of cobalt content (Manheim and Lane-Bostwick, 1989).
The polymetallic sulfide deposits thus far discovered on the spreading ridges are shown by black semicircles.
Submarine hot springs known to be precipitating metallic minerals (though not in economic quantities) are shown by open semicircles.
Seafloor phosphorite occurrences are depicted by brown horizontal lozenges without an outline. Although this symbol is approximately as large as that used for the medium-sized land deposit, it has no size or grade significance. The many guano-type phosphate deposits on oceanic islands so small that the symbol obscures them entirely are distinguished by having a black outline and the tick indicating a surficial chemical concentration.
LAND RESOURCES
The geologic background shown on the Mineral- Resources Map has been simplified from the Geologic Map of the Southwest Quadrant (Palfreyman, 1988). The main difference from the latter map is that, unlike the Geologic Map, on the Mineral-Resources Map color is used to denote the structural state (unfolded, deformed, or strongly metamorphosed) and depositional environment of the stratified rocks; igneous rocks are differentiated by color and patterned screen. However, letter symbols keyed to the correlation diagram indicate ages in most areas, and time divisions are used for older and younger Precambrian rocks and, by implication, for surficial deposits (late Cenozoic). In the succeeding sections the principal features of the map units and their
mineral resources will be sketched and an attempt made to fit the latter into their geologic frameworks. The units will be discussed by country.
A general account of the geology of the quadrant is given by Doutch (Palfreyman, 1988) and of the Australian continent by Palfreyman (1984). The tectonics of the quadrant have been described by Scheibner (1991). Comprehensive descriptions of the major mineral deposits of Australia and Papua New Guinea are given in Hughes (1990). A more popular account of the geology, mineral resources, and mineral industries of Australia is given in Australian Surveying and Land Information Group (1988).
AUSTRALIA
ByC M. Mock
In Australia, a few comparatively short time intervals in the Archean, the Early and Middle Proterozoic, and the Tertiary-Quaternary were the most important ore-forming periods. The most productive environments have been the ultramafic-mafic volcanic sequences with minor sedimentary rocks (gold- Kalgoorlie/Boulder (Deposit #66-fig. 2, table l)-and nickel-Kambalda/St. Ives/Tramways (Deposit #77- fig. 2, table l)-in the Yilgarn Block); closed-basin sedimentation (lead-zinc at Mt. Isa (Deposit #118-fig. 3, table 2) and Zinc Corporation/New Broken Hill (Deposit #87-fig. 4, table 3)); and secondary con centration (iron ore in the Hamersley Basin, and lateritic bauxite); followed by the felsic volcanic environments (copper, lead, and zinc in the composite Tasman Fold Belt System, made up of the Lachlan, New England, and Thomson Fold Belts, and some smaller sections in Queensland) (see Paleozoic fold belts, p. 11). Figure 1 shows the principal morphostructural features of Australia.
Archean
Early crustal tectonism was dominated by widespread, mantle-derived igneous activity and metamorphism, which produced the distinctive volcanogenic belts (greenstones) and granite-gneiss complexes that typify Archean shield terranes. Sedimentation was mainly of iron-rich and detrital material, producing banded iron formation (BIF), chert, and impure sandstone.
Archean mineralization is a function of a high level of igneous activity from a sulfur-rich mantle source. The main metals represented are those concentrated in mafic or ultramafic rocks and those concentrated in pegmatites.
Yilgarn and Pilbara Blocks
The Archean is represented in Australia mainly by the Yilgarn and Pilbara Blocks of Western Australia, the oldest cratonic nuclei from which the continent grew. The chief economic minerals are nickel and gold, which are associated with the greenstones.
Also important are tin, tantalum, tungsten, beryllium, molybdenum, lithium, niobium, and rare earth elements (REE) associated with pegmatites or greisenized granitoids (Greenbushes (Deposit #100- fig.2, table 1), Ml. Mulgine (Deposit #133-fig. 2, table 1)). Molybdenum also occurs in porphyry copper- molybdenum deposits in the Pilbara Block.
Copper-zinc deposits occur at Whim Creek (Deposit #220-fig. 2, table 1) and Mons Cupri (Deposit #218-fig. 2, table 1) in the Pilbara Block, and at Golden Grove/Scuddles (Deposit #134-fig. 2, table 1) and Teutonic Bore (Deposit #34-fig. 2, table 1) in the Yilgarn Block. These deposits represent a primitive volcanogenic base-metal sulfide association and probably formed as a result of seafloor ore-fluid exhalation in areas peripheral to volcanic eruptions. Paleozoic base-metal sulfide deposits carry increasing proportions of lead and silver at the expense of copper and gold.
BIF ore deposits occur at Koolyanohbing (Deposit #119-fig. 2, table 1), Weld Range (Deposit #151-fig. 2, table 1), and elsewhere in the Yilgarn Block, and at Shay Gap/Sunrise Hill-Nimingarra (Deposit #239-fig. 2, table 1) and other localities in the Pilbara Block.
Greenstone sequences and pegmatites host the major deposits of nonmetallic and industrial minerals- barite (North Pole (Deposit #224-fig. 2, table 1)), magnesite (Bandalup (Deposit #90-fig. 2, table 1)), chrysotile asbestos (Nunyerry (Deposit #214-fig. 2, table 1), Lionel (Deposit #230-fig. 2, table 1)), and talc occur in greenstones; feldspar, fluorite, emerald, and beryl are mined from pegmatites.
A phosphate-REE deposit is hosted by carbonatite (Deposit #43-fig. 2, table 1).
Gold province
Gold deposits are widespread in Archean cratons, and are characteristically associated with the greenstone belts, more specifically with mafic rocks and their associated sedimentary wall rocks.
The Pilbara Block is relatively poor in gold, the largest deposit being Bamboo Creek (Deposit #228- fig. 2, table 1).
By contrast, the Yilgarn Block is richly endowed and has dominated Australian gold production. Historically the richest deposits have been those within a major mineralized zone extending from Norseman to Wiluna (the Norseman-Wiluna Belt in Western Australia), which includes the legendary "Golden Mile"
at Kalgoorlie/Boulder (Deposit #66-fig. 2, table 1). Major centers of past production outside the Norseman- Wiluna Belt include the mining districts of Southern Cross, Laverton (Lancefield (Deposit #39-fig. 2, table 1)), Mt. Magnet (Hill 50/St. George (Deposit #142-fig. 2, table 1)), Meekatharra, and Cue (Big Bell (Deposit #145-fig. 2, table 1)).
Sustained higher gold prices during the early 1980s, combined with new exploration concepts, improved extraction technology, and innovative financing methods, led to a resurgence in the gold industry. Operations were expanded at existing centers, such as Kalgoorlie/B oulder (Deposit #66-fig. 2, table 1), Mt. Charlotte (Deposit #65-fig. 2, table 1), and Princess Royal/Mararoa-Crown (Norseman) (Deposit #86-fig. 2, table 1), and exploration led to the discovery and development of lower grade ore in known fields, and new styles of deposits, the larger ones being Paddington (Deposit #61-fig. 2, table 1), Kambalda/St. Ives/ Tramways (Deposit #77-fig. 2, table 1) Victory/ Defiance/Orion/Revenge (Deposit #79-fig. 2, table 1), Big Bell (Deposit #145-fig. 2, table 1), Moonlight/Wihma (Deposit #17-fig. 2, table 1), ML Gibson (Deposit #132-fig. 2, table 1), and Boddington (Deposit #107-fig. 2, table 1). The latter two deposits are lateritic concentrations of gold.
The major gold deposits of the Yilgarn Block are structurally controlled epigenetic bodies associated with regional fault zones. Deposits commonly occur as silicified shears, quartz vein stockworks, quartz veins, or stratiform quartz-sulfide replacements in splays off the regional faults. Silver, arsenic, and antimony are common associates of the gold ores.
Most major deposits, except Big Bell (Deposit #145-fig. 2, table 1), occur in carbonate rocks in greenschist facies metamorphic terrain. Mafic igneous rocks are the most common host, particularly in the greenstone belt in the Norseman-Kalgoorlie region, but sedimentary rocks, principally BIF, are a common host in the Southern Cross, Mt. Magnet (Hill 5Q/St. George (Deposit #142-fig. 2, table 1)), Laverton (Lancefield (Deposit #39-fig. 2, table 1)), and Leonora (ML Morgans/Westralia (Deposit #41-fig. 2, table 1)) districts.
Nickel sulfide province
Nickel sulfide mineralization is largely confined to ultramafic lava sequences (komatiites) of the greenstone belts centered on Norseman-Wiluna and Forrestania. Cobalt, platinum, and palladium accompany the nickel. The principal deposits are concentrated in the Kambalda/St. Ives/Tramwavs (Deposit #77-fig. 2, table 1) group; other important deposits are the ML Windarra (Deposit #38-fig. 2, table 1), Forrestania (Deposit #88-fig. 2, table 1), and Perseverance/Agnew (Deposit #30-fig. 2, table 1) and Mt. Keith (Deposit #25-fig. 2, table 1) groups.
Two main classes of deposit have been distinguished:
Province, and the Middle-Late Proterozoic Northampton and Leeuwin Blocks and Albany-Fraser Province.
(1) Massive sulfide bodies hosted by thin flows, represented by Kambalda/St. Ives/Tramways (Deposit #77-fig. 2, table 1), Perseverance/Agnew (Deposit #30-fig. 2, table 1), Widgiemooltha (Deposit #82-fig. 2, table 1), Mt. Windarra (Deposit #38-fig. 2, table 1), and Forrestania (Deposit #88-fig. 2, table 1). Orebodies are generally made up of small, high-grade localized shoots.
(2) Disseminated sulfides in large layered bodies; for example, Mt. Keith (Deposit #25-fig. 2, table 1) and Six Mile (Deposit #28-fig. 2, table 1). Deposits are generally large, low to medium grade.
Archean-Proterozoic transition
The Archean-Proterozoic transition is marked by a fundamental change in tectonic style. The first small continental cratons emerged, and tectonism gradually contracted to narrow linear zones separating thicker, stable crustal areas. The continents grew by lateral cratonization of the intracratonic or marginal "mobile zones".
The Australian Proterozoic is characterized by large, stratiform, sediment-hosted base-metal sulfide deposits, and high-level structurally controlled hydrothermal deposits that are commonly polymetallic.
Early Proterozoic
The important mineral deposits of the Early Proterozoic are associated either with quartz-rich platform-cover sedimentary rocks of the first epicratonic basins, or with erogenic zones formed over thin primitive continental or oceanic crust. The metals present (mainly iron, uranium, gold, copper, and manganese) reflect the Archean crustal provenance. Volcanic exhalative base-metal deposits of the orogenic zones carry an increasing abundance of lead.
The North Australian Craton was formed from the stabilization of Early Proterozoic mobile zones now represented by the Halls Creek Province, The Granites- Tanami Block, and the Pine Creek, Arnhem, Murphy, and Tennant Creek Inliers.
In Western Australia, platform-cover sedimentary rocks were laid down in the Early Proterozoic Hamersley Basin, Nabberu Basin, and Ashburton Trough, and the Middle-Late Proterozoic Bangemall Basin. Mobile zones formed around the unstable margins of the Archean Yilgarn and Pilbara Cratons, and subsequently stabilized to form the Western Australian Craton. The mobile zones are preserved in the Early Proterozoic Gascoyne Province, the Early-Late Proterozoic Paterson
Platform cover
Hamersley Basin
The sedimentary group that is host to the Early Proterozoic Hamersley iron ore deposits in Western Australia comprises a sequence of five main BIFs separated by shale, limestone, and volcanic rocks that crop out over 100,000 km2 . The bulk of the ore resource occurs as hematite-enrichment bodies in the lower three BIFs. The ore zones are localized in structurally controlled sites and were apparently formed by a complex process of repeated supergene enrichment and structurally controlled metasomatic replacement at depth during burial metamorphism.
A small proportion of ore occurs as pisolitic limonitic ore, as at Deepdale (Deposit #208-fig. 2, table 1), which accumulated by the fixation of iron in meandering river beds that drained the Hamersley iron province during the Tertiary.
Typical dimensions of the larger deposits such as Mt. Whaleback (Deposit #185-fig. 2, table 1), Mt. Tom Price (Deposit #176-fig. 2, table 1), and Parahurdoo (Deposit #168-fig. 2, table 1) are strike length 5-7 km, width up to 1.5 km, and thickness 50-70 m. Such deposits contain about 150 million tonnes of ore grading 60-65 percent iron per km of strike length, or, in total, over 1,000 million tonnes of high-grade iron ore each.
Total resources of the Hamersley Basin are about 24,000 million tonnes. Large though the figure is, it probably represents less than 0.1 percent of the total original iron deposits in the basin, the remainder having been lost through erosion or still existing as unenriched BIF.
Supergene enrichment deposits of manganese occur at Mt. Rove (Deposit #233-fig. 2, table 1) and Ripon Hills (Deposit #237-fig. 2, table 1) (see Secondary manganese, p. 14).
Large deposits of crocidolite, an iron-rich variety of asbestos, are associated with altered BIF at Wittenoom (Deposit #199-fig. 2, table 1).
The Nabberu Basin and Ashburton Trough host significant stratabound gold-sulfide mineralization at Peak Hill (Deposit #157-fig. 2, table 1) and Horseshoe (Deposit #156-fig. 2, table 1). Minor vein base-metal deposits have been mined at Kooline (Deposit #162- fig. 2, table 1) and elsewhere.
Orogenk zones Pine Creek Inlier
Important mineral associations of the Early Proterozoic orogenic domains are: uranium, gold, copper, and iron associated with sedimentary black-shale host rocks; volcanic exhalative silver-lead-zinc; hydrothennal vein tin, tungsten, niobium, tantalum, and molybdenum; and gold, silver-lead, bismuth, and cobalt associated with late orogenic granite.
Granitoids and high-grade metasedimentary rocks of the Gascoyne Province have minor associated vein base-metal (IJaroo (Deposit #163-fig. 2, table 1)), uranium mineralization, skarn tungsten, and pegmatitic minerals.
Early Proterozoic metasedimentary rocks in the basement complex of the Paterson Province host unconformity-related uranium mineralization at Kintyre (Deposit #234-fig. 2, table 1) similar to uranium deposits of the Alligator Rivers Uranium Field (see Pine Creek Inlier, below). The overlying Late Proterozoic sedimentary rocks host stratabound gold and copper (see Late Proterozoic, p. 10).
The Halls Creek Province is a world-ranking diamond province, the main deposits being the high- grade Argyle (Deposit #8-fig. 2, table 1) and the lower grade Ellendale (Deposit #ll-fig. 2, table 1) pipes. Emplacement of diamondiferous lamproites was controlled by major basement faults that were active from the Early Proterozoic to at least the end of the Paleozoic. Much of the resource at Argyle (Deposit #8- fig. 2, table 1), the first-mined material, was contained in alluvial deposits (see Alluvial diamonds, p. 14).
Subeconomic deposits of magmatic copper-nickel sulfides (Sally Malay (Deposit #9-fig. 2, table 1)), volcanogenic base metals (Koongie Park (Deposit #15- fig. 2, table 1)), volcanogenic REE (Mt. Brockman (Deposit #14-fig. 2, table 1)), and magmatic chromium- platinum also occur in the Halls Creek Province. Alluvial and vein gold in the province is largely only of historical interest
The only economic mineral of The Granites- Tanami Inlier is gold (The Granites (Deposit #36-fig. 5, table 4), Tanami (Deposit #37-fig. 5, table 4)).
The Murphy Inlier contains minor hydrothermal vein deposits of uranium-gold (Pandanus Creek (Deposit #14-fig. 5, table 4)), tin-tungsten, and copper.
The Pine Creek and Tennant Creek Inliers are extensively mineralized, the former carrying deposits of uranium, copper, silver-lead-zinc, iron, gold, tin- tungsten-tantalum-molybdenum, and the latter gold- copper-bismuth, lead, zinc, and silver. Hatches Creek (Deposit #24-fig. 5, table 4) in the Davenport Geosyncline to the south of the Tennant Creek Inlier is an important tungsten field.
The Pine Creek Inlier is notable as one of the world's largest and richest uranium provinces, containing the Alligator Rivers, South Alligator Valley, and Rum Jungle Uranium Fields. Uranium(-gold) deposits of the Alligator Rivers Uranium Field (Ranger (Deposit #3- fig. 5, table 4), Jabiluka (Deposit #l-fig. 5, table 4), Koongarra (Deposit #4-fig. 5, table 4), and Nabarlek (Deposit #2-fig. 5, table 4)) are stratabound in carbonaceous metasedimentary rocks close to the Early Proterozoic land surface. Mineralization is localized in breccia zones and in disseminations in pyritic shales, and is associated with intense chloritic alteration. Theories of ore genesis differ in detail, but the concensus view favors a multistage, low-temperature hydrothermal epigenetic model. Uranium-gold and gold-platinoid deposits at Coronation Hill (Deposit #7-fig. 5, table 4) in the South Alligator Valley Mineral Field occur in felsic volcanic and related sedimentary rocks at a higher stratigraphic level than the host rocks of the Alligator Rivers Uranium Field. The uranium-gold deposit has features of epigenetic sandstone-type uranium deposits.
The complex pattern of mineralization in the Rum Jungle Uranium Field is the product of overlapping of a series of mineral zones, which may reflect varying conditions during synsedimentary metal concentration. Uranium alone occurs in the north, successively re placed southward by uranium-cobalt-copper-lead-silver, copper, and lead-zinc-silver (Browns (Deposit #56- fig. 5, table 4), Woodcutters (Deposit #55-fig. 5, table 4)).
The Cullen Mineral Field and smaller fields in the Pine Creek Inlier contain economic vein and stratiform gold mineralization; for example, Enterprise (Deposit #41-fig. 5, table 4) and Cosmo Howlev (Deposit #46-fig. 5, table 4). Tin-tungsten and base metals were historically important.
Tennant Creek Mineral Field
The Tennant Creek gold-copper-bismuth field encompasses six major mined deposits (Warrego (Deposit #15-fig. 5, table 4), Peko (Deposit #20-fig. 5, table 4), Nobles Nob (Deposit #17-fig. 5, table 4), Juno (Deposit #21-fig. 5, table 4), QdandQ (Deposit #16- fig. 5, table 4), and Gecko (Deposit #18-fig. 5, table 4)) and about 120 smaller lodes, distributed over an area of 3,500 km2. The mineralization is associated with lodes composed of quartz, hematite, and minor magnetite that have been emplaced in shears in a sedimentary and volcanic sequence.
A two-stage hydrothermal model of ore formation has been proposed: ironstone was formed by replacement of iron-rich sedimentary rocks during deformation; mineralization was introduced as a late- stage overprint on deformed magnetite lodes.
Middle Proterozoic Kimberley Basin
The Middle Proterozoic was notable for the formation of large sedimentary lead-zinc-silver sulfide deposits, which greatly overshadow the Archean volcanogenic base-metal deposits. The presence of sedimentary base-metal sulfides is directly related to the proliferation of life during the period, as formation of these deposits depends on the action of algae and bacteria in "fixing" sulfur in bottom sediment, typically deep-water black shale.
Organic activity was also instrumental in the development of thick carbonate (limestone and dolomite) sequences, formed partly from the accumulation of organic remains, in the shallow-water depositional zones. Carbonate rocks were loci for a variety of stratabound and vein mineralization, particularly of copper and uranium.
Other factors responsible for the richness and diversity of mineralization may include abundant felsic magmatism which could have provided both heat and metals, and extensive evaporitic carbonate sequences which would have favored formation of saline, oxidized basinal fluids with high metal-carrying capacity.
Iron and gold were still significant but waning in relative importance. Lead became proportionately more abundant in base-metal associations.
The evolution of the Australian continent became increasingly complex, with the opening up of rift zones between cratonic nuclei.
As the North Australian Craton was stabilized, platform-cover sediment accumulated in the Kimberley, Victoria River, Birrindudu, Me Arthur, and South Nicholson Basins. At the same time, the locus of orogenesis shifted eastward to the developing geosynclines now exposed in the Mt. Isa, Georgetown, Yambo, and Coen Inliers, and southward to the Gawler Craton and the concealed, inferred Curnamona Craton, subsequently stabilized to the north as the North East Orogens, and to the south as the Gawler Craton, Broken Hill Block, Mt Painter and Peake-Denison Inliers, and the Wonominta Block.
The Broken Hill Block and equivalents were incorporated in a broad structural corridor consisting of a series of mainly east-trending intracratonic mobile zones, which were subjected to repeated episodes of intense deformation over a protracted period and not finally stabilized until the Late Proterozoic.
Platform cover
Mineral associations are predominantly stratabound: copper in mafic volcanic rocks and shoreline to continental-facies sedimentary rocks; lead- zinc-silver in black shale and carbonate associations; iron in nearshore marine-fades sedimentary rocks; and lead-zinc, copper, and uranium associated with regional unconformities.
Iron-rich sedimentary rocks of the Kimberley Basin reach ore grade in Yampi Sound (Koolon Island (Deposit #2-fig. 2, table 1)). The orebodies are primary sedimentary deposits of detrital hematite and hematitic sandstone derived by reworking of ferruginous sediment.
Minor subeconomic stratabound copper deposits are widespread in basaltic volcanic rocks; fluorite-rich lead-zinc occurrences and subeconomic diamondiferous lamproite pipes have also been recorded.
Victoria River and Birrindudu Basins
Minor base metals and manganese occur in carbonate-rich units in the Victoria River Basin; subeconomic iron ore is known from hematite-rich sequences. Gold and copper occurrences are recorded from the Birrindudu Basin.
Bangemall Basin
Stratabound low-grade base-metal deposits in the Bangemall Basin (Jillawarra/Abra (Deposit #161-fig. 2, table 1)) are localized by fault structures. Minor subeconomic vein gold and base occurrences are also present.
McArthur Basin
The McArthur Basin and its southerly extension, the South Nicholson Basin, formed over a rapidly subsiding fault-bounded rift zone, allowing the accumulation of great thicknesses of sediment in a subgeosynclinal environment. Mineralization in the rift basins is essentially the unmetamorphosed equivalent of that in the extensively deformed Mt. Isa Inlier and multiply metamorphosed Broken Hill and equivalent blocks.
Stratiform lead-zinc mineralization is widespread in the McArthur Basin but reaches significant grades and dimensions only in the HYC (Here's Your Chance') (Deposit #12-fig. 5, table 4)) deposit and several smaller subjacent deposits.
The stratiform lead-zinc mineralization is close to but spatially distinct from stratabound brecciated carbonate-hosted copper mineralization.
Several small deposits of carbonate-hosted stratabound (Mississippi Valley-type) lead-zinc mineralization are also found in the McArthur Basin.
Other mineralization in the McArthur Basin includes a distinctive copper deposit in a volcanic breccia pipe (Redhank (Deposit #13-fig. 5, table 4)), silver-lead veins, uranium mineralization associated with dolerite-filled fault zones (Westmoreland
(Deposit #132-fig. 3, table 2)), and sedimentary iron deposits (Roper River (Deposit #ll-fig. 5, table 4)).
Orogenic zones
In the Broken Hill and Mt. Isa provinces, stratiform lead-zinc-silver is the dominant mineral association. Other major minerals are copper, iron, uranium, tin, and tungsten; gold, cobalt, and manganese are locally important. In contrast, mineralization of the Gawler Craton is dominated by iron, copper, and gold, and in the Georgetown Inlier by copper and gold. Tin and tungsten are common in both the latter provinces.
The bulk of the lead, zinc, silver, and much of the copper of the Middle Proterozoic orogenic zones occurs in elongate stratiform sulfide deposits in black shale. Uranium, cobalt, gold, silver, and molybdenum, along with remobilized vein lead-zinc and copper, were introduced hydrothermally during metamorphism. In general, only the zones of secondary enrichment of the vein deposits have been of sufficient grade to be of economic interest. Tin and tungsten were deposited in pegmatites derived from late orogenic granite. Iron occurs as sedimentary deposits, minor except for the enriched ores of the Gawler Craton.
Mt. Isa Inlier
At MLJsa (Deposits #117 and 118-fig. 3, table 2), separate lead-zinc-silver and copper orebodies occur in pyritic and dolomitic black shale and siltstone at the top of a predominantly sandstone-volcanic succession.
Smaller lead-zinc-silver deposits occur at Hilton (Deposit #119-fig. 3, table 2), Dugald River (Deposit #12Q-fig. 3, table 2), and Ladv Loretta (Deposit #125-fig. 3, table 2), and copper occurs at Mt. Oxide (Deposit #129-fig. 3, table 2).
Other styles of mineralization in the inlier include stratiform gold (Siana (Deposit #113-fig. 3, table 2)), and sediment-hosted, shear/fault-controlled skarn or pegmatitic deposits of gold, uranium, and cobalt, as well as manganese, cadmium, bismuth, tungsten, beryl, and mica.
Curnamona Province
The Broken Hill Block, the Mt. Painter and Peake- Denison Inliers, and the Wonominta Block are exposed remnants of a concealed inferred Middle Proterozoic craton (Curnamona Province).
The Wonominta Block carries minor copper mineralization; the Mt. Painter and Peake-Denison Inliers are more abundantly mineralized in copper, uranium (Mt. Painter (Deposit #2-fig. 6, table 5)), and gold.
The Broken Hill Block is extensively and diversely mineralized, carrying lead, zinc, silver, copper, tungsten, cobalt, tin, and lesser uranium, gold, iron, nickel, platinum, beryllium, bismuth, and barium. The extent and diversity of metallic mineralization increases southeastward with an increasing degree of metamorphism.
Mineralization displays a strong stratigraphic control. Mainly stratiform iron-copper-cobalt min eralization dominates in the lower levels of the sequence, stratiform and stratabound lead-silver-zinc-tungsten is the predominant association in the middle part, and chiefly transgressive tin mineralization is increasingly abundant hi the upper levels.
The Broken Hill silver-lead-zinc deposit (Deposits-#86 and 87-fig.4, table 3) comprises six elongate, complexly deformed lodes: four zinc lodes, which lie at the southwestern end of the field, and two lead lodes, which are stratigraphically higher than the zinc lodes and are more evenly distributed along the length of the field. The lead lodes are distinguishable from each other by different metal contents and gangue- mineral assemblages.
Gawler Craton and Stuart Shelf
Early Proterozoic metasediment of the Early- Middle Proterozoic Gawler Craton contains iron ore deposits similar to but more deformed and metamorphosed than those of the Hamersley Basin in the Middleback Range (Deposit #41-fig. 6, table 5), South Australia. The deposits all lie at the same stratigraphic level in jaspilites and occupy synclinal keels of a strongly folded sequence.
The Olympic Dam (Deposit #55-fig. 6, table 5) copper-uranium-gold-silver deposit lies in Middle Proterozoic rocks concealed at depth beneath Late Proterozoic and Cambrian sequences of the Stuart Shelf. Mineralization is hosted by a breccia pipe in the upper level of a basement volcano-plutonic complex and is disseminated through a large volume of rock exceeding 20 km2 in areal extent and up to 350 m thick. The deposit lies in a tectonic corridor, and features are consistent with ore formation by a complex interplay of hydrothermal, volcanogenic, sedimentary, and tectonic processes. Copper deposits occur in a similar environment at Mt. Gunson (Deposit #53-fig. 6, table 5).
Georgetown-Coen Province
The Georgetown-Coen Province comprises the Georgetown, Coen, and Yambo Inliers. The pattern of mineralization in the province is the product of several mineralizing episodes in the Proterozoic and Paleozoic. Proterozoic deposits include granite-hosted vein gold at Crovdon (Deposit #131-fig. 3, table 2) and minor stratabound iron and base metals.

The Proterozoic mineral province is overprinted by more widespread Paleozoic igneous-associated mineral provinces that formed in the Cambrian-Ordovician, Silurian-Devonian, and Carboniferous-Permian (see Tasman Fold Belt, Queensland, p. 12)
Central Australian Mobile Belts
As a result of their long and complex deformational history, the Arunta and Musgrave Blocks are made up of complexly folded and faulted and intensely metamorphosed rocks. Gneissic granite is most extensive in the northern pan of the Arunta Block, and a major layered mafic intrusive complex extends across the block in an east-trending zone related to deep-seated fracture systems.
The blocks are poorly mineralized by comparison with the erogenic belts of northern or northeastern Australia. Mineralization in the Arunta Block comprises numerous small granite-associated tin-tungsten-tantalum deposits (Molyhill (Deposit #29-fig. 5, table 4), vein and stratiform copper-lead-zinc deposits (Jervois (Deposit #26-fig. 5, table 4)), and gold deposits in highly deformed zones considered to have been formed during Paleozoic deformation (Artonga (Deposit #31-fig. 5, table 4)).
The main deposits of possible economic interest in the Musgrave Block are associated with the mafic intrusive rocks (for example, vanadium-bearing titaniferous magnetite and lateritic nickel).
Late Proterozoic
The Late Proterozoic was a time of worldwide consolidation of Precambrian cratons. In Australia the Precambrian cratons were consolidated with the final stabilization of the Central Australian Mobile Belts. A 10-km-thick craton cover sequence is preserved in the Adelaide Geosyncline, which formed over a platform downwarp between the Gawler and Cumamona Cratons.
Coplev (Deposit #5-fig. 6, table 5), Balcanoona (Deposit #4-fig. 6, table 5), Robertstown (Deposit #22- fig. 6, table 5), and Mt. Fitton (Deposit tfl-fig. 6, table 5).
Paterson Province
Late Proterozoic metasediment of the Paterson Province hosts stratabound ?epigenetic hydrothermal gold (Telfer (Deposit #235-fig. 2, table 1)) and copper (Nifty (Deposit #236-fig. 2, table 1)).
Late Proterozoic-Phanerozoic basins
At various times from the Late Proterozoic and through the Phanerozoic, large parts of the Australian continent were covered by vast intracratonic and epicratonic basins which extended offshore onto the continental shelf.
A Late Proterozoic-Cambrian sequence of sedimentary and minor volcanic rocks crops out over much of northwest Tasmania. At Savage River (Deposit-#21-fig. 7,table 6), magnetite-pyrite deposits occur in a mafic volcanic-sediment association. Magnesite deposits are also found in this association.
Lead-zinc
In Western Australia, carbonate sequences in the Bonaparte and Canning Basins have emerged as a major Mississippi Valley-type lead-zinc province. Blende vale (Deposit #12-fig. 2, table 1) and the more recently discovered Ca^jebut (Deposit #13-fig. 2, table 1) base- metal deposits are localized on faults on the Lennard Shelf, an area of shallowing sediments on the north margin of the Canning Basin. Sorby Hills (Deposit #7- fig. 2, table 1), in the Bonaparte Basin, occurs in a similar environment
Platform cover
Adelaide Geosyncline
The Adelaide Geosyncline is moderately mineralized, much of the mineralization having been introduced or reconcentrated during metamorphism. Copper is the major metal, occurring as stratiform sediment-hosted deposits (Burra (Deposit #16-fig. 6, table 5)) and in diapiric (pipe-like) intrusions at fault intersections. The belt is also a rich barite province (Oraparinna (Deposit #9-fig. 6, table 5)); deposits are vein type, or stratiform associated with limestone. Gold, lead, zinc, and silver are widely distributed but of minor importance. Altered limestone is a source of magnesite at
Phosphate rock
Australian sedimentary phosphate occurrences range in age from Cambrian to Tertiary but by far the largest are deposits hosted by Middle Cambrian rocks of the Georgina Basin. Some eighteen phosphorite deposits are known, the largest being Phosphate Hill (Deposit #112-fig. 3, table 2), Lady Annie (Deposit #126-fig. 3, table 2), Ladv Jane (Deposit #128-fig. 3, table 2), D Tree (Deposit #127-fig. 3, table 2), and Wonarah (Deposit #22-fig. 5, table 4).
Ordovician marine sequences of the Amadeus Basin contain subeconomic phosphate deposits.
Secondary phosphate occurs in Early Cambrian limestone in the Kanmantoo Fold Belt; phosphatic
10
sedimentary rocks occur in the Paleozoic rocks in east central Victoria.
Uranium
Devonian-Carboniferous sandstone hosts sub- economic roll-front-type uranium mineralization at Bigrlyi (Deposit #35-fig. 5, table 4) in the Ngalia Basin, and at Angela (Deposit #33-fig. 5, table 4) in the Amadeus Basin.
Proterozoic-Paleozoic transition
Stabilization of the Precambrian cratons in the Late Proterozoic heralded a fundamental change in tectonic style. Although the principal elements of the Precambrian geosynclinal cycle remained, their underlying tectonic controls are interpreted in terms of movement of discrete crustal plates about the earth's surface. Collision boundaries between plates (the island- arc environment) and rift zones within plates were the sites of development of the Phanerozoic mobile belts. The complex nature of interaction at the plate margins, coupled with a mature crustal source, fostered great diversity in patterns of mineralization.
Phanerozoic metallic mineralization is pre dominantly igneous-associated. Volcanic exhalative base metals and high-level granite-associated hydrothermal ores comprise the bulk of metallic mineralization of Australian Paleozoic rocks.
Paleozoic fold belts
Consolidation of the Australian Proterozoic cratons was followed by development of the composite Tasman Fold Belt System, which cratonized progressively northward and eastward during the Paleozoic. The oldest belts are the Kanmantoo Fold Belt, South Australia, and the Dundas Trough, Tasmania, which stabilized during sedimentation in the younger easterly-developing Lachlan Fold Belt and Hodgkinson Basin, which in turn stabilized while sedimentation commenced farther east in the youngest block, the New England Fold Belt.
Tasman Fold Belt, South Australia
The Tasman Fold Belt is represented in South Australia by the Kanmantoo Fold Belt, a deep basin that transected the southern part of the Adelaide Geosyncline.
Copper mineralization predominates, occurring as stratiform sulfides in slightly metamorphosed pyritic shale (Kanmantoo (Deposit #25-fig. 6, table 5)), and hi younger remobilized vein deposits. Smaller iron, gold, silver, lead, zinc, uranium, arsenic, mercury, and barium vein deposits also occur.
Lachlan Fold Belt, Tasmania
In Tasmania, the main Paleozoic fold belt, the Dundas Trough, developed over an extension of the Precambrian basement, between the Tyenna and Rocky Cape Blocks. Deep trough sequences were deposited in northeastern Tasmania at a slightly later stage.
The Dundas Trough formed as a deep marine basin flanked to the east by a volcanic island chain. Ultramafic bodies that intrude the trough sequence have been mined for nickel (the only Australian source prior to Kambalda, Western Australia), gold, osmiridium, and asbestos. Large deposits of volcanogenic massive sulfides (zinc- lead-copper-silver-gold) occur at Rosebery (Deposit #13-fig. 7, table 6), Que River (Deposit #11-fig. 7, table 6), Hercules (Deposit #17-fig. 7, table 6), and Hellyer (Deposit #10-fig. 7, table 6); volcanic-associated iron- copper-gold occur at Mt. Lyell (Deposit #14-fig. 7, table 6).
Major tin and tungsten and minor bismuth and molybdenum mineralization are associated with late orogenic granite which was emplaced extensively throughout Tasmania in the Devonian-Carboniferous. The granites in western Tasmania and in northeastern Tasmania have different styles of associated mineralization. Vein tin-tungsten deposits (Aberfoyle- Storeys Creek (Deposit #9-fig. 7, table 6)) are numerous in northeastern Tasmania, but are smaller than the major carbonate replacement tin orebodies such as Renison (Deposit #16-fig. 7, table 6), Cleveland (Deposit #20- fig. 7, table 6), Mt. Biscboff (Deposit #22-fig. 7, table 6), and the tungsten skarn orebodies of King Island (Deposit #23-fig. 7, table 6) and Kara (Deposit #1- fig. 7, table 6), which dominate the granite-associated mineralization of western Tasmania.
Polymetallic silver-lead-zinc vein deposits around centers of Devonian tin mineralization (North Mt. Farrell (Deposit #12-fig. 7, table 6)) have been historically important. Vein gold deposits (Beaconsfield (Deposit #3-fig. 7, table 6)) have also been mined, mainly in northern Tasmania.
Lachlan Fold Belt, Victoria
The Victorian part of the Lachlan Fold Belt contained Australia's largest Paleozoic accumulation of gold, the bulk concentrated in the east half of the Ballarat Trough (Slaffifill (Deposit #21-fig. 7, table 7)). The lode gold occurs mainly as structurally controlled quartz veins or reefs in Cambrian to Early Devonian volcanic and sedimentary rocks and dykes intruding them, with the bulk of mineralization concentrated in black pyritic shales of Ordovician age. Reefs are located in strike faults or in faulted fold crests-the famous "saddle reefs" of Bendigo (Deposit #l-fig. 7, table 7) and elsewhere. Approximately 60 percent of the historical production from the Victorian goldfields was taken from rich
11
Tertiary alluvial deposits concentrated by weathering and erosion of the lode gold ores.
Volcanic exhalative base-metal sulfide deposits (Currawong (Deposit #7-fig. 7, table 7), Wilga (Deposit #6-fig. 7, table 7)) are associated with felsic volcanic rocks and shallow marine sedimentary rocks in fault-bounded rifts.
Lachlan Fold Belt, New South Wales
The Lachlan Fold Belt in New South Wales consists of six main pairs of north-trending synclinorial- anticlinorial belts that have been variably affected by up to five erogenic events. Similar patterns of mineralization are repeated in the tectonic belts across the fold belt, but the density of mineralization is highly variable. For example, most of the stratiform base-metal sulfide deposits occur in two synclinorial zones, the Cobar and Captain's Flat-Goulburn Troughs. The granite batholiths that form the Snowy Mountains are poorly mineralized, whereas major breccia vein deposits of tin (Ardlethan (Deposit #64-fig. 4, table 3), tungsten, gold, and other minerals are associated with granite farther west.
Serpentinite belts host deposits of chromium (Coolac (Deposit #59-fig. 4, table 3)), platinum (Bfield (Deposit #70-fig. 4, table 3)), iron-copper-nickel sulfides, manganese, mercury, and magnesite (Thuddungra (Deposit #61-fig. 4, table 3) and Fifield (Deposit #71-fig. 4, table 3)).
Volcanogenic copper-iron sulfides (Girilambone (Deposit #77-fig. 4, table 3)) occur in deformed Ordovician flysch sequences.
Mafic to intermediate Ordovician-Silurian volcanic rocks host gold mineralization of several types: epithermal deposits (Gidginbung (Deposit #63-fig. 4, table 3)), structurally controlled vein gold, and porphyry copper-gold (Goonumhla (Deposit #69-fig. 4, table 3)). Many of the volcanic-associated deposits are close to a regional tectonic lineament that is also the locus of other styles of gold mineralization: associated with granitoids (Adelong (Deposit #60-fig. 4, table 3) and West Wvalong (Deposit #65-fig. 4, table 3)), and associated with high-level intrusive rocks.
Stratabound volcanic exhalative auriferous base- metal sulfide deposits lie within Silurian rift or basin felsic volcanic sequences (Woodlawn (Deposit #55- fig.4, table 3), Captains Rat (Deposit #56-fig. 4, table 3), Mineral Hill (Deposit #73-fig. 4, table 3), Galwadgere (Deposit #41-fig. 4, table 3)). Barite deposits are associated with felsic volcanic rocks at Kempfield (Deposit #50-fig. 4, table 3).
Stratabound vein, disseminated, pipe, and skarn mineralization is widespread, associated with Silurian- Devonian, and to a lesser extent Carboniferous, late orogenic granites. Roughly in order of historical importance, the metals are gold, tin, tungsten, molybdenum, copper, lead, zinc, silver, arsenic, and
bismuth. At Ardlethan (Deposit #64-fig. 4, table 3), porphyry tin-style cassiterite-sulfide mineralization is disseminated through a zone of altered and brecciated biotite granite. Skarn or hydrothermal gold deposits have been developed at Sheahan-Grants (Deposit #49-fig. 4, table 3).
Epithermal gold deposits occur in Devonian felsic volcanic rocks at several localities.
Stockwork and massive sulfide deposits hosted by Devonian fine-grained sedimentary rocks in the Cobar Trough (CSA (Deposit #80-fig. 4, table 3), Great Cobar (Deposit #82-fig. 4, table 3), FJta (Deposit #81-fig. 4, table 3), New OccidenfflVChgsney/New Cobar (Deposit #79-fig. 4, table 3)) have been major producers of copper and gold, and significant producers of silver, lead, and zinc.
Structurally controlled vein-gold deposits occur in deformed flysch sequences (slate belt-type deposits) at Cowarra (Deposit #57-fig. 4, table 3) and HULEnd (Deposit #42-fig. 4, table 3).
Tasman Fold Belt, Queensland
Similar patterns of mineralization are displayed hi the Tasman Fold Belt in Queensland, which comprises the Thomson Fold Belt, Hodgkinson Basin, and Broken River Fjnbayment. The Thomson Fold Belt is exposed in the Anakie Inlier, Lolworth-Ravenswood Block, and transitional tectonic basins Drummond Basin, Burdekin Basins, and smaller basins.
Volcanogenic massive sulfides occur at Thalanga (Deposit #56-fig. 3, table 2) and Liontown (Deposit #57-fig. 3, table 2) in the Lolworth- Ravenswood Block, and at Djanoe. (Deposit #ll-fig. 3, table 2) in the Hodgkinson Basin. The Hodgkinson Basin hosts historically productive synmetamorphic quartz vein-type gold deposits and associated alluvial placers (Palmer River (Deposit #l(Wig. 3, table 2)).
The major mineralization comprises abundant small but rich granite-associated ore deposits of diverse types. The deposits are associated with widespread late orogenic high-level igneous activity that affected the entire Hodgkinson Basin and Broken River Embayment, and also adjacent areas of the Lolworth-Ravenswood Block and Drummond and Burdekin Basins, and the Proterozoic Georgetown and Yambo Inliers.
High-grade veins, pipes, and skarns are abundant in contact zones of composite granite, and rich alluvial deposits derived from the hard-rock lodes are widespread: tin, tungsten, molybdenum, and bismuth occur at Herberton (Deposit #29-fig. 3, table 2), Kangaroo Hills/Ewan (Deposit #46-fig. 3, table 2), Wolfram Camp (Deposit #26-fig. 3, table 2), ML Caihine (Deposit #17-fig. 3, table 2), and Bamford Hill (Deposit #27-fig. 3, table 2), and gold at Chariejs Towers (Deposit #53-fig. 3, table 2). Gold is disseminated in subvolcanic breccia pipes at Kidston (Deposit #41-fig. 3, table 2) and Mt. Leyshon
12
(Deposit #54-fig. 3, table 2), and in skam at Red Dome (Deposit #22-fig. 3, table 2). Epithennal gold deposits occur at Pajingo (Deposit #59-fig. 3, table 2), Wirralie (Deposit #63-fig. 3, table 2), and Mt. Coolon (Deposit #64-fig. 3, table 2) in the Drummond Basin.
Other mineralization includes stockworks of porphry copper(-molybdenum), vein deposits of uranium (Maureen (Deposit #34-fig. 3, table 2)), vein and skarn deposits of base metals, and volcanogenic base metals (Balcooma (Deposit #42-fig. 3, table 2)).
New England Fold Belt, New South Wales
The important deposits of the New South Wales portion of the New England Fold Belt comprise pervasive vein and replacement mineralization associated with extensive igneous activity.
Complexly zoned veins, pipes, and skarns surrounding high-level granitic rocks carry a diversity of metal associations. The general progression of metals in vein sequences is molybdenum, bismuth, tungsten, tin, antimony, gold, arsenic, copper, lead, zinc, and silver. Some associations are antimony-gold-silver-arsenic (Hillgrove (Deposit #32-fig. 4, table 3)), tin-tungsten- arsenic-silver, tungsten-molybdenum-bis-muth, and tin- molybdenum-antimony-arsenic. Vein and stockwork gold-silver mineralization occurs at Drake (Deposit #16- fig. 4, table 3).
Asbestos (Woodsreef (Deposit #5-fig. 4, table 3)), chromite, and magnesite are associated with serpentinite belts.
New England Fold Belt, Queensland
Volcanogenic sulfides are represented by Mt. Morgan (Deposit #76-fig. 3, table 2) and Mt. Chalmers (Deposit #74-fig. 3, table 2) gold-copper deposits.
Subvolcanic stockwork and disseminated porphyry copper(-molybdenum)(-gold) mineralization is also abundant, although mostly in small subeconomic deposits. The Cracow (Deposit #85-fig. 3, table 2) and Mt. Rawdon (Deposit #89-fig. 3, table 2) gold deposits are of this type, while at Gvmpie (Deposit #94-fig. 3, table 2) gold originated as a sediment-hosted deposit, possibly also related to volcanic activity.
Cenozoic platform cover and regolith deposits
Manganese
A world-ranking manganese province extends over an area of 150 km2 in Groote Eylandt (Deposit #9-fig. 5, table 4), Northern Territory. The deposit occurs as a single, relatively flat sedimentary unit, averaging 3 to 4 m thick, within a Cretaceous sequence of shallow- marine sandstone and claystone.
Regolithic deposits
The regolith or weathering profile hosts many mineral deposits of economic significance. Deposits in laterite profiles include bauxite ("Weipa (Deposit #3- fig. 3, table 2)), nickel-cobalt (Greenvale (Deposit #44- fig. 3, table 2)), gold (Boddington (Deposit #107-fig. 2, table 1)), and iron ore (Yandicoogina (Deposit #192- fig. 2, table D). Supergene enrichment has upgraded deposits of iron ore (Hamersley Basin), gold, phosphate- REE (Mt. Weld (Deposit #43-fig. 2, table 1)), silver- lead-zinc (Tine Corporation/New Broken Hill (Deposit #87-fig. 4, table 3) gossans), and copper (secondary copper deposits in Mt Isa Inlier). Another form of supergene enrichment is shown by the paleochannel calcrete uranium deposits of Western Australia (Yeelirrie (Deposit #20-fig. 2, table 1)) and South Australia (Honeymoon (Deposit #13-fig. 6, table 5)). Placer or alluvial deposits contain large resources of heavy mineral sands(Deposit #127-fig. 2, table 1) and Fraser Island (Deposit #92-fig. 3, table 2)), diamonds (Argyle (Deposit #8-fig. 2, table 1) and Copeton (Deposit #8- fig.4, table 3)), gold (BfiMgo. (Deposit #l-fig. 7, table 7) and Ballarat (Deposit #16-fig. 7, table 7) deep leads), tin, platinoids (Fifield (Deposit #70-fig. 4, table 3)), silica sand, and a variety of gemstones (Anakie (Deposit #66-fig. 3, table 2)). Other regolithic minerals include evaporites-for example, gypsum (Lake. MacDonnell (Deposit #51-fig. 6, table 5) and Shark Bay (Deposit #152-fig. 2, table l))-and precipitates-for example, opal (Yowah-Black Gate (Deposit #102-fig. 3, table 2), Andamooka (Deposit #54-fig. 6, table 5), and Lightning Ridge (Deposit #l-fig. 4, table 3)).
Mineral sands
For approximately 1,000 km from Fraser Island off the southeast Queensland coast to the mouth of the Hawkesbury River in New South Wales, the east coast of Australia is fringed by heavy-mineral-bearing sand beaches, plains, and dunes. In Western Australia, heavy- mineral-bearing beach and dune sands extend intermittently from about 270 km north of Perth to the far southwestern tip of the state.
The heavy-mineral components of economic interest are the titanium-bearing oxide minerals ilmenite and rutile, the refractory mineral zircon, and monazite.
Australian deposits occur both on present-day beaches and in the ancient strandlines farther inland. In Western Australia, a series of mineralized fossil shorelines have been mined along the Swan Coastal Plain. The inner shorelines lie up to 60 km inland. By contrast, the bulk of eastern Australia's deposits are on present-day beaches.
Tertiary sands of the Murray Basin in Victoria have recently been shown to host extensive, although mostly
13
low-grade, mineral-sand deposits at depth, the largest deposit being WM 150 (Deposit #22-fig. 7, table 7).
Bauxite
Australia's most important regolithic mineral is bauxite. Large world-class deposits occur in the Darling Range and at Cape Bougainville and Mitchell Plateau in Western Australia, at Gove in the Northern Territory, and at Weipa and Aurukun in Queensland.
Major bauxite deposits cap Archean rocks of the Yilgam Block in the Darling Range-Mt. Saddleback region (Jarrahdale (Deposit #110-fig. 2, table 1), Del Park/ Huntly (Deposit #108-fig. 2, table 1), and Willowdale (Deposit #104-fig. 2, table 1)). The basement rocks are mainly granite and gneissic granite, with zones of metamorphic, volcanic, and sedimentary rocks, densely cut by dolerite dikes. The bauxite ore is localized in pockets within the extensive laterite cover.
The Kimberley Basin bauxite deposits, Cape Bougainville (Deposit #6-fig. 2, table 1) and Mitchell Elatgau (Deposit #5-fig. 2, table 1), cap basic volcanic and interbedded sedimentary rocks. Although they are higher grade than the Darling Range deposits, their economic viability is relatively diminished by the absence of established infrastructure and the remoteness of the Kimberley region.
The Gave (Deposit #5-fig. 5, table 4) bauxite deposit formed over Mesozoic sandstone which overlies Precambrian crystalline basement. The ore shows evidence of having been eroded from high areas and redeposited in low areas.
The Weipa (Deposit #3-fig. 3, table 2), Aurukun (Deposit #l-fig. 3, table 2), and other bauxite deposits of the Carpentaria Basin were formed during several lateritic weathering events over a bedrock of Tertiary sandstone and siltstone.
Surficial uranium
Uranium in the form of carnotite is widespread in calcreted trunk valleys of Tertiary drainage systems that are present over large areas of southwestern and southern Australia. Significant mineralization is restricted to areas in the northern part of the Yilgarn Block (Yeelirrie (Deposit #20-fig. 2, table 1) and Lake Wav (Deposit #18-fig. 2, table 1)) and the Frome region of South Australia (Beverlev (Deposit #3-fig. 6, table 5) and Honeymoon (Deposit #13-fig. 6, table 5)). The distribution of high-grade uranium concentrations is controlled by the proximity to a uranium-enriched provenance, and to interaction of climatic, hydrologic, and geomorphic factors. Three types of deposits are distinguished: valley, playa, and terrace deposits.
Lateritic nickel
The Greenvale (Deposit #44-fig. 3, table 2) orebody in Queensland comprises a series of terraced residual weathering mantles over serpentinite.
Secondary manganese
Secondary manganese deposits are extensive in the eastern parts of the Hamersley and Bangemall Basins, Western Australia (Ripon Hills (Deposit #237-fig. 2, table 1) and Mt. Rove (Deposit #233-fig. 2, table 1)). Manganese was apparently concentrated in two stages of supergene enrichment, the first during the Proterozoic, the second in the Tertiary.
Alluvial diamonds
Minor occurrences are widespread. Economic deposits are associated with diamondiferous pipes in the Halls Creek Province of Western Australia; for example, alluvial diamonds in gravel in Cenozoic drainage channels downstream from the Argyle (Deposit #8- fig.-2, table 1) primary lamproite source.
Opal
The main fields are in central Queensland (Qpalton-Mayneside (Deposit #110-fig. 3, table 2) to Yowah-Black Gate (Deposit #102-fig. 3, table 2)), northern New South Wales (White Cliffs (Deposit #84- fig. 4, table 3) and Lightning Ridge (Deposit #l-fig. 4, table 3», and northern South Australia (Andamooka (Deposit #54-fig. 6, table 5), Coober Pedy (Deposit #58- fig. 6, table 5), and Mintahie (Deposit #60-fig. 6, table 5)).
Sapphire
Australian sapphire deposits are concentrated in the New England Fold Belt (Glen Innes (Deposit #26-fig. 4, table 3) and Inverell (Deposit #27-fig. 4, table 3), New South Wales, and Anakie (Deposit #66-fig. 3, table 2), Queensland) in the alluvium of creeks in areas where Tertiary basalt and pyroclastic rocks cap Paleozoic granite-metasediment-felsic volcanic terrain.
14
NEW ZEALAND
ByR. L. Brathwaite
The New Zealand microcontinent, embracing the North and South Islands and many outlying islands together with the surrounding continental shelf, shows considerable variety in its geology and associated mineral deposits. This variety has resulted from a geologic history of sustained tectonic activity at the mobile margin of the Pacific Ocean that started in the early to middle Paleozoic (Tuhua Orogeny) and has continued in the Mesozoic (Rangitata Orogeny) and Cenozoic (Kaikoura Orogeny). These orogenic cycles are represented by three main structural elements: the Paleozoic Tuhua Orogen, the late Paleozoic and Mesozoic "geosynclinal" terranes of the Rangitata Orogen, and Cenozoic sedimentary and volcanic rocks of the Kaikoura Orogen.
The metallic mineral deposits are localized into several metallogenic districts and provinces that include: Hauraki epithermaJ gold-silver; West Coast North Island titanomagnetite ironsands; West Coast South Island ilmenite beach sands; Westland gold placers; Reefton gold-quartz lodes; and Otago gold-scheelite-quartz lodes and gold placers. Comprehensive accounts of mineral deposits in New Zealand are given in Williams (1974) and Kear (1989), and recent reviews are by Pirajno (1980), Brathwaite and Pirajno (1985), and Brathwaite (1989). Gold deposits dominate in number and economic value (Brathwaite and others, 1986).
Tuhua Orogen
The Tuhua Orogen of western South Island is a fragment of Gondwana and its geology and metallogeny show a broad similarity to the Tasman Orogenic Zone of eastern Australia. It consists of several tectono- stratigraphic terranes composed dominantly of marine sedimentary rocks of Cambrian to Devonian age (Cooper, 1989) that have been deformed and metamorphosed, and intruded by granitoid and gabbroic rocks.
A quartzose grey wacke terrane of Ordovician age is host to shear-zone gold-quartz lodes in west Nelson- Westland at Golden Blocks (Deposit #54-fig. 8, table 8), Lyell (Deposit #51-fig. 8, table 8), and Reefton (Deposit #47-fig. 8, table 8), and in Fiordland at Preservation Inlet (Deposit #36-fig. 8, table 8). The Reefton field was by far the largest producer and the lodes are localized along shear zones parallel to fold axes in weakly metamorphosed greywacke.
In northwest Nelson a Cambrian island-arc volcanic-sedimentary assemblage contains an ultramafic-mafic complex with associated chrysotile asbestos and talc-magnesite deposits (Cobb (Deposit #24-fig. 8, table 8)).
The main deformation phase of the Tuhua Orogeny in the Middle to Late Devonian was associated with intrusion of extensive S-type granites, but mineralization is confined to minor scheelite veins. A Late Devonian mafic-ultramafic intrusion in northwest Nelson contains magmatic cumulate nickel-copper sulfides with minor platinum group metals.
In the Jurassic to Early Cretaceous the Tuhua Orogen was intruded, mainly along its eastern side, by I- type granitoids (Tulloch, 1983).
Small stocks of granodiorite in west Nelson are associated with porphyry-style molybdenum mineralization at Karamea Bend (Deposit #52-fig. 8, table 8), and with a copper skarn at Copperstain Creek (Deposit #23-fig. 8, table 8). An altered alkali granite dike hosts vein and disseminated gold-arsenopyrite- pyrite-quartz mineralization in the Nelson area.
Rangitata Orogen
The Rangitata Orogen is in tectonic contact with the Tuhua Orogen to the west and is made up of an assemblage of tectonostratigraphic terranes that vary and overlap in age from Carboniferous to Early Cretaceous (Coombs and others, 1976; Bishop and others, 1985). These terranes are predominantly composed of quartzofeldspathic and volcaniclastic greywacke. They also contain several ophiolite belts and an extensive zone of regionally metamorphosed schist
A belt of ophiolite of Permian age extends discontinuously from Nelson to Otago and consists of fault-bounded lenses of serpentinized peridotite, gabbro, spilitic lava, volcaniclastic breccia, and tectonic melange. At Dun Mountain (Deposit #26-fig. 8, table 8) in Nelson, podiform chromite is contained in serpentinized dunite at the top of a basal peridotite zone. In northwest Otago, chrysotile asbestos deposits occur at Pvke River (Deposit #42-fig. 8, table 8) in serpentinized zones marginal to massive peridotite bodies.
The extensive quartzofeldspathic greywacke terrane of the axial ranges of both the South and North Islands is mainly Triassic, Jurassic, and Early Cretaceous in age, and is dominantly composed of greywacke and argillite, with minor basaltic lava and tuff, chert, and limestone.
Mineralization is sparse; at Maharahara (Deposit #13-fig. 8, table 8) a stratiform pyrite- chalcopyrite lens is hosted by red chert in a volcaniclastic argillite-sandstone unit.
Several Permian to Jurassic terranes are composed of volcaniclastic greywacke with minor basaltic volcanic rocks and chert. Small stratiform manganese deposits, associated with chert and basaltic volcanic rocks, are widely distributed in Northland and south Auckland as at Qlau (Deposit #18-fig. 8, table 8). At Kawau Island (Deposit #4-fig. 8, table 8), north of Auckland, a stratiform pyrite-chalcopyrite lens is hosted in chert and
15
argillite with spilitic lava at the base of the local sequence.
In Otago, Westland, and Marlborough the greywacke terranes are regionally metamorphosed to pumpellyite-actinolite and greenschist facies schist grading to amphibolite facies gneiss in Westland. At Wakamarina (Deposit #25-fig. 8, table 8) in Marl- borough, quartzofeldspathic schist contains veins of quartz with gold and scheelite in a shear zone. Similar gold-scheelite lodes occur throughout the Otago region, most notably at Macraes (Deposit #31-fig. 8, table 8), EfindigQ (Deposit #28-fig. 8, table 8), and Glenorchy (Deposit #41-fig. 8, table 8). All of these deposits were probably formed from metamorphic dewatering fluids during the postmetamorphic uplift of the schist in the Cretaceous (Paterson, 1986).
In the Mid Cretaceous to early Tertiary, the New Zealand microcontinent was separated from Antarctica and southeast Australia by the opening of the Southern Ocean and Tasman Sea. This extensional phase is represented on the South Island by intraplate igneous activity and rift basins, which contain sandstone-type uranium mineralization in arkosic sandstone and granite breccia beds at Boiler Gorge (Deposit #5Q-fig. 8, table 8), west Nelson, and placer gold in quartz conglomerate at Gabriels Gully (Deposit #33-fig. 8, table 8) in Otago.
Kaikoura Orogen
The still-continuing Kaikoura Orogeny commenced in the middle Tertiary with the establishment through the New Zealand region of the boundary between the Pacific and Indian-Australian Plates. The present-day plate boundary extends southward from the Tonga-Kermadec Trench as a subduction zone with an associated continental-margin volcanic arc (Taupo Volcanic Zone) through a transform fault zone (including the Alpine Fault) to link with the Macquarie Ridge south of New Zealand.
An early Miocene obduction event in Northland is represented by the tectonic emplacement of allochthonous sheets of Cretaceous to early Tertiary marine sedimentary rocks and ophiolite. At Pakotai (Deposit #20-fig. 8, table 8), Cretaceous mudstone, interbedded with tuff and basalt, is host to small Cyprus- type massive sulfide bodies.
The giant gold-placer fields of Westland and Otago were formed by erosion and reworking during several depositional cycles that culminated with Quaternary fluvioglacial and alluvial gravel. Most of the Cenozoic placer gold was originally derived from erosion of gold- bearing rocks of the Tuhua and Rangitata Orogens. Miocene and Pliocene gravel, commonly associated with coal measures or lignite, are gold-bearing, as at SL fiaibana (Deposit #29-fig. 8, table 8) and Naseby (Deposit #30-fig. 8, table 8) in Otago. The extensive Quaternary gold placers are represented by deposits such
as Collingwood (Deposit #22-fig. 8, table 8) in northwest Nelson; Grey Valley. (Deposit #46-fig. 8, table 8), Taramakau-Greenstone/Knmara (Deposit #45- fig. 8, table 8), Rimu-Kaniere (Deposit #44-fig. 8, table 8), and Ross (Deposit #43-fig. 8, table 8) in Westland; Shotover (Deposit #4Q-fig. 8, table 8), Nevis (Deposit #38-fig. 8, table 8), and Clutha (Deposit #39- fig. 8, table 8) in Otago; and Waikaka (Deposit #34- fig. 8, table 8) in Southland. At Round Hill-Orepiiki (Deposit #35-fig. 8, table 8) in western Southland, gold with minor platinum-group metals occurs in late Quaternary placers derived from erosion of a mafic- ultramafic complex.
The west coasts of both main islands contain extensive late Quaternary black-sand shoreline deposits. On North Island, the erosion of Quaternary andesite and rhyolite volcanic rocks has led to the formation of titanomagnetite deposits at numerous locations along 480 km of coastline; those at Muriwai (Deposit #19- fig. 8, table 8), Waikato North Head (Deposit #17-fig. 8, table 8), Raglan North Head (Deposit #16-fig. 8, tableS), Taharoa (Deposit #15-fig. 8, table 8), and Waipipi (Deposit #14-fig. 8, table 8) are the largest On South Island, metamorphic rocks of the Rangitata Orogen along the Southern Alps are the main source of ilmenite-garnet(-gold) concentrations at intervals along 320 km of coastline, as at Karamea North (Deposit #53- fig. 8, table 8), Carters Beach/Nine Mile Beach/Westport (Deposit #49-fig. 8, table 8), and Barrytown Beach (Deposit #48-fig. 8, table 8).
Subduction-related continental-margin volcanism commenced in the early Miocene in Northland and progressed southeast with time through the Coromandel Volcanic Zone in the Miocene and Pliocene to the active Taupo Volcanic Zone. The Coromandel Volcanic Zone hosts the Hauraki Goldfield, a major epithermal gold- silver province containing some 50 deposits within a 200-km by 40-km belt (Christie and Brathwaite, 1986). Jurassic greywacke of the Rangitata Orogen forms the basement of a subaerial volcanic sequence, consisting predominantly of andesite-dacite volcanism in the Miocene and mainly rhyolite volcanism in the late Miocene to early Pliocene. Diorite porphyry, which occurs locally as an intrusive phase of the Miocene andesite, is associated with porphyry copper mineralization, as at Miners Head (Deposit #3-fig. 8, table 8) on Great Barrier Island. The epithermal deposits consist of extensional quartz veins and hydrothermal breccia carrying electrum, acanthite, and generally minor base-metal sulfides. Wall-rock alteration is characterized by adularia-sericite alteration bordering the veins, grading out to propylitic and argillic alteration. The majority of the deposits, although hosted by andesite, are associated with hydrothermal activity related to the rhyolitic volcanism. The largest historic producers were Coromandel (Deposit #5-fig. 8, table 8), KnaoMimi (Deposit #6-fig. 8, table 8), Thames (Deposit #7-fig. 8, table 8), Waihi (Deposit #8-fig. 8, table 8) (the giant of the field), and Muirs Reefs
16
(Deposit #11-fig. 8, table 8). The Tui (Deposit #9-fig. 8, table 8) deposit has been mined for lead, zinc, and copper.
Mercury mineralization is found in eastern Northland, as at Pnhipuhi (Deposit #2-fig. 8, table 8) and Ngawha (Deposit #21-fig. 8, table 8), where cinnabar occurs in Pliocene or Holocene siliceous-sinter deposits associated with fossil or still active hot springs.
A low-grade bauxite deposit at Otoroa (Deposit #l-fig. 8, table 8) in Northland is the product of subtropical weathering of Pliocene to early Quaternary basalt.
The Quaternary Taupo Volcanic Zone contains rhyolite, dacite, and andesite volcanoes, and active geothermal systems that provide examples of currently forming epithermal gold-silver and base-metal sulfide deposits, and also stratiform sulfur in lake beds occupying a hydrothermal explosion crater at Lake Rotokaua (Deposit #12-fig. 8, table 8). Fumarolic sulfur deposits occur in the crater of the active andesite volcano on White Island (Deposit #10-fig. 8, table 8).
FIJI
ByW. D. Palfreyman
Fiji occupies a tectonic position at the northeastern corner of the Australia-India Plate between the Vanuatu subduction zone at the west and the Tonga-Kermadec subduction zone at the east. Geologically, only rocks of Tertiary or Quaternary age are exposed. These can be divided in three: a preorogenic period (late Eocene to middle Miocene), an erogenic period (late Miocene), and a postorogenic period (late Miocene to Holocene) (Colley and Greenbaum, 1980; Greenbaum, 1980).
Preorogenic period
Rocks of this period are found in the west, south, and central parts of the island of Viti Levu and in the islands of the Yasawa Group to the northwest. Here the late Eocene basement consists of interbedded volcaniclastic rocks, basaltic to intermediate lavas, and limestone metamorphosed to zeolite or greenschist facies. These rocks are overlain by early to middle Miocene shallow volcaniclastic and epiclastic sedimentary rocks, limestone, and volcanic rocks.
The main examples of mineralization in these preorogenic rocks are manganese deposits in western Viti Levu at Nabu/Vunamoli (Deposit #10-fig. 9, table 9) and Nasaucoko (Deposit #11-fig. 9, table 9). These were formed by exhalative processes controlled by faulting and were later modified by supergene enrichment. Copper, zinc, and lead mineralization occurs at several localities in eastern Viti Levu, notably at Wainivesi (Deposit #7-fig. 9, table 9). Here massive
stratabound sulfide lodes, probably of exhalative origin, occur in a sequence of felsic to mafic volcanic and derived volcaniclastic rocks.
Orogenic period
During the late Miocene the preexisting basement was folded, metamorphosed, and intruded by intermediate to mafic intrusive rocks. Minor vein, skarn, limestone replacement, and disseminated deposits had their origins in this activity.
Postorogenic period
Following the erogenic period, volcanic activity and volcaniclastic and some epiclastic sedimentation became widespread. On Viti Levu, mafic to intermediate lavas and associated volcaniclastic rocks were deposited while similar sequences formed the basement of the islands of the Lau Group and of Vanua Levu. On the latter island these rocks are overlain in turn by felsic flows and derived sedimentary rocks. During the Pliocene and into the Holocene, ocean-island mafic lavas have dominated igneous activity throughout the Fijian chain.
Rocks.of the postorogenic period contain the main economic deposits so far found in Fiji and are thus the most prospective group for unidentified resources. Disseminated porphyry-type mineralization occurs in high-level volcanic-intrusive complexes in southern and northwestern Viti Levu. The main deposit is at Waisoi (Deposit #8-fig. 9, table 9) where copper with some molybdenum, gold, and silver is found in intermediate lavas and derived sediment where they are intruded by porphyry bodies in a dissected late Miocene volcano.
Of by far the greatest economic importance has been the epithermal gold deposits, notably those at Vatukoula (Deposit #13-fig. 9, table 9) on Viti Levu, and Mt. Kasi (Deposit #2-fig. 9, table 9) on Vanua Levu. At Vatukoula gold and silver, mostly as tellurides, occur with quartz and calcite as shear fillings in mafic lavas adjoining the faulted margin of a late Miocene-Pliocene caldera, the mineralization being related to late-stage activity in the caldera. And at Mt. Kasi, gold and silver (with lesser copper, zinc, and lead) mineralization in quartz-barite veins is associated with shears in intermediate volcanic and volcaniclastic rocks of a late Miocene caldera. Massive Kuroko-type sulfide deposits are found in late Miocene-Pliocene volcanic and volcaniclastic rocks in northeastern Vanua Levu. The main deposit is at Undu (Deposit #3-fig. 9, table 9) where a pipe of mineralized breccia contains pyritic ore containing copper, zinc, and lead sulfides.
Bauxite deposits are found in flat-lying areas throughout the island chain. The most important are in western Vanua Levu, notably at Wainunu (Deposit #1- fig. 9, table 9). Mineralized beach sands occur at the
17

mouth of the Singatoka River (Deposit #9-fig. 9, table 9) in southern Viti Levu and in northwestern Viti Levu along the Mha River (Deposit #12-fig. 9, table 9). Derived from the breakdown of mafic lavas they contain magnetite and ilmenite. The remaining economic- mineral commodity in Fiji is phosphate which is found on isolated islands in the Lau Group. The main deposits are at Tuvutha (Deposit #4-fig. 9, table 9), Vanua Vani (Deposit #5-fig. 9, table 9), and Ongea Ndriki (Deposit #6-fig.9,table9).
SOLOMON ISLANDS
ByW. D. Palfreyman
The Solomon Islands group continues a major southeast-trending late Mesozoic-Cenozoic island-arc system that extends from New Ireland (in Papua New Guinea) in the north to the Vanuatu chain and beyond in the south.
The group consists of a double en echelon chain of islands bounded on the northeast and southwest by a major thrust fault and a subduction zone respectively (Doutch, 1986). The geologic evolution of the region can be divided into three phases: a Cretaceous-early Tertiary mafic and ultramafic metavolcanic and intrusive basement with intercalated deep-marine carbonate rocks; a middle-late Tertiary intermediate volcanic and intrusive complex with intercalated volcaniclastic rocks and reefal limestone; and late Tertiary-Quaternary mafic and potassium-rich volcanic and intrusive complexes with shallow-marine carbonate rocks and minor continental and shallow-marine clastic rocks (Doutch and others, 1988).
Mineralization associated with the Cretaceous- early Tertiary mafic and ultramafic rocks of the basement include minor stratiform and vein copper deposits in altered mafic lavas; volcanogenic stratiform manganese deposits; occurrences of disseminated gold and nickel and copper sulfides in gabbro; and nickel, chrome, and asbestos deposits associated with ultramafic intrusive rocks (Arthurs, 1979). The only deposit of importance found in the basement rocks is a copper, gold, and silver-bearing stratiform pyrite body in basaltic pillow lava at Hanesavo (Deposit #4-fig. 10, table 10) in the Florida Islands.
The middle-late Tertiary intermediate volcanic and intrusive complex hosts several metalliferous deposit types: porphyry-type copper-gold sulfide stockworks in diorite complexes at Mbetilonga (Deposit #10-fig. 10, table 10), Koloula (Deposit #9-fig. 10, table 10), and Lower Poha (Deposit #ll-fig. 10, table 10) on Guadalcanal Island; small vein and low-grade copper disseminations in andesites; and gold-bearing sulfide veins at Gold Ridge (Deposit #6-fig. 10, table 10) on Guadalcanal Island.
Minor sulfur deposits are associated with the late Tertiary-Quaternary mafic volcanism.
The potentially most important mineral deposits on the Solomon Islands are residual, formed by mechanical or chemical concentration processes operating in the Quaternary. These include bauxite at Vaghena (Deposit #l-fig. 10, table 10) and West Rennell (Deposit #7-fig. 10, table 10), nickeliferous laterite developed on ultramafics at Jejevo (Deposit #2-fig. 10, table 10), Tataka (Deposit #3-fig. 10, table 10), and San Jorge (Deposit #12-fig. 10, table 10). Placer beach-sand deposits containing chromite are found at San Jorge (Deposit #13-fig. 10, table 10), and gold occurs in a river at Chovohio (Deposit #5-fig. 10, table 10) downstream from the Gold Ridge (Deposit #6-fig. 10, table 10) deposit. A medium-sized phosphate deposit occurs on Bellona (Deposit #8-fig. 10, table 10), a raised coral atoll to the southeast of the main island group.
VANUATU
By W. D. Palfreyman
Vanuatu forms part of the Tertiary-Quaternary island-arc system extending in the north from New Ireland through the Solomon Islands to Fiji, Tonga, and the Kermadec Islands in the east and south. The Vanuatu segment can be divided into three parts: a Western Belt (late Oligocene-middle Miocene in age), an Eastern Belt (early Miocene-late Pliocene); and a Central Chain (late Pliocene-Holocene) (Camey and Macfarlane, 1980; Macfarlane, 1982).
Western Belt
This comprises the islands of Espiritu Santo, Malakula, and the Torres group. It consists of basal sequences of intermediate to mafic lavas and derived sedimentary rocks with minor reefal limestones. These rocks have been faulted and intruded by mafic to intermediate intrusive rocks and overlain by volcaniclastic greywacke. Following a period of uplift and erosion, carbonate and epiclastic sedimentary sequences were deposited. Minor sulfide mineralization is known in this belt. Epithennal gold has also been found in small quantities in southern Espiritu Santo Island and southern Malakula Island.
Eastern Belt
Rocks of this belt crop out on the islands of Mae" wo and Pentecost. Here a basal sequence of deep-water clastic and volcaniclastic rocks is overlain by mafic volcanic-arc rocks followed by further pelagic sedimentary rocks. The whole has been uplifted, faulted,
18
and, on Pentecost Island, during the Pliocene an ophiolite complex was emplaced. Minor nickel mineralization is associated with this latter complex. Some minor copper sulfide mineralization is found associated with mafic intrusions on Pentecost Island.
Central Chain
The Central Chain islands are composed primarily of subaerial mafic to intermediate volcanic and volcaniclastic rocks fringed in places by reefal limestone. Minor sulfide mineralization occurs in mafic lava on several islands, but the main mineral commodity (and the only one in the country to have been mined) is manganese. At Eoiari (Deposit #l-fig. 10, table 11) on Efatg Island, manganese oxide occurs at the base of a soil profile underlying reefal limestone. Similar deposits are also found at Raouisse (Deposit #2-fig. 10, table 11) and Immsus (Deposit #3-fig. 10, table 11) on Erromango Island. These deposits are the result of the leaching of volcanic rocks and the subsequent redeposition of the manganese in a littoral environment. The only other economic commodity found in Vanuatu is heavy- mineral sand. Beach sand containing titaniferous magnetite occurs on several islands but substantial deposits are found only on northern Espiritu Santo (Deposit #6-fig. 10, table 11), southern Espiritu Santo (Deposit #5-fig. 10, table 11), and southwest Efat6 (Deposit #4-fig. 10, table 11) Islands.
NEW CALEDONIA
By R. N. Brothers
Greenschist of inferred pre-Permian age is mainly fine-grained metatuff enclosing metabasalt pillows and calc-schist. Adjacent less-altered Permian to Lower Triassic strata comprise two main assemblages. The lower part, several hundred meters thick, contains variegated nonfragmented volcanic rocks (andesite, dacite, keratophyre) and tuff, plus calcareous siltstone with abundant plant and shell fossils. The upper part is largely siltite and arenite rich in white mica and plant debris. Middle Triassic to Upper Jurassic fossiliferous calc-alkaline volcaniclastic rocks form a predominantly littoral facies along the western part of the island and a deeper water, more volcanic assemblage in the central part. Late Jurassic gabbro-dolerite-basalt complexes are tholeiitic.
A major Late Jurassic pre-Senonian orogeny folded the older formations, which are covered discordantly by several kilometers of Upper Cretaceous (Senonian) conglomerate, sandstone, and coaly siltstone with some intercalated basalt and rhyolite lava. Extensive sheets of calc-alkaline to tholeiitic basalt, of Senonian to Eocene age, extend along the west coast. Paleocene-Eocene
sedimentary rocks, with a total thickness of about five km, are predominantly siliceous-calcareous facies. Oligocene sedimentary rocks are entirely absent, and a few small areas of Miocene rocks are interdigitations of continental peridotitic debris with marine lagoonal or coral-reef associations. A vast ultramafic nappe, resting on early Eocene and older rocks, forms a series of massifs throughout the length of the island.
Two early metamorphic events, pre-Permian and post-Jurassic to pre-Senonian in age, were dominantly low-pressure low-temperature in character and produced prehnite-pumpellyite to greenschist associations. Late Eocene high-pressure metamorphism developed a regional belt (175 x 25 km) of lawsonite-glaucophane schist grading eastward into eclogite in an in situ igneous and sedimentary protolith.
Peridotite of the ultramafic nappe carries primary chromite (for example, at Tiebaghi (Deposit #33-fig. 11, table 12), Plaine des Lacs (Deposit #18-fig. 11, table 12), Yate (Deposit #15-fig. 11, table 12), and ML Humboldt (Deposit #12-fig. 11, table 12)), which persists also in laterite and derived Quaternary sediment (Nepoui (Deposit #27-fig. 11, table 12)). Lateritic decomposition of the ultramafic rock produced surface layers rich in iron (45-60 percent; GOTO (Deposit #16- fig. 11, table 12)) and slightly deeper, but still near- surface, concentrations of nickel (up to 2-5 percent) and cobalt (up to 0.4 percent; Onflrangnn (Deposit #31- fig. 11, table 12), Kopejo. (Deposit #26-fig. 11, table 12),
(Deposit #10-fig. 11, table 12),(Deposit #7-fig. 11, table 12), and Poro (Deposit #6- fig. 11, table 12)). Minor manganese and antimony deposits are associated with Senonian basalt and pre- Senonian schist (Taom (Deposit #30-fig. 11, table 12), Temala (Deposit #29-fig. 11, table 12), Eons (Deposit #28-fig. 1 1, table 12), Raymond (Deposit #25- fig. 11, table 121 Bourail (Deposit #21-fig. 11, table 12), LaTontouta (Deposit #20-fig. 11, table 12), and Nakety (Deposit #9-fig. 11, table 12)). Exhalative stratiform Cu-Pb-Zn(-Ag-Au) mineralization accompanied acid volcanism within a northern area of Cretaceous sediment (Pilou (Deposit #l-fig. 11, table 12), Meretrice (Deposit #3-fig. 11, table 12), La Balade (Deposit #2- fig. 11, table 12), and Poya (Deposit #24-fig. 11, table 12)); this metallogenic volcano-sedimentary sequence subsequently was metamorphosed during the late Eocene regional high-pressure event.
Fuller accounts of the geology and mineral resources of New Caledonia are given in Brothers and Lillie (1988) and Paris (1981).
PAPUA NEW GUINEA
By W. D. Palfreyman
The geology of Papua New Guinea can be divided into three major tectonic divisions (Davies, 1978). They
19
are the Papuan Basin in the southwest, the central Orogenic Belt, and the Bismarck-Solomons region in the northeast.
The Papuan Basin contains undeformed to moderately deformed Mesozoic and Cenozoic sedimentary rocks. These rocks, with increasing deformation and the appearance of metamorphism, merge with the central Orogenic Belt rocks to the northeast. This latter belt contains thick sedimentary sequences of Mesozoic and Cenozoic age with intercalated volcanic rocks, igneous intrusive rocks, and faulted blocks of metamorphic rocks. The Bismarck- Solomons region farther to the northeast is an allochthonous Cenozoic island-arc terrane characterized by volcanic, volcaniclastic, and carbonate rocks.
Within the Papuan Basin, sedimentary sequences range from thin, undeformed epicratonic sedimentary rocks in the southwest to thick, deformed shelf and trough sedimentary rocks adjacent to the central Orogenic Belt. Neogene to Quaternary volcanic rocks and dioritic stocks occur throughout the basin, and in the far northwest porphyry copper-gold-silver miner alization is associated with the latter at Nong River (Deposit #2-fig. 12, table 13) (Pliocene), Ok Tedi (Deposit #l-fig. 12, table 13) (Pleistocene), and lifalmin (Deposit #3-fig. 12, table 13) (Pliocene). Gold and silver occurs with sulfides in veins and stockworks in a Miocene dioritic complex at Porgera (Deposit #5- fig. 12, table 13), and similar mineralization occurs at Mt. Victor (Deposit #28-fig. 12, table 13) associated with a Miocene andesite porphyry. Lenses of massive copper-gold-silver-bearing sulfides within Eocene argillite and shale have been mined at Laloki (Deposit #47-fig. 12, table 13). Small deposits of manganese as lenses, nodules, and disseminations within Eocene chert occur at Rigo (Deposit #46-fig. 12, table 13) in the southeastern part of die basin.
The central Orogenic Belt contains metased- imentary and metavolcanic rocks that have been cut by major fault systems and have been overlain by unmetamorphosed Neogene sedimentary rocks, par ticularly in the northwest and southeast. Fault-bounded ophiolite complexes are found throughout the belt, as are intrusive igneous complexes. Two large porphyry-type deposits have been found within rocks of the Orogenic Belt. At the Frieda (Deposit #4-fig. 12, table 13) deposit, copper-gold mineralization is associated with a Miocene porphyritic microdiorite, whereas at Yandera (Deposit #7-fig. 12, table 13) copper-molybdenum mineralization occurs within a Miocene quartz monzonite body. Several small- or medium-sized vein- gold deposits all within or adjacent to high-level intrusive or associated volcanic rocks of Neogene age have been located in the southeastern half of the belt. In the Wau area, quartz or quartz-manganese vein deposits are found associated with dacite at Edie Creek (Deposit #32-fig. 12, table 13) and granodiorite at Hidden Valley (Deposit #32-fig. 12, table 13). Similar gold-bearing quartz fissure veins are found at Umuna
(Deposit #42-fig. 12, table 13) (associated with diorite). At Wapolu (Deposit #38-fig. 12, table 13), gold mineralization occurs along the faulted contact between the basement metamorphic and cover rocks. Massive lenses of nickel-iron sulfides with magnetite occur within an ophiolite complex at Doriri (Deposit #45- fig. 12, table 13) in the southeastern part of the belt
Within the Bismarck-Solomons region, Paleogene basement volcanic and volcaniclastic rocks or argillite with some carbonate rocks are overlain by Neogene carbonate and volcanic rocks. Mineralization is characterized by porphyry and epithermal deposits. Porphyry copper-gold and copper-molybdenum deposits, which are associated with a range of felsic and intermediate intrusive rocks, include Panguna (Deposit #22-fig. 12, table 13) (Neogene-diorite), Legosulum (Deposit #20-fig. 12, table 13) (Paleogene-Neogene- quartz diorite), Pelapuna (Deposit #24-fig. 12, table 13) (Paleogene-granodiorite and monzonite), Plesyumi (Deposit #26-fig. 12, table 13) (Paleogene-quartz diorite), Kulu River (Deposit #27-fig. 12, table 13) (Paleogene-tonalite), Mt. Kren (Deposit #16-fig. 12, table 13) (Neogene-diorite), and Arie (Deposit #14-fig. 12, table 13) (Neogene-diorite).
Epithermal vein gold deposits are found associated with Neogene-Holocene intrusive and extrusive rocks. Notable is the deposit on Lihir Island (Deposit #19- fig. 12, table 13) (Holocene-monzonite), the largest single gold deposit in the western world outside the Republic of South Africa. Other epithermal gold deposits in this region include Pigibut (Deposit #18-fig. 12, table 13) (Paleogene-Neogene?), Kabang (Deposit #21- fig. 12, table 13) (Holocene-trachyte), Wild Dog (Deposit #23-fig. 12, table 13) (Neogene-andesite-dacite complex), and Kulumadau (Deposit #40-fig. 12, table 13) (Neogene-feldspar porphyry).
Several medium- to large-sized lateritic nickel deposits, as yet unworked, have been identified overlying ultramafic rocks of the central Orogenic Belt; they include Ramu (Deposit #8-fig. 12, table 13), Lake Trist (Deposit #33-fig. 12, table 13), Bovio Hill (Deposit #34-fig. 12, table 13), Kokoda (Deposit #36- fig. 12, table 13), and Wowo Gap (Deposit #37-fig. 12, table 13). The Ramu (Deposit #9-fig. 12, table 13) deposit also contains a major resource of chromite.
Small, scattered bauxite deposits occur on several offshore islands, but only the deposit at Lepatuan (Deposit #13-fig. 12, table 13) is of any significance. Placer gold deposits have been worked extensively in the past; they include Sudest Island (Deposit #43-fig. 12, table 13), Lakekamu (Deposit #29-fig. 12, table 13), and Bjllolc (Deposit #30-fig. 12, table 13). Mt. Kare (Deposit #6-fig. 12, table 13) alluvial-colluvial gold deposit is at present being mined. Beach placer deposits include the large chromite resource at Hessen Bav (Deposit #35-fig. 12, table 13) and scattered magnetite deposits in the Deception Bav (Deposit #48-fig. 12, table 13) and Table Bay (Deposit #44-fig. 12, table 13) regions. Industrial mineral deposits include sulfur at the
20
lamelele (Deposit #39-fig. 12, table 13) geothermal area and at Pago (Deposit #25-fig. 12, table 13) volcano. Small phosphate deposits have been found on scattered offshore islands, most notably at Nauna (Deposit #17- fig. 12, table 13).
Detailed accounts of Papua New Guinea mineral deposits are given in Hughes (1990).
IRIAN JAVA (Indonesia)
ByW. D. Palfreyman
The major structural divisions of Irian Jaya can be carried westward from those recognised in Papua New Guinea. These three major divisions of Irian Jaya, named the Continental Province, Transitional Zone, and Oceanic Province by Pieters and others (1983), thus broadly correspond with the Papuan Basin, the central Orogenic Belt, and the Bismarck-Solomons region respectively (Davies, 1978) of Papua New Guinea.
The Continental Province consists of a Paleozoic to Mesozoic basement of sedimentary and minor felsic intrusive rocks, in places metamorphosed, which is overlain by Tertiary and Quaternary carbonate rocks and intruded by Pliocene porphyry and diorite. At the Ertsberg/Grasberg (Deposit #5-fig. 12, table 14) deposit, Pliocene quartz monzonite has intruded carbonate rocks to form extensive copper and gold-bearing skarns.
The Transitional Zone contains rocks equivalent in age to the Paleozoic-Mesozoic sequences of the Continental Province. These rocks, however, have been folded, strongly metamorphosed, and cut by major faults resulting from continent/island-arc collision in the Tertiary. They do not contain any significant mineral deposits.
The Oceanic Province consists of Paleogene and Neogene island-arc volcanic, volcaniclastic, and intrusive rocks with ultramafic plutonic and interbedded carbonate rocks in places. Overlying these are Neogene- Quaternary marine and continental sedimentary rocks. Lead-zinc mineralization as veins and stockworks in fractured and altered andesitic pyroclastic rocks is found at Amberhaken (Deposit #l-fig. 12, table 14), and similar copper mineralization occurs south of the Cyclops Mountains (Deposit #2-fig. 12, table 14) in the northeast of the country. Here also small-scale lateritic
nickel and chromium deposits are found associated with ultramafic rocks.
SOUTHWEST PACIFIC OCEAN
ByW. D. Palfreyman
Babelthuap Island, Palau group
An epi thermal gold deposit occurs on the southeast coast of Bahelthuap Island (Deposit #8-fig. 13, table 15) (Miller and others, 1987). Here mineralized veins, shears, and brecciated zones cut altered and weathered mafic and intermediate volcanic rocks of Paleogene age.
Phosphate islands
Insular phosphate deposits have been formed by the leaching of phosphorus from bird guano, accumulated during the Holocene, and the subsequent precipitation of phosphate minerals in the bedrock (Hutchinson, 1950).
This mechanism resulted in thin and scattered deposits on numerous southwest Pacific islands that were rapidly mined out during the latter part of the last century. Exceptions were the thick high-volume deposits on a few raised coral islands such as Christmas Island (Indian Ocean) (Deposit #l-fig. 13, table 15), Nauru (Deposit 18-fig. 13, table 15), and Ocean Island (Deposit #19-fig. 13, table 15). These deposits were generally not recognized until the beginning of this century and in some instances are still being mined.
ANTARCTICA
ByW. D. Palfreyman
The Antarctic continent can be divided into two geologically contrasting parts: east Antarctica, consisting of Archean and Proterozoic cratonic rocks, and west Antarctica, consisting mostly of Phanerozoic fold-belt and cover rocks (Rowley and others, 1983). A portion of east Antarctica is included on the accompanying map.
In the Bunger Hills (Deposit #41-fig. 13, table 15) (Wilkes Land), iron occurs as magnetite (up to 25 percent) in Proterozoic schist and gneiss. Molybdenite is also reported from a pegmatite in the same area.
Farther east, on the Clark Peninsula (Deposits #39 and 40-fig. 13, table 15), near Casey Station, magnetite occurs in Proterozoic BIF. Manganese also occurs as pods in Proterozoic gneiss. Molybdenite is found nearby as an accessory mineral in Precambrian granite along the shore of Ainsworth Bay (Deposit #37-fig. 13, table 15). This mineral also occurs in small quantities together with
21
pyrite and arsenopyrite in quartz veins cutting gneiss at Cape Denison (Deposit #3R-fig. 13, table 15). Cassiterite has been found in heavy mineral concentrates taken from Paleozoic sandstone near Horn Bluff (Deposit #36-fig. 13, table 15).
SEAFLOOR RESOURCES
Seafloor deposits shown on the map include ferromanganese nodules, hydrothermal sulfide deposits, phosphorites, and heavy-mineral sand deposits. The information available on sulfide deposits, phosphorites, and heavy-mineral sands is so limited as to preclude estimating abundance; we have merely denoted their locations. Greatest attention has been devoted to the abundance and metal content of nodules.
Nodule abundance (seafloor coverage) at discrete locations has been ascertained from seafloor photographs and sediment cores. The nickel, copper, cobalt, and manganese contents of nodules in many of the core samples and in dredge samples have also been shown, rather than their iron content or other minor element composition. The aim of this section is to explain the procedures used to display these data.
Ferromanganese crust, recovered by dredging, is also shown on the map. No attempt is made to show all dredge sites. They are divided into four groups, based on their elemental contents (Lane and others, 1986; Manheim and Lane-Bostwick, 1989).
SEAFLOOR SEDIMENT
ByFloyd W. McCoy
Seafloor sediment is classified in four categories by its dominant component: (1) calcareous debris (calcareous ooze/clay or marl), (2) biosiliceous material (biosiliceous ooze/mud/clay), (3) terrigenous elastics (gravel/sand/silt), and (4) clays (including pelagic clay). These 4 sediment types are generalized from the 13- category classification scheme used to depict surficial deposits on the various Circum-Pacific Geologic quadrant maps, a scheme defining 30-60 percent boundaries for sediment nomenclature following that devised by Murray and Renard (1891). On the Southwest Quadrant Mineral-Resources Map, a stippled pattern is superimposed where coarse-grained particles (gravel, sand or coarse-silt sizes) form greater than 15 percent of the sediment (for example, silty or sandy clay, volcanic gravel/sand/silt; calcareous gravel/sand/silt, or biosil iceous silt).
Sedimentary components were identified and abundances estimated via smear-slide analyses of core- top deposits in piston and gravity cores archived at the Lamont-Doherty Earth Observatory. Quantitative control came from analyses of CaCO3 on selected
samples. Additional smear-slide and CaCO3 data came from published and unpublished sources. These data formed a primary data base for plotting sediment distributions. A secondary data base was constructed from general sediment descriptions in the literature that lacked quantitative component and CaCO3 information; this information was used to estimate the geographic extent of distribution patterns. Information from Deep Sea Drilling Project (DSDP) samples were not incorporated because rotary drilling techniques do not recover undisturbed seafloor sediment. Data available at the time of map compilation from Ocean Drilling Program (ODP) sampling by hydraulic piston corers were incorporated. For clastic debris, the Wentworth grade scale was used. Constraints, problems, and assumptions in establishing these data bases and using them for mapping are discussed in the various Explanatory Notes booklets that accompany each Geologic quadrant map.
For simplification on the Southwest Quadrant Mineral-Resources Map, stations where surficial sediment was sampled or identification of sediment criteria derived from primary/secondary data bases are not shown; refer to the Southwest Geologic Map for this information (Palfreyman, 1988).
Mapping boundaries of sediment types were controlled by bathymetry, regional water depth of the calcite compensation depth, proximity to land (including knowledge of local geology), documented seafloor sedimentation processes, and the deposits left by this activity, as well as oceanographic/biologic phenomena.
This map depicts unconsolidated sediment recovered primarily by coring and presumably exposed on the ocean floor at the sediment/water interface. This sediment is not necessarily of Holocene age, nor is it necessarily the result of Holocene sedimentary processes.
FERROMANGANESE NODULES
By David Z. Piper and Theresa R. Swint-Iki
Nodules, consisting mainly of manganese and iron oxides, were first recovered from the Pacific Ocean by HMS Challenger during its voyage from 1872 to 1876 (Murray and Renard, 1891). They were most frequently recovered from abyssal depths where the bottom sediment is composed of red clay. Analyses of samples collected during that cruise, as well as of many samples collected subsequently, snowed contents of nickel, copper, and cobalt in the range of a few tenths of one percent to about three percent Interest in mining these deposits developed following a series of papers by Mero (1959, 1965), who called attention to the feasibility of their commercial recovery. McKelvey and others (1983) suggested that molybdenum, vanadium, and several of the rare-earth elements might also be recoverable as by-
22
products of possible future extractions of nickel, copper, and cobalt. These elements, as well as titanium, zinc, barium, lead, strontium, and yttrium, are present in the nodules in the range of <0.01 to nearly 0.1 percent (McKelvey and others, 1983).
Mero (1965) outlined the features of the geographic distribution of nodules in the Pacific Ocean and the regional variations in their composition. More recent studies include those by Cronan and Tooms (1969), Piper and Williamson (1977), and Calvert (1978), and still others are reported in the compendia of Glasby (1976), Bischoff and Piper (1979), and Sorem and Fewkes (1979). Other efforts to delineate the distribution of nodules on maps include those of Ewing and others (1971), Frazer and others (1972), Cronan (1977,1980), Rawson and Ryan (1978), and McKelvey and others (1979,1983).
These maps suggest that nodule occurrence and composition in the Pacific Ocean exhibit a rather uniform distribution over areas as great as several thousand square kilometers. Both parameters, however, show uneven variations on the scale of a few tens of square meters. For example, nodule coverage at individual stations, in the area at lat 10°N and long 150°W, ranges from 0 to greater than 50 percent. Furthermore, coverage at one of these stations, for which there were 550 photographs, ranges from 0 to 75 percent; photographs were taken at this station as the ship drifted a distance of only about 1.5 km. Such variability (patchiness) makes it extremely difficult to estimate seafloor coverage on any scale, and particularly at the scale of this map. All maps showing the distribution of abundance and metal content at such scales have, therefore, a significant degree of uncertainty. Individual data pouits of nodule abundance and metal content are shown on the map by sets of symbols in order to permit evaluation of the procedures used in the contouring, which are explained below.
Ideally, nodule abundance should be expressed in mass per unit area; for example, kilograms per square meter. Such data, however, are sparse and the abundance is therefore shown in terms of percentage of the sea floor covered. No attempt is made to convert seafloor coverage to mass per unit area for three reasons: (1) Photographs may underestimate the seafloor coverage by as much as 25 percent, because nodules often are partially covered by a layer of "fluffy" sediment 5 to 15 mm thick (Felix, 1980). The degree to which they are covered is likely to vary between areas with different seafloor environments and with different nodule morphologies; it varies considerably even between box cores from a single relatively small area. (2) No simple relation exists between nodule cross-sectional area and nodule volume; nodule shapes vary from roughly spherical to strongly discoidal (Sorem and Fewkes, 1979). (3) Photographs are taken with the camera nearly on the bottom to as much as several meters above the bottom, thus making it impossible to ascertain accurately from the photographs the nodule size.
Nodules are identified on the bottom photographs as dark and roughly equidimensional objects, with the entire population having a distribution strongly peaked in the size range of 1 to 12 cm in diameter. Angular objects and sub-rounded objects, often several tens of centimeters across, are identified as rock debris. In most cases, the difference between nodules and rocks is clear. Three people examined all photographs; still some errors in identification may have occurred.
Seafloor coverage of nodules was determined by comparing each photograph with templates showing a light background covered to varying degrees by black objects. The upper limit of 100 percent represents an arrangement of closest packing. The average coverage for all photographs at any one station was plotted as a single point. The number of photographs at a single station ranges from 1 to 850, although for most stations it is between 5 and 15.
Data from sediment cores (including box, gravity, and piston cores) supplement the photographic data. Core stations are plotted merely as recovering or not recovering nodules. Although the core sizes vary from a half-meter on a side (box cores) to 2.5-cm diameter (gravity cores), integrating these measurements with the photographic data was achieved in the following way.
Areas of varying seafloor coverage of nodules were delineated initially by using only the data obtained from the seafloor photography. In areas for which abundant cores were available, seafloor coverage was further refined using the core data. A contour of one percent was drawn to exclude areas in which photo stations recorded zero coverage. Several sediment cores recovered nodules in these areas, but the coverage outside this contour is certainly less than 1 percent and probably less than 0.1 percent. The position of the one-percent contour was further defined by using the core data in two ways: (1) a nodule-bearing core was allowed in the <l-percent area only when its 5 nearest neighboring cores did not recover nodules, and (2) the contour was drawn to exclude all areas having at least 20 cores, of which 10 percent or fewer recovered nodules. In most areas as large as 12,000 km2, cores recovering nodules average less than 1 percent of the total number of cores.
The second step was to draw the 50-percent contours to include both photographic stations of greater than 50 percent coverage and areas where recovery of nodules was greater than 75 percent.
The 10-percent contours were then drawn. This contour enclosed photographic stations that showed the complete range of coverage. Emphasis was placed, however, on photographic stations that showed greater than 25 percent coverage. Some photographic stations that recorded greater than 25 percent coverage lie outside the 10-percent contour line if their nearest neighbor recorded zero percent coverage or if 4 of 5 nearest cores failed to recover a nodule.
The 25-percent contours were drawn lastly to enclose areas of high coverage, as supported by either core or photographic data.
23
The percentage of cores recovering nodules between the 1-percent and 10-percent contours is surprisingly high: within the northeast and southeast quadrants of the Pacific Ocean, nodule recovery varied from 8 to 70 percent and averaged 40 percent in areas containing more than 10 cores. In the areas where contours define nodule coverage at 10-25 percent, nodule recovery by cores averaged 55 percent and ranged from 25 to 62 percent. For the area of 25-50 percent coverage, nodule recovery by cores averaged 64 percent and ranged from 30 to 92 percent. In the area where coverage exceeded 50 percent, nodule recovery by cores averaged 83 percent. Many fewer cores have been collected from the Southwest Quadrant. High nodule recovery rates, however, are strongly suggested by the data. One possible explanation for such high recoveries by cores is that we have not distinguished between box cores, which sample a relatively large surface area of the sea floor, and gravity and piston cores. Alternatively, seafloor coverage based on bottom photographs may be biased on the low side owing to sediment cover.
Dredge hauls were not used as a supplement to the photographic and core data because the area sampled by dredging generally is not accurately known.
Nodules were divided according to their chemical composition into four partly overlapping categories: (1) greater than 1.8 percent nickel plus copper, (2) 1.0 to 1.79 percent nickel plus copper, (3) greater than 35 percent manganese, and (4) less than 1.0 percent nickel plus copper (McKelvey and others, 1983). These categories are shown on the map for stations for which data were available in the Scripps Sediment Data Bank. Only one contour, that of 1.8 percent nickel plus copper, in the Central Pacific Basin, is shown and it is based largely on the data collected and published by McKelvey and others (1979). The problem of contouring the chemical data is similar to that encountered in contouring the coverage data. Small-scale variability precluded exclusion of all conflicting data from the area enclosed by the contour.
One area of greater than 50 percent seafloor coverage is delineated by the contour in the Central Pacific Basin. This large area corresponds to the area in which the nodules frequently contain more than 1.8 percent nickel plus copper. A second area, but of lower abundance, occurs at 50 to 60°S latitude, along the northern flank of the Pacific-Antarctic Ridge. By contrast, nodules within this area contain less than 1.8 percent nickel plus copper. An additional area of consistently high coverage occurs in the Southeast Pacific Basin, but is shown on the Southeast Quadrant Mineral-Resources Map (Corvalan, in proof).
Nodules and crusts with high cobalt content (these include dredge material) occur in areas of elevated relief, such as the seamounts and ridges. In many areas where cobalt-rich nodules are present, encrustations of the same composition can exceed 2 cm in thickness (Manheim and Halbach, 1982). Nodules with high manganese content (>35 percent Mn) tend to be restricted to hemipelagic
sediment; for example, the east margin of the Pacific. The few analyses of nodules from this environment of the Southeast Quadrant preclude any comment on the chemical trends.
The distribution of nodules is strongly related to sediment lithology, shown on the map as a background to the nodule distribution, and to sediment accumulation rates, not shown on this map but included on a l:17,000,000-scale map of the Pacific Basin (Piper and others, 1985). The distribution of nodules shows a strong preference for siliceous sediment and pelagic clay. They tend not to occur on calcareous sediment, although the area north of the Southeast Indian Rise at lat 35 to 40°S exhibits an exception to this generalization. In this and other areas, however, nodules are apparently further restricted to areas showing sediment accumulation rates of less than approximately 5 mm per thousand years (Piper and Swint, 1984; Piper and others, 1987). The Guatemala Basin in the east-central Pacific represents a somewhat unusual region in that nodules have wide distribution in this area of high sediment accumulation. This area has been examined extensively in projects funded by the National Science Foundation (Dymond and others, 1984).
Many factors influence the rather complex patterns of sea-bottom sediment lithology and nodule coverage. These include the supply of material to the seafloor and the secondary processes in the deep ocean that alter or redistribute that supply. The supply is controlled largely by (1) proximity to a source of alumino-silicate material and (2) primary productivity in the photic zone of the ocean. The source of silicates (clay minerals as well as coarse debris) may be local (marine volcanic activity) or terrigenous (continents contribute material via both rivers and the atmosphere). Primary productivity, on the other hand, controls the "rain" of biogenic detritus to the seafloor. This fraction of organics consists mostly of siliceous and calcareous tests of planktonic organisms, but contains lesser amounts of phosphatic material and organic matter from the soft parts of organisms.
Secondary processes include the dissolution of organic matter at depth in the ocean and the redistribution of sediment by deep-ocean currents. The occurrence of calcareous sediment and the depth of the seafloor show a strong relation, owing to the dissolution of CaCO3 in the deep ocean. This relation can be seen on and around the Campbell Plateau in the South Pacific (McCoy, 1988,1989). Calcareous mud predominates on the Plateau and down its flanks to a depth of approximately 4000 m, at which depth it gives way to pelagic clay or siliceous sediment. The exclusion of calcareous debris from the deeper sediment is controlled by the balance between the rate of supply of CaCO3 to the seafloor and its rate of dissolution. The latter increases with water depth, owing to the increase in the solubility of CaCO3 with decreasing water temperature and increasing pressure.
Many measurements of deep-ocean bottom currents have been made, but their usually weak intensity
24

and the complex seafloor bathymetry have combined to thwart attempts to evaluate quantitatively their importance as a control on sediment accumulation rates and thus indirectly on nodule distribution, except for several rather careful studies of a few small areas (Lonsdale, 1981).
The origin of nodules is still uncertain after more than 100 years of research. Their distribution in the Pacific Ocean as shown on this map and the other quadrant maps of the Pacific, however, exhibits rather strong relations to the lithology of surface sediment and to seafloor bathymetry, relations which may help to elucidate the question of nodule genesis.
Bottom photographs used in this study are from the Bundesanstalt fur Geowissenshaften und Rohstoffe, Committee for Co-ordination of Joint Prospecting for Mineral Resources in South Pacific Offshore Areas, Geological Survey of Japan, Hawaii Institute of Geophysics, Institut Fransais de Recherches pour 1'Exploitation de la Mer, Lamont-Doherty Earth Observatory, Kennecott Exploration, Inc., National Oceanic and Atmospheric Administration, Scripps Institution of Oceanography, Smithsonian Institution, U.S. Navy Electronics Laboratory, and from published literature (Zenkevich, 1970; Andrews and Meylan, 1972; Backer and others, 1976; Greenslate and others, 1978; and Meylan and others, 1978). The chemical data on the nodules are from the Scripps Institution of Oceanography Sediment Data Bank.
FERROMANGANESE CRUSTS
By Frank T. Manheim and Candice M. Lane-Bostwick
The cobalt values indicated in the map represent data normalized to a hygroscopic moisture and substrate- (detrital matter) free basis. The algorithm to obtain these values is given by Co* = Co x 51.23/(Fe+Mn), as determined in Manheim and Lane-Bostwick (1989). Samples designated as being of possible hydrothermal origin are identified by Mn/Fe >5 and Co <0.2 percent. Some classes of samples are excluded; data of Bames (1967) in the Scripps Institution Nodule Data Bank, samples lacking Mn and/or Fe data (which do not permit normalization), and samples having Mn <5 percent. Multiple samples at one location have been averaged.
The geographical distribution of samples has been largely published in Lane and others (1986). Discussion of the significance of cobalt distributions and of the development of the U.S. Geological Survey Ferro- manganese Crust Database is given in Manheim (1986) and Manheim and Lane-Bostwick (1989). The majority of the ferromanganese crust analyses are from two sources; the U.S. Geological Survey World Ocean Ferromanganese Crust Database and the Scripps Institution Nodule Data Bank. Evaluation of these data are discussed in Manheim and Lane-Bostwick (1989).
These and other sources are described in Manheim and Lane-Bostwick (1989).
POLYMETALLIC SULFIDES
By Theresa R. Swint-Iki
The initial discovery of warm-water springs rising from mounds of hydrothermal sediment at the Galapagos spreading center (Corliss, 1971; Weiss and others, 1977) and sulfide deposits forming at active high-temperature discharge sites at 21°N on the East Pacific Rise (Spiess and others, 1980) confirmed that hydrothermal circulation at seafloor-spreading axes leads to the precipitation of metal sulfides from hydrothermal fluids strongly enriched in sulfide and metals (Von Damm and others, 1985a, 1985b). Several types of deposits (metal oxides and sulfides) form directly or indirectly from this hydrothermal activity at divergent plate boundaries.
The thermal balance in oceanic crust along spreading axes is considered to be dominated by hydrothermal circulation and advective cooling because conductive heat-flow measurements taken along ridge crests consistently show lower than expected values (Lister, 1972; Sleep and Wolery, 1978). Models of hydrothermal processes in oceanic crust developed by Lister (1977, 1982), Sleep and Wolery (1978), Edmond and others (1979), Fehn and Cathles (1979), Bischoff (1980), and Fehn and others (1983) are largely based on investigations of seafloor-spreading axes in the northeast quadrant of the Pacific.
Since the initial observations of hydrothermal activity along the Galapagos spreading center and segments along the East Pacific Rise, polymetallic sulfides have been found in backarc basins where seafloor spreading occurs above subduction zones along convergent plate boundaries. The occurrence of metal- enriched sediment (Fe, Mn, Cu, Zn, As, Ag, and Au) is also indicative of hydrothermal activity in regions of backarc basins (Cronan, 1989). Metalliferous sediment occurs in the central Lau Basin, North Fiji Basin, and in the Manus Basin, east of Papua New Guinea (Von Stackelberg and Von Rad, 1990; Hannington and others, 1991). In the region of the Southwest Quadrant, the Lau, North Fiji, and Manus Basins and Mariana Trough have been examined to study hydrothermal processes in backarc basins.
In 1984, during the R/V Sonne cruise SO-35 to the southern Lau Basin, sulfide mineralization was reported at seamounts near Valu Fa Ridge, a ridge of recently formed crust (Von Stackelberg and Von Rad, 1990). In the Lau Basin at approximately 15°30'S, 174°30'W, fragments from hydrothermal vent chimneys composed of iron, zinc, and copper sulfides were recovered during the 1985 Papatua Expedition of Scripps Institution of Oceanography (Hawkins, 1986). During the 1989 Nautilau cruise to the southern Lau Basin, an active
25
"black smoker" in a hydrothermal field was observed. It was the first active vent discovered in a backarc basin. Samples of polymetallic sulfides were collected from the site using the submersible Nautile (Nautilau Group, 1990; Herzig and others, 1990). The samples were found to contain grains of native gold, averaging 2.9 ppm Au from 44 samples (8MB, 1990).
In the southern region of the North Fiji Basin, hydrothermal sulfides in volcanic rocks were recovered at approximately 16°15'S, 177°25'E during the 1984 R/V Sonne cruise SO-35 (Von Stackelberg and others, 1985). An active hydrothermal site on North Fiji Basin Ridge was discovered in 1989 during the Nautilau cruise during dives of the submersible Nautile (Auzende and others, 1992).
West of Papua New Guinea, in a spreading zone in the western Woodlark Basin, an active hydrothermal field was recently discovered within the caldera of Franklin Seamount at approximately 152°E, 10°S during a 1990 cruise of R/V Akademik Mstislav Keldys to explore for hydrothermal mineralization in the region (Lisitsyn and others, 1991).
Further north, inside the rift zone of Manus Basin, north of Papua New Guinea, at approximately 3°09.7'S and 150°16.8'E and a depth of 2,500 m, hydrothermal chimneys were observed (Both and others, 1986); and during a later investigation in 1990 by the R/V Akademik Mstislav Keldysh, five hydrothermal fields, three active, two extinct, were discovered (Lisitsyn and others, 1993). Dredging in the region has recovered manganese-rich crusts of hydrothermal origin, indicating this region may contain possible reserves of polymetallic sulfide deposits (Bolton and others, 1988).
North of Manus Basin, at approximately 14°N, 145°E, fumarolic activity was reported at Esmeralda Bank, along the flanks of the submarine volcano in the Mariana Trough (Stiiben and others, 1992). Further north, hydrothermal vents have been reported at 18°13'N, 144°42.6'E, within the axial region of the Mariana Trough (Botz and Stoffers, 1992).
Much further work is required to evaluate the extent and composition of known seafloor polymetallic sulfide deposits along spreading centers at divergent plate boundaries and in backarc basins, to evaluate possible future economic potential of polymetallic sulfide deposits, and to explore for new deposits.
PHOSPHORITES AND PHOSPHATIZED ROCKS
By David Z Piper and Theresa R. Swint-Iki
Submarine phosphate deposits consist of rock encrustations, nodules, and pellets. Occurrences in the Southwest Quadrant are reported on the continental shelf of western Tasmania, Australia (Noakes and Jones, 1975), on the upper continental slope off northern New South Wales, Australia, at depths between 210 and
385 m (Von der Borch, 1970), and on Pacific seamounts at variable depths (Burnett and Lee, 1980).
An area of high phosphorite coverage is located east of New Zealand along the crest of Chatham Rise at depths of 250 to 500 m. Reserves of phosphorite in a 378-km2 area along Chatham Rise are estimated at 25 million tons. The phosphorite in this area averages 22 percent P2Os (Kudrass, 1984). Estimated total reserves of phosphorite are 100 million tons for the region along the crest of Chatham Rise between 179°E and 180°E (Cullen, 1989). The region may be of interest when New Zealand's source of phosphorite from Nauru and Christmas Island is depleted.
HEAVY-MINERAL DEPOSITS
By Theresa R. Swint-Iki
Submerged beaches and river channels are favorable sites in the marine environment for the occurrence of concentrations of heavy minerals (placers) such as gold, platinum, chromite, rutile (TiO2), and ilmenite (FeTiO3). Beginning with the formation of the great ice sheets during the Quaternary, sea level has repeatedly fallen and risen more than 200 m. As a result of sea-level fluctuations, fossil beaches are found both above and below present sea level. Offshore placers are known to occur off New Zealand's North Island, the east coast of Australia, Fiji, and Vanuatu, and are shown on the map by chemical symbols (letters) in blue. Placer deposits on modern beaches are also shown because they are clues to the presence offshore of additional deposits.
In New Zealand, marine titaniferous-magnetite deposits have been mined onshore at Taharoa (Stokes and others, 1989) and Waikato North Head on North Island, providing over two million tons per year of titaniferous magnetite used for steel-making (Minehan, 1989). Offshore Auckland and New Plymouth, North Island, sands with greater than 15 percent titano- magnetite were identified during exploration in 1968 (Sprague, 1970). Other heavy-mineral deposits offshore New Zealand include gold (10 km off Hokitia), mercury (occurring in cinnabar in Whangaroa Harbour, Northland), and tin (occurring in alluvial cassiterite (SnO2) in the Foveaux Strait (Utting, 1989). However, the deposits must be examined in more detail to determine feasibility of offshore mining. To date, no offshore mining has occurred in New Zealand except for silica sand of Parengarenga Harbour and sand of Waiapa.
In Australia, in southeast Queensland, onshore beach-dune sand containing high concentrations of rutile and zircon is mined in Quaternary coastal sediment. Continental shelf sediment along eastern Australia was surveyed for heavy minerals in 1980 (Von Stackelberg, 1982). The shelf sediment sampled between Newcastle and Eraser Island contains lower concentrations of heavy minerals (average 0.1-1.6 percent) than onshore deposits
26

(Riech and others, 1982; Jones and others, 1982). Reconnaissance investigations were made in 1967 offshore southern New South Wales for alluvial gold deposits, but results were not released (Noakes, 1970).
On the shelf of east Tasmania, Australia, reconnaissance studies conducted in 1966 indicated prospects of offshore tin off the central east coast of Tasmania, in Ringarooma Bay, and east of King Island (Noakes, 1970).
In Fiji, titaniferous sands occur offshore from the Singatoka dune deposits on the south coast of the island of Viti Levu, and iron sands rich in titanomagnetite are found in the Mba River delta of north Viti Levu, but neither occurrence is considered economic at present (ESCAP, 1987).
In the region of the Solomon Islands, the shelf sediment along the north shore of Guadalcanal Island was sampled for gold to investigate terrigenous sediment transport by the Matepono River from the Gold Ridge deposit of central Guadalcanal. Traces of gold were found in the sediment sampled offshore from the Matepono River, and an old channel of the Matepono River, located by sub-bottom reflection profiles of Tetere Bay, may also contain gold that was concentrated by wave action (Turner and others, 1977).
REFERENCES CITED AND ADDITIONAL SOURCES OF DATA
INTRODUCTION
Doutch, H.F., chair, 1985, Geodynamic map of the circum-Pacific region, southwest quadrant: Tulsa, Oklahoma, American Association of Petroleum Geologists, scale 1:10,000,000,12 p.
Doutch, HP., chair, 1986, Plate-tectonic map of the circum-Pacific region, southwest quadrant: Houston, Circum-Pacific Council for Energy and Mineral Resources, scale 1:10,000,000,14 p.
Drummond, K.J., chair, 1985, Mineral-resources map of the circum-Pacific region, northeast quadrant: Houston, Circum-Pacific Council for Energy and Mineral Resources, scale 1:10,000,000,48 p.
Field, C.D., Wetherell, D.G., and Dasch, E.J., 1981, Economic appraisal of Nazca Plate metalliferous sediments, in Kulm, L.D., and others, eds., Nazca plate-crustal formation and Andean convergence: Geological Society of America Memoir 154, p. 315-320.
Guild, P.W., 1981, Preliminary metallogenic map of North America: a numerical listing of deposits: U.S. Geological Survey Circular 858-A, 93 p.
Guild, P.W., 1988, Revised symbology for the circum- Pacific mineral-resources maps, in Addicott, W.O., and Gryc, G., Scope and status of the Circum-Pacific Map Project, 1988: U.S.
Geological Survey Open-File Report 88-215, p. 84-85.
Manheim, F.T., and Lane-Bostwick, C.M., 1989, Chemical composition of ferromanganese crusts in the world ocean: a review and comprehensive database: U.S. Geological Survey Open-File Report 89-020,450 p.
McKelvey, V.E., Wrigbt, N.A., and Rowland, R.W., 1979, Manganese nodule resources in the northeastern equatorial Pacific, in Bischoff, J.L., and Piper, D.Z., eds., Marine geology and oceanography of the Pacific manganese nodule province: New York, Plenum Press, p. 747-762.
North American Metallogenic Map Committee, 1981, Preliminary metallogenic map of North America: U.S. Geological Survey, 4 sheets, scale 1:5,000,000.
Palfreyman, W.D., chair, 1988, Geologic map of the circum-Pacific region, southwest quadrant: Houston, Circum-Pacific Council for Energy and Mineral Resources, scale 1:10,000,000, 37 p.
Scheibner, Erwin, 1991, Tectonic map of the circum- Pacific region, southwest quadrant: U.S. Geological Survey Circum-Pacific Map Series CP-37, scale 1:10,000,000, 59 p.
LAND RESOURCES
Australia
Australian Surveying and Land Information Group (AUSLIG), 1988, Geology and minerals-atlas of Australian resources, 3rd series: Canberra, Department of Administrative. Services, scale 1:5,000,000,60 p.
Doutch, H.F., 1988, Explanatory notes, in Palfreyman, W.D., chair, Geologic map of the circum-Pacific region, southwest quadrant: Houston, Circum- Pacific Council for Energy and Mineral Resources, scale 1:10,000,000, 37 p.
Hughes, F.E., ed., 1990, Geology of the mineral deposits of Australia and Papua New Guinea: Australasian Institute of Mining and Metallurgy, Monograph 14,1824 p. (2 vol.).
Palfreyman, W.D., 1984, Guide to the geology of Australia: Australia Bureau of Mineral Resources, Bulletin 181, 111 p.
Palfreyman, W.D., chair, 1988, Geologic map of the circum-Pacific region, southwest quadrant: Houston, Circum-Pacific Council for Energy and Mineral Resources, scale 1:10,000,000, 37 p.
Scheibner, Erwin, 1991, Tectonic map of the circum- Pacific region, southwest quadrant: U.S. Geological Survey Circum-Pacific Map Series CP-37, scale 1:10,000,000, 59 p.
27
New Zealand
Bishop, D.G., Bradshaw, J.D., and Landis, C.A., 1985, Provisional terrane map of South Island, New Zealand, in Howell, D.G., ed., Tectono- stratigraphic terranes of the circum-Pacific region: Houston, Circum-Pacific Council for Energy and Mineral Resources Earth Science Series, v. 1, p. 515-521.
Brathwaite, R.L., 1989, Geological setting of mineralization in New Zealand, in Kear, D., ed., Mineral deposits of New Zealand: Australasian Institute of Mining and Metallurgy, Monograph 13, p. 1-8.
Brathwaite, R.L., Bull, V.H., and Christie, A.B., 1986, The geological background to a resurgence in gold exploration in New Zealand, in Berkman, D.A., ed., Geology and exploration: Council of Mining and Metallurgy (CMMI) Congress, 13th, Singapore, 1986, Australasian Institute of Mining and Metallurgy, v. 2, p. 225-233.
Brathwaite, R.L., and Pirajno, F., 1985, Metallogenic epochs and tectonic cycles in New Zealand: Geologicky Zbornick-Geologica Carpathica, v. 36, no. 3, p. 293-303.
Christie, A.B., and Brathwaite, R.L., 1986, Epithermal gold-silver and porphyry copper deposits of the Hauraki Goldfield-a review, in Henley, R.W., Hedenquist, J.W., and Roberts, P.J., eds., Guide to the active epithermal (geothermal) systems and precious metal deposits of New Zealand: Monograph Series on Mineral Deposits no. 26, Gebruder Borntraeger, p. 129-145.
Coombs, D.S., Landis, C.A., Norris, R.J., Sinton, J.M., Borns, D., and Craw, D., 1976, The Dun Mountain Ophiolite Belt, New Zealand; its tectonic setting, constitution and origin, with special reference to the southern portion: American Journal of Science, v. 276, p. 561-603.
Cooper, R.A., 1989, Early Paleozoic terranes of New Zealand: Journal of the Royal Society of New Zealand, v. 19, no. 1, p. 73-112.
Kear, David, ed., 1989, Mineral deposits of New Zealand; a collection of papers summarizing the results of mineral exploration in New Zealand, 1974-87: Australasian Institute of Mining and Metallurgy, Monograph 13, 225 p.
Paterson, C.J., 1986, Controls on gold and tungsten mineralization in metamorphic-hydrothermal systems, Otago, New Zealand, in Keppie, J.D., Boyle, R.W., and Haynes, S.J., eds., Turbidite- hosted gold deposits: Geological Association of Canada Special Paper 32, p. 15-24.
Pirajno, F., 1980, Metallogenic provinces, mineral occurrences and geotectonic settings in New Zealand, in Cresswell, M.M., and Vella, P., eds., Gondwana Five: International Gondwana Symposium, Fifth, Wellington, New Zealand, 1980 [Proceedings], p. 231-235.
Tulloch, A.J., 1983, Granitoid rocks of New Zealand-abrief review: Geological Society of AmericaMemoir 159, p. 5-19.
Williams, GJM 1974, Economic geology of NewZealand: Australasian Institute of Mining andMetallurgy, Monograph 4,490 p.
Fiji
Colley, H., and Greenbaum, D., 1980, The mineral deposits and metallogenesis of the Fiji Platform: Economic Geology, v. 75, no. 6, p. 807-829.
Greenbaum, D., 1980, An assessment of the mineral resources of Fiji, in Hopkinson, E.G., and Beavington, C.F., eds., Commonwealth Committee on Mineral Resources and Geology: Special Liaison Report, p. 71-88.
Solomon Islands
Arthurs, J.W., 1979, Mineral occurrences in the Solomon Islands: Solomon Islands Geological Survey Bulletin 13, 55 p.
Doutch, H.F., chair, 1986, Plate-tectonic map of the circum-Pacific region, southwest quadrant: Houston, Circum-Pacific Council for Energy and Mineral Resources, 1:10,000,000 scale, 14 p.
Doutch, H.F., Needham, R.H., McCoy, F.W., Swint-Iki, T.R., Addicott, W.O., and Moore, G.W., 1988, Explanatory notes, in Palfreyman, W.D., chair, Geologic map of the circum-Pacific region, southwest quadrant: Houston, Circum-Pacific Council for Energy and Mineral Resources, scale 1:10,000,000, 37 p.
Vanuatu
Carney, J. N., and Macfarlane, A., 1980, Mineral resources of the New Hebrides, in Hopkinson, E.G., and Beavington, C.F., eds., Commonwealth Committee on Mineral Resources and Geology: Special Liaison Report, p. 101-112.
Macfarlane, A., 1982, Mineral and energy prospects in the small island nations of the South Pacific: Vanuatu-a typical example: Circum-Pacific Energy and Mineral Resources Conference, Third, Honolulu, 1982 [Transactions], p. 45-53.
New Caledonia
Brothers, R.N., andLillie, A.R., 1988, Regional geology of New Caledonia, in Nairn, A.E.M., Stehli, F.G., and Uyeda, S., eds., The ocean basins and margins, v. 7B, The Pacific Ocean: New York, Plenum Press, p. 325-374.
Paris, J.-P., 1981, Geologic de la Nouvelle-Caledonie: Bureau de Recherches Geologiques et Minieres, Memoire 113,278 p.
28
Papua New Guinea
Davies, H.L., 1978, Geology and mineral resources of Papua New Guinea, in Nutalaya, P., ed., Regional Conference on Geology and Mineral Resources of Southeast Asia, Third, Bangkok, 1978 [Proceedings]: Bangkok, Asian Institute of Technology, p. 685-699.
Hughes, F.E., ed., 1990, Geology of the mineral deposits of Australia and Papua New Guinea: Australasian Institute of Mining and Metallurgy, Monograph 14, 2 v., 1824 p.
Man Jaya
Davies, H.L., 1978, Geology and mineral resources of Papua New Guinea, in Nutalaya, P., ed., Regional Conference on Geology and Mineral Resources of Southeast Asia, Third, Bangkok, 1978 [Proceedings]: Bangkok, Asian Institute of Technology, p. 685-699.
Pieters, P.E., Pigram, C.J., Trail, D.S., Dow, D.B., Ratman, N., and Sukamto, R., 1983, The stratigraphy of western Man Jaya: Geological Research and Development Centre, Bulletin 8, p. 14-48.
Southwest Pacific Ocean
Hutchinson, G.E., 1950, Survey of existing knowledge of biogeochemistry-3. The biogeochemistry of vertebrate excretion: American Museum of Natural History Bulletin, v. 96, 554 p.
Miller, W.R., Rytuba, J.J., Arnold, M.A., and Vercoutere, T.L., 1987, Mineral resource investigation of the Roil Malk area, Republic of Palau: U.S. Geological Survey Open-File Report 87-198,128 p.
Antarctica
Rowley, P.D., Williams, P.L., and Pride, D.E., 1983, Mineral occurrences of Antarctica, in Behrendt, J.C., ed., Petroleum and mineral resources of Antarctica: U.S. Geological Survey Circular 909, p. 25-49.
SEAFLOOR RESOURCES
Andrews, J.E., and Meylan, M.A., 1972, Results of bottom photography; Kana Keoki Cruise Manganese '72, in Investigations of ferro- manganese deposits from the central Pacific: University of Hawaii Institute of Geophysics Report HIG-72-73, p. 83-111.
Auzende, J.M., and others, 1992, Japanese submersible explores the North Fiji Basin: EOS, v. 73, no. 11, March 17,1992, p. 116-117.
Backer, H., Glasby, G.P., and Meylan, M.A., 1976, Manganese nodules from the southwestern Pacific Basin: New Zealand Oceanographic Institute Oceanographic Field Report no. 6,88 p.
Bames, S.S., 1967, Minor element composition of ferromanganese nodules: Science, v. 157, p. 63-65.
Bischoff, J.L., 1980, Geothermal system at 21 °N, East Pacific Rise: physical limits on geothermal fluid and role of adiabatic expansion: Science, v. 207, p. 1465-1469.
Bischoff, J.L., and Piper, D.Z., 1979, Marine geology and oceanography of the Pacific manganese nodule province: New York, Plenum Press, 842 p.
Bolton, B.R., and others, 1988, Geochemistry and mineralogy of seafloor hydrothermal and hydrogenetic Mn oxide deposits from the Manus Basin and Bismarck Archipealgo region of the southwest Pacific Ocean: Geology, v. 95, p. 65-87.
Both, Ross, and others, 1986, Hydrothermal chimneys and associated fauna in the Manus backarc basin, Papua New Guinea: EOS, v. 67, p. 489-490.
Botz, R.W., and Stoffers, P., 1992, Isotopic composition of hydrothermal precipitates from the Mariana Trough: Marine Geology, v. 108, p. 239-243.
Burnett, W.C., and Lee, A.I.N., 1980, The phosphate supply system in the Pacific region: GeoJournal, v. 4, no. 5, p. 423-436.
Calvert, S.E., 1978, Geochemistry of oceanic ferromanganese deposits: Philosophical Trans actions of the Royal Society of London, v. 290A, p. 43-73.
Corliss, J.B., 1971, The origin of metal-bearing submarine hydrothermal solutions: Journal of Geophysical Research, v. 76, p. 8128-8138.
Corvalan D., J., chair, in proof, Mineral-resources map of the circum-Pacific region, southeast quadrant: U.S. Geological Survey Circum-Pacific Map Series CP-45, scale 1:10,000,000.
Cronan, D.S., 1977, Deep-sea nodules: distribution and geochemistry, in Glasby, G.P., ed., Marine manganese deposits: Amsterdam, Elsevier Publishing Company, p. 11-44.
Cronan, D.S., 1980, Underwater minerals: London and New York, Academic Press, 362 p.
Cronan, D.S., ed., 1986, Sedimentation and mineral deposits in the southwestern Pacific Ocean: London and Orlando, FL, Academic Press, 344 p.
Cronan, D.S., 1989, Hydrothermal metalliferous sediments in the southwest Pacific, in Ayala- Castafiares, A., and others, eds., Oceanography 1988: Mexico City, Universidad National Autonomade Mexico (UNAM) Press, p. 149-166.
Cronan, D.S., and Tooms, J.S., 1969, The geochemistry of manganese nodules and associated pelagic deposits from the Pacific and Indian Oceans: Deep-Sea Research, v. 16, p. 335-349.
29
Cullen, D. J., 1989, The submarine phosphorite deposits of central Chatham Rise, east of New Zealand, in Kear, David, ed., Mineral deposits of New Zealand: Australasian Institute of Mining and Metallurgy, Monograph 13, p. 201-206.
Dymond, Jack, and others, 1984, FeMn nodules from MANOP sites H, S, R-control of mineralogical and chemical composition by multiple accretionary processes: Geochimica et Cosmochimica Acta, v. 48, p. 931-949.
Edmond, J.M., and others, 1979, On the formation of metal-rich deposits at ridge crests: Earth and Planetary Science Letters, v. 46, p. 19-30.
ESCAP, 1987, Mineral sands in Asia and the Pacific- mineral concentrations and hydrocarbon accumulations in the ESCAP region: United Nations Economic and Social Commission for Asia and the Pacific, and Australia Bureau of Mineral Resources, Geology and Geophysics, v. 4, p. 98-99.
Ewing, M., Horn, D., Sullivan, L., Aiken, T., and Thorndike, E., 1971, Photographing manganese nodules on the ocean floor: Oceanology International, v. 6, no. 12, p. 26-32.
Fehn, U., and Cathles, L.M., 1979, Hydrothermal convection at slow spreading mid-ocean ridges: Tectonophysics, v. 55, no. 12, p. 239-260.
Fehn, U., and others, 1983, Numerical models for the hydrothermal field at the Galapagos Spreading Center: Journal of Geophysical Research, v. 88, p. 1033-1048.
Felix, D., 1980, Some problems in making nodule abundance estimates from seafloor photographs: Marine Mining, v. 2, p. 293-302.
Frazer, J.Z., and Fisk, M.B., 1980, Availability of copper, nickel, cobalt, and manganese from ocean ferromanganese nodules (III): Scripps Institution of Oceanography Report SIO 80-16, 31 August 1980,117 p.
Frazer, J.Z., Hawkins, D.L., and Arrhenius, G., 1972, Surface sediments and topography of the north Pacific: Scripps Institution of Oceanography, Geologic Data Center, scale 1:3,630,000.
Glasby, G.P., ed., 1976, Marine manganese deposits: Amsterdam, Elsevier Publishing Company, 523 p.
Greenslate, J., Krutein, M., and Pasho, D., 1978, Initial report of the 1972 Sea Scope Expedition: Spokane, Washington, U.S. Bureau of Mines (Minerals Availability System), 3 volumes.
Hannington, M.D., Herzig, P.M., and Scott, S.D., 1991, Auriferous hydrothermal precipitates on the modern seafloor, in Foster, R.P., ed., Gold metallogeny and exploration: Glasgow and London, Blackie and Son Ltd., p. 250-282.
Hawkins, J., 1986, "Black smoker" vent chimneys: EOS, v. 67, p. 430.
Herzig, P.M., Von Stackelberg, U., and Petersen, S., 1990, Hydrothermal mineralization from the Valu
Fa Ridge, Lau backarc basin (Southwest Pacific): Marine Mining, v. 9, p. 271-301.
Hughes, F.E., ed., 1990, Geology of the mineral deposits of Australia and Papua New Guinea: The Australasian Institute of Mining and Metallurgy, Monograph 14,1824 p. (2 vol.).
Jones, H.A., Kudrass, H.-R., Schluter, H.-U., and von Stackelberg, Ulrich, 1982, Geological and geophysical work on the east Australian shelf between Newcastle and Fraser Island-a summary of results from the Sonne Cruise SO-15, 1980: Geologisches Jarhbuch, Relhe D, Heft 56, p. 197-207.
Kudrass, H.-R., 1984, The distribution and reserves of phosphorite on the central Chatham Rise (Sonne- 17 Cruise 1981): GeoJournal, Reihe D, Heft 65, p. 179-194.
Lane, C.M., Manheim, F.T., Hathaway, J.C., and Ling, T.H., 1986, Station maps of the world ocean ferromanganese crust database: U.S. Geological Survey Miscellaneous Field Studies Map MF-1869, 2 sheets and pamphlet.
Lisitsyn, A.P., and others, 1991, Active hydrothermal activity at Franklin Seamount, western Woodlark Sea (Papua New Guinea): International Geology Review, v. 33, p. 914-929.
Lisitsyn, A.P., and others, 1993, A hydrothermal field in the rift zone of the Manus Basin, Bismarck Sea: International Geology Review, v. 35, no. 2, p. 105-126.
Lister, C.R.B., 1972, On the thermal balance of a mid- ocean ridge: Royal Astronomical Society Geophysical Journal, v. 26, p. 515-535.
Lister, C.R.B., 1977, Qualitative models of sprcading- center processes, including hydrothermal penetration: Tectonophysics, v. 37, p. 203-218.
Lister, C.R.B., 1982, "Active" and "passive" hydrothermal systems in the oceanic crust: predicted physical conditions, in Fanning, K.A., and Manheim, F.T., eds., The dynamic environment of the ocean floor Lexington, Massachusetts, Lexington Books, p. 441-470.
Lonsdale, P., 1981, Drifts and ponds of reworked pelagic sediment in part of the southwest Pacific: Marine Geology, v. 43, p. 153.
Manheim, F.T., 1986, Marine cobalt resources: Science, v. 232,2 May 1986, p. 600-608.
Manheim, F.T., and Halbach, P., 1982, Economic significance of ferromanganese crusts on seamounts of the mid-Pacific area: Geological Society of America, Abstracts with Programs, v. 14, p. 555.
Manheim, F.T., and Lane-Bostwick, C.M., 1989, Chemical composition of ferromanganese crusts in the world ocean: a review and comprehensive database: U.S. Geological Survey Open-File Report 89-020,450 p.
McCoy, F.W., 1988, Seafloor sediment, in Palfreyman, W.D., chair, Geologic map of the circum-Pacific
30
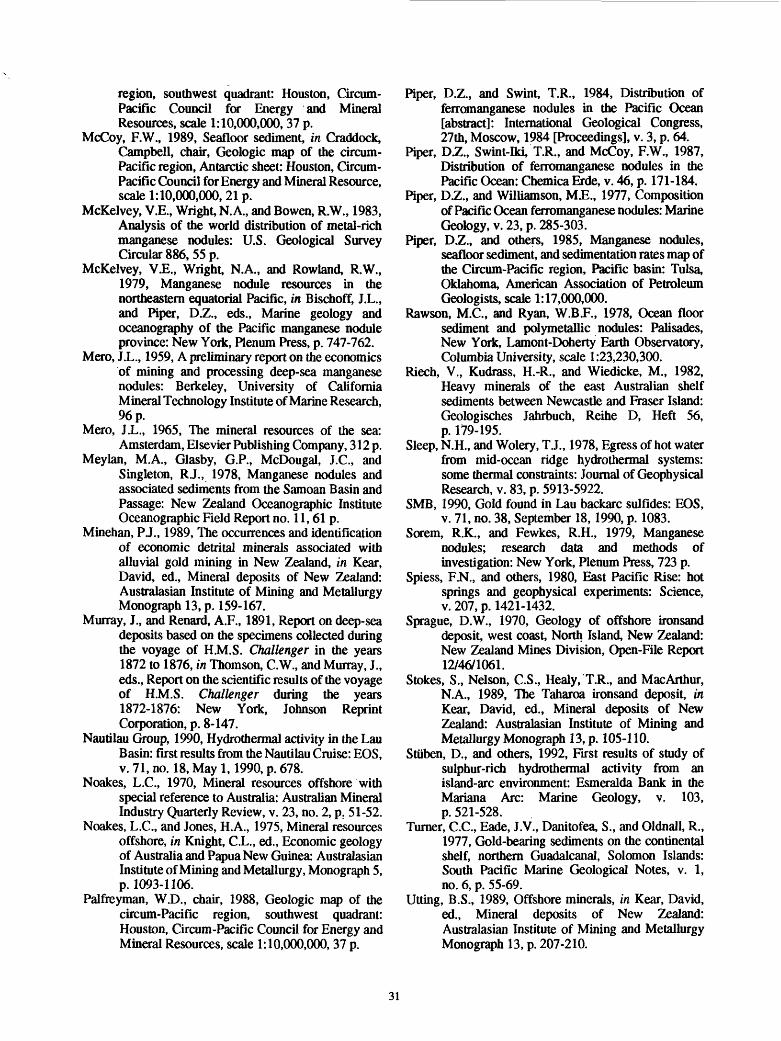
region, southwest quadrant: Houston, Circum- Pacific Council for Energy and Mineral Resources, scale 1:10,000,000,37 p.
McCoy, F.W., 1989, Seafloor sediment, in Craddock, Campbell, chair, Geologic map of the circum- Pacific region, Antarctic sheet: Houston, Circum- Pacific Council for Energy and Mineral Resource, scale 1:10,000,000,21 p.
McKelvey, V.E., Wright, N. A., and Bowen, R.W., 1983, Analysis of the world distribution of metal-rich manganese nodules: U.S. Geological Survey Circular 886, 55 p.
McKelvey, V£., Wright, N.A., and Rowland, R.W., 1979, Manganese nodule resources in the northeastern equatorial Pacific, in Bischoff, J.L., and Piper, D.Z., eds., Marine geology and oceanography of the Pacific manganese nodule province: New York, Plenum Press, p. 747-762.
Mero, J.L., 1959, A preliminary report on the economics of mining and processing deep-sea manganese nodules: Berkeley, University of California Mineral Technology Institute of Marine Research, 96 p.
Mero, J.L., 1965, The mineral resources of the sea: Amsterdam, Elsevier Publishing Company, 312 p.
Meylan, M.A., Glasby, G.P., McDougal, J.C., and Singleton, R.J., 1978, Manganese nodules and associated sediments from the Samoan Basin and Passage: New Zealand Oceanographic Institute Oceanographic Field Report no. 11,61 p.
Minehan, PJ., 1989, The occurrences and identification of economic detrital minerals associated with alluvial gold mining in New Zealand, in Kear, David, ed., Mineral deposits of New Zealand: Australasian Institute of Mining and Metallurgy Monograph 13, p. 159-167.
Murray, J., and Renard, A.F., 1891, Report on deep-sea deposits based on the specimens collected during the voyage of H.M.S. Challenger in the years 1872 to 1876, in Thomson, C.W., and Murray, J., eds., Report on the scientific results of the voyage of H.M.S. Challenger during the years 1872-1876: New York, Johnson Reprint Corporation, p. 8-147.
Nautilau Group, 1990, Hydrothermal activity in the Lau Basin: first results from the Nautilau Cruise: EOS, v. 71, no. 18, May 1,1990, p. 678.
Noakes, L.C., 1970, Mineral resources offshore with special reference to Australia: Australian Mineral Industry Quarterly Review, v. 23, no. 2, p. 51-52.
Noakes, L.C., and Jones, H.A., 1975, Mineral resources offshore, in Knight, C.L., ed., Economic geology of Australia and Papua New Guinea: Australasian Institute of Mining and Metallurgy, Monograph 5, p. 1093-1106.
Palfreyman, W.D., chair, 1988, Geologic map of the circum-Pacific region, southwest quadrant: Houston, Circum-Pacific Council for Energy and Mineral Resources, scale 1:10,000,000, 37 p.
Piper, D.Z., and Swint, T.R., 1984, Distribution of ferromanganese nodules in the Pacific Ocean [abstract]: International Geological Congress, 27th, Moscow, 1984 [Proceedings], v. 3, p. 64.
Piper, D.Z., Swint-Iki, T.R., and McCoy, F.W., 1987, Distribution of ferromanganese nodules in the Pacific Ocean: Chemica Erde, v. 46, p. 171-184.
Piper, D.Z., and Williamson, M.E., 1977, Composition of Pacific Ocean ferromanganese nodules: Marine Geology, v. 23, p. 285-303.
Piper, D.Z., and others, 1985, Manganese nodules, seafloor sediment, and sedimentation rates map of the Circum-Pacific region, Pacific basin: Tulsa, Oklahoma, American Association of Petroleum Geologists, scale 1:17,000,000.
Rawson, M.C., and Ryan, W.B.F., 1978, Ocean floor sediment and polymetallic nodules: Palisades, New York, Lamont-Doherty Earth Observatory, Columbia University, scale 1:23,230,300.
Riech, V., Kudrass, H.-R., and Wiedicke, M., 1982, Heavy minerals of the east Australian shelf sediments between Newcastle and Eraser Island: Geologisches Jahrbuch, Reihe D, Heft 56, p. 179-195.
Sleep, N.H., and Wolery, T.J., 1978, Egress of hot water from mid-ocean ridge hydrothermal systems: some thermal constraints: Journal of Geophysical Research, v. 83, p. 5913-5922.
8MB, 1990, Gold found in Lau backarc sulfides: EOS, v. 71, no. 38, September 18,1990, p. 1083.
Sorem, R.K., and Fewkes, R.H., 1979, Manganese nodules; research data and methods of investigation: New York, Plenum Press, 723 p.
Spiess, F.N., and others, 1980, East Pacific Rise: hot springs and geophysical experiments: Science, v. 207, p. 1421-1432.
Sprague, D.W., 1970, Geology of offshore ironsand deposit, west coast, North Island, New Zealand: New Zealand Mines Division, Open-File Report 12/46/1061.
Stokes, S., Nelson, C.S., Healy, T.R., and MacArthur, N.A., 1989, The Taharoa ironsand deposit, in Kear, David, ed., Mineral deposits of New Zealand: Australasian Institute of Mining and Metallurgy Monograph 13, p. 105-110.
Stuben, D., and others, 1992, First results of study of sulphur-rich hydrothermal activity from an island-arc environment: Esmeralda Bank in the Mariana Arc: Marine Geology, v. 103, p. 521-528.
Turner, C.C., Eade, J.V., Danitofea, S., and Oldnall, R., 1977, Gold-bearing sediments on the continental shelf, northern Guadalcanal, Solomon Islands: South Pacific Marine Geological Notes, v. 1, no. 6, p. 55-69.
Utting, B.S., 1989, Offshore minerals, in Kear, David, ed., Mineral deposits of New Zealand: Australasian Institute of Mining and Metallurgy Monograph 13, p. 207-210.
31

Von Damm, K.L., Edmond, J.M., and Grant, B., 1985a, Chemistry of submarine hydrotbermal solutions at Guaymas Basin, Gulf of California: Geochimica et Cosmochimica Acta, v. 49, p. 2221-2237.
Von Damm, K.L., Edmond, J.M., Grant, B., Measures, C.I., Walden, B., and Weiss, R.F., 1985b, Chemistry of submarine hydrothennal solutions at 21 °N, East Pacific Rise: Geochimica et Cosmochimica Acta, v. 49, p. 2197-2220.
Von der Borch, C.C., 1970, Phosphatic concretions and nodules from the upper continental slope, northern New South Wales: Scripps Institution of Oceanography Contributions, v. 40, p. 1739- 1747.
Von Stackelberg, Ulrich, 1982, Heavy-mineral explor ation of the East Australian Shelf Sonne Cruise SO-15, 1980: Geologisches Jahrbuch, Reihe D, Heft 56,215 p.
Von Stackelberg, Ulrich, and Von Rad, Ulrich, eds., 1990, Geological evolution and hydrothennal activity in the Lau and North Fiji Basins, southwest Pacific Ocean: results of Sonne Cruise SO-35: Geologisches Jahrbuch, Ad Heft 92, 660 p.
Von Stackelberg, Ulrich, and the shipboard scientific party, 1985, Hydrothennal sulfide deposits in backarc spreading centers in the southwest Pacific: Hannover, Bundesanstalt fur Geowis- senschaften und Rohstoffe, BGR Circular 2,14 p.
Weiss, R.F., and others, 1977, Hydrothermal plumes in the Galapagos Rift: Nature, v. 267, p. 600-603.
Zenkevich, N.L., 1970, Atlas fotografii dna Tikhogo Okeana: Moskva, Izd-vo Nauka, 134 p.
32
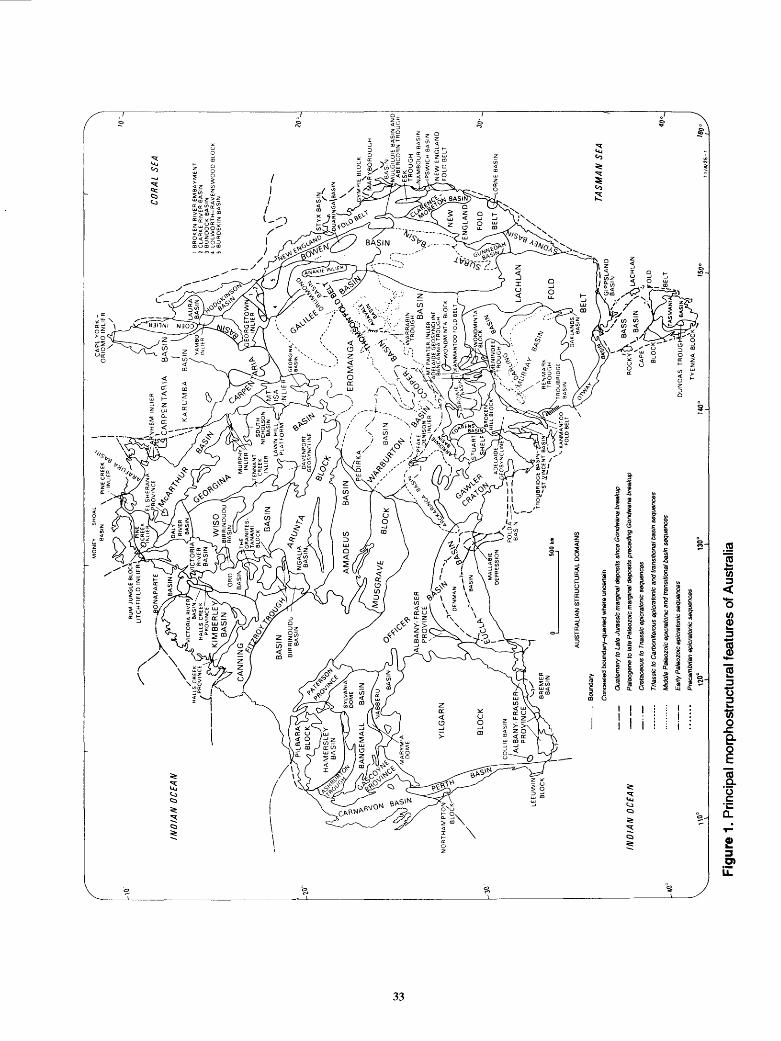
IND
IAN
OC
EA
N
CO
RA
L S
EA
1 B
RO
KE
N
RIV
ER
EM
BA
YM
EN
T2
CL
AR
KE
R
IVE
R B
AS
IN3
BU
ND
OC
K B
AS
IN4
LO
LW
OR
TH
-RA
VE
NS
WO
OD
BLO
CK
5 B
UR
DE
KIN
B
AS
IN
-30'
.DU
AR
I_N
GA
\BA
SIN
\ \
YM
PIE
B
LOC
K
'MAR
YBO
RO
UG
H
BA
SIN
M
ULG
ILO
IE
BA
SIN
AN
DA
BE
RC
OR
N
TR
OU
GH
E
SK
TR
OU
GH
N
AM
BO
UR
B
AS
IN
IPS
WIC
H
BA
SIN
NE
W E
NG
LA
ND
F
OLD
B
ELT
LO
RN
E B
AS
IN
IND
IAN
OC
EA
N
AU
STR
ALI
AN
ST
RU
CT
UR
AL
DO
MA
INS
Bou
ndar
y
Con
ceal
ed b
ound
ary-
quer
ied
whe
re u
ncer
tain
Qua
tern
ary
to L
ate
Jura
ssic
mar
gina
l dep
osits
sin
ce G
ondw
ana
brea
kup
Pal
eoge
ne to
late
Pal
eozo
ic m
argi
nal d
epos
its p
rece
ding
Gon
dwan
a br
eaku
p
Cre
tace
ous
to T
nass
ic e
picr
aton
ic s
eque
nces
Trla
ssic
to C
arbo
nife
rous
epi
crat
onic
and
tran
sitio
nal b
asin
seq
uenc
es
Mid
dle
Pal
eozo
ic e
picr
aton
ic a
nd tr
ansi
tiona
l bas
in s
eque
nces
Ear
ly P
aleo
zoic
epi
crat
onic
seq
uenc
es
Pro
cam
bria
n ep
icra
toni
c se
quen
ces
«0
° 13
0°
TA
SM
AN
SE
A
DU
ND
AS
T
RO
UG
TY
EN
NA
B
LOC
"
(FO
LD IS
O"
160°
Figu
re 1
. P
rinci
pal m
orph
ostr
uctu
ral f
eatu
res
of A
ustr
alia
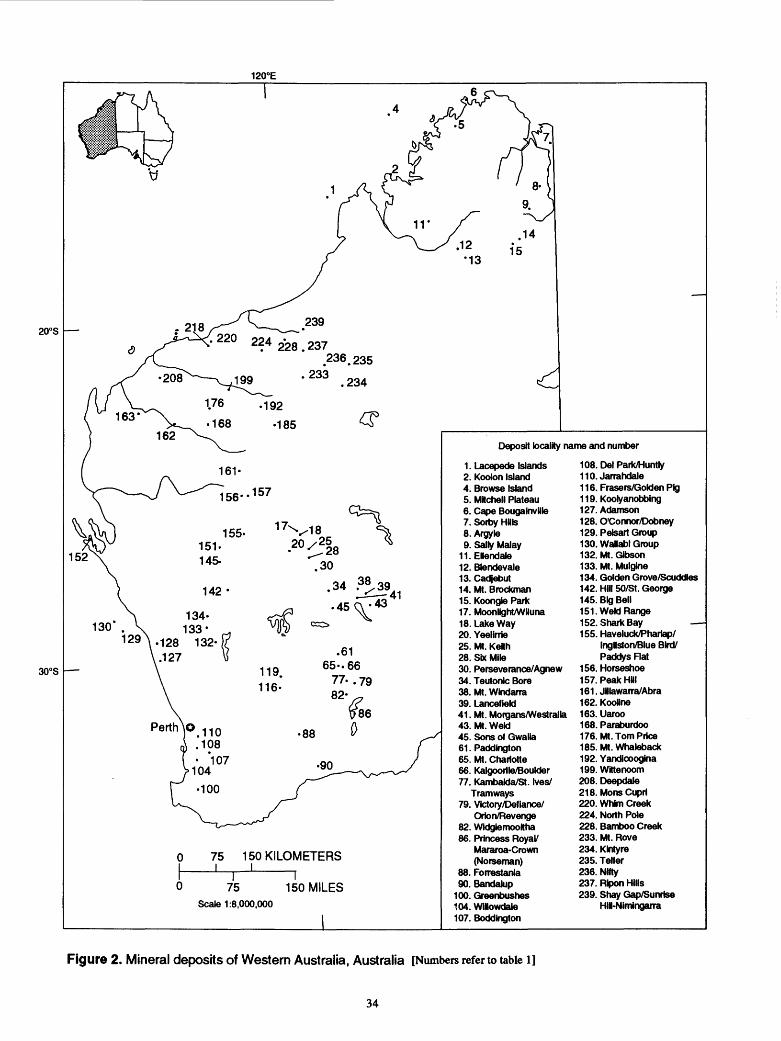
120°E
20°S
30°S
. 2
228 .237.236.235
.234
152
75 150 KILOMETERSi I
150 MILESI
75Scale 1:8,000.000
15
Deposit locality name and number
1. Lacepede Islands2. KooJon Island4. Browse Island5. MMchell Plateau6. Cape Bougainville7. Sorby Hills S.Argyte 9. Sally Malay
11.Elendale12. Btendevale13. Cadjebut14. Mt. Brockman15. Koongie Park17. MoonHght/WHuna18. Lake Way20. Yeelirrie25. Mt. Keith28. Six Mile30. Perseverance/Agnew34. Teutonic Bore38. Mt. Windarra39. Lancefield41. Mt. Morgans/Westralla43. Mt. Weld45. Sons of GwaUa61.Paddington65. Mt. Charlotte66. Kalgoorile/Boulder 77. KambakJa/St. Ives/
Tramways 79. Victory/Defiance/
Orion/Revenge 82. WidgiemooHha 86. Princess Royal/
Mararoa-Crown (Norseman)
88. Forrestania 90. Bandakip
100. Greenbushes 104. Wilowdaie 107. Boddington
108. Del Park/Huntly110.Jarrahdale116. Frasers/GoWenPig119. Koolyanobbing127. Adamson128.0'Cormor/Dobney129. Peteart Group130. Wallabl Group132. Mt. Gibson133. Mt. Mulgine134. Golden Grove/Scuddtes 142. HIH 50/St. George 145. Big Bell151. Weld Range152. Shark Bay 155. Haveluck/Phartap/
IngHston/Blue Bird/ Paddys Rat
156. Horseshoe157. Peak Hill161.JHIawarra/Abra162. KooHne163. Uaroo 168. Paraburdoo 176. Mt. Tom Price 185. Mt. Whateback 192. Yandicoogina 199. Wittenoom 208. Deepdate 218. MonsCupri 220. WNm Creek 224. North Pole 228. Bamboo Creek233. Mt. Rove234. Klntyre235. Tetter236. Nifty237. Ripon Hills 239. Shay Gap/Sunrise
HII-Nimingarra
Figure 2. Mineral deposits of Western Australia, Australia [Numbers refer to table 1]
34
140°E 150°E
10°S
20°S
Deposit locality name and number
1. Aurukun 3. Weipa9. Raine Island
10. Palmer River11. Dianne 17. Mt. Carbine 22. Red Dome26. Wolfram Camp27. Bamford Hill 29. Herberton 34. Maureen41.Kidston42. Balcooma 44. Greenvale 46. Kangaroo Hills/Ewan53. Charters Towers54. Mt. Leyshon56. Thalanga57. Liontown 59. Pajingo62. Holbourne Island63. Wirralie64. Mt. Coolon
62
66. Anakie 74. Mt. Chalmers 76. Mt. Morgan 85. Cracow88. Lady Elliot Island89. Mt. Rawdon92. Fraser Island94. Gympie
102. Yowah-Black Gate 110. Opalton-Mayneside112. Phosphate Hill113. Starra 117,118. Mt. Isa119. Hilton120. Dugald River125. LadyLoretta126. Lady Annie127. D Tree128. Lady Jane129. Mt. Oxide131. Croydon132. Westmoreland
75 150 KILOMETERS I I____
0 75 150 MILES
Scale 1:8,000,000
88
Figure 3. Mineral deposits of Queensland, Australia [Numbers refer to table 2]
35
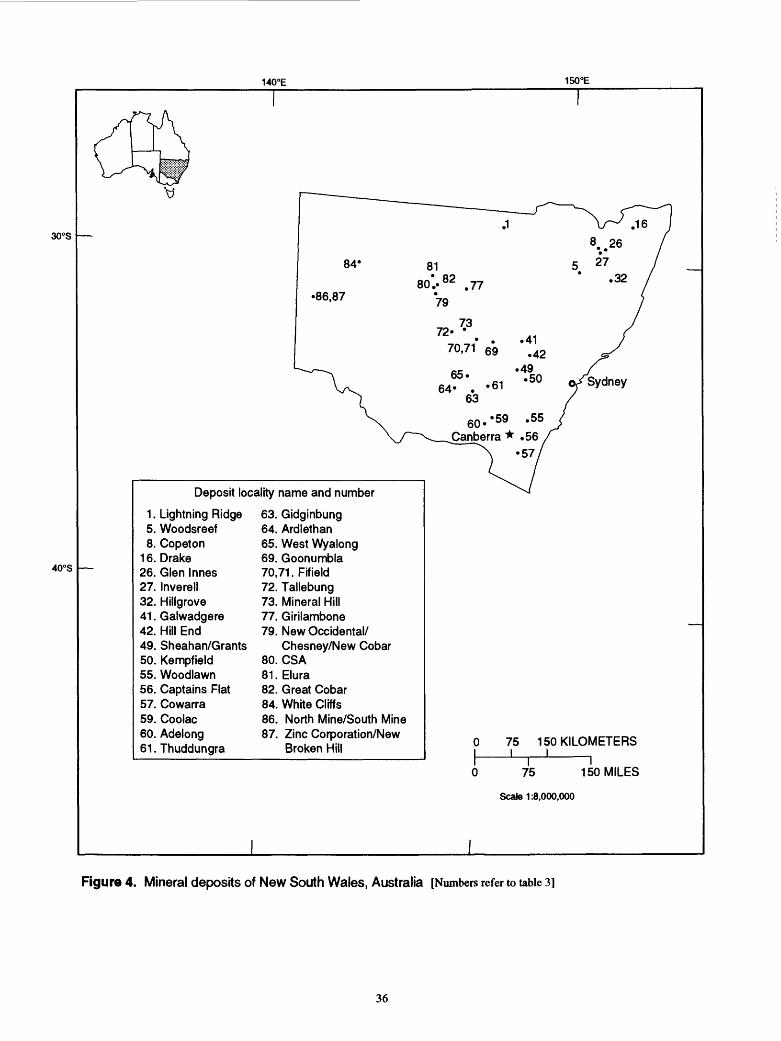
140°E 150°E
30°S
40°S
Sydney
Deposit locality name and number
1. Lightning Ridge 5. Woodsreef 8. Copeton
16. Drake26. Glen Innes27. Inverell 32. Hillgrove41. Galwadgere42. Hill End49. Sheahan/Grants50. Kempfield55. Woodlawn56. Captains Flat57. Cowarra59. Coolac60. Adelong61. Thuddungra
63. Gidginbung64. Ardlethan65. West Wyalong 69. Goonumbla 70,71. Fifield72. Tallebung73. Mineral Hill 77. Girilambone79. New Occidental/
Chesney/New Cobar80. CSA81. Elura82. Great Cobar 84. White Cliffs86. North Mine/South Mine87. Zinc Corporation/New
Broken Hill 75I
150 KILOMETERS
r75
Scale 1:8,000,000
150 MILES
Figure 4. Mineral deposits of New South Wales, Australia [Numbers refer to table 3]
36
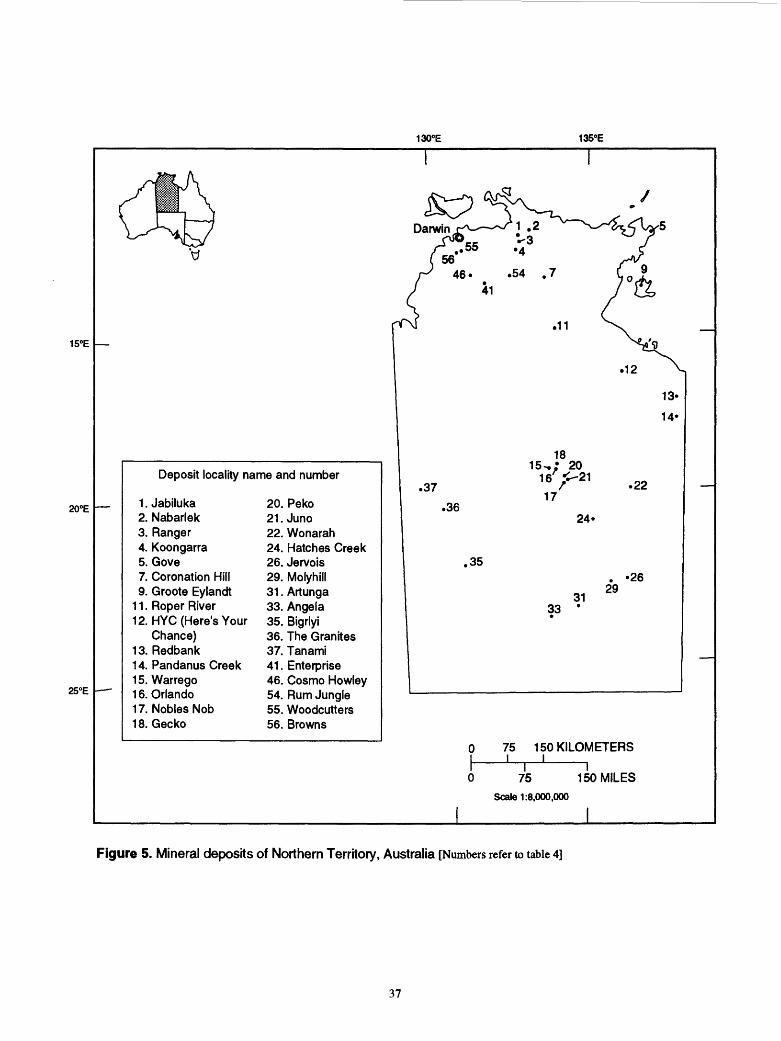
130°E 135°E
15°E
20°E
25°E
Deposit locality name and number
1. Jabiluka2. Nabarlek3. Ranger4. Koongarra5. Gove7. Coronation Hill9. Groote Eylandt
11. Roper River12. HYC (Here's Your
Chance)13. Redbank14. Pandanus Creek15. Warrego16. Orlando17. Nobles Nob18. Gecko
20. Peko21.Juno22. Wonarah 24. Hatches Creek 26. Jervois 29. Molyhill 31. Artunga 33. Angela35. Bigrlyi36. The Granites37. Tanami 41. Enterprise 46. Cosmo Howley54. Rum Jungle55. Woodcutters56. Browns
75 150 KILOMETERSI I____
75 150 MILES
Scale 1:8,000,000
Figure 5. Mineral deposits of Northern Territory, Australia [Numbers refer to table 4]
37
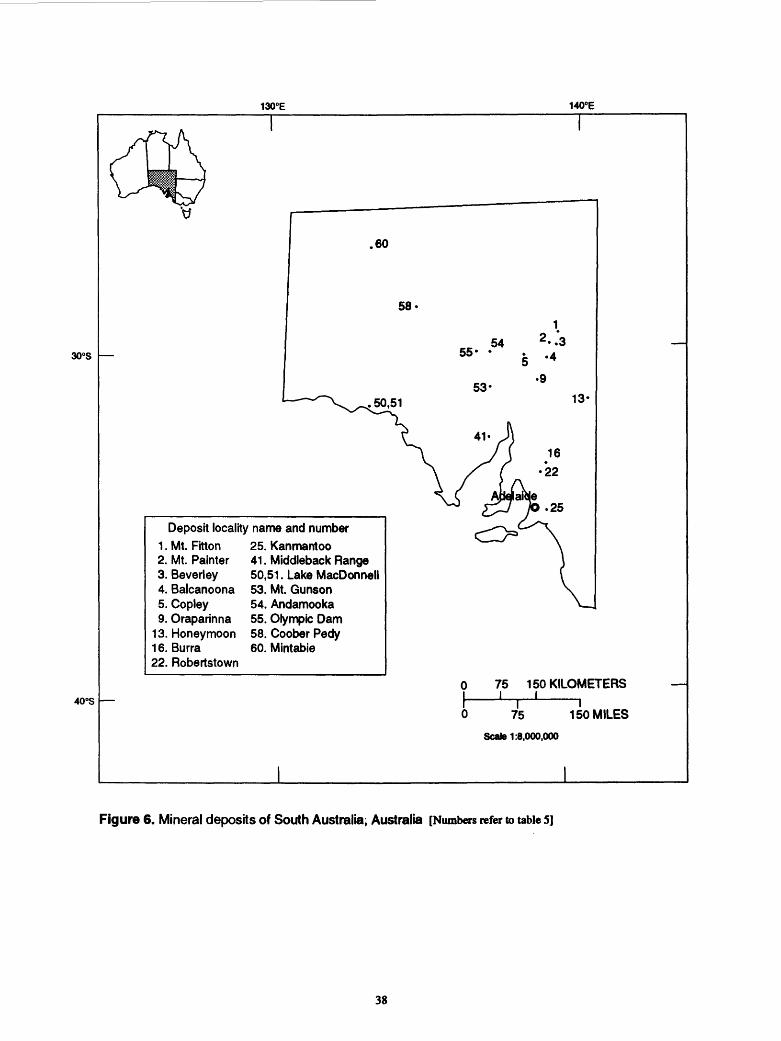
130°E 140°E
30°S
40°S
Deposit locality1.Mt. Fitton2. Mt. Painter3. Beverley4. Balcanoona5. Copley 9. Oraparinna
13. Honeymoon16. Burra22. Robertstown
name and number25. Kanmantoo41. Middleback Range50,51. Lake MacDonnell53. Mt. Gunson54. Andamooka55. Olympic Dam 58. Coober Pedy 60. Mintabie
75 150 KILOMETERS i i____
I 75
Scale 1:8,000,000
150 MILES
Figure 6. Mineral deposits of South Australia; Australia [Numbers refer to table 5]
38
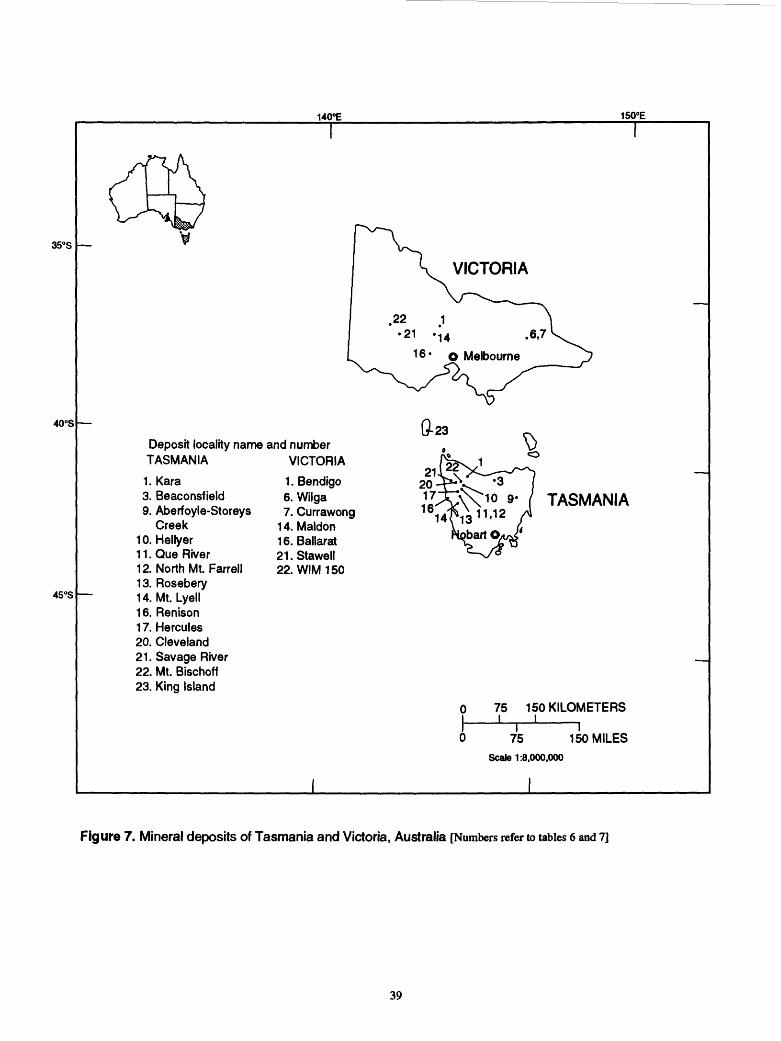
35°S
40°S
45°S
140°E 150°E
VICTORIA
Deposit locality name and number TASMANIA VICTORIA
1. Kara3. Beaconsfield9. Aberfoyle-Storeys
Creek10. Hellyer11. Que River12. North Mt. Farrell13. Rosebery14. Mt. Lyell16. Renison17. Hercules20. Cleveland21. Savage River22. Mt. Bischoff23. King Island
1. Bendigo6. Wilga7. Currawong
14. Maldon 16. Ballarat 21.Stawell 22. WIM150
21 - .6,7
16 * O Melbourne
TASMANIA
75I
150 KILOMETERS
T 75
Scale 1:8,000.000150 MILES
Figure 7. Mineral deposits of Tasmania and Victoria, Australia [Numbers refer to tables 6 and 7]
39
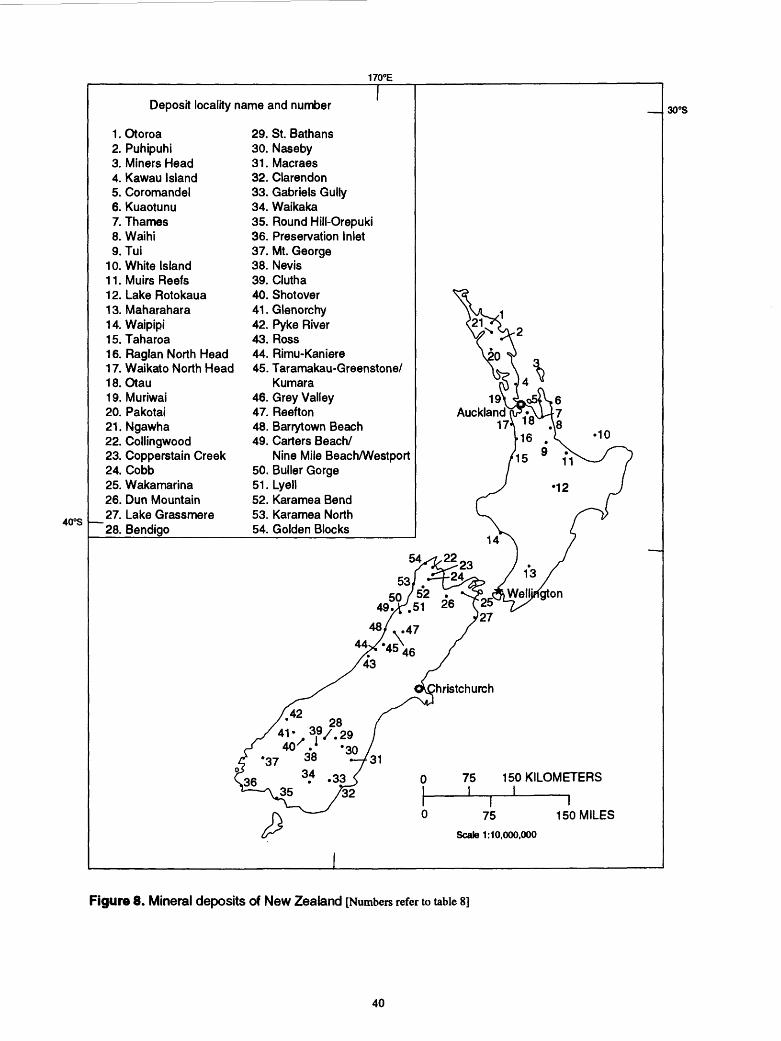
170°E
40°S
Deposit locality name and number
1. Otoroa2. Puhipuhi3. Miners Head4. Kawau Island5. Coromandel6. Kuaotunu7. Thames8. Waihi9. Tui
10. White Island11. Muirs Reefs12. Lake Rotokaua13. Maharahara14. Waipipi15. Taharoa16. Raglan North Head17. Waikato North Head18. Otau19. Muriwai20. Pakotai21. Ngawha22. Collingwood23. Copperstain Creek24. Cobb25. Wakamarina26. Dun Mountain27. Lake Grassmere28. Bendigo______
29. St. Bathans30. Naseby31. Macraes32. Clarendon33. Gabriels Gully34. Waikaka35. Round Hill-Orepuki36. Preservation Inlet37. Mt. George38. Nevis39. Clutha40. Shotover41. Glenorchy42. Pyke River43. Ross44. Rimu-Kaniere45. Taramakau-Greenstone/
Kumara46. Grey Valley47. Reefton48. Barn/town Beach49. Carters Beach/
Nine Mile Beach/Westport50. Buller Gorge51.Lyell52. Karamea Bend53. Karamea North54. Golden Blocks
30°S
hristchurch
75 150 KILOMETERS
I I75 150 MILES
Scale 1:10.000.000
Figure 8. Mineral deposits of New Zealand [Numbers refer to table 8]
40
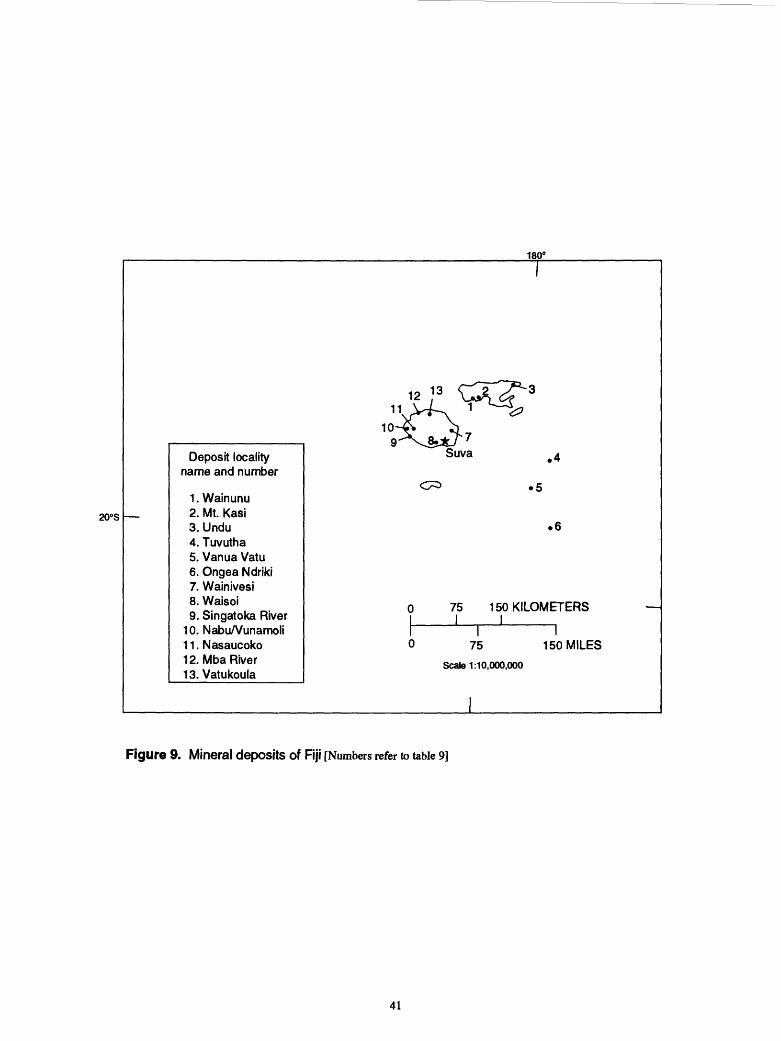
180"
20°S —
12 13
_
Deposit localityname and number
1 . Wainunu2. Mt. Kasi3. Undu4. Tuvutha5. Vanua Vatu6. Ongea Ndriki7. Wainivesi8. Waisoi 9. Singatoka River
10. Nabu/Vunamoli1 1 . Nasaucoko12. Mba River 1 3. Vatukoula
CT ^^-U_f
Suva 4
C^> .5
6
0 75 150 KILOMETERS I I
I I0 75 150 MILES
Scale 1:10,000,000
I
Figure 9. Mineral deposits of Fiji [Numbers refer to table 9]
41
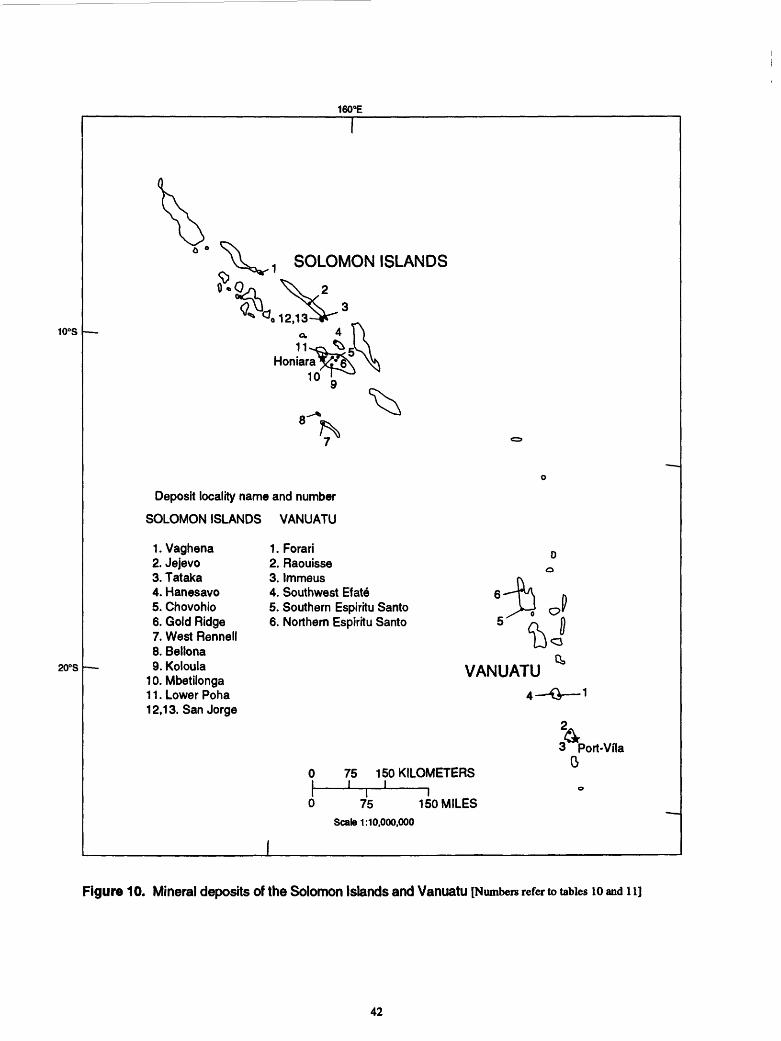
160°E
10°S
20°S
SOLOMON ISLANDS
Deposit locality name and number
SOLOMON ISLANDS VANUATU
1. Vaghena2. Jejevo3. Tataka4. Hanesavo5. Chovohio6. Gold Ridge7. West Rennell8. Bellona9. Koloula
10. Mbetilonga11. Lower Poha 12,13. San Jorge
1. Forari2. Raouisse3. Immeus4. Southwest Elate5. Southern Espirrtu Santo6. Northern Espiritu Santo
VANUATU
75I
150 KILOMETERS
3 Port-VfIa 0
I 75
Scale 1:10.000,000150 MILES
Figure 10. Mineral deposits of the Solomon Islands and Vanuatu [Numbers refer to tables 10 and 11]
42
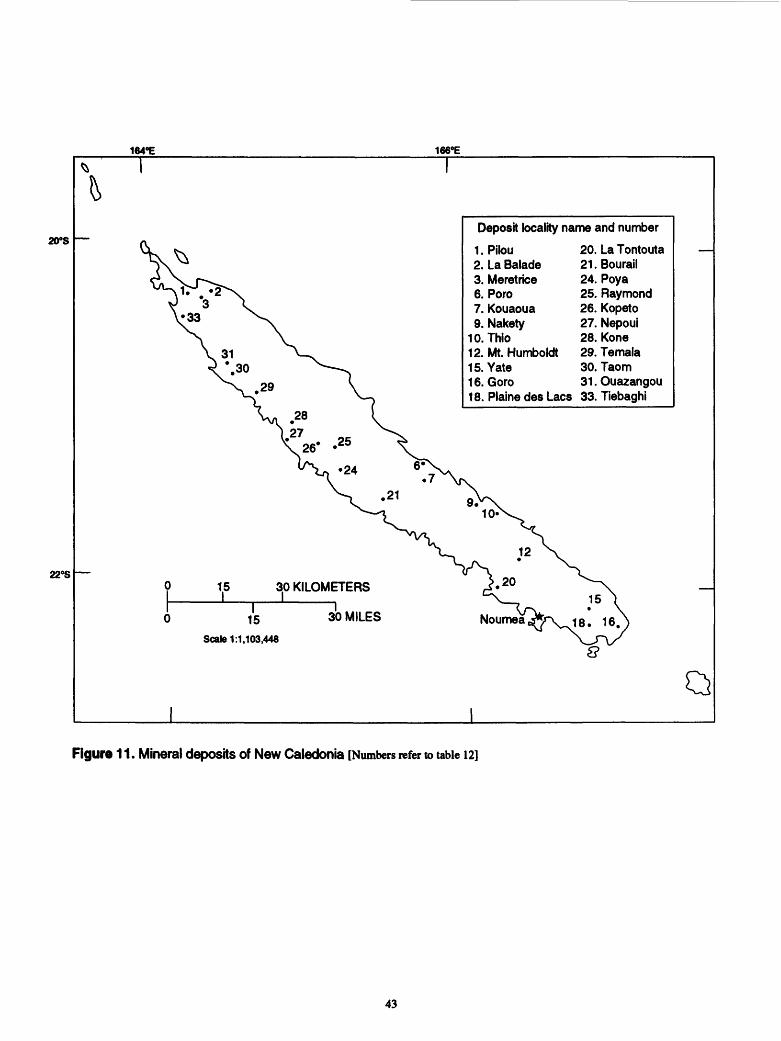
164«E 166°E
20°S
22°S
Deposit locality name and number
LPilou2. La Balade3. Meretrice6. Poro7. Kouaoua9. Nakety
10.Thio12. Mt. Humboldt15.Yate16. Goro18. Plaine des Lacs
20. La Tontouta21. Bourail24. Poya25. Raymond26. Kopeto27. Nepoui28. Kone29. Temala30. Taom31. Ouazangou 33. Tiebaghi
15 30 KILOMETERS
I 15
Scale 1:1,103,448
30 MILES Noumea,
Figure 11. Mineral deposits of New Caledonia [Numbers refer to table 12]
43
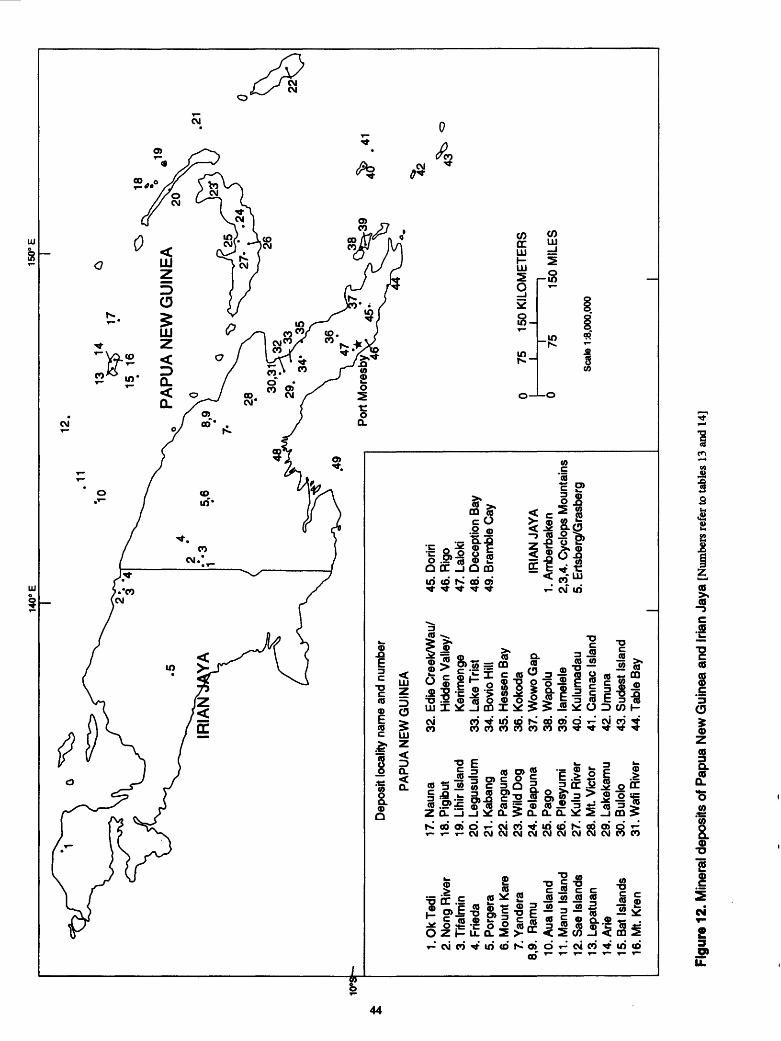
140"
E15
0° E
12.
10°S
-
LO
kTedi
2. N
ong
Riv
er3.
Tifa
lmin
4. F
rieda
5. P
orge
ra6.
Mou
nt K
are
7. Y
ande
ra
8,9.
Ram
u10
. Aua
Isla
nd11
. Man
u Is
land
12. S
ae I
slan
ds13
. Lep
atua
n U
.Arie
15. B
at I
slan
ds16
. Mt.
Kren
13
14
18
PA
PU
A N
EW
GU
INE
A
Dep
osit
loca
lity
nam
e an
d nu
mbe
r
PA
PU
A N
EW
GU
INE
A
17. N
auna
18. P
igib
ut19
. Lih
ir Is
land
20. L
egus
ulum
21. K
aban
g22
. P
angu
na23
. Wild
Dog
24.
Pel
apun
a25
. Pa
go26
. P
lesy
umi
27. K
ulu
Riv
er28
. Mt.
Vic
tor
29. L
akek
amu
30. B
ulol
o31
. Waf
i Riv
er
32.
Edie
Cre
ek/W
au/
Hid
den
Val
ley/
K
erim
enge
33.
Lake
Tris
t34
. B
ovio
Hill
35.
Hes
sen
Bay
36.
Kok
oda
37. W
owo
Gap
38. W
apol
u39
. la
mel
ele
40.
Kul
umad
au41
. Can
nae
Isla
nd42
. U
mun
a43
. Sud
est
Isla
nd44
. Tab
le B
ay
45.
Dor
iri46
. R
igo
47. L
alok
i48
. D
ecep
tion
Bay
49. B
ram
ble
Cay
IRIA
N J
AV
A
1. A
mbe
rbak
en
2,3,
4. C
yclo
ps M
ount
ains
5.
Erts
berg
/Gra
sber
g
43^
75
150
KIL
OM
ET
ER
SI
i _
__ 15
0 M
ILE
SI 75
Scal
e 1:
8,00
0,00
0
Figu
re 1
2. M
iner
al d
epos
its o
f Pap
ua N
ew G
uine
a an
d Iri
an J
aya
[Num
bers
refe
r to
table
s 13
and
14]
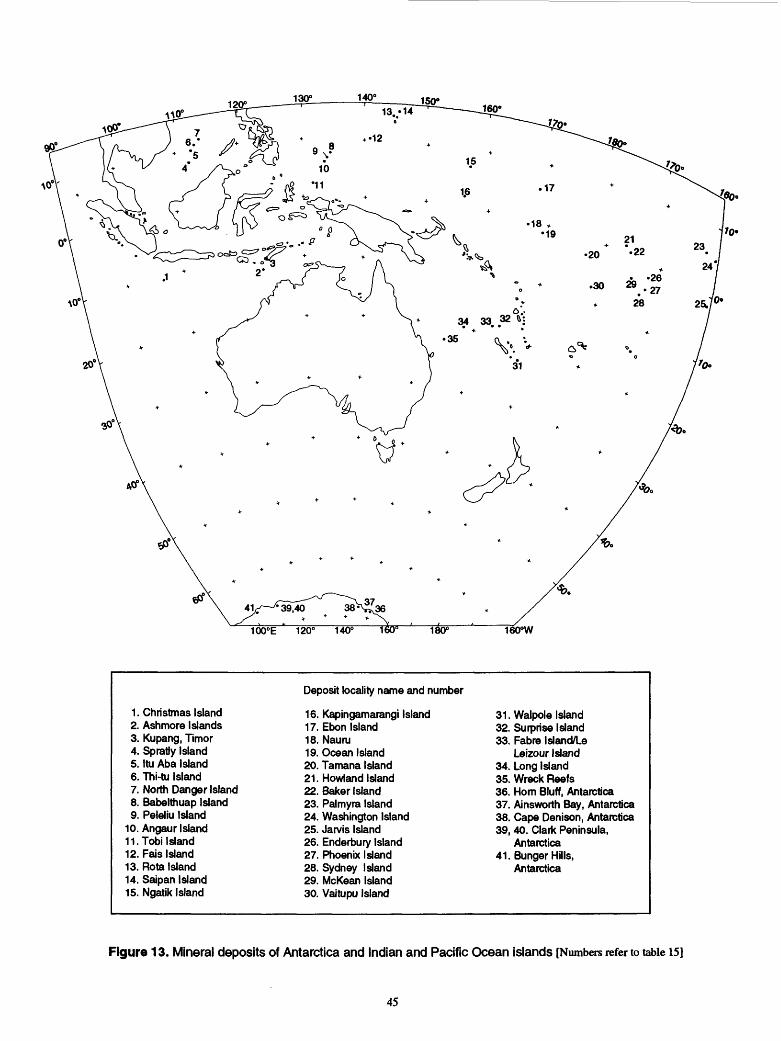
'0.
100°E 120° 140° 180° 160°W
1. Christmas Island2. Ashmore Islands3. Kupang, Timor4. Spratiy Island5. Itu Aba Island6. Thi-tu Island7. North Danger Island8. Babelthuap Island9. Peleliu Island
10. Angaur Island11. Tobi Island12. Fais Island13. Rota Island14. Saipan Island15. Ngatik Island
Deposit locality name and number
16. Kapingamarangi Island17. Ebon Island18. Nauru19. Ocean Island20. Tamana Island21. Rowland Island22. Baker Island23. Palmyra Island24. Washington Island25. Jarvis Island26. Enderbury Island27. Phoenix Island28. Sydney Island29. McKean Island30. Vaitupu Island
31. Walpole Island32. Surprise Island33. Fabre Island/Le
Leizour Island34. Long Island35. Wreck Reefs36. Horn Bluff, Antarctica37. Ainsworth Bay, Antarctica38. Cape Denison, Antarctica39. 40. Clark Peninsula,
Antarctica 41. Bunger Hills,
Antarctica
Figure 13. Mineral deposits of Antarctica and Indian and Pacific Ocean islands [Numbers refer to table 15]
45
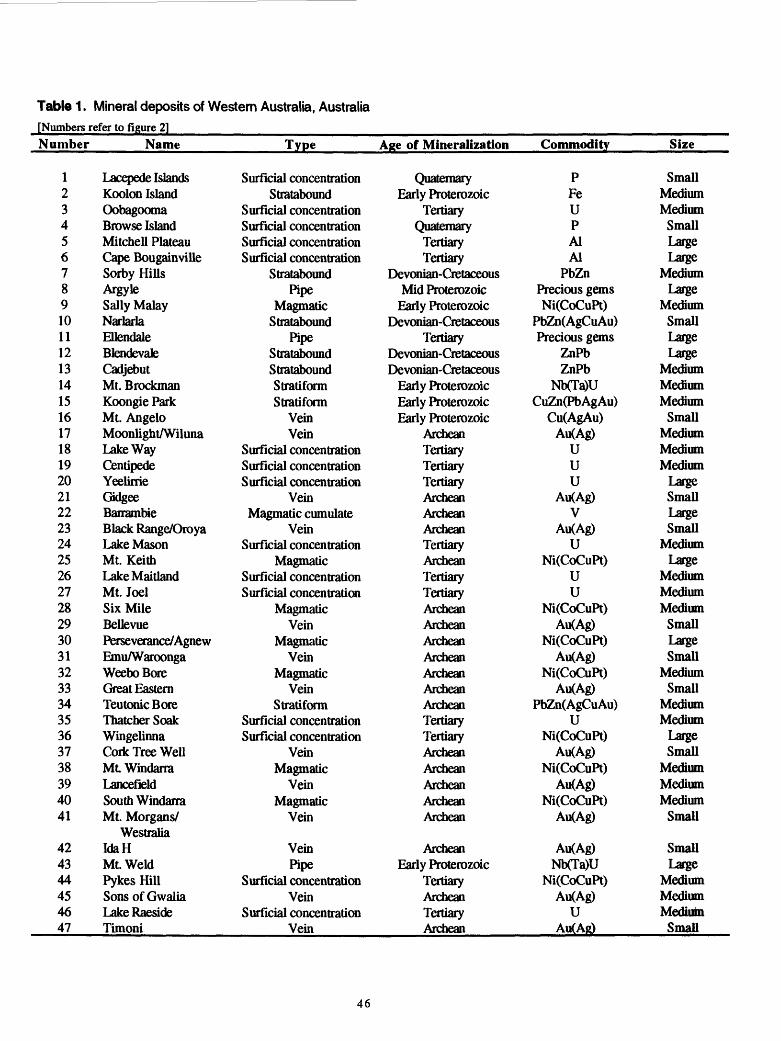
Table 1 . Mineral deposits of Western Australia, Australia[Numbers refer to figure 2]Number
1234567891011121314151617181920212223242526272829303132333435363738394041
424344454647
Name
Lacepede IslandsKoolon IslandOobagoomaBrowse IslandMitchell PlateauCape BougainvilleSorby HillsArgyleSally MalayNarlarlaEllendaleBlendevateCadjebutMt. BrockmanKoongie ParkMt. AngeloMoonlight/WilunaLake WayCentipedeYeelirrieGidgeeBarrambieBlack Range/OroyaLake MasonMt. KeithLake MaitlandMt. JoelSix MileBellevuePerseverance/AgnewEmu/WaroongaWeeboBoreGreat EasternTeutonic BoreThatcherSoakWingelinnaCork Tree WellMt. WindarraLancefieldSouth WindarraMt. Morgans/
WestraliaIdaHMt. WeldPykes HillSonsofGwaliaLakeRaesideTimoni
Type
Surficial concentrationStratabound
Surficial concentrationSurficial concentrationSurficial concentrationSurficial concentration
StrataboundPipe
MagmaticStratabound
PipeStrataboundStrataboundStratiformStratiform
VeinVein
Surficial concentrationSurficial concentrationSurficial concentration
VeinMagmatic cumulate
VeinSurficial concentration
MagmaticSurficial concentrationSurficial concentration
MagmaticVein
MagmaticVein
MagmaticVein
StratiformSurficial concentrationSurficial concentration
VeinMagmatic
VeinMagmatic
Vein
VeinPipe
Surficial concentrationVein
Surficial concentrationVein
Age of Mineralization
QuaternaryEarly Proterozoic
TertiaryQuaternary
TertiaryTertiary
Devonian-CretaceousMid Proterozoic
Early ProterozoicDevonian-Cretaceous
TertiaryDevonian-CretaceousDevonian-Cretaceous
Early ProterozoicEarly ProterozoicEarly Proterozoic
ArcheanTertiaryTertiaryTertiaryArcheanArcheanArcheanTertiaryArcheanTertiaryTertiaryArcheanArcheanArcheanArcheanArcheanArcheanArcheanTertiaryTertiaryArcheanArcheanArcheanArcheanArchean
ArcheanEarly Proterozoic
TertiaryArcheanTertiaryArchean
Commodity
PFeUPAlAl
PbZnPrecious gemsNi(CoCuPt)
PbZn(AgCuAu)Precious gems
ZnPbZnPb
Nb(Ta)UCuZn(PbAgAu)
Cu(AgAu)Au(Ag)
UUU
Au(Ag)V
Au(Ag)U
Ni(CoCuPt)UU
Ni(CoCuPt)Au(Ag)
Ni(CoCuPt)Au(Ag)
Ni(CoCuPt)Au(Ag)
PbZn(AgCuAu)U
Ni(CoCuPt)Au(Ag)
Ni(CoCuPt)Au(Ag)
Ni(CoCuPt)Au(Ag)
AuCAg)Nb(Ta)U
Ni(CoCuPt)Au(Ag)
UAu(Ag)
Size
SmallMediumMedium
SmallLargeLarge
MediumLarge
MediumSmallLargeLarge
MediumMediumMedium
SmallMediumMediumMedium
LargeSmallLargeSmall
MediumLarge
MediumMediumMedium
SmallLargeSmall
MediumSmall
MediumMedium
LargeSmall
MediumMediumMedium
Small
SmallLarge
MediumMediumMedium
Small
46
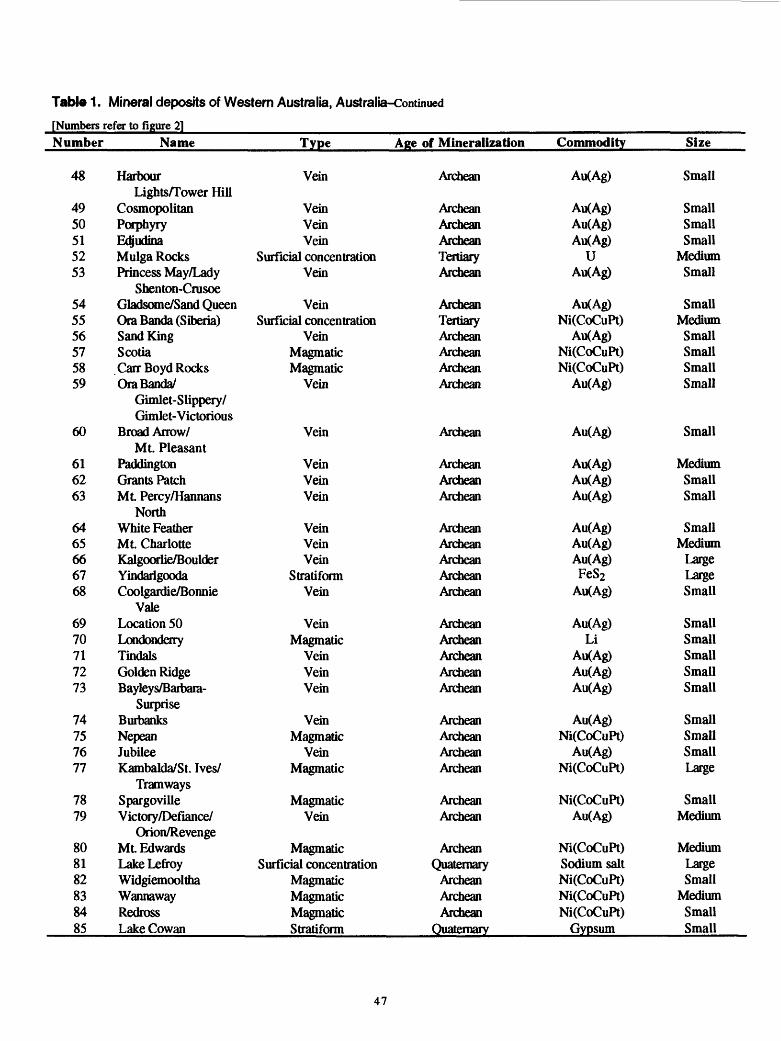
Table 1 . Mineral deposits of Western Australia, Australia-Continued
[Numbers refer to figure 2]Number
48
4950515253
545556575859
60
616263
6465666768
6970717273
74757677
7879
808182838485
Name
HarbourLightsA'ower Hill
CosmopolitanPorphyryEdjudinaMulga RocksPrincess May/Lady
Sbenton-CrusoeGladsome/Sand QueenOraBanda (Siberia)Sand KingScotiaCarr Boyd RocksOraBanda/
Gimlet-Slippery/Gimlet- Victorious
Broad Arrow/Mt. Pleasant
PaddingtonGrants PatchMt. Percy/Hannans
NorthWhite FeatherMt. CharlotteKalgoorlie/BoulderYindarlgoodaCoolgardie/Bonnie
ValeLocation 50LondonderryTindalsGolden RidgeBayleys/Barbara-
SurpriseBurbanksNepeanJubileeKambalda/St. Ives/
TramwaysSpargovilleVictory/Defiance/
Orion/RevengeMt. EdwardsLakeLefiroyWidgiemoolthaWannawayRedrossLake Cowan
Type
Vein
VeinVeinVein
Surficial concentrationVein
VeinSurficial concentration
VeinMagmaticMagmatic
Vein
Vein
VeinVeinVein
VeinVeinVein
StratiformVein
VeinMagmatic
VeinVeinVein
VeinMagmatic
VeinMagmatic
MagmaticVein
MagmaticSurficial concentration
MagmaticMagmaticMagmaticStratiform
Age of Mineralization
Archean
ArcheanArcheanArcheanTertiaryArchean
ArcheanTertiaryArcheanArcheanArcheanArchean
Archean
ArcheanArcheanArchean
ArcheanArcheanArcheanArcheanArchean
ArcheanArcheanArcheanArcheanArchean
ArcheanArcheanArcheanArchean
ArcheanArchean
ArcheanQuaternary
ArcheanArcheanArchean
Quaternary
Commodity
Au(Ag)
Au(Ag)Au(Ag)Au(Ag)
UAu(Ag)
AuCAg)Ni(CoCuPt)
Au(Ag)Ni(CoCuPt)Ni(CoCuPt)
Au(Ag)
Au(Ag)
Au(Ag)Au(Ag)Au(Ag)
Au(Ag)Au(Ag)Au(Ag)FeS2
Au(Ag)
Au(Ag)Li
Au(Ag)Au(Ag)Au(Ag)
Au(Ag)Ni(CoCuPt)
Au(Ag)Ni(CoCuPt)
Ni(CoCuPt)Au(Ag)
Ni(CoCuPt)Sodium saltNi(CoCuPt)Ni(CoCuPt)Ni(CoCuPt)
Gypsum
Size
Small
SmallSmallSmall
MediumSmall
SmallMediumSmallSmallSmallSmall
Small
MediumSmallSmall
SmallMedium
LargeLargeSmall
SmallSmallSmallSmallSmall
SmallSmallSmallLarge
SmallMedium
MediumLargeSmall
MediumSmallSmall
47
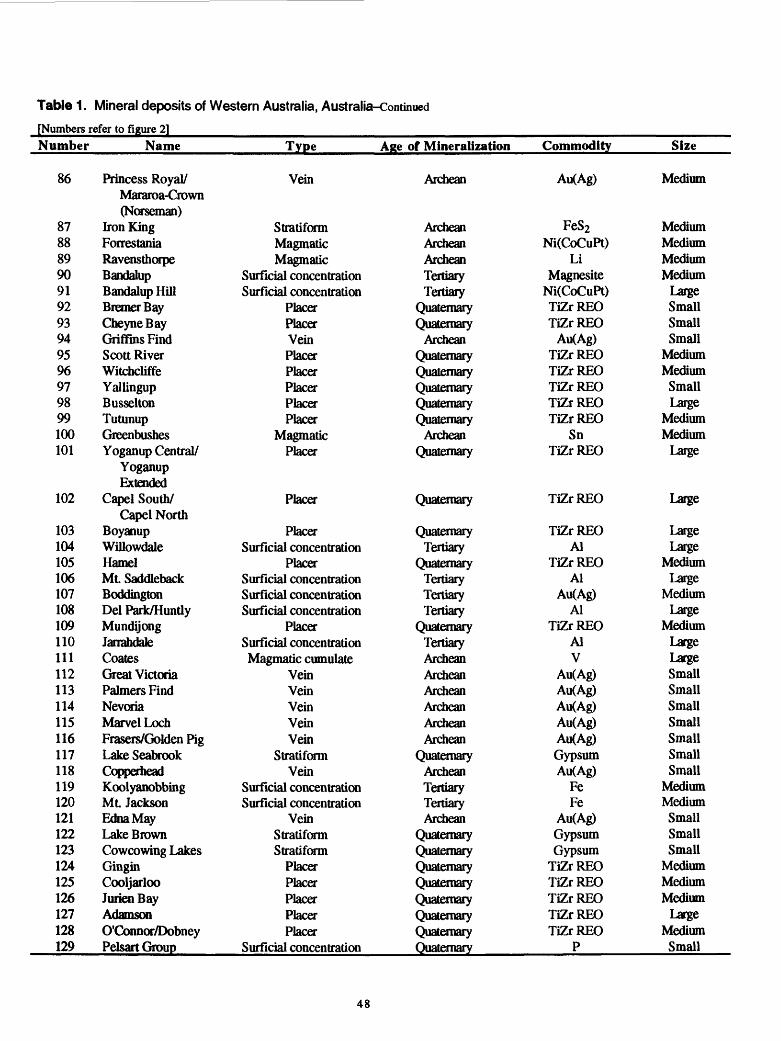
Table 1. Mineral deposits of Western Australia, Australia-Continued
[Numbers refer to figure 2]Number
86
87888990919293949596979899100101
102
103104105106107108109110111112113114115116117118119120121122123124125126127128129
Name
Princess Royal/Mararoa-Crown(Norseman)
Iron KingForrestaniaRavensthorpeBandalupBandalup HillBremerBayCheyne BayGriffins FindScott RiverWitchcliffeYallingupBusseltonTutunupGreenbushesYoganup Central/
YoganupExtended
Capel South/Capel North
BoyanupWillowdaleHamelMt SaddlebackBoddingtonDel Park/HuntlyMundijongJanahdaleCoatesGreat VictoriaPalmers FindNevoriaMarvel LochFrasers/Golden PigLakeSeabrookCopperheadKoolyanobbingMt JacksonEdna MayLake BrownCowcowing LakesGinginCooljarlooJurienBayAdamsonO'Connor/DobneyPelsart Group
Type
Vein
StratiformMagmaticMagmatic
Surficial concentrationSurficial concentration
PlacerPlacerVeinPlacerPlacerPlacerPlacerPlacer
MagmaticPlacer
Placer
PlacerSurficial concentration
PlacerSurficial concentrationSurficial concentrationSurficial concentration
PlacerSurficial concentrationMagmatic cumulate
VeinVeinVeinVeinVein
StratiformVein
Surficial concentrationSurficial concentration
VeinStratiformStratiform
PlacerPlacerPlacerPlacerPlacer
Surficial concentration
Age of Mineralization
Archean
ArcheanArcheanArcheanTertiaryTertiary
QuaternaryQuaternary
ArcheanQuaternaryQuaternaryQuaternaryQuaternaryQuaternary
ArcheanQuaternary
Quaternary
QuaternaryTertiary
QuaternaryTertiaryTertiaryTertiary
QuaternaryTertiaryArcheanArcheanArcheanArcheanArcheanArchean
QuaternaryArcheanTertiaryTertiaryArchean
QuaternaryQuaternaryQuaternaryQuaternaryQuaternaryQuaternaryQuaternaryQuaternary
Commodity
Au(Ag)
FeS2Ni(CoCuPt)
LiMagnesite
Ni(CoCuPt)TiZrREOTiZrREO
Au(Ag)TiZrREOTiZrREOTiZrREOTiZrREOTiZrREO
SnTiZrREO
TiZrREO
TiZrREOAl
TiZrREOAl
Au(Ag)Al
TiZrREOAlV
Au(Ag)Au(Ag)Au(Ag)Au(Ag)AiKAg)GypsumAu(Ag)
FeFe
Au(Ag)GypsumGypsum
TiZrREOTiZrREOTiZrREOTiZrREOTiZrREO
P
Size
Medium
MediumMediumMediumMedium
LargeSmallSmallSmall
MediumMediumSmallLarge
MediumMedium
Large
Large
LargeLarge
MediumLarge
MediumLarge
MediumLargeLargeSmallSmallSmallSmallSmallSmallSmall
MediumMedium
SmallSmallSmall
MediumMediumMedium
LargeMedium
Small
48
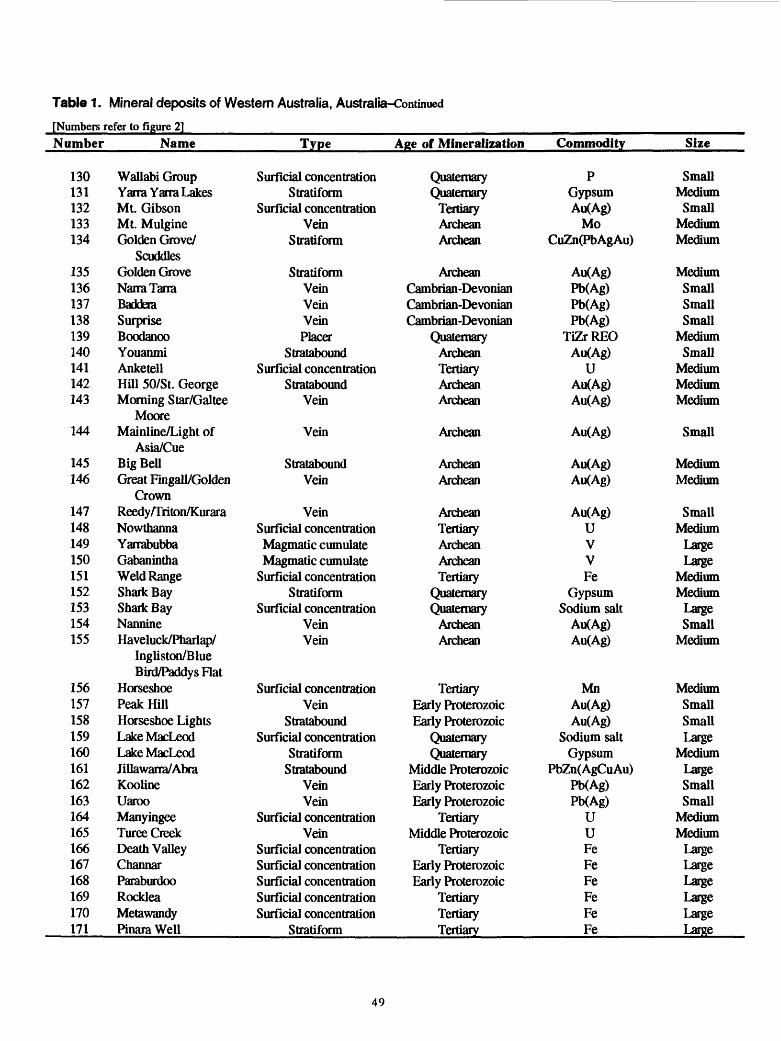
Table 1 . Mineral deposits of Western Australia, Australia-Continued
[Numbers refer to figure 2]Number
130131132133134
135136137138139140141142143
144
145146
147148149150151152153154155
156157158159160161162163164165166167168169170171
Name
Wallabi GroupYarraYarra LakesMt. GibsonMt. MulgineGolden Grove/
ScuddlesGolden GroveNarraTarraBadderaSurpriseBoodanooYouanmiAnketellHill 50/St. GeorgeMorning Star/Galtee
MooreMainline/Light of
Asia/CueBig BellGreat Fingall/Golden
CrownReedy/Triton/KuraraNowthannaYarrabubbaGabaninthaWeld RangeShark BayShark BayNannineHaveluck/Pharlap/
Inglis ton/BlueBird/Paddys Flat
HorseshoePeak HillHorseshoe LightsLakeMacLeodLakeMacLeodJillawarra/AbraKoolineUarooManyingeeTuree CreekDeath ValleyChannarParaburdooRockleaMetawandyPinaraWell
Type
Surficial concentrationStratiform
Surflcial concentrationVein
Stratiform
StratiformVeinVeinVeinPlacer
StrataboundSurflcial concentration
StrataboundVein
Vein
StrataboundVein
VeinSurficial concentrationMagmatic cumulateMagmatic cumulate
Surficial concentrationStratiform
Surficial concentrationVeinVein
Surficial concentrationVein
StrataboundSurficial concentration
StratiformStratabound
VeinVein
Surficial concentrationVein
Surficial concentrationSurficial concentrationSurficial concentrationSurficial concentrationSurficial concentration
Stratiform
Age of Mineralization
QuaternaryQuaternary
TertiaryArcheanArchean
ArcheanCambrian-DevonianCambrian-DevonianCambrian-Devonian
QuaternaryArcheanTertiaryArcheanArchean
Archean
ArcheanArchean
ArcheanTertiaryArcheanArcheanTertiary
QuaternaryQuaternary
ArcheanArchean
TertiaryEarly ProterozoicEarly Proterozoic
QuaternaryQuaternary
Middle ProterozoicEarly ProterozoicEarly Proterozoic
TertiaryMiddle Proterozoic
TertiaryEarly ProterozoicEarly Proterozoic
TertiaryTertiaryTertiary
Commodity
PGypsumAu(Ag)
MoCuZn(PbAgAu)
Au(Ag)Pb(Ag)PKAg)PKAg)
TiZrREOAu(Ag)
UAu(Ag)Au(Ag)
Au(Ag)
Au(Ag)Au(Ag)
Au(Ag)UVVFe
GypsumSodium salt
Au(Ag)Au(Ag)
MnAu(Ag)Au(Ag)
Sodium saltGypsum
PbZn(AgCuAu)Pb(Ag)Pb(Ag)
UUFeFeFeFeFeFe
Size
SmallMedium
SmallMediumMedium
MediumSmallSmallSmall
MediumSmall
MediumMediumMedium
Small
MediumMedium
SmallMedium
LargeLarge
MediumMedium
LargeSmall
Medium
MediumSmallSmallLarge
MediumLargeSmallSmall
MediumMedium
LargeLargeLargeLargeLargeLarge
49
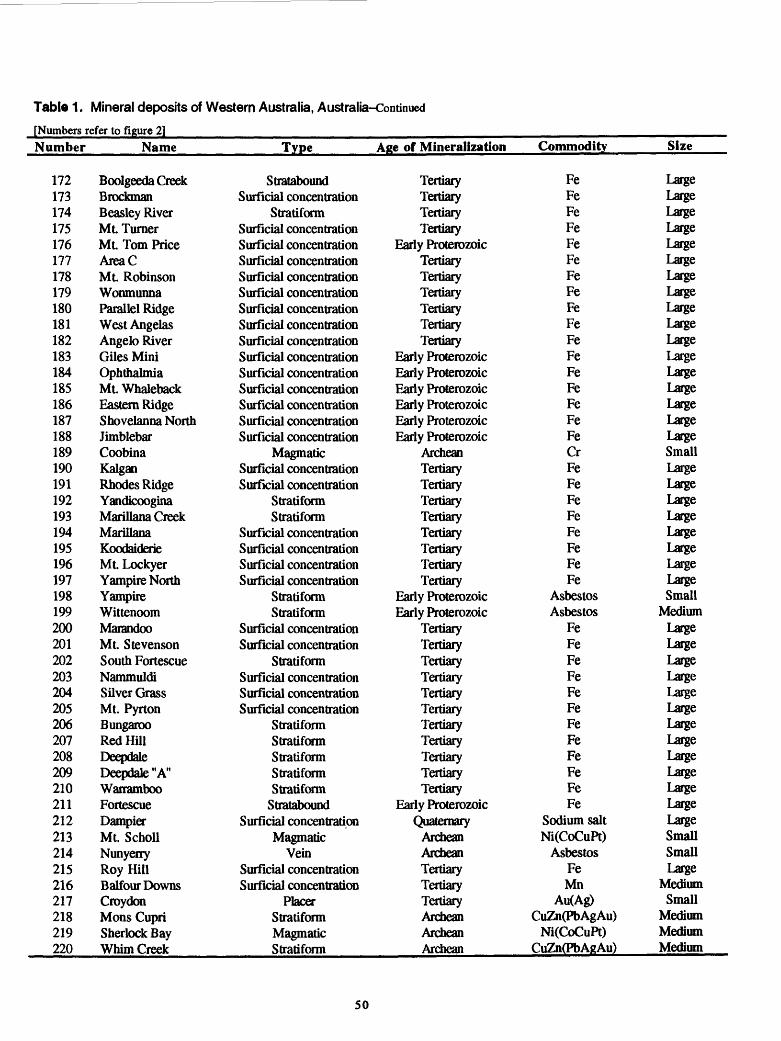
Table 1 . Mineral deposits of Western Australia, Australia-Continued
[Numbers refer to figure 2]Number
172173174175176177178179180181182183184185186187188189190191192193194195196197198199200201202203204205206207208209210211212213214215216217218219220
Name
Boolgeeda CreekBrockmanBeasley RiverMt. TurnerMt Tom PriceAreaCMt. RobinsonWonmunnaParallel RidgeWest AngelasAngelo RiverGiles MiniOphthalmiaMt. WhalebackEastern RidgeShovelanna NorthJimblebarCoobinaKalganRhodes RidgeYandicooginaMarillana CreekMarillanaKoodaiderieMt LockyerYampire NorthYampireWittenoomMarandooMt. StevensonSouth FortescueNammuldiSilver GrassMt. PyrtonBungarooRed HillDeepdaleDeepdale "A"WarrambooFortescueDampierMt. SchollNunyerryRoy HillBalfour DownsCroydonMons CupriSherlock BayWhim Creek
Type Age of Mineralization
StrataboundSurficial concentration
StratiformSurficial concentrationSurficial concentrationSurficial concentrationSurficial concentrationSurficial concentrationSurficial concentrationSurficial concentrationSurficial concentrationSurficial concentrationSurficial concentrationSurficial concentrationSurficial concentrationSurficial concentrationSurficial concentration
MagmaticSurficial concentrationSurficial concentration
StratiformStratiform
Surficial concentrationSurficial concentrationSurficial concentrationSurficial concentration
StratiformStratiform
Surficial concentrationSurficial concentration
StratiformSurficial concentrationSurficial concentrationSurficial concentration
StratiformStratiformStratiformStratiformStratiform
StrataboundSurficial concentration
MagmaticVein
Surficial concentrationSurficial concentration
PlacerStratiformMagmaticStratiform
TertiaryTertiaryTertiaryTertiary
Early ProterozoicTertiaryTertiaryTertiaryTertiaryTertiaryTertiary
Early ProterozoicEarly ProterozoicEarly ProterozoicEarly ProterozoicEarly ProterozoicEarly Proterozoic
ArcheanTertiaryTertiaryTertiaryTertiaryTertiaryTertiaryTertiaryTertiary
Early ProterozoicEarly Proterozoic
TertiaryTertiaryTertiaryTertiaryTertiaryTertiaryTertiaryTertiaryTertiaryTertiaryTertiary
Early ProterozoicQuaternary
ArcheanArcheanTertiaryTertiaryTertiaryArcheanArcheanArchean
Commodity
FeFeFeFeFeFeFeFeFeFeFeFeFeFeFeFeFeCrFeFeFeFeFeFeFeFe
AsbestosAsbestos
FeFeFeFeFeFeFeFeFeFeFeFe
Sodium saltNi(CoCuPt)
AsbestosFeMn
Au(Ag)CuZn(PbAgAu)
Ni(CoCuPt)CuZn(PbAgAu)
Size
LargeLargeLargeLargeLargeLargeLargeLargeLargeLargeLargeLargeLargeLargeLargeLargeLargeSmallLargeLargeLargeLargeLargeLargeLargeLargeSmall
MediumLargeLargeLargeLargeLargeLargeLargeLargeLargeLargeLargeLargeLargeSmallSmallLarge
MediumSmall
MediumMediumMedium
50

Table 1. Mineral deposits of Western Australia, Australia-Continued
[Numbers refer to figure 2] __Number Name Type Age of Mineralization Commodity Size
221 PortHedland222 Wodgina223 Shaw River224 North Pole225 Cooke Bluff226 Comet227 Moolyella228 Bamboo Creek229 Coppin Gap230 Lionel231 Nullagine Blue Spec232 Cookes Creek233 Mt. Rove234 Kintyre235 Telfer236 Nifty237 Ripon Hills238 Braeskfe239 Shay Gap/Sunrise
______Hill-Nimingarra
Surficial concentrationMagmatic
PlacerVeinVeinVeinPlacerVein
PorphyryVeinVeinVein
StrataboundVein
Stratabound Stratabound Stratabound
Vein Surficial concentration
Quaternary Archean
Quaternary Archean Archean Archean
Quaternary Archean Archean Archean Archean Archean
Mid ProterozoicMiddle Proterozoic
Late ProterozoicLate ProterozoicMid Proterozoic
Early ProterozoicTertiary
Sodium salt Nb(Ta)U Nb(Ta)U
BaBa
Au(Ag)Sn
Au(Ag)CuMo(AuAg)
AsbestosAu(Ag)
WMnU
Au(Ag) CuPb(ZnAgAu)
Mn Pb(Ag)
Fe
LargeSmallSmall
MediumMediumSmallSmallSmall
MediumSmallSmallSmallLargeLarge
MediumMedium
LargeSmall
Medium
51
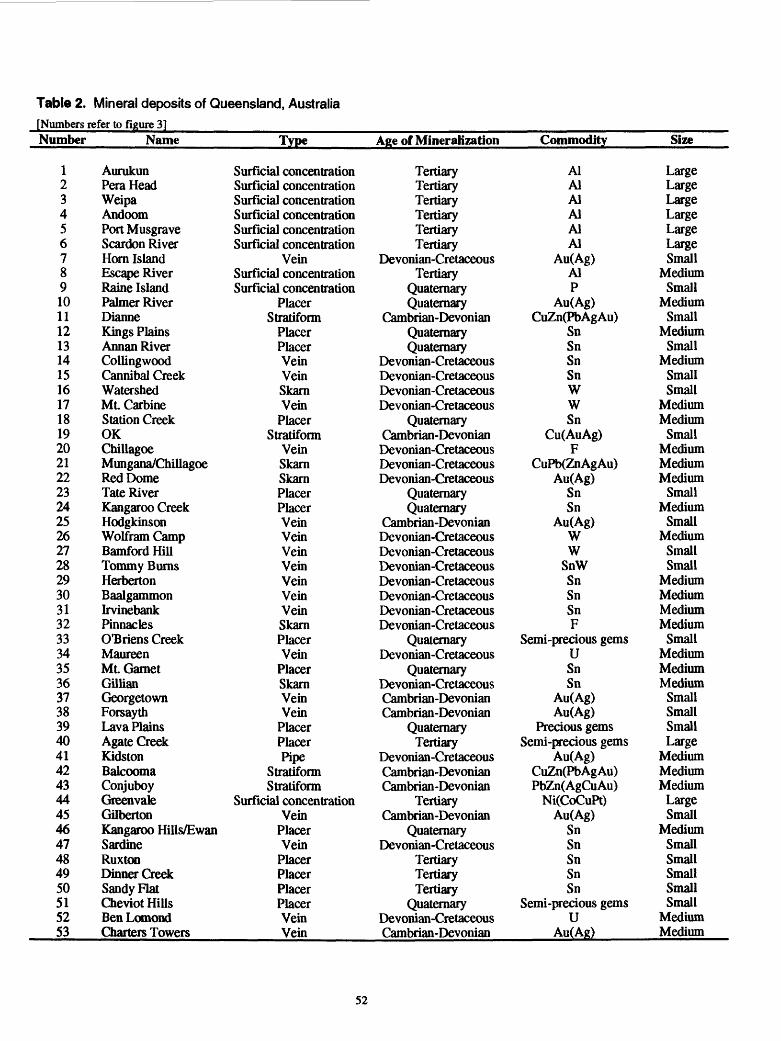
Table 2. Mineral deposits of Queensland, Australia[Numbers refer to figure 3]Number
1234567891011121314151617181920212223242526272829303132333435363738394041424344454647484950515253
Name
AurukunPeraHeadWeipaAndoomPort MusgraveScardon RiverHorn IslandEscape RiverRaine IslandPalmer RiverDianneKings PlainsAnnan RiverCollingwoodCannibal CreekWatershedMt CarbineStation CreekOKChillagoeMungana/ChillagoeRed DomeTate RiverKangaroo CreekHodgkinsonWolfram CampBamford HillTommy BurnsHerbertonBaalgammonIrvinebankPinnaclesO'Briens CreekMaureenMt GarnetGillianGeorgetownForsaythLava PlainsAgate CreekKidstonBalcoomaConjuboyGreenvaleGilbertonKangaroo Hills/EwanSardineRuxtonDinner CreekSandy FlatCheviot HiUsBen LomondCharters Towers
Type
Surficial concentrationSurficial concentrationSurficial concentrationSurficial concentrationSurficial concentrationSurficial concentration
VeinSurficial concentrationSurficial concentration
PlacerStratiform
PlacerPlacerVeinVeinSkarnVein
PlacerStratiform
VeinSkarnSkarnPlacerPlacerVeinVeinVeinVeinVeinVeinVeinSkarnPlacerVein
PlacerSkarnVeinVein
PlacerPlacerPipe
StratiformStratiform
Surficial concentrationVein
PlacerVein
PlacerPlacerPlacerPlacerVeinVein
Age of Mineralization
TertiaryTertiaryTertiaryTertiaryTertiaryTertiary
Devonian-CretaceousTertiary
QuaternaryQuaternary
Cambrian-DevonianQuaternaryQuaternary
Devonian-CretaceousDevonian-CretaceousDevonian-CretaceousDevonian-Cretaceous
QuaternaryCambrian-Devonian
Devonian-CretaceousDevonian-CretaceousDevonian-Cretaceous
QuaternaryQuaternary
Cambrian-DevonianDevonian-CretaceousDevonian-CretaceousDevonian-CretaceousDevonian-CretaceousDevonian-CretaceousDevonian-CretaceousDevonian-Cretaceous
QuaternaryDevonian-Cretaceous
QuaternaryDevonian-CretaceousCambrian-DevonianCambrian-Devonian
QuaternaryTertiary
Devonian-CretaceousCambrian-DevonianCambrian-Devonian
TertiaryCambrian-Devonian
QuaternaryDevonian-Cretaceous
TertiaryTertiaryTertiary
QuaternaryDevonian-CretaceousCambrian-Devonian
Commodity
AlAlAlAlAlAl
Au(Ag)AlP
Au(Ag)CuZn(PbAgAu)
SnSnSnSnWWSn
Cu(AuAg)F
CuPb(ZnAgAu)Au(Ag)
SnSn
Au(Ag)WW
SnWSnSnSnF
Semi-precious gemsUSnSn
Au(Ag)Au(Ag)
Precious gemsSemi-precious gems
Au(Ag)CuZn(PbAgAu)PbZn(AgCuAu)
Ni(CoCuPt)Au(Ag)
SnSnSnSnSn
Semi-precious gemsU
Au(A«)
Size
LargeLargeLargeLargeLargeLargeSmall
MediumSmall
MediumSmall
MediumSmall
MediumSmallSmall
MediumMedium
SmallMediumMediumMedium
SmallMedium
SmallMedium
SmallSmall
MediumMediumMediumMedium
SmallMediumMediumMedium
SmallSmallSmallLarge
MediumMediumMediumLargeSmall
MediumSmallSmallSmallSmallSmall
MediumMedium
52
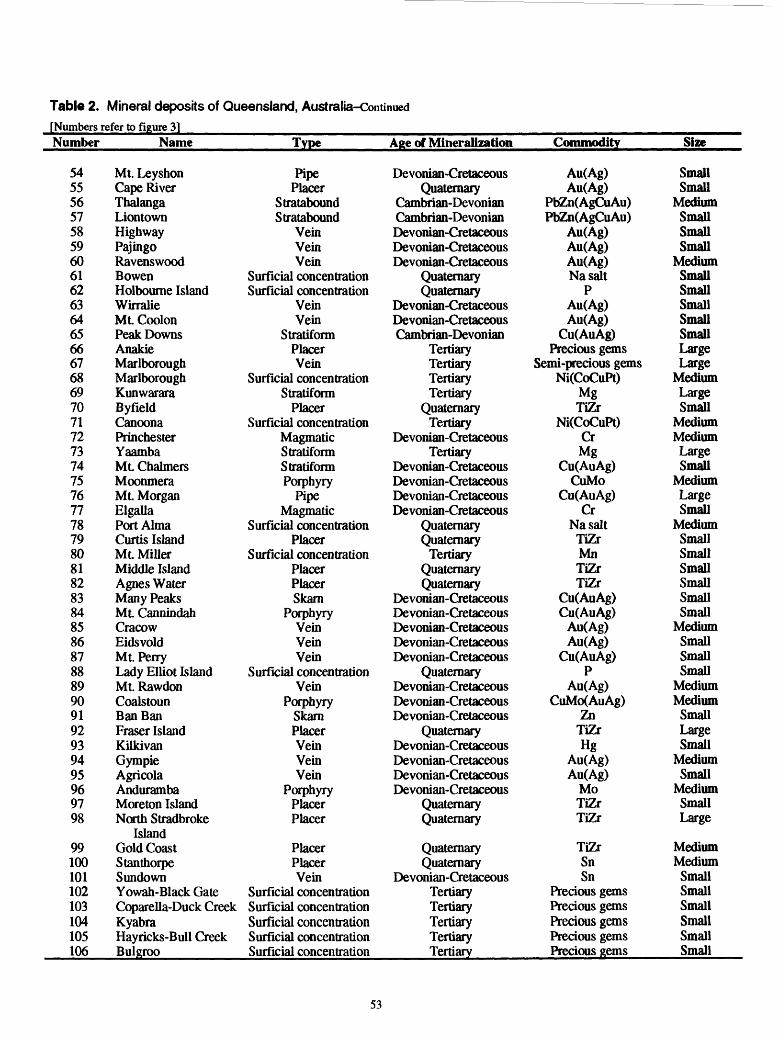
Table 2. Mineral deposits of Queensland, Australia-Continued[Numbers refer to figure 3]Number
545556575859606162636465666768697071727374757677787980818283848586878889909192939495969798
99100101102103104105106
Name
Mt. LeyshonCape RiverThalangaLiontownHighwayPajingoRavenswoodBowenMelbourne IslandWirralieMt CoolonPeak DownsAnakieMarlboroughMarlboroughKunwararaByfieldCanoonaPrinchesterYaambaMt ChalmersMoonmeraMt MorganElgallaPort AlmaCurtis IslandML MillerMiddle IslandAgnes WaterMany PeaksMt CannindahCracowEidsvoldMt PerryLady Elliot IslandMt RawdonCoalstounBan BanFraser IslandKilkivanGympieAgricolaAndurambaMoreton IslandNorth Stradbroke
IslandGold CoastStanthorpeSundownYowah-Black GateCoparella-Duck CreekKyabraHayricks-Bull CreekBulgroo
Type
PipePlacer
StrataboundStratabound
VeinVeinVein
Surficial concentrationSurficial concentration
VeinVein
StratiformPlacerVein
Surficial concentrationStratiform
PlacerSurficial concentration
MagmaticStratiformStratiformPorphyry
PipeMagmatic
Surficial concentrationPlacer
Surficial concentrationPlacerPlacerSkarn
PorphyryVeinVeinVein
Surficial concentrationVein
PorphyrySkarnPlacerVeinVeinVein
PorphyryPlacerPlacer
PlacerPlacerVein
Surficial concentrationSurficial concentrationSurficial concentrationSurficial concentrationSurficial concentration
Age of Mineralization
Devonian-CretaceousQuaternary
Cambrian-DevonianCambrian-DevonianDevonian-CretaceousDevonian-CretaceousDevonian-Cretaceous
QuaternaryQuaternary
Devonian-CretaceousDevonian-CretaceousCambrian-Devonian
TertiaryTertiaryTertiaryTertiary
QuaternaryTertiary
Devonian-CretaceousTertiary
Devonian-CretaceousDevonian-CretaceousDevonian-CretaceousDevonian-Cretaceous
QuaternaryQuaternary
TertiaryQuaternaryQuaternary
Devonian-CretaceousDevonian-CretaceousDevonian-CretaceousDevonian-CretaceousDevonian-Cretaceous
QuaternaryDevonian-CretaceousDevonian-CretaceousDevonian-Cretaceous
QuaternaryDevonian-CretaceousDevonian-CretaceousDevonian-CretaceousDevonian-Cretaceous
QuaternaryQuaternary
QuaternaryQuaternary
Devonian-CretaceousTertiaryTertiaryTertiaryTertiaryTertiary
Commodity
Au(Ag)Au(Ag)
PbZn(AgCuAu)PbZn(AgCuAu)
Au(Ag)Au(Ag)Au(Ag)Nasalt
PAu(Ag)Au(Ag)
Cu(AuAg)Precious gems
Semi-precious gemsNi(CoCuPt)
MgTiZr
Ni(CoCuPt)CrMg
Cu(AuAg)CuMo
Cu(AuAg)Cr
NasaltTiZrMnTiZrTiZr
Cu(AuAg)Cu(AuAg)
Au(Ag)Au(Ag)
Cu(AuAg)P
Au(Ag)CuMo(AuAg)
ZnTiZrHg
Au(Ag)Au(Ag)
MoTiZrTiZr
TiZrSnSn
Precious gemsPrecious gemsPrecious gemsPrecious gemsPrecious gems
Size
SmallSmall
MediumSmallSmallSmall
MediumSmallSmallSmallSmallSmallLargeLarge
MediumLargeSmall
MediumMediumLargeSmall
MediumLargeSmall
MediumSmallSmallSmallSmallSmallSmall
MediumSmallSmallSmall
MediumMedium
SmallLargeSmall
MediumSmall
MediumSmallLarge
MediumMedium
SmallSmallSmallSmallSmallSmall
53
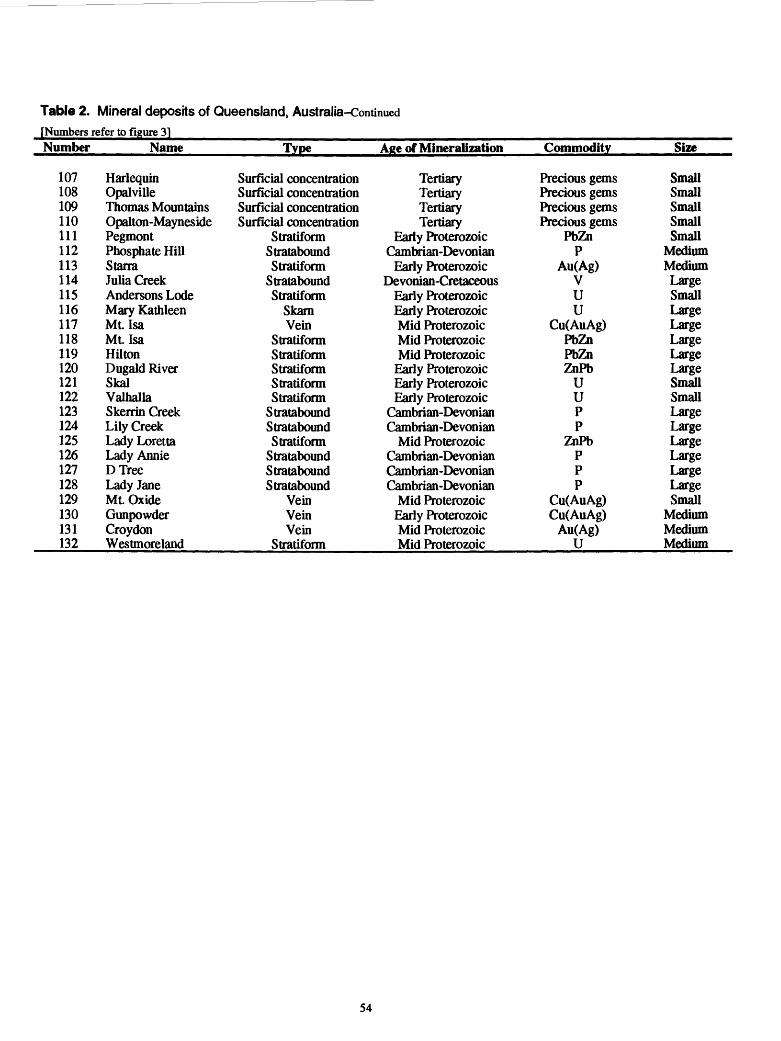
Table 2. Mineral deposits of Queensland, Australia-Condnued[Numbers refer to figure 3]Number
107108109110111112113114115116117118119120121122123124125126127128129130131132
Name
HarlequinOpalvilleThomas MountainsOpalton-MaynesidePegmontPhosphate HillStarraJulia CreekAndersons LodeMary KathleenMt. IsaMt. IsaHiltonDugald RiverSkalValhallaSkerrin CreekLily CreekLady LorettaLady AnnieDTreeLady JaneML OxideGunpowderCroydonWestmoreland
Type
Surficial concentrationSurficial concentrationSurficial concentrationSurficial concentration
StratiformStrataboundStratiform
StrataboundStratiform
SkarnVein
StratiformStratiformStratiformStratiformStratiform
StrataboundStrataboundStratiform
StrataboundStrataboundStratabound
VeinVeinVein
Stratiform
Age of Mineralization
TertiaryTertiaryTertiaryTertiary
Early ProterozoicCambrian-Devonian
Early ProterozoicDevonian-Cretaceous
Early ProterozoicEarly ProterozoicMid ProterozoicMid ProterozoicMid Proterozoic
Early ProterozoicEarly ProterozoicEarly Proterozoic
Cambrian-DevonianCambrian-Devonian
Mid ProterozoicCambrian-DevonianCambrian-DevonianCambrian-Devonian
Mid ProterozoicEarly ProterozoicMid ProterozoicMid Proterozoic
Commodity
Precious gemsPrecious gemsPrecious gemsPrecious gems
PbZnP
Au(Ag)VUU
Cu(AuAg)PbZnPbZnZnPb
UUPP
ZnPbPPP
Cu(AuAg)Cu(AuAg)
Au(Ag)U
Size
SmallSmallSmallSmallSmall
MediumMediumLargeSmallLargeLargeLargeLargeLargeSmallSmallLargeLargeLargeLargeLargeLargeSmall
MediumMediumMedium
54
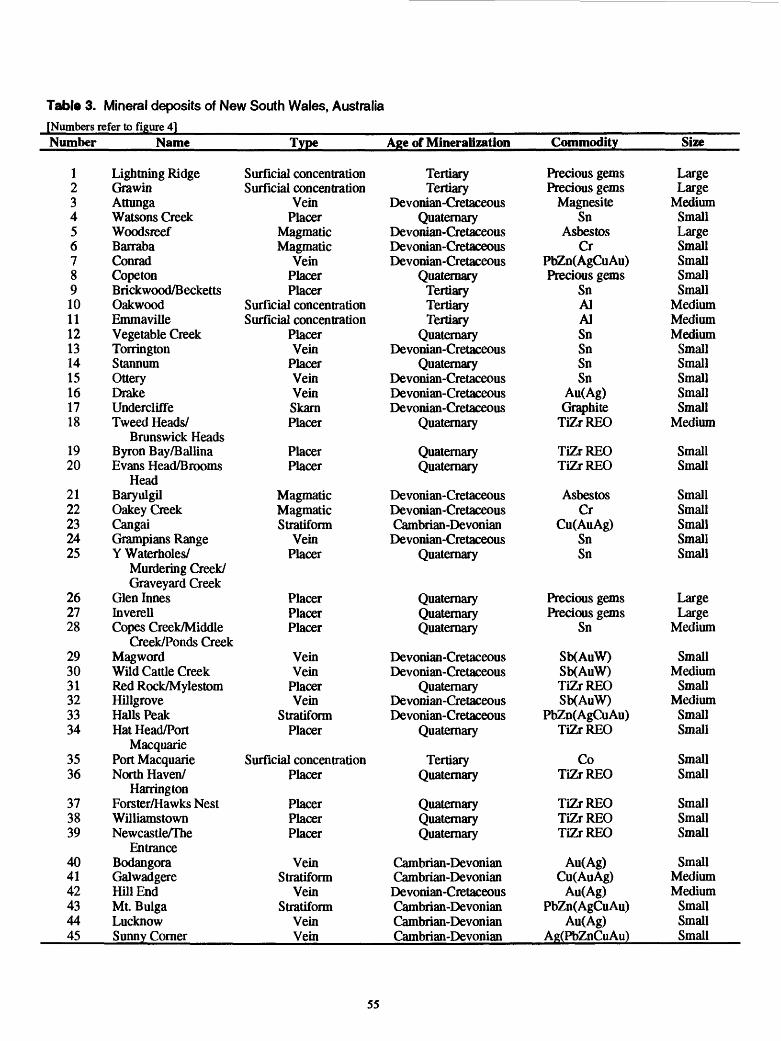
Table 3. Mineral deposits of New South Wales, Australia[Numbers refer to figure 4]Number
123456789101112131415161718
1920
2122232425
262728
293031323334
3536
373839
404142434445
Name
Lightning RidgeGrawinAttungaWatsons CreekWoodsreefBarrabaConradCopetonBrickwood/BeckettsOakwoodEmmavilleVegetable CreekTorringtonStannumOtteryDrakeUndercliffeTweed Heads/
Brunswick HeadsByron Bay/BallinaEvans Head/Brooms
HeadBaryulgilOakey CreekCangaiGrampians RangeY Waterholes/
Murdering Creek/Graveyard Creek
Glen InnesInverellCopes Creek/Middle
Creek/Ponds CreekMagwordWild Cattle CreekRed Rock/MylestomHillgroveHalls PeakHat Head/Port
MacquariePort MacquarieNorth Haven/
HarringtonForster/Hawks NestWilliamstownNewcastle/The
EntranceBodangoraGalwadgereHill EndMt. BulgaLucknowSunny Corner
Type
Surficial concentrationSurficial concentration
VeinPlacer
MagmaticMagmatic
VehiPlacerPlacer
Surficial concentrationSurficial concentration
PlacerVein
PlacerVeinVeinSkarnPlacer
PlacerPlacer
MagmaticMagmaticStratiform
VeinPlacer
PlacerPlacerPlacer
VeinVein
PlacerVein
StratiformPlacer
Surficial concentrationPlacer
PlacerPlacerPlacer
VeinStratiform
VeinStratiform
VeinVein
Age of Mineralization
TertiaryTertiary
Devonian-CretaceousQuaternary
Devonian-CretaceousDevonian-CretaceousDevonian-Cretaceous
QuaternaryTertiaryTertiaryTertiary
QuaternaryDevonian-Cretaceous
QuaternaryDevonian-CretaceousDevonian-CretaceousDevonian-Cretaceous
Quaternary
QuaternaryQuaternary
Devonian-CretaceousDevonian-CretaceousCambrian-DevonianDevonian-Cretaceous
Quaternary
QuaternaryQuaternaryQuaternary
Devonian-CretaceousDevonian-Cretaceous
QuaternaryDevonian-CretaceousDevonian-Cretaceous
Quaternary
TertiaryQuaternary
QuaternaryQuaternaryQuaternary
Cambrian-DevonianCambrian-DevonianDevonian-CretaceousCambrian-DevonianCambrian-DevonianCambrian-Devonian
Commodity
Precious gemsPrecious gems
MagnesiteSn
AsbestosCr
PbZn(AgCuAu)Precious gems
SnAlAlSnSnSnSn
Au(Ag)Graphite
TiZrREO
TiZrREOTiZrREO
AsbestosCr
Cu(AuAg)SnSn
Precious gemsPrecious gems
Sn
Sb(AuW)Sb(AuW)TiZrREOSb(AuW)
PbZn(AgCuAu)TiZrREO
CoTiZrREO
TiZrREOTiZrREOTiZrREO
Au(Ag)Cu(AuAg)
Au(Ag)PbZn(AgCuAu)
Au(Ag)Ag(PbZnCuAu)
Size
LargeLarge
MediumSmallLargeSmallSmallSmallSmall
MediumMediumMedium
SmallSmallSmallSmallSmall
Medium
SmallSmall
SmallSmallSmallSmallSmall
LargeLarge
Medium
SmallMedium
SmallMedium
SmallSmall
SmallSmall
SmallSmallSmall
SmallMediumMedium
SmallSmallSmall
55
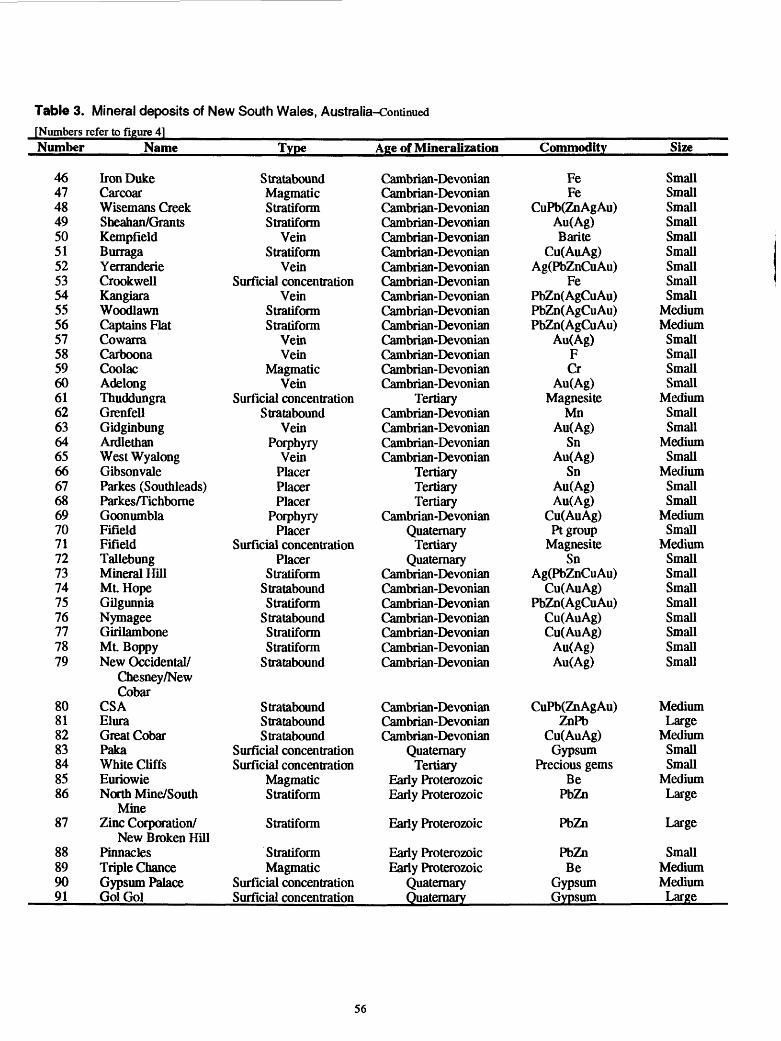
Table 3. Mineral deposits of New South Wales, Australia-Continued [Numbers refer to figure 4]Number
46474849505152535455565758596061626364656667686970717273747576777879
80818283848586
87
88899091
Name
Iron DukeCarcoarWisemans CreekSheahan/GrantsKempfieldBurragaYerranderieCrookwellKangiaraWoodlawnCaptains FlatCowarraCarboonaCoolacAdelongThuddungraGrenfellGidginbungAidlethanWest WyalongGibsonvaleParkes (Southleads)Parkes/TichborneGoonumblaFifieldFifieldTallebungMineral HillMt HopeGilgunniaNymageeGirilamboneML BoppyNew Occidental/
Chesney/NewCobar
CSAEluraGreat CobarPakaWhite CliffsEuriowieNorth Mine/South
MineZinc Corporation/
New Broken HillPinnaclesTriple ChanceGypsum PalaceGolGol
Type
StrataboundMagmaticStratiformStratiform
VeinStratiform
VeinSurficial concentration
VeinStratiformStratiform
VeinVein
MagmaticVein
Surficial concentrationStratabound
VeinPorphyry
VeinPlacerPlacerPlacer
PorphyryPlacer
Surficial concentrationPlacer
StratiformStrataboundStratiform
StrataboundStratiformStratiform
Stratabound
StrataboundStrataboundStratabound
Surficial concentrationSurficial concentration
MagmaticStratiform
Stratiform
StratiformMagmatic
Surficial concentrationSurficial concentration
Age of Mineralization
Cambrian-DevonianCambrian-DevonianCambrian-DevonianCambrian-DevonianCambrian-DevonianCambrian-DevonianCambrian-DevonianCambrian-DevonianCambrian-DevonianCambrian-DevonianCambrian-DevonianCambrian-DevonianCambrian-DevonianCambrian-DevonianCambrian-Devonian
TertiaryCambrian-DevonianCambrian-DevonianCambrian-DevonianCambrian-Devonian
TertiaryTertiaryTertiary
Cambrian-DevonianQuaternary
TertiaryQuaternary
Cambrian-DevonianCambrian-DevonianCambrian-DevonianCambrian-DevonianCambrian-DevonianCambrian-DevonianCambrian-Devonian
Cambrian-DevonianCambrian-DevonianCambrian-Devonian
QuaternaryTertiary
Early ProterozoicEarly Proterozoic
Early Proterozoic
Early ProterozoicEarly Proterozoic
QuaternaryQuaternary
Commodity
FeFe
CuPb(ZnAgAu)Au(Ag)Barite
Cu(AuAg)Ag(PbZnCuAu)
FePbZn(AgCuAu)PbZn(AgCuAu)PbZn(AgCuAu)
Au(Ag)FCr
Au(Ag)Magnesite
MnAu(Ag)
SnAu(Ag)
SnAu(Ag)Au(Ag)
Cu(AuAg)Pt group
MagnesiteSn
Ag(PbZnCuAu)Cu(AuAg)
PbZn(AgCuAu)Cu(AuAg)Cu(AuAg)
Au(Ag)Au(Ag)
CuPb(ZnAgAu)ZnPb
Cu(AuAg)Gypsum
Precious gemsBe
PbZn
PbZn
PbZnBe
GypsumGypsum
Size
SmallSmallSmallSmallSmallSmallSmallSmallSmall
MediumMedium
SmallSmallSmallSmall
MediumSmallSmall
MediumSmall
MediumSmallSmall
MediumSmall
MediumSmallSmallSmallSmallSmallSmallSmallSmall
MediumLarge
MediumSmallSmall
MediumLarge
Large
SmallMediumMediumLarge
56
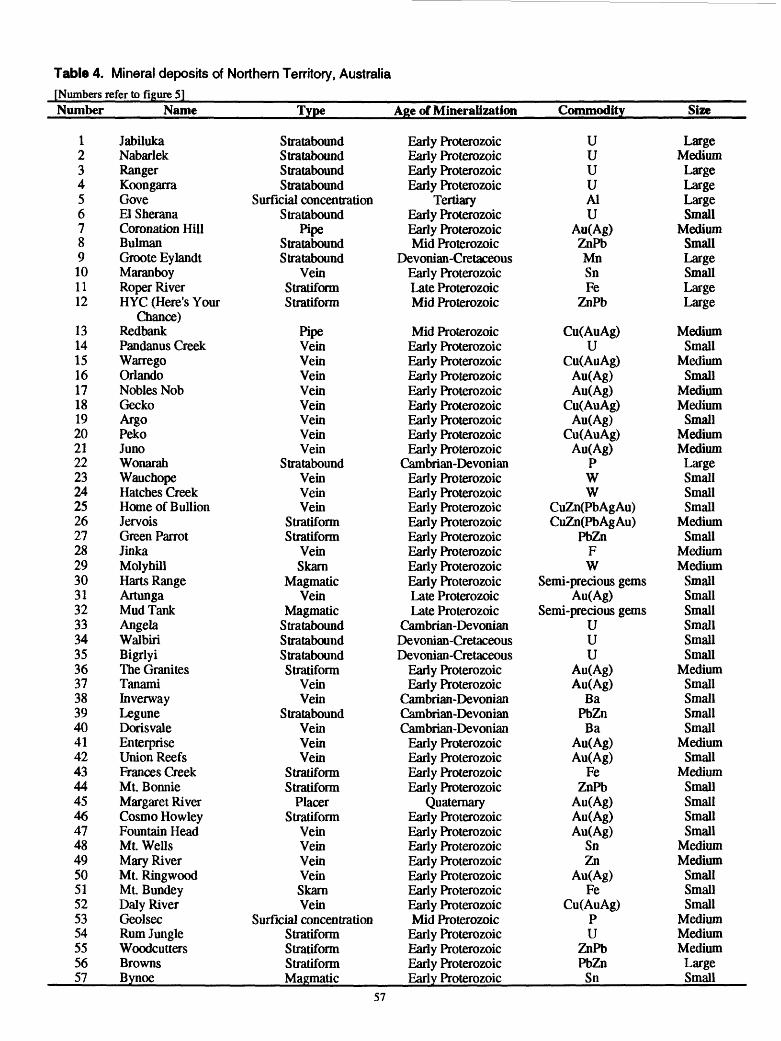
Table 4. Mineral deposits of Northern Territory, Australia[Numbers refer to figure 5]Number
123456789101112
131415161718192021222324252627282930313233343536373839404142434445464748495051525354555657
Name
JabilukaNabarlekRangerKoongarraGoveEl SheranaCoronation HillBulmanGroote EylandtMaranboyRoper RiverHYC (Here's Your
Chance)RedbankPandanus CreekWarregoOrlandoNobles NobGeckoArgoPekoJunoWonarahWauchopeHatches CreekHome of BullionJervoisGreen ParrotJinkaMolyhillHarts RangeArtungaMud TankAngelaWalbiriBigrlyiThe GranitesTanamiInverwayLeguneDorisvaleEnterpriseUnion ReefsFrances CreekMt. BonnieMargaret RiverCosmo HowleyFountain HeadMt. WellsMary RiverMt. RingwoodMt. BundeyDaly RiverGeolsecRum JungleWoodcuttersBrownsBynoe
Type
StrataboundStrataboundStrataboundStratabound
Surficial concentrationStratabound
PipeStrataboundStratabound
VeinStratiformStratiform
PipeVeinVeinVeinVeinVeinVeinVeinVein
StrataboundVeinVeinVein
StratiformStratiform
VeinSkarn
MagmaticVein
MagmaticStrataboundStrataboundStrataboundStratiform
VeinVein
StrataboundVeinVeinVein
StratiformStratiform
PlacerStratiform
VeinVeinVeinVeinSkarnVein
Surficial concentrationStratiformStratiformStratiformMagmatic
Age of Mineralization
Early ProterozoicEarly ProterozoicEarly ProterozoicEarly Proterozoic
TertiaryEarly ProterozoicEarly ProterozoicMid Proterozoic
Devonian-CretaceousEarly ProterozoicLate ProterozoicMid Proterozoic
Mid ProterozoicEarly ProterozoicEarly ProterozoicEarly ProterozoicEarly ProterozoicEarly ProterozoicEarly ProterozoicEarly ProterozoicEarly Proterozoic
Cambrian-DevonianEarly ProterozoicEarly ProterozoicEarly ProterozoicEarly ProterozoicEarly ProterozoicEarly ProterozoicEarly ProterozoicEarly ProterozoicLate ProterozoicLate Proterozoic
Cambrian-DevonianDevonian-CretaceousDevonian-Cretaceous
Early ProterozoicEarly Proterozoic
Cambrian-DevonianCambrian-DevonianCambrian-Devonian
Early ProterozoicEarly ProterozoicEarly ProterozoicEarly Proterozoic
QuaternaryEarly ProterozoicEarly ProterozoicEarly ProterozoicEarly ProterozoicEarly ProterozoicEarly ProterozoicEarly ProterozoicMid Proterozoic
Early ProterozoicEarly ProterozoicEarly ProterozoicEarly Proterozoic
Commodity
UuUuAlU
Au(Ag)ZnPbMnSnFe
ZnPb
Cu(AuAg)U
Cu(AuAg)Au(Ag)Au(Ag)
Cu(AuAg)Au(Ag)
Cu(AuAg)Au(Ag)
PWW
CuZn(PbAgAu)CuZn(PbAgAu)
PbZnFW
Semi-precious gemsAu(Ag)
Semi-precious gemsUUU
Au(Ag)Au(Ag)
BaPbZnBa
Au(Ag)Au(Ag)
FeZnPb
Au(Ag)Au(Ag)Au(Ag)
SnZn
Au(Ag)Fe
Cu(AuAg)PU
ZnPbPbZn
Sn
Size
LargeMedium
LargeLargeLargeSmall
MediumSmallLargeSmallLargeLarge
MediumSmall
MediumSmall
MediumMedium
SmallMediumMedium
LargeSmallSmallSmall
MediumSmall
MediumMedium
SmallSmallSmallSmallSmallSmall
MediumSmallSmallSmallSmall
MediumSmall
MediumSmallSmallSmallSmall
MediumMedium
SmallSmallSmall
MediumMediumMedium
LargeSmall
57
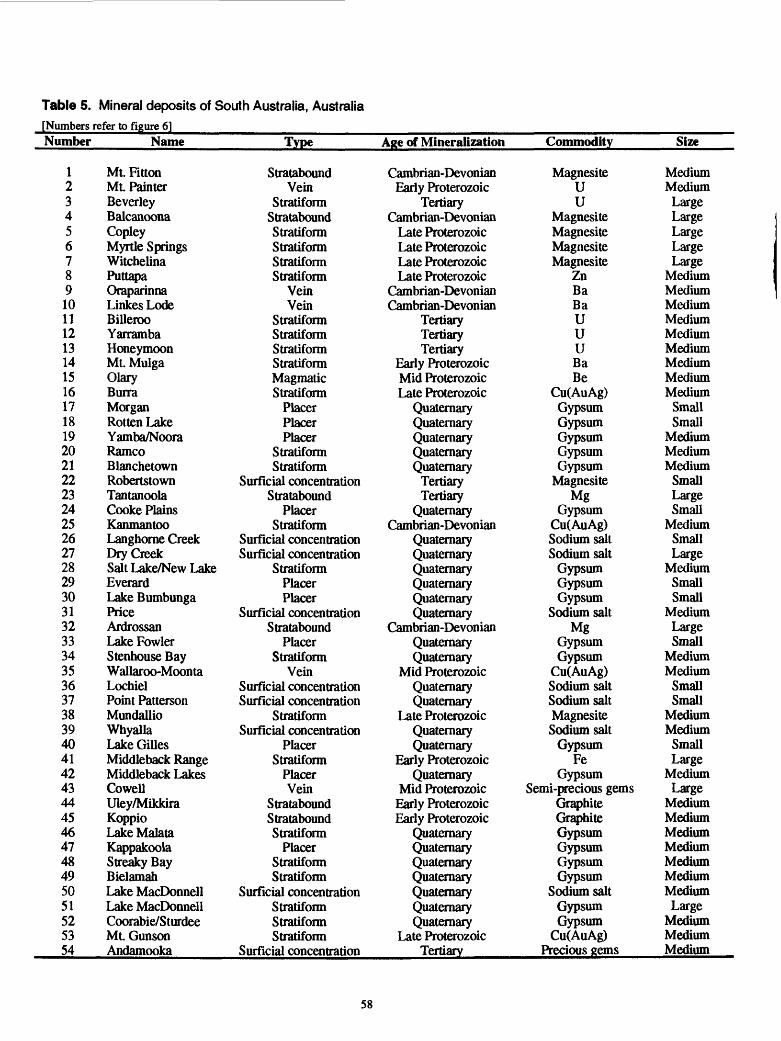
Table 5. Mineral deposits of South Australia, Australia[Numbers refer to figure 6]Number
123456789101112131415161718192021222324252627282930313233343536373839404142434445464748495051525354
Name
Mt. FittonMt PainterBeverleyBalcanoonaCopleyMyrtle SpringsWitchelinaPuttapaOraparinnaLinkes LodeBillerooYarrambaHoneymoonMt. MulgaOlaryBurraMorganRotten LakeYamba/NooraRamcoBlanchetownRobertstownTantanoolaCooke PlainsKanmantooLanghorne CreekDry CreekSalt Lake/New LakeEverardLake BumbungaPriceArdrossanLake FowlerStenhouse BayWallaroo-MoontaLochielPoint PattersonMundallioWhyallaLake GillesMiddleback RangeMiddleback LakesCowellUley/MikkiraKoppioLake Mala taKappakoolaStreaky BayBielamahLake MacDonnellLake MacDonnellCoorabie/SturdeeMt GunsonAndamooka
Type
StrataboundVein
StratiformStrataboundStratiformStratiformStratiformStratiform
VeinVein
StratiformStratiformStratiformStratiformMagmaticStratiform
PlacerPlacerPlacer
StratiformStratiform
Surficial concentrationStratabound
PlacerStratiform
Surficial concentrationSurficial concentration
StratiformPlacerPlacer
Surficial concentrationStratabound
PlacerStratiform
VeinSurficial concentrationSurficial concentration
StratiformSurficial concentration
PlacerStratiform
PlacerVein
StrataboundStrataboundStratiform
PlacerStratiformStratiform
Surficial concentrationStratiformStratiformStratiform
Surficial concentration
Age of Mineralization
Cambrian-DevonianEarly Proterozoic
TertiaryCambrian-Devonian
Late ProterozoicLate ProterozoicLate ProterozoicLate Proterozoic
Cambrian-DevonianCambrian-Devonian
TertiaryTertiaryTertiary
Early ProterozoicMid ProterozoicLate Proterozoic
QuaternaryQuaternaryQuaternaryQuaternaryQuaternary
TertiaryTertiary
QuaternaryCambrian-Devonian
QuaternaryQuaternaryQuaternaryQuaternaryQuaternaryQuaternary
Cambrian-DevonianQuaternaryQuaternary
Mid ProterozoicQuaternaryQuaternary
Late ProterozoicQuaternaryQuaternary
Early ProterozoicQuaternary
Mid ProterozoicEarly ProterozoicEarly Proterozoic
QuaternaryQuaternaryQuaternaryQuaternaryQuaternaryQuaternaryQuaternary
Late ProterozoicTertiary
Commodity
MagnesiteUU
MagnesiteMagnesiteMagnesiteMagnesite
ZnBaBaUUUBaBe
Cu(AuAg)GypsumGypsumGypsumGypsumGypsum
MagnesiteMg
GypsumCu(AuAg)Sodium saltSodium salt
GypsumGypsumGypsum
Sodium saltMg
GypsumGypsum
Cu(AuAg)Sodium saltSodium saltMagnesiteSodium salt
GypsumFe
GypsumSemi-precious gems
GraphiteGraphiteGypsumGypsumGypsumGypsum
Sodium saltGypsumGypsum
Cu(AuAg)Precious gems
Size
MediumMediumLargeLargeLargeLargeLarge
MediumMediumMediumMediumMediumMediumMediumMediumMedium
SmallSmall
MediumMediumMedium
SmallLargeSmall
MediumSmallLarge
MediumSmallSmall
MediumLargeSmall
MediumMedium
SmallSmall
MediumMedium
SmallLarge
MediumLarge
MediumMediumMediumMediumMediumMediumMediumLarge
MediumMediumMedium
58
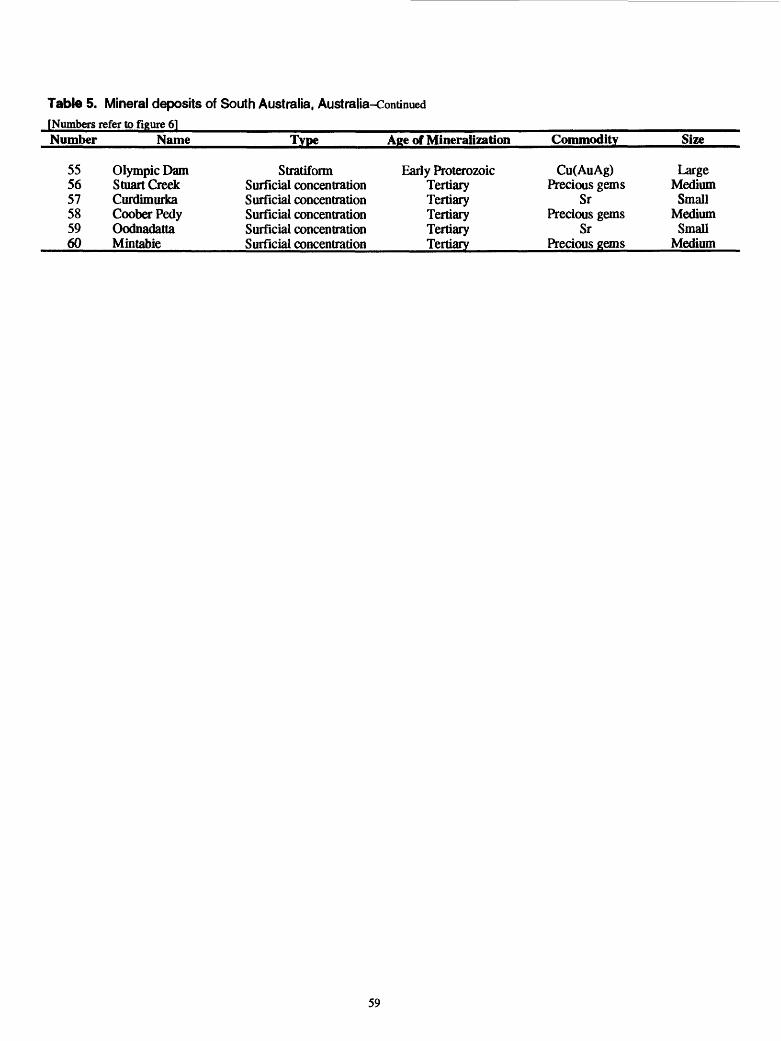
Table 5. Mineral deposits of South Australia, Australia-Continued [Numbers refer to figure 6]Number ___ Name Type Age of Mineralization Commodity______Size
555657585960
Olympic DamStuart CreekCurdimurkaCoober PedyOodnadattaMintabie
StratiformSurficial concentrationSurficial concentrationSurficial concentrationSurficial concentrationSurficial concentration
Early ProterozoicTertiaryTertiaryTertiaryTertiaryTertiary
Cu(AuAg)Precious gems
SrPrecious gems
SrPrecious gems
LargeMedium
SmallMedium
SmallMedium
59
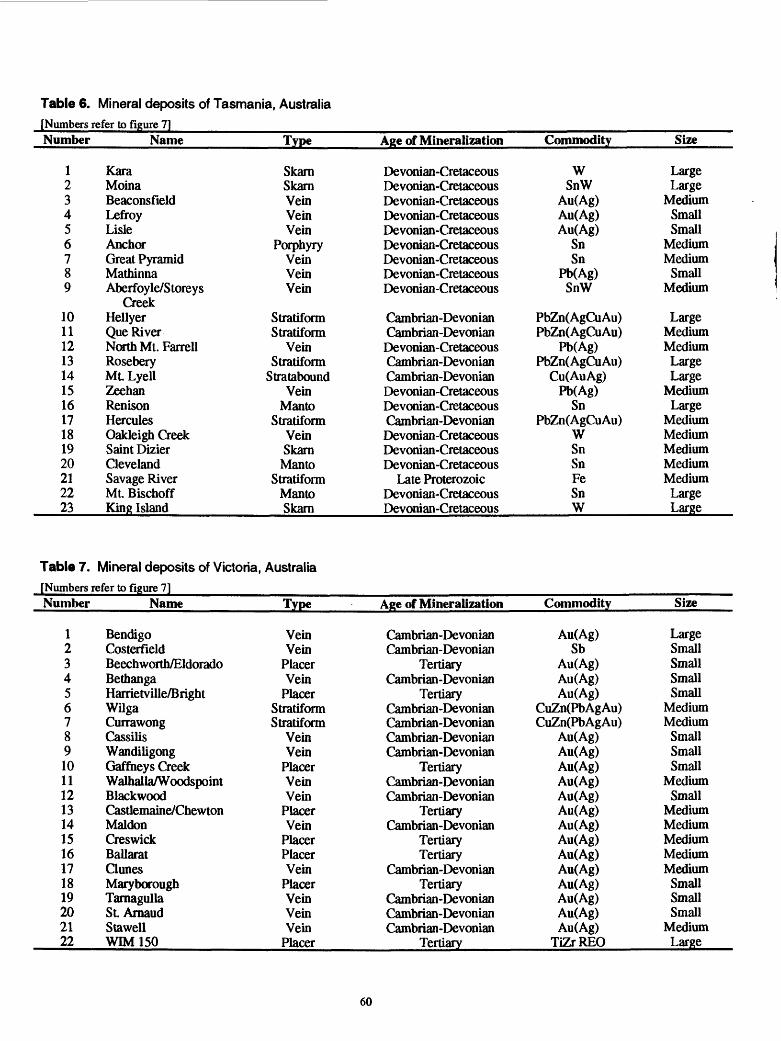
Table 6. Mineral deposits of Tasmania, Australia[Numbers refer to figure 7]Number
123456789
1011121314151617181920212223
Name
KaraMoinaBeaconsfieldLefroyLisleAnchorGreat PyramidMathinnaAberfoyle/Storeys
CreekHellyerQue RiverNorth Mt. FarrellRoseberyMt LyellZeehanRenisonHerculesOakleigh GeekSaint DizierClevelandSavage RiverMt. BischoffKing Island
Type
SkarnSkarnVeinVeinVein
PorphyryVeinVeinVein
StratiformStratiform
VeinStratiform
StrataboundVein
MantoStratiform
VeinSkarnManto
StratiformMantoSkarn
Age of Mineralization
Devonian-CretaceousDevonian-CretaceousDevonian-CretaceousDevonian-CretaceousDevonian-CretaceousDevonian-CretaceousDevonian-CretaceousDevonian-CretaceousDevonian-Cretaceous
Cambrian-DevonianCambrian-DevonianDevonian-CretaceousCambrian-DevonianCambrian-DevonianDevonian-CretaceousDevonian-CretaceousCambrian-DevonianDevonian-CretaceousDevonian-CretaceousDevonian-Cretaceous
Late ProterozoicDevonian-CretaceousDevonian-Cretaceous
Commodity
WSnW
Au(Ag)Au(Ag)Au(Ag)
SnSn
Pb(Ag)SnW
PbZn(AgCuAu)PbZn(AgCuAu)
Pb(Ag)PbZn(AgCuAu)
Cu(AuAg)Pb(Ag)
SnPbZn(AgCuAu)
WSnSnFeSnW
Size
LargeLarge
MediumSmallSmall
MediumMedium
SmallMedium
LargeMediumMedium
LargeLarge
MediumLarge
MediumMediumMediumMediumMedium
LargeLarge
Table 7. Mineral deposits of Victoria, Australia[Numbers refer to figure 7]Number
12345678910111213141516171819202122
Name
BendigoCosterfieldBeechworth/EldoradoBethangaHarrietville/B rightWilgaCurrawongCassilisWandiligongGaffheys CreekWalhalla/WoodspointBlackwoodCastlemaine/ChewtonMaldonCreswickBallaratClunesMaryboroughTarnagullaSt ArnaudStawellWIM150
Type
VeinVein
PlacerVein
PlacerStratiformStratiform
VeinVein
PlacerVeinVein
PlacerVein
PlacerPlacerVein
PlacerVeinVeinVein
Placer
Age of Mineralization
Cambrian-DevonianCambrian-Devonian
TertiaryCambrian-Devonian
TertiaryCambrian-DevonianCambrian-DevonianCambrian-DevonianCambrian-Devonian
TertiaryCambrian-DevonianCambrian-Devonian
TertiaryCambrian-Devonian
TertiaryTertiary
Cambrian-DevonianTertiary
Cambrian-DevonianCambrian-DevonianCambrian-Devonian
Tertiary
Commodity
Au(Ag)Sb
Au(Ag)Au(Ag)Au(Ag)
CuZn(PbAgAu)CuZn(PbAgAu)
Au(Ag)Au(Ag)Au(Ag)Au(Ag)Au(Ag)Au(Ag)Au(Ag)Au(Ag)Au(Ag)Au(Ag)Au(Ag)Au(Ag)Au(Ag)Au(Ag)
TiZrREO
Size
LargeSmallSmallSmallSmall
MediumMedium
SmallSmallSmall
MediumSmall
MediumMediumMediumMediumMedium
SmallSmallSmall
MediumLarge
60
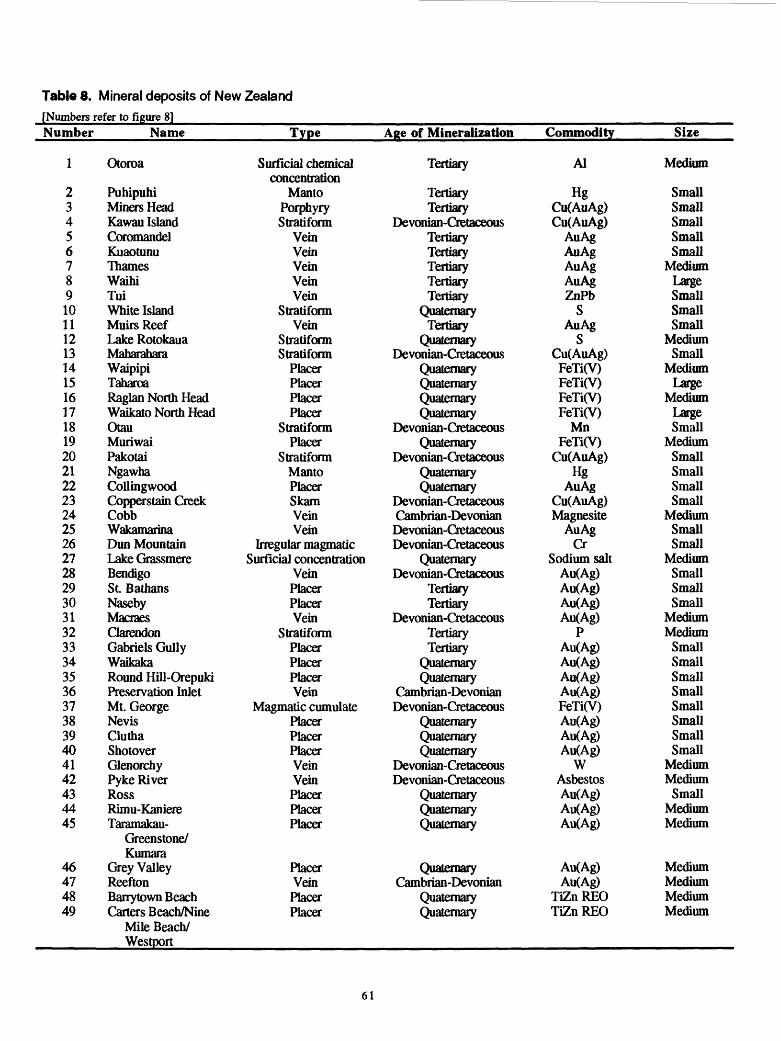
Table 8. Mineral deposits of New Zealand[Numbers refer to figure 8]Number
1
23456789101112131415161718192021222324252627282930313233343536373839404142434445
46474849
Name
Otoroa
PuhipuhiMiners HeadKawau IslandCoromandelKuaotunuThamesWaihiTuiWhite IslandMuirs ReefLake RotokauaMaharaharaWaipipiTaharoaRaglan North HeadWaikato North HeadOtauMuriwaiPakotaiNgawhaCollingwoodCopperstain CreekCobbWakamarinaDun MountainLake GrassmereBendigoSt. BathansNasebyMacraesClarendonGabriels GullyWaikakaRound Hill-OrepukiPreservation InletMt. GeorgeNevisCluthaShotoverGlenorchyPyke RiverRossRimu-KaniereTaramakau-
Greenstone/Kumara
Grey ValleyReeftonBarrytown BeachCarters Beach/Nhie
Mile Beach/Westport
Type
Surficial chemicalconcentration
MantoPorphyryStratiform
VeinVeinVeinVeinVein
StratiformVein
StratiformStratiform
PlacerPlacerPlacerPlacer
StratiformPlacer
StratiformMantoPlacerSkamVeinVein
Irregular magmaticSurficial concentration
VeinPlacerPlacerVein
StratiformPlacerPlacerPlacerVein
Magmatic cumulatePlacerPlacerPlacerVeinVeinPlacerPlacerPlacer
PlacerVeinPlacerPlacer
Age of Mineralization
Tertiary
TertiaryTertiary
Devonian-CretaceousTertiaryTertiaryTertiaryTertiaryTertiary
QuaternaryTertiary
QuaternaryDevonian-Cretaceous
QuaternaryQuaternaryQuaternaryQuaternary
Devonian-CretaceousQuaternary
Devonian-CretaceousQuaternaryQuaternary
Devonian-CretaceousCambrian-DevonianDevonian-CretaceousDevonian-Cretaceous
QuaternaryDevonian-Cretaceous
TertiaryTertiary
Devonian-CretaceousTertiaryTertiary
QuaternaryQuaternary
Cambrian-DevonianDevonian-Cretaceous
QuaternaryQuaternaryQuaternary
Devonian-CretaceousDevonian-Cretaceous
QuaternaryQuaternaryQuaternary
QuaternaryCambrian-Devonian
QuaternaryQuaternary
Commodity
Al
HgCu(AuAg)Cu(AuAg)
AuAgAuAgAuAgAuAgZnPb
SAuAg
SCu(AuAg)
FeTi(V)FeTi(V)FeTi(V)FeTi(V)
MnFeTi(V)
Cu(AuAg)Hg
AuAgCu(AuAg)Magnesite
AuAgCr
Sodium saltAu(Ag)Au(Ag)Au(Ag)Au(Ag)
PAu(Ag)AiKAg)Au(Ag)AiKAg)FeTi(V)Au(Ag)Au(Ag)Au(Ag)
WAsbestosAu(Ag)Au(Ag)Au(Ag)
Au(Ag)Au(Ag)
TiZnREOTiZnREO
Size
Medium
SmallSmallSmallSmallSmall
MediumLargeSmallSmallSmall
MediumSmall
MediumLarge
MediumLargeSmall
MediumSmallSmallSmallSmall
MediumSmallSmall
MediumSmallSmallSmall
MediumMedium
SmallSmallSmallSmallSmallSmallSmallSmall
MediumMedium
SmallMediumMedium
MediumMediumMediumMedium
61
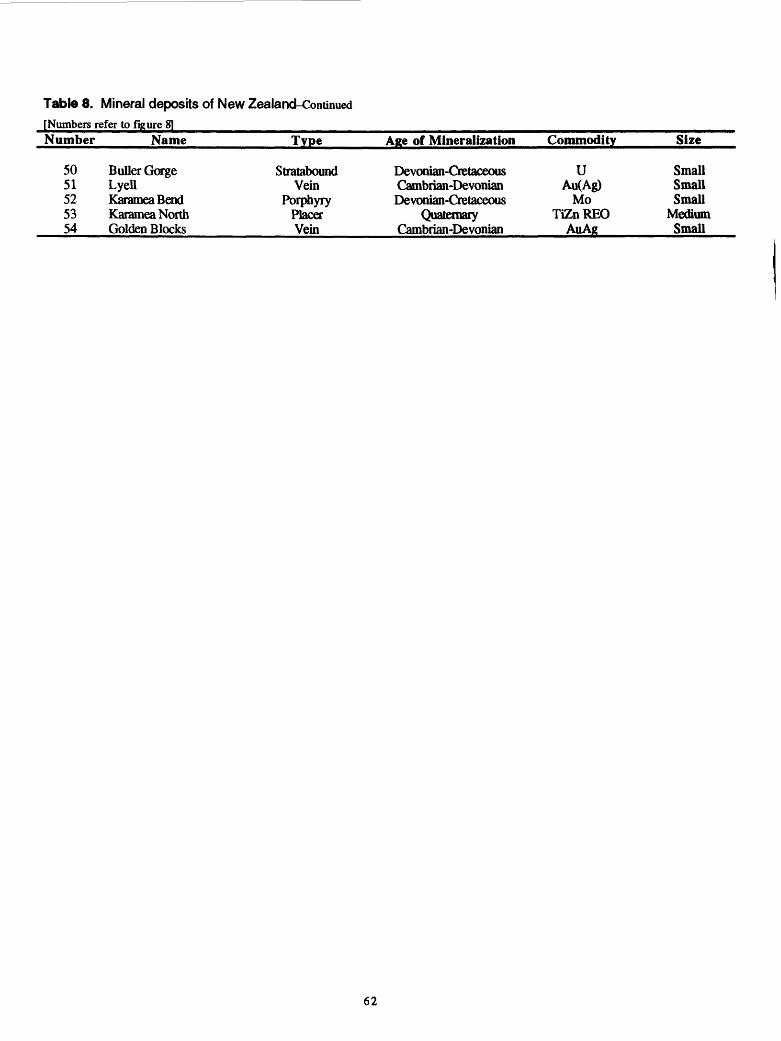
Table 8. Mineral deposits of New Zealand-Continued[Numbers refer to figure 8]_________________Number_____Name __ Type Age of Mineralization Commodity______Size
5051525354
Duller GorgeLyellKarameaBendKaramea NorthGolden Blocks
StrataboundVein
PorphyryPlacerVein
Devonian-CretaceousCambrian-DevonianDevonian-Cretaceous
QuaternaryCambrian-Devonian
UAu(Ag)
MoTiZnREO
AuAg
SmallSmallSmall
MediumSmall
62
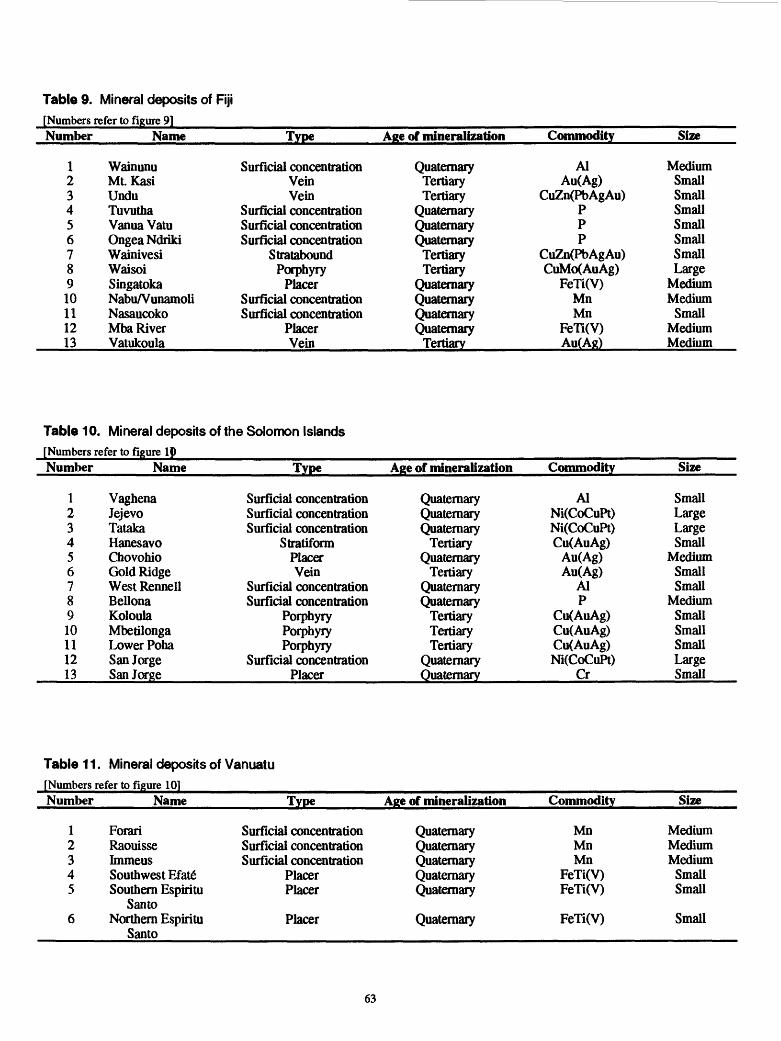
Table 9. Mineral deposits of Fiji[Numbers refer to figure 91Number
12345678910111213
Name
WainunuMt. KasiUnduTuvuthaVanua VatuOngea NdrikiWainivesiWaisoiSingatokaNabu/VunamoliNasaucokoMba RiverVatukoula
Type
Surficial concentrationVeinVein
Surficial concentrationSurficial concentrationSurficial concentration
StrataboundPorphyry
PlacerSurficial concentrationSurficial concentration
PlacerVein
Age of mineralization
QuaternaryTertiaryTertiary
QuaternaryQuaternaryQuaternary
TertiaryTertiary
QuaternaryQuaternaryQuaternaryQuaternary
Tertiary
Commodity
AlAu(Ag)
CuZn(PbAgAu)PPP
CuZn(PbAgAu)CuMo(AuAg)
FeTi(V)MnMn
FeTi(V)Au(Ag)
Size
MediumSmallSmallSmallSmallSmallSmallLarge
MediumMedium
SmallMediumMedium
Table 10. Mineral deposits of the Solomon Islands[Numbers refer to figure 10]Number
12345678910111213
Name
VaghenaJejevoTatakaHanesavoChovohioGold RidgeWest RennellBellonaKoloulaMbetilongaLower PohaSan JorgeSan Jorge
Type
Surficial concentrationSurficial concentrationSurficial concentration
StratiformPlacerVein
Surficial concentrationSurficial concentration
PorphyryPorphyryPorphyry
Surficial concentrationPlacer
Age of mineralization
QuaternaryQuaternaryQuaternary
TertiaryQuaternary
TertiaryQuaternaryQuaternary
TertiaryTertiaryTertiary
QuaternaryQuaternary
Commodity
AlNi(CoCuPt)Ni(CoCuPt)Cu(AuAg)
Au(Ag)Au(Ag)
AlP
Cu(AuAg)Cu(AuAg)Cu(AuAg)Ni(CoCuPt)
Cr
Size
SmallLargeLargeSmall
MediumSmallSmall
MediumSmallSmallSmallLargeSmall
Table 11. Mineral deposits of Vanuatu[Numbers refer to figure 10]Number
12345
6
Name
ForariRaouisseImmeusSouthwest Efate*Southern Espiritu
SantoNorthern Espiritu
Santo
Type
Surficial concentrationSurficial concentrationSurficial concentration
PlacerPlacer
Placer
Age of mineralization
QuaternaryQuaternaryQuaternaryQuaternaryQuaternary
Quaternary
Commodity
MnMnMn
FeTi(V)FeTi(V)
FeTi(V)
Size
MediumMediumMedium
SmallSmall
Small
63

Table 12. Mineral deposits of New Caledonia[Numbers refer to figure 11]Number
12345678910111213141516171819202122232425262728293031323334
Name
PilouLaBaladeMeretriceFern HillCap BocagePoroKouaouaCanalaNaketyThioDent de St. VincentMt HumboldtKouakoue(Unnamed)YateGOTODe OuenPlaine des LacsMontDoreLa TontoutaBourail(Unnamed)Me MaoyaPoyaRaymondKopetoNepouiKoneTemalaTaomOuazangouKaalaTiebaghiPoum
Type
StratiformStratiformStratiform
VeinSurficial concentrationSurficial concentrationSurficial concentrationSurficial concentration
VeinSurficial concentrationSurficial concentration
Irregular magmaticSurficial concentration
Irregular magmaticIrregular magmatic
Surficial concentrationVein
Irregular magmaticIrregular magmatic
StratiformStratiform
Irregular magmaticSurficial concentration
StratiformStratiform
Surficial concentrationPlacer
StratiformStratiformStratiform
Surficial concentrationSurficial concentration
Irregular magmaticSurficial concentration
Age of Mineralization
Devonian-CretaceousDevonian-CretaceousDevonian-Cretaceous
TertiaryQuaternaryQuaternaryQuaternaryQuaternary
TertiaryQuaternaryQuaternary
TertiaryQuaternary
TertiaryTertiary
QuaternaryTertiaryTertiaryTertiaryTertiaryTertiaryTertiary
QuaternaryDevonian-Cretaceous
TertiaryQuaternaryQuaternary
TertiaryTertiaryTertiary
QuaternaryQuaternary
TertiaryQuaternary
Commodity
Cu(AuAg)Cu(AuAg)PbZn,ZnPb
Au(Ag)Ni(CoCuPt)Ni(CoCuPt)Ni(CoCuPt)Ni(CoCuPt)
SbNi(CoCuPt)Ni(CoCuPt)
CrNi(CoCuPt)
CrCrFe
Semi-precious gemsCrCrMnMnCr
Ni(CoCuPt)Cu(AuAg)
MnNi(CoCuPt)
CrMnMnMn
Ni(CoCuPt)Ni(CoCuPt)
CrNi(CoCuPt)
Size
SmallSmallSmallSmall
MediumLargeLarge
MediumSmallLarge
MediumMedium
SmallMediumMedium
SmallSmall
MediumSmallSmallSmallSmall
MediumSmallSmallLargeSmallSmallSmallSmallLarge
MediumLarge
Medium
64
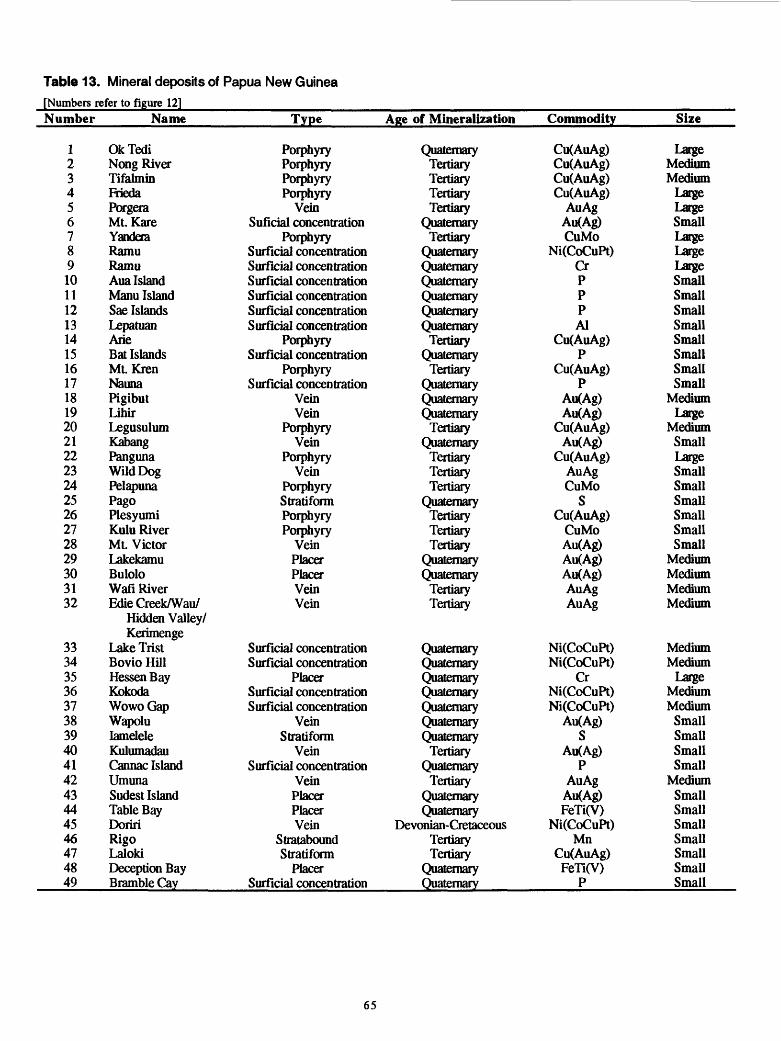
Table 13. Mineral deposits of Papua New Guinea[Numbers refer to figure 12]Number
1234567891011121314151617181920212223242526272829303132
3334353637383940414243444546474849
Name
OkTediNong RiverTifalminFriedaPorgeraMt. KareYanderaRamuRamuAua IslandManu IslandSae IslandsLepatuanArieBat IslandsMt. KrenNaunaPigibutLihirLegusulumKabangPangunaWild DogPelapunaPagoPlesyumiKulu RiverMt. VictorLakekamuBuloloWafi RiverEdieCreekAVau/
Hidden Valley/Kerimenge
Lake TristBovio HillHessen BayKokodaWowoGapWapolulameleleKulumadauCannae IslandUmunaSudest IslandTable BayDoririRigoLalokiDeception BayBramble Cay
Type
PorphyryPorphyryPorphyryPorphyry
VeinSuficial concentration
PorphyrySurficial concentrationSurficial concentrationSurficial concentrationSurficial concentrationSurficial concentrationSurficial concentration
PorphyrySurficial concentration
PorphyrySurficial concentration
VeinVein
PorphyryVein
PorphyryVein
PorphyryStratiformPorphyryPorphyry
VeinPlacerPlacerVeinVein
Surficial concentrationSurficial concentration
PlacerSurficial concentrationSurficial concentration
VeinStratiform
VeinSurficial concentration
VeinPlacerPlacerVein
StrataboundStratiform
PlacerSurficial concentration
Age of Mineralization
QuaternaryTertiaryTertiaryTertiaryTertiary
QuaternaryTertiary
QuaternaryQuaternaryQuaternaryQuaternaryQuaternaryQuaternary
TertiaryQuaternary
TertiaryQuaternaryQuaternaryQuaternary
TertiaryQuaternary
TertiaryTertiaryTertiary
QuaternaryTertiaryTertiaryTertiary
QuaternaryQuaternary
TertiaryTertiary
QuaternaryQuaternaryQuaternaryQuaternaryQuaternaryQuaternaryQuaternary
TertiaryQuaternary
TertiaryQuaternaryQuaternary
Devonian-CretaceousTertiaryTertiary
QuaternaryQuaternary
Commodity
Cu(AuAg)Cu(AuAg)Cu(AuAg)Cu(AuAg)
AuAgAu(Ag)CuMo
Ni(CoCuPt)CrPPPAl
Cu(AuAg)P
Cu(AuAg)P
Au(Ag)Au(Ag)
Cu(AuAg)Au(Ag)
Cu(AuAg)AuAgCuMo
SCu(AuAg)
CuMoAu(Ag)Au(Ag)Au(Ag)AuAgAuAg
Ni(CoCuPt)Ni(CoCuPt)
CrNi(CoCuPt)Ni(CoCuPt)
Au(Ag)S
Au(Ag)P
AuAgAu(Ag)FeTi(V)
Ni(CoCuPt)Mn
Cu(AuAg)FeTi(V)
P
Size
LargeMediumMedium
LargeLargeSmallLargeLargeLargeSmallSmallSmallSmallSmallSmallSmallSmall
MediumLarge
MediumSmallLargeSmallSmallSmallSmallSmallSmall
MediumMediumMediumMedium
MediumMedium
LargeMediumMedium
SmallSmallSmallSmall
MediumSmallSmallSmallSmallSmallSmallSmall
65
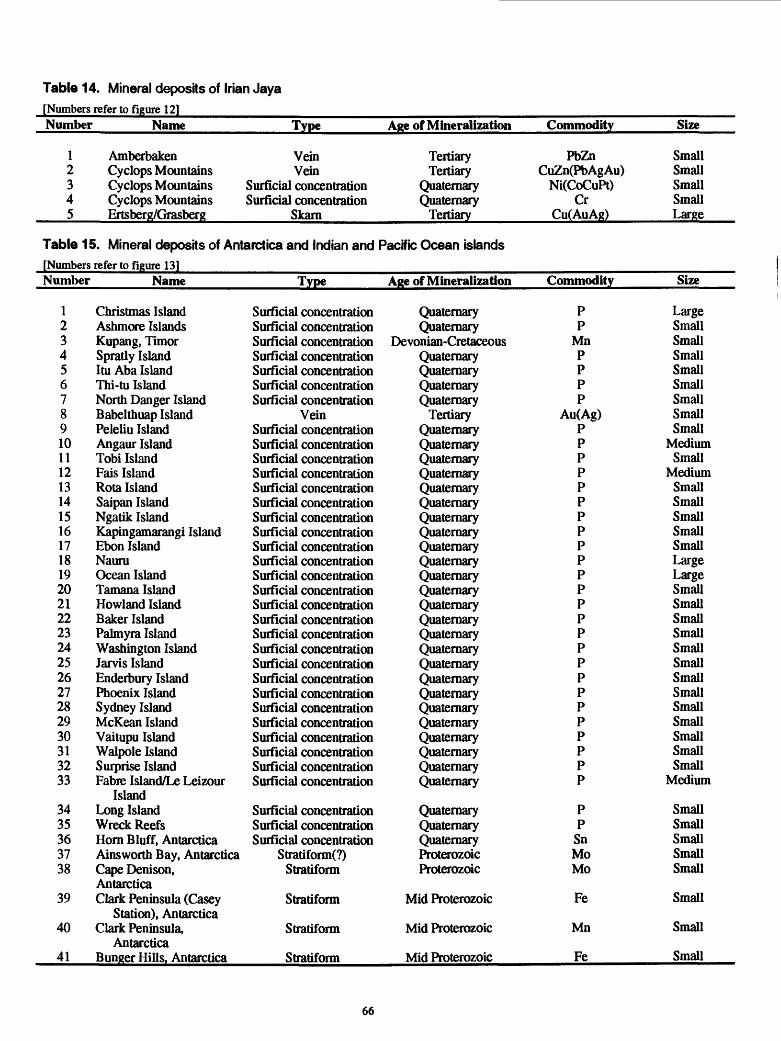
Table 14. Mineral deposits of Irian Jaya[Numbers refer to figure 12]Number
12345
Name
AmberbakenCyclops MountainsCyclops MountainsCyclops MountainsErtsberg/Grasberg
Type
VeinVein
Surficial concentrationSurficial concentration
Skarn
Table 15. Mineral deposits of Antarctica and Indian and
Age of Mineralization
TertiaryTertiary
QuaternaryQuaternary
Tertiary
Pacific Ocean islands
Commodity
PbZnCuZn(PbAgAu)
Ni(CoCuPt)Cr
Cu(AuAg)
Size
SmallSmallSmallSmallLarge
[Numbers refer to figure 13]Number
123456789101112131415161718192021222324252627282930313233
3435363738
39
40
41
Name
Christinas IslandAshmore IslandsKupang, TimorSpratly IslandItu Aba IslandThi-tu IslandNorth Danger IslandBabel thuap IslandPeleliu IslandAngaur IslandTobi IslandFais IslandRota IslandSaipan IslandNgatik IslandKapingamarangi IslandEbon IslandNauruOcean IslandTamana IslandRowland IslandBaker IslandPalmyra IslandWashington IslandJarvis IslandEnderbury IslandPhoenix IslandSydney IslandMcKean IslandVaitupu IslandWalpole IslandSurprise IslandFabre Island/Le Leizour
IslandLong IslandWreck ReefsHorn Bluff, AntarcticaAinsworth Bay, AntarcticaCape Denison,AntarcticaClark Peninsula (Casey
Station), AntarcticaClark Peninsula,
AntarcticaHunger Hills, Antarctica
Type
Surficial concentrationSurficial concentrationSurficial concentrationSurficial concentrationSurficial concentrationSurficial concentrationSurficial concentration
VeinSurficial concentrationSurficial concentrationSurficial concentrationSurficial concentrationSurficial concentrationSurficial concentrationSurficial concentrationSurficial concentrationSurficial concentrationSurficial concentrationSurficial concentrationSurficial concentrationSurficial concentrationSurficial concentrationSurficial concentrationSurficial concentrationSurficial concentrationSurficial concentrationSurficial concentrationSurficial concentrationSurficial concentrationSurficial concentrationSurficial concentrationSurficial concentrationSurficial concentration
Surficial concentrationSurficial concentrationSurficial concentration
Stratiform(?)Stratiform
Stratiform
Stratiform
Stratiform
Age of Mineralization
QuaternaryQuaternary
Devonian-CretaceousQuaternaryQuaternaryQuaternaryQuaternary
TertiaryQuaternaryQuaternaryQuaternaryQuaternaryQuaternaryQuaternaryQuaternaryQuaternaryQuaternaryQuaternaryQuaternaryQuaternaryQuaternaryQuaternaryQuaternaryQuaternaryQuaternaryQuaternaryQuaternaryQuaternaryQuaternaryQuaternaryQuaternaryQuaternaryQuaternary
QuaternaryQuaternaryQuaternaryProterozoicProterozoic
Mid Proterozoic
Mid Proterozoic
Mid Proterozoic
Commodity
PP
MnPPPP
Au(Ag)PPPPPPPPPPPPPPPPPPPPPPPPP
PP
SnMoMo
Fe
Mn
Fe
Size
LargeSmallSmallSmallSmallSmallSmallSmallSmall
MediumSmall
MediumSmallSmallSmallSmallSmallLargeLargeSmallSmallSmallSmallSmallSmallSmallSmallSmallSmallSmallSmallSmall
Medium
SmallSmallSmallSmallSmall
Small
Small
Small
66