Embed Size (px)
Citation preview

Draft (April 2002)
EXPLAINING GROWTH IN BURUNDI: 1960-2000♠
Janvier D. Nkurunziza♣ and Floribert Ngaruko♥
Abstract:
This study analyses Burundi’s economic performance over the period 1960-2000 and finds that it has been catastrophic. The usual economic factors explaining growth are endogenous to political decisions, suggesting that it is politics not economics that explains the dismal performance. This picture particularly limits the relevance of textbook models that rely on the assumption of a competitive resource allocation rule. When cronies rather than qualified managers are running the economy, when priority is given to investment projects in function of their location rather than the objective needs of the economy, the economic model loses its explanatory power. Economic performance has been shaped by the occurrence of violent conflicts caused by factions fighting for the control of the state and its rents. The capture of rents by a small group have become the overarching objective of the successive governments that have ruled the country since shortly after its independence. Therefore, the economic system will not change unless the political system is modernised from a dictatorial regime playing a zero-sum game to a more democratic and accountable regime. Therefore, it would be naïve to propose that economic reforms will boost the country’s economy if they are not preceded or at least accompanied by political reforms. One central message of this study is that Burundi’s poor economic performance is the result of specific identifiable factors evolving around governance. There is nothing fundamentally wrong with Burundi: Development failure may be reversed if the issues identified in the study are properly addressed.
♠ This study is part of the AERC Global Project on “Explaining Africa’s Growth Performance”. AERC’s financial assistance is gratefully acknowledged. The study has greatly benefited from comments by Jan W. Gunning and Léonce Ndikumana on an earlier draft. The authors also wish to thank without implicating William Easterly, Randall Filer and Vittorio Corbo for their valuable comments at the December 2001 GDN Conference in Rio de Janeiro, Brazil. ♣ University of Oxford (CSAE) and Harvard University. E-m. [email protected] ♥ University of Nice (CEMAFI), France. E-mail : [email protected]

2
INTRODUCTION
Burundi is landlocked between Tanzania to the East, the Democratic Republic
of Congo to the West and Rwanda to the North. Over the last decades, the country’s
economic growth performance has been affected by its natural, human and
institutional environment. Burundi has a population of about 6 million people spread
over 27,834 km2. With an urbanisation rate of 7 percent, Burundi’s economy is
essentially rural. Despite having one of the highest population densities in Africa, the
country has been able to feed its people in peaceful periods in spite of its archaic
production techniques. However, population pressure and poor ecological
management, especially during the current civil war, have affected Burundi’s self-
sufficiency. The country’s population is divided into three ethnic groups, though
these are hardly distinguishable based on language, physiological features, cultural
characteristics or geographical settlement. According to a 1956 colonial census, the
Hutu represent 85 percent of the population, the Tutsi 14 percent and the Twa 1
percent1.
Since independence in 1962, ethnic-political feuds and a number of factors
have led to five bloody wars involving the two main ethnic groups. It is estimated that
over the last four decades, more than 500,000 lives have been lost and hundreds of
thousands of Burundians uprooted by the violence, fleeing to neighbouring countries.
These conflicts have resulted from a complex web of factors among which poor
governance is prominent. Most of post-colonial Burundi’s history has been
dominated by military dictatorships, with three Tutsi presidents from the same
province of Bururi and the same commune of Rutovu at the helm of the country for
32 years out of 40 covered by this study (1960-2000)2. They have all shared the
same style of predatory leadership, where the prerogatives of individuals and interest
groups have been put before national interests. This has resulted in a highly
centralised state, imposing its controls in all domains of the country’s social, political
and economic life.
Relative to other African countries Burundi’s growth performance has been
dismal. Even in absolute terms, GDP per capita fell from about 620 dollars to 370
1 Ngaruko and Nkurunziza (2000) provide a discussion of the confusion surrounding the concept of ethnic group in Burundi and the caution needed for its interpretation. 2 Lack of information for the period before 1960 did not allow us to start the analysis from 1950. Even for the period 1960 to 1970, statistical information is sketchy.
3
dollars between 1960 and 1998. The objective of this paper is to explain the reasons
behind this catastrophic performance, by highlighting the salient features of the
growth process and by showing which and how different factors contributed to this
process. It should be stated from the outset that Burundi’s economic performance
has been narrowly associated with political factors. Poor governance has suffocated
individual expression in all forms, frustrating private initiative and leaving economic
activity to a state machinery ill equipped or unwilling to organise an efficient system
of production. Throughout the paper, it is argued that the usual economic factors that
explain growth have been endogenous to political decisions. Politics has shaped
economic outcomes as decision-making over economic variables that explain growth
such as investment, infrastructure, education, trade and employment have been
made on the basis of political considerations.
The study comprises five sections. The first section presents a general picture
of the macroeconomic and sectoral performance of the economy. The aim is to
define the time pattern of growth in Burundi, by dividing the sample period into three
sub-periods, which correspond to two periods of decline and one period of growth.
Using Penn World Tables data on per capita GDP, this periodisation is data driven.
The three sub-periods fit well predictions based on political economy. Sectoral
growth is also reviewed in light of the three sub-periods. The second section
discusses in more details the political economic dimension of growth. As already
mentioned, political economy is at the core of Burundi’s economic growth process.
Sections three and four analyse the microeconomic factors of growth in Burundi.
Section three focuses on the role of goods and factors markets in explaining
Burundi’s disappointing growth performance. Section 4 centres the discussion on
firms and households, two agents whose potentially high contribution to growth has
been frustrated by government misguided policies against private initiative. Section 5
concludes.
1. MACRO AND SECTORAL GROWTH
This section aims to provide an overview of the process of economic growth.
The first sub-section identifies the relevant periods of this process. The second sub-
section decomposes actual growth into growth of the main factors of production. The

4
third sub-section addresses the sectoral contribution to growth, and the fourth sub-
section compares Burundi’ growth experience to other countries.
1.1. Periodization
The period of study, which covers four decades from 1960 to 2000, can be
divided in three sub-periods. These are suggested by Burundi’s political history as
well as the evolution of the country’s economic performance. Figure 1 shows that the
trend estimated from a third order polynomial adjusts well to the evolution of GDP
per capita. The parameters of this function are given in equation 1:
3 2
2
0.0545 3.2788 53.095 665.35
0.8135CAPGDP t t t
R
= − + − +
= (1)
where CAPGDP represents real GDP per capita in year t . As figure 1 shows, the
process of Burundi’s economic growth unfolded along atypical patterns in
comparison with the rest of Africa where economic growth was relatively strong
between 1960 and 1973. Most countries experienced two decades of stagnation or
decline since then, while this was a period of growth in Burundi. From 1994, many
African countries have enjoyed a modest recovery, while Burundi has slid into an
unprecedented crisis. This points to the fact that constraints such as those
associated with international markets only play a modest role in explaining economic
growth and stagnation in Burundi, thus suggesting that specific and internal factors
are more important. The periodization proposed aims to emphasize these factors.
Figure 1: Evolution of GDP per Capita (1960-1997)
320
370
420
470
520
570
620
60 62 64 66 68 70 72 74 76 78 80 82 84 86 88 90 92 94 96
GD
P p
er C
apita
Real GDP per Capita Poly. (Real GDP per Capita)

5
As figure 1 shows, the first sub-period (1960 –1972) is characterised by a steady
decline in per capita GDP. The second sub-period (1972-1988), corresponds to a
steady increase in per capita GDP, and the third sub-period (1988-to date) is
characterised by a deepening economic crisis.
1960-1972: The decline during this period is due to a number of shocks that hit
Burundi’s economy. First, in 1960, when Congo became independent, Burundi lost
half of its Eastern Congolese export market, resulting in large trade deficits. Second,
in 1962, Burundi and Rwanda gained independence from Belgium. As a result,
Burundi lost progressively its Rwandan export market for industrial products as
Rwanda developed its own industrial sector compounding the poor performance of
the country’s external sector. Third, the colonial power left a legacy of high ethnic
tensions, especially at a time of stiff competition for the control of state institutions
and some assets left by Belgians. These tensions paralysed institutions culminating
in the first political violent conflict in 1965. Fourth, decolonisation also resulted in
scarcity of qualified manpower and capital stock. As a result, industrial production
plummeted, with firm capacity utilisation dropping to about 25 percent in 1962-63.
This was worsened by ferocious fights for influence among different political, regional
and ethnic groups that did not care about the economy. During this period, Burundi’s
economic growth was lower than the African average and much lower than Asian
highly performing countries.
1972-1988: On the political front, this period was characterised by a relative calm
warranted by a highly repressive regime. The period followed the 1972 massacres in
which thousands of Tutsi were killed by a group of Hutu rebels, triggering a
horrendous repression by the Tutsi-dominated army throughout the country. Most
Hutu able to exercise any political, administrative, or economic power were targeted
and physically eliminated. The massacres were followed by a long period of political
repression until the fall of the Bagaza regime in 1987. From 1975, in addition to an
increase in coffee export earnings following severe frosts in Brazil, the country
embarked on a massive programme of investment, financed mostly through foreign
resources. A number of public corporations were created without any concerns
regarding their economic viability. Used as political instruments for rent collection
6
and distribution among the political elite, the management of these corporations
involved massive transfers of subsidies, crowding out resources for productive
investment. These policies were consistent with the efforts to embark on
government-led growth based on large-scale public projects and companies mostly
financed by aid and debt. This period experienced positive rates of economic growth.
However, the widening budget deficits and the costs of servicing the debts
contracted in the 1970s became unsustainable. In 1986, Burundi adopted a
structural adjustment programme. To economic difficulties was added the 1988 civil
war, a result of political tensions that had been brewing during the preceding long
period of repression.
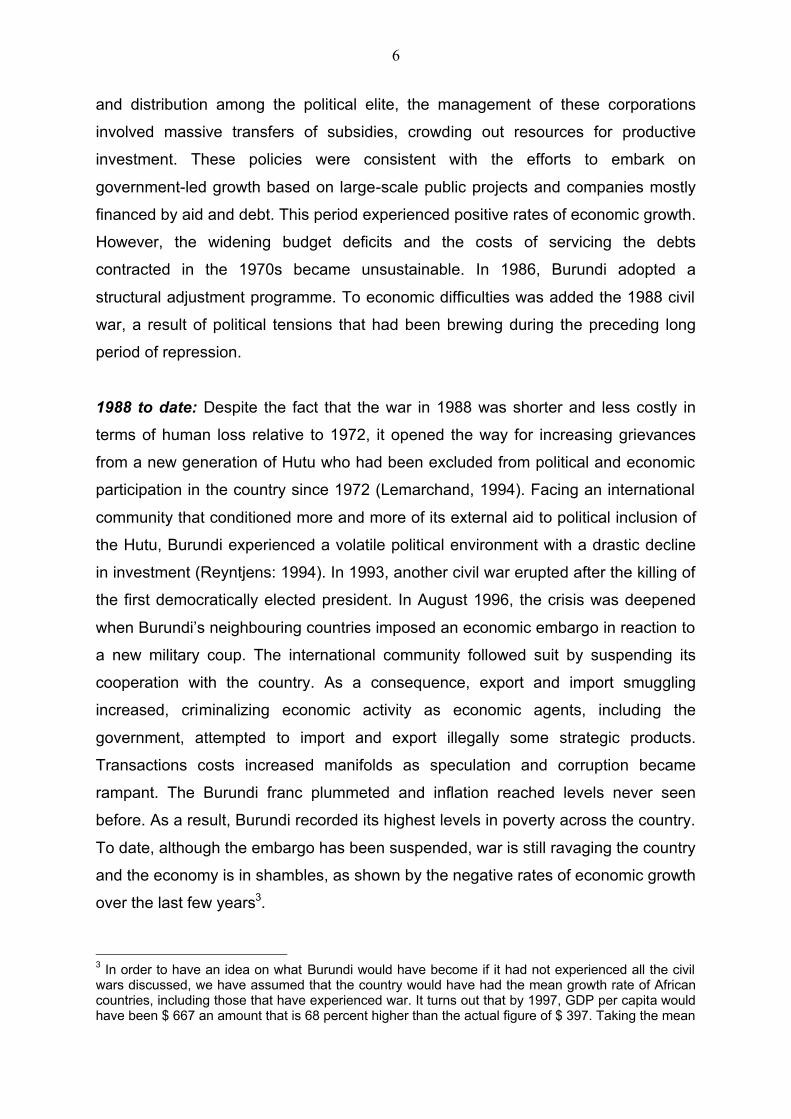
1988 to date: Despite the fact that the war in 1988 was shorter and less costly in
terms of human loss relative to 1972, it opened the way for increasing grievances
from a new generation of Hutu who had been excluded from political and economic
participation in the country since 1972 (Lemarchand, 1994). Facing an international
community that conditioned more and more of its external aid to political inclusion of
the Hutu, Burundi experienced a volatile political environment with a drastic decline
in investment (Reyntjens: 1994). In 1993, another civil war erupted after the killing of
the first democratically elected president. In August 1996, the crisis was deepened
when Burundi’s neighbouring countries imposed an economic embargo in reaction to
a new military coup. The international community followed suit by suspending its
cooperation with the country. As a consequence, export and import smuggling
increased, criminalizing economic activity as economic agents, including the
government, attempted to import and export illegally some strategic products.
Transactions costs increased manifolds as speculation and corruption became
rampant. The Burundi franc plummeted and inflation reached levels never seen
before. As a result, Burundi recorded its highest levels in poverty across the country.
To date, although the embargo has been suspended, war is still ravaging the country
and the economy is in shambles, as shown by the negative rates of economic growth
over the last few years3.
3 In order to have an idea on what Burundi would have become if it had not experienced all the civil wars discussed, we have assumed that the country would have had the mean growth rate of African countries, including those that have experienced war. It turns out that by 1997, GDP per capita would have been $ 667 an amount that is 68 percent higher than the actual figure of $ 397. Taking the mean

7
1.2. Growth Accounting for the 1960 to 1997 Period
Collins and Bosworth (1996) provide a decomposition of actual growth in GDP
per capita per worker into growth in physical capital per worker, education per
worker, and total factor productivity (TFP) residual, set out in equation (2):
ahlk
lq
+−+= )1( αα (2)
where lq ,
lk , h and a represent the growth of output per worker, the growth of
physical capital per worker, the growth of education per worker, and the growth of
the total factor productivity, respectively. We attempted to decompose Burundi’s
economic growth along the same lines over the period 1960-1997. Human capital is
proxied by the secondary school enrolment ratio, in spite of the inherent limits of this
indicator (Gemmell, 1996), due to the lack of data on alternative proxies4.
Concerning labour workforce and physical capital per capita, we made three
assumptions. The first assumption concerned the definition of a worker. Burundi has
a pre-industrial economy dominated by subsistence agriculture that involves over 90
percent of the population. Everybody is potentially a landowner who has the choice
to farm his land for a living. Even urban dwellers are landowners who are often
immigrants from rural areas. In such an economy, full unemployment is potentially
rare except for a very small proportion of the urban population. Therefore, we
assume that the population over 15 years constitutes the group of workers.
The second assumption concerns physical capital per worker. As data for
physical capital per worker are difficult to find, we estimated them assuming that
Burundi had the same physical capital per worker as the average of sub-Saharan
Africa, that is, US $ 1069 in 1990. Likewise, following Collins and Bosworth (1996),
we assumed that the annual rate of geometric depreciation of physical capital
amounts to 0.04. As the authors argue, even though estimated physical capital might
differ from actual data for the benchmark year, this does not have an important
impact when they are adjusted by long time series of investment. Thus, tlk / , the
growth rate of countries that have experienced no war would increase the figure even further. This simple figure gives an idea on the cost of Burundi policies over the years post-1960. 4 Gemmell (1996) argues that school enrolment rates conflate the level effects of this factor and blurs the distinction between human capital and the growth in labour force.

8
amount of physical capital per worker for year t , was determined based on equation
(3):
11 )04.01(// −− +−= ttt yilklk (3)
where i is the ratio of investment over GDP per capita y . The third assumption
concerns data on workers. Assuming that α amounts to 0.35 as generally assumed
(Ndulu and O’Connel, 2000; Collins and Bosworth: 1996), we found that while
between 1960 and 1997, GDP per capita decreased by more than 40 percent,
physical capital per capita had been multiplied by 58 and the human capital by 5;
TFP had been divided by 25.
Overall, these figures conform to Burundi case. While investment had been
made in line with relative scarcity before independence in 1962 to cater for the
Belgian colonial needs, thus having a positive impact on economic growth, the
pattern changed after independence. In the post-independence period investment
has been generally allocated based mostly on non-economic needs. Decision-
making has evolved around rent seeking through regionalism, clientelism, nepotism
and patronage. This picture particularly limits the relevance of the Collins-Bosworth
model, which relies on the assumption of an investment allocation rule based on a
competitive environment. When cronies rather than qualified managers are running
the economy, when priority is given to investment projects in function of their location
rather than the objective needs of the economy, it is not surprising that TFP
decreases (Easterly, 2001). As a consequence, despite an apparent large increase
in investment, which became predominantly public since the 1970s, jumping from 5.6
percent of total investment in the early 1970s to 42.8 percent in 1980, effective
increase in relevant physical capital was modest. As a result, GDP per capita
decreased, thus reducing TFP. This picture, however, suffers from an important
limitation: it does not distinguish between periods of peace and periods of war.
9
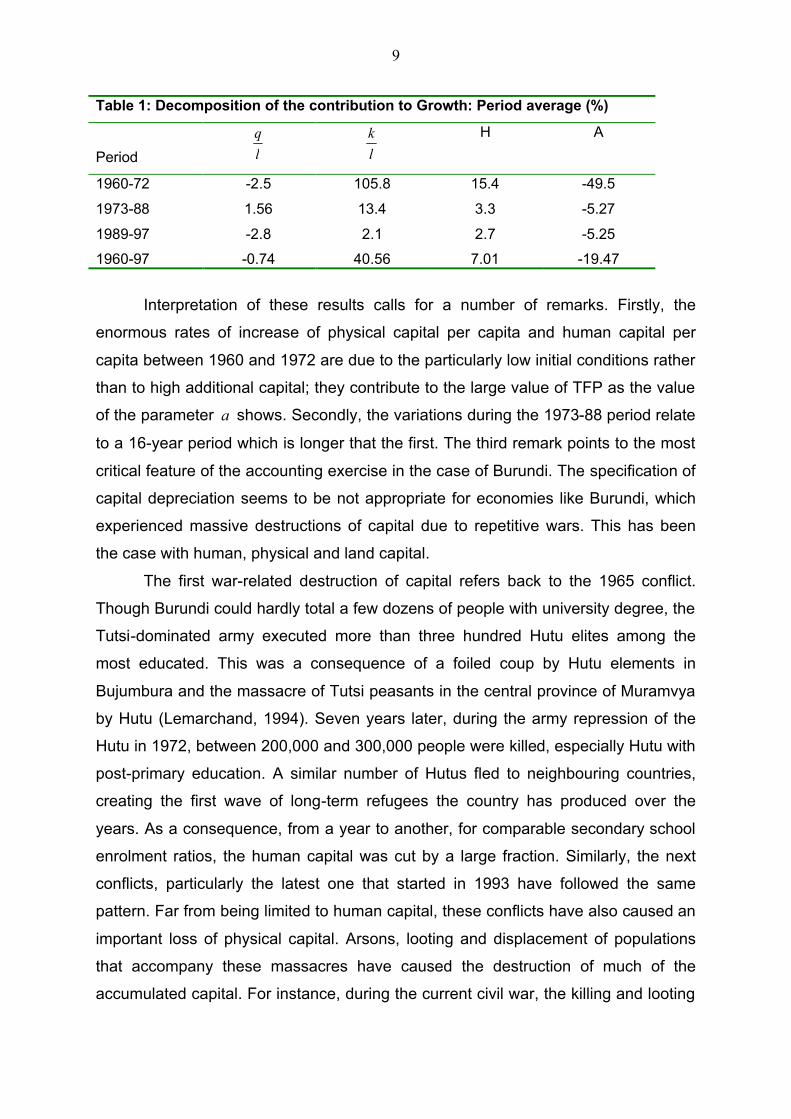
Table 1: Decomposition of the contribution to Growth: Period average (%)
Period lq
lk
H A
1960-72 -2.5 105.8 15.4 -49.5
1973-88 1.56 13.4 3.3 -5.27
1989-97 -2.8 2.1 2.7 -5.25
1960-97 -0.74 40.56 7.01 -19.47
Interpretation of these results calls for a number of remarks. Firstly, the
enormous rates of increase of physical capital per capita and human capital per
capita between 1960 and 1972 are due to the particularly low initial conditions rather
than to high additional capital; they contribute to the large value of TFP as the value
of the parameter a shows. Secondly, the variations during the 1973-88 period relate
to a 16-year period which is longer that the first. The third remark points to the most
critical feature of the accounting exercise in the case of Burundi. The specification of
capital depreciation seems to be not appropriate for economies like Burundi, which
experienced massive destructions of capital due to repetitive wars. This has been
the case with human, physical and land capital.
The first war-related destruction of capital refers back to the 1965 conflict.
Though Burundi could hardly total a few dozens of people with university degree, the
Tutsi-dominated army executed more than three hundred Hutu elites among the
most educated. This was a consequence of a foiled coup by Hutu elements in
Bujumbura and the massacre of Tutsi peasants in the central province of Muramvya
by Hutu (Lemarchand, 1994). Seven years later, during the army repression of the
Hutu in 1972, between 200,000 and 300,000 people were killed, especially Hutu with
post-primary education. A similar number of Hutus fled to neighbouring countries,
creating the first wave of long-term refugees the country has produced over the
years. As a consequence, from a year to another, for comparable secondary school
enrolment ratios, the human capital was cut by a large fraction. Similarly, the next
conflicts, particularly the latest one that started in 1993 have followed the same
pattern. Far from being limited to human capital, these conflicts have also caused an
important loss of physical capital. Arsons, looting and displacement of populations
that accompany these massacres have caused the destruction of much of the
accumulated capital. For instance, during the current civil war, the killing and looting
10
of livestock –a particularly prized capital asset for rural households– have caused a
decline from 2.6 million heads to 1.8 million from 1993 to 1999, implying a fall of 31
percent.
HIV/AIDS is another source of human capital destruction that is gaining
prominence. Recent figures suggest that HIV prevalence has increased rapidly since
the early 1980s, accelerating during the current civil war due to population
displacements, army and rebel movements and promiscuity in displacement camps.
The prevalence rate in cities has increased from 1% in 1983 to 15.1% in 1993, and
to 21% in 1997, against 0.73% in 1989 to 5.9% in 1997 in rural areas (The World
Bank, 1999). According to UNAIDS statistics, Burundi is the 13th most severely
affected country in Africa in terms of AIDS prevalence. No doubt that by its ravages
within educated urban elites, HIV has had a severe impact on the stock of human
capital weakening the relevance of the estimation of human capital productivity along
Collins and Bosworth model5.
Thus, the rates of growth of physical and human capital in Burundi are likely
to be over-estimated, at least in two respects. First, the figures estimated by the
Collins-Bosworth model do not take into account the shocks just discussed.
Secondly, with time, the actual path of capital accumulation has diverged from that
suggested by the Collins-Bosworth model due to the persistence effect of these
shocks. Therefore, today, 35 years after the country experienced the first shocks, the
figures suggested by the parameters of Table 1 have little to do with reality. As a
result, the values of lk / , h and a are over-estimated, implying that productivity is
likely much higher than suggested in Table 1.
1.3 Sectoral Contribution to Growth
An important part of the economic literature emphasizes that there is a
transformation of sectoral shares of labour and output in the course of economic
development (Chenery and Syrquin: 1975). According to this literature, productivity
increases in the traditional sector (agriculture) underpin the movement of labour
towards modern sectors (industry, services), thus rising overall per capita incomes.
However, other economists argue that in Africa, over-taxation of agriculture has
5 Easterly (2001) provides a detailed critique of the growth accounting exercise based on the Solow growth model.
11
impeded its structural transformation, thus limiting its contribution to long-term
growth (Bates: 1981). On the other hand, approaches emphasizing governance and
civil strife suggest that the bias has been against the manufacturing sector in Africa.
Regarding the first hypothesis, Burundian figures illustrate a rather paradoxical
situation.
During the 5 half-decades from 1965 to 1990, Burundi’s growth rates were higher
than African averages, though lower than those of developing countries as a whole.
Burundi’s rates amounted respectively to 2.1%, 3.8%, 2.1%, 0.46% and 2.5%,
against respectively 1.6%, 2.1%, 0.93%, -0.85% and 0.9% for Sub-Saharan African
countries. Yet, this performance does not show any significant sectoral
transformation of Burundi’s economy. Agriculture represents the largest contribution
to aggregate GDP in Burundi. Its share in GDP has fallen from 60 percent in the
1970s to about 50 percent in the 1990s. Over the same period, the average for Sub-
Sahara African countries decreased from 35% to 30%, against rates of 27% to 21%
for developing countries as a group. Industry benefited more than services from this
relative decline of agriculture in Burundi, while it was the converse in the rest of
Africa. Thus, while industry’s share in GDP increased from 15.3% to 20.8% in
Burundi, services went from 25.4% to 30.3%. For sub-Saharan Africa, these shares
grew respectively from 23.6% to 25.8% for industry, and from 41.2% to 44.2% for
services.
To some extent, this evolution of African economies consisted in a convergence
towards the expected sectoral structure, given the continent’s income and population
patterns. Estimation of fixed effects by O’Connel and Ndulu (2000) based on
Chenery and Syrquin model shows that given its income and population level, Sub-
Sahara Africa service sector is smaller, but industry and manufacturing sector are
larger than would be expected based on cross country norms. Furthermore, this
estimation shows that the share of labour force in agriculture is larger, and that
labour productivity differential in favour of non-agricultural sectors tends to be much
higher in Africa than in other regions. In this line, the case of Burundi seems atypical
by its lack of convergence. Actual data on agriculture’s share in labour force and the
ratio of agriculture versus non-agriculture labour productivity and fitted values of
these two variables produce large and increasing residuals over time (Ndulu and
O’Connel, 2000), thus illustrating that Burundi diverges from the rest of the continent.

12
Figure 2: Burundi: Evolution of Sectoral Share of GDP, 1970-1997 (%)
10
15
20
25
30
1970-74 1975-79 1980-84 1985-89 1990-97
Indu
stry
, Ser
vice
s an
d M
anuf
actu
re
45
50
55
60
Agr
icul
ture
Industry Services Manufactures Agriculture
In Burundi, agriculture share in labour force fell from 95 percent in the 1960s to
91 percent in the 1990s. Such an evolution is not distinctive from the one in other
African and developing countries. What is distinctive is that this decrease was more
important in other parts of the world, suggesting that sectoral transformation was
relatively marginal in Burundi, where the share remained one of the highest. The
share remained over the mean of these groups of countries, as well as over the one-
standard deviation margin of developing countries. Thus, while this share went from
73% to 68% for sub-Saharan Africa between 1975-79 and 1985-89 periods, and
from 54% to 49% for the group of developing countries, it remained almost
unchanged in Burundi from 93% to 92% over the period. This evolution can also be
illustrated by productivity pattern in agriculture. Between 1975 and 1989, non-
agriculture versus agriculture average labour productivity ratio decreased from 9.5 to
8.7 in sub-Saharan Africa, and from 6.6 to 5.9 for developing countries as a whole.
Over the same period, the ratio rather increased in Burundi from 9.8 to 11.6,
illustrating a relative decline in agriculture labour productivity. These figures show
that Burundi’s relatively strong economic growth was not accompanied by notable
sectoral transformation.
Productivity differentials in agriculture show an atypical evolution of Burundi
relative to the rest of African countries and even much more relative to highly
performing Asian countries. This implies two suggestions. First, in Burundi,
investment and growth took place at the expense of agriculture. The second
suggestion is that through this allocation, Burundi diverged from a competitive

13
equilibrium, since the productivity gap across sectors tended to widen as Figure 3
shows.
Figure 3: Burundi: GDP per capita and Productivity in Agricuture (1970-1990)
320
370
420
470
520
570
70 71 72 73 74 75 76 77 78 79 80 81 82 83 84 85 86 87 88 89 90
Rea
l GD
P p
er C
apita
198
5 in
t'l p
rices
(yn
85)
0.5
0.54
0.58
0.62
0.66
0.7
Agr
i's s
hare
in G
DP
95
over
Agr
i's s
hare
of l
abor
fo
rce
Rat
io (
ay95
/als
h)
yn85 ay95/alsh
These suggestions point to heavy policy distortions, and this question will be
addressed from a distribution standpoint. More specifically, four hypotheses are
explored to explain the patterns of economic growth in Burundi. First, farmers have
been over-taxed through several channels, including cash crop producer prices and
exchange rate policy, preventing accumulation in agriculture and the transformation
of the sector. Secondly, while the industrial sector has benefited from the massive
external borrowing that took place from the mid-70s, the process disconnected
economic growth captured by the evolution of GDP per capita, from productivity in
agriculture (Figure 3). Thirdly, the creation of state-owned enterprises resulted in
bureaucratic expansion and predation to the benefit of the elite. Fourthly, the ensuing
public deficits increased taxation on private manufactures to secure massive
subsidies for poorly managed public enterprises. This pressure was transmitted to
agriculture through manufactures relying on agriculture inputs.
1.4. Growth Regression Evidence
The limits highlighted in the growth accounting exercise of the second sub-
section are also relevant for the cross-country comparison, inasmuch as this
comparison relies on data that does not account for losses caused by political
instability. Moreover, comparing Burundi to other countries and groups of countries
raises an additional serious problem of data comparability. The 1985 international
prices based data on economic growth on which the previous analysis relied, and

14
which are the reference for the analysis in the next sections are so divergent with the
GDN data, on which the cross-country comparison rests that it is difficult to develop
a coherent explanation articulated on both sources over the 1960-2000 period.
Figure 4 plots per capita GDP growth rates based on these two sources to show
their inconsistency.
Figure 4: Real GDP per capita grow th rates
-20
-10
0
10
20
30
40
61 63 65 67 69 71 73 75 77 79 81 83 85 87 89 91 93 95 97
Year
Gro
wth
rat
es
"int'l prices" data
GDN Data
As figure 4 shows, the most important divergences relate to the 1960-1974
period. We suggest an intermediary solution, consisting in the comparison of Burundi
to other countries and regions for the period 1975-1997 only. In this line, given the
features already outlined concerning growth in Burundi, we chose some variables
covering many aspects, to show the position of Burundi relative to different groups of
countries. These variables cover the aspects including initial conditions (initial
income), structural endowments (“landlocked” variable), exogenous shocks (terms of
trade), and a proxy of policy quality, institutions and political instability (black market
premium). Table 2 provides the results on the position of Burundi relative to different
groups of countries.
15
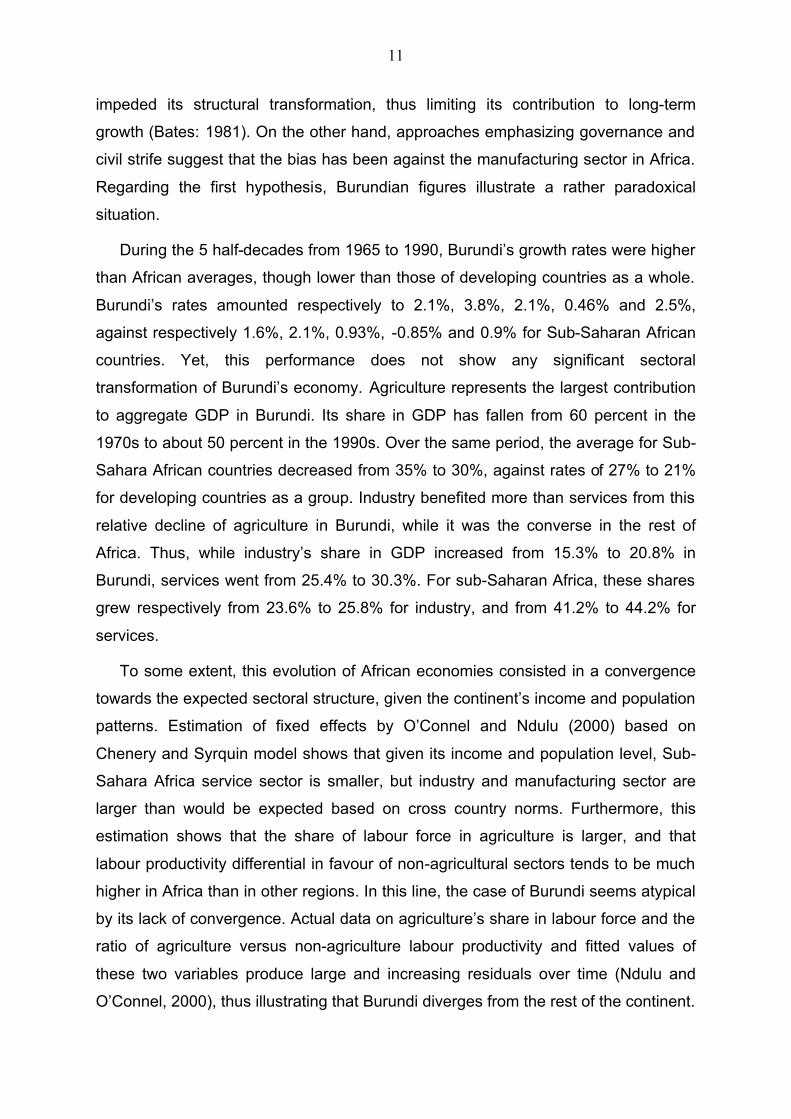
Table 2: Factors of Growth: Burundi Compared to Africa and Asia
Position of Burundi Relative to SSA and HPAE 75-79 80-84 85-89 90-97
Explanatory Factors of Growth
Expl. Power* SS
A HPAE SS
A HPAE SS
A HPAE SS
A HPAE
Real GDP per Capita Growth Rate - c A c a c b a a Initial Income (expressed in log) High a A a a b a b a Landlocked High d D d d c d d d Cumulative Terms of Trade Shocks None c D c c b c c b Black Market Premium High b D b d b d d d Initial Life Expectancy High b A b a b a a a Age Dependency Ratio High c D c d c d c d Growth in Potential Labour Force High d A c a a a b a Trade-wt Growth Rate of GDP per Capita, Trading Partners
High b A b a b a b a
Political Instability High b A b b b d c d Inflation Low c D b b c c d d Extended Barro-Lee Gov’t Spending (% GDP)
High b D b d n.a. n.a. n.a. n.a.
Ln Ratio of Investment to GDP (%) b A c a c a n.a. n.a. Notes: * High, low and none explanatory power respectively apply to 1%, 25% and more than 50% of error, these parameters resulting from OLS multivariate regression of different factors over economic growth of real GDP per capita; blanks mean that the variables are not included in the regression: they are included in Table 2 just for comparative purposes of Burundi’s position relative to SSA and HPAE groups of countries; (a): Burundi falls below the mean of the group of countries and below the one-standard deviation margin; (b): Burundi falls below the mean of the group of countries but within the one-standard deviation margin; (c): Burundi falls over the mean of the group of countries but within the one-standard deviation margin; (d): Burundi falls over the mean of the group of countries and over the one-standard deviation margin; (n.a.): Not available; SSA: Sub-Saharan Africa; HPAE: Highly Performing Asian Economies.
As Table 2 shows, Burundi’s particularly low initial income confirms the weak
initial conditions. Coupled with the relatively high growth rate, at least relative to sub-
Saharan African countries from 1975 to 1989, this suggests that up to the onset of
the current civil war in 1993, the dynamics of Burundi’s economy seems to support
the conditional convergence hypothesis emphasized by O’Connel and Ndulu (2000,
p. 11). This is so despite the structural factors discussed earlier and those
highlighted in Table 2, including the geographical constraints imposed by the lack of
access to the sea.
In the 1990s, the civil war reversed the gains of the previous periods. For
most of the variables, Africa was worse off relative to the groups of developing
countries. Table 2 also shows that foreign exchange policy worsened during the
16
1990-97 period, when most other countries’ official and informal markets tended
rather towards convergence (Nkurunziza, 2000b). The data on some key explanatory
factors such as age dependency ratio as a proxy for health conditions, black market
premium as a proxy for government controls over the economy and inflation from
1990 to 1997 are consistent with a war economy. Cukierman et al. (1992) have
noted that inflation increases in periods of political instability, which is the case in
Burundi. The impact of growth of the ratio of people between 15 to 65 years of age
(potential labour force) is more difficult to explain. Given the evolution of the position
of Burundi relative to the rest of Africa, one could hypothesize that this growth was
important as a demographic response to the toll caused by the 1972 civil war, which
had particularly hit this segment of the population.
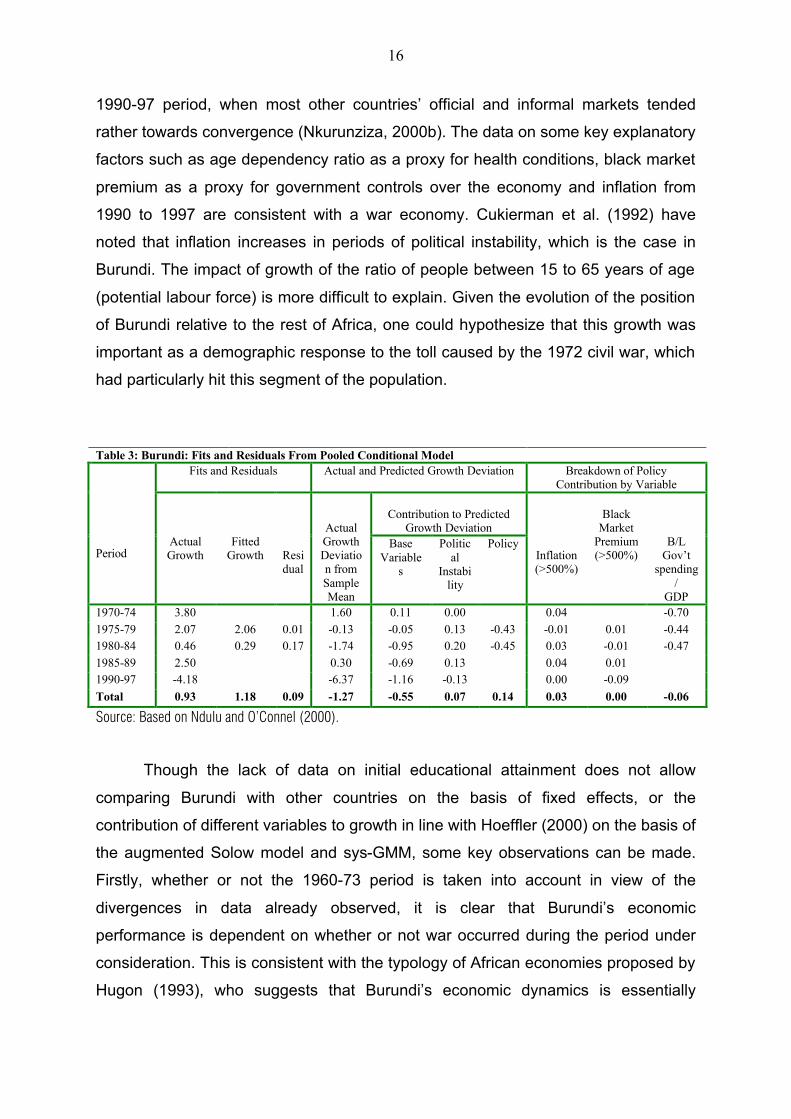
Table 3: Burundi: Fits and Residuals From Pooled Conditional Model
Fits and Residuals Actual and Predicted Growth Deviation Breakdown of Policy Contribution by Variable
Contribution to Predicted
Growth Deviation
Period
Actual Growth
Fitted Growth
Residual
Actual Growth Deviation from Sample Mean
Base Variable
s
Political
Instability
Policy
Inflation (>500%)
Black
Market Premium (>500%)
B/L Gov’t
spending/
GDP 1970-74 3.80 1.60 0.11 0.00 0.04 -0.70 1975-79 2.07 2.06 0.01 -0.13 -0.05 0.13 -0.43 -0.01 0.01 -0.44 1980-84 0.46 0.29 0.17 -1.74 -0.95 0.20 -0.45 0.03 -0.01 -0.47 1985-89 2.50 0.30 -0.69 0.13 0.04 0.01 1990-97 -4.18 -6.37 -1.16 -0.13 0.00 -0.09 Total 0.93 1.18 0.09 -1.27 -0.55 0.07 0.14 0.03 0.00 -0.06
Source: Based on Ndulu and O’Connel (2000).
Though the lack of data on initial educational attainment does not allow
comparing Burundi with other countries on the basis of fixed effects, or the
contribution of different variables to growth in line with Hoeffler (2000) on the basis of
the augmented Solow model and sys-GMM, some key observations can be made.
Firstly, whether or not the 1960-73 period is taken into account in view of the
divergences in data already observed, it is clear that Burundi’s economic
performance is dependent on whether or not war occurred during the period under
consideration. This is consistent with the typology of African economies proposed by
Hugon (1993), who suggests that Burundi’s economic dynamics is essentially
17
explained by war versus peace logic. As Table 3 shows, the deviation in Burundi’s
actual economic growth from the sample mean is a function of war, implying that a
model that fails to take in account the latter variable fails to capture a key feature of
Burundi’s economic growth. On the other hand, while Table 3 confirms the
importance of basic economic variables (life expectancy at birth, initial conditions,
age dependency ratio, growth in potential labour force participation, terms of trade
shocks, trade partner growth rates and the country’s landlocked status), it highlights
the role of policies. Among the latter, government spending has a particularly
important impact.
In summary, developments and evidence in this section have shown that
observed economic growth in Burundi was not rooted within the economic structure.
It was due to massive government spending owing to foreign borrowing and
favourable international prices of coffee, the country’s main export, but achieved little
structural transformation of the economy. This was emphasized both by data on
sectoral transformation and the absence of a demographic transition captured by the
unfavourable evolution of the age dependency ratio. As discussed in detail in the
following section, these failures stem from a lopsided distributive policy that has
culminated in five episodes of civil war, destroying the gains achieved during the
previous periods. Thus, in the remaining part of the paper, the problem of
governance will remain a central feature in explaining Burundi’s economic growth.
2. POLITICAL ECONOMY
This section provides a review of Burundi’s political evolution over the period
1960-2000 with special emphasis on how political factors impacted on economic
growth.
2.1. Political and Economic Evolution
Post-colonial political history corresponds to the three-period trajectory
delineated in the previous section. However, the political evolution within each period
is non-linear, particularly during the first and the third periods, which are
characterized by unstable political equilibria. In this section, we focus on four
elements: the duration of different forms of governments, the duration of different
18
political regimes, the dates of major policy changes and the periods of the signing of
particular international agreements.
2.1.1. The Forms of Governments Between 1960 and 2000
When Burundi became independent from Belgium on 1 July 1962, it was a
monarchy. The struggle for independence had assembled politicians from the two
major ethnic groups, namely the Hutu, and the Tutsi in UPRONA party, which won
legislative elections in September 1961. As this party was largely built on democratic
values, expectations were that Burundi would evolve towards a parliamentarian
monarchic political regime. However, the assassination in October 1961of Prince
Louis Rwagasore, the leader of UPRONA, and the political crisis that followed his
death changed the political atmosphere in the country. King Mwambutsa IV, a weak
leader, succumbed to intrigues and political games, sometimes making partial
interventions. Burundi experienced a crisis fuelled by a merciless political
competition along ethnic lines, prompting Hutu leaders to stage a coup. The coup
failed and was bloodily repressed by killing most senior Hutu politicians, resulting in
a de facto elimination of the Hutus from the political scene. These events led to the
country’s first civil war in 1965. In its aftermath, Captain Michel Micombero staged a
military coup in 1966, deposing the centuries-old monarchy and replacing it with a
republican regime.
Military rule put an end to the shaky democratic institutions that had prevailed
before but did not manage to restore political stability. On the contrary, its policies
exacerbated the crisis. The Micombero government dissolved parliament and
established a single-party repressive system. The Tutsi ethnic group, specifically
those from the Southern province of Bururi dominated this regime. The president,
key ministers and their advisors, as well as the army commanders were all from
Bururi. By the early 1970s, Hutu and non-Bururi Tutsi had been sidelined in the
control of the country’s political institutions. As a result, opponents to Bururi regime
were not only the Hutu but also the Tutsi from the rest of the country. Tutsi from
Bururi colluded to marginalize the traditionally influential Tutsi from Muramvya, as
the latter region had been the cradle of pre-colonial monarchic institutions.

19
In this context, Tutsi leaders from Muramvya were imprisoned en masse in
1971 after being accused of plotting to overthrow the military regime. Afterwards, in a
coup attempt in April 1972, Hutu rebels massacred a large number of Tutsi families,
particularly in the South of the country. In the repression that followed, about 18
percent of the Hutu population perished; almost all educated Hutus with secondary
or university education were physically eliminated. The 16-year period that followed
the events was relatively calm, but it is during the same period that two bloodless
palace coups led by officers from the same commune of Rutovu in the province of
Bururi arranged for the replacement of Micombero by Colonel Jean-Baptiste Bagaza
in 1976, and the latter by Major Pierre Buyoya in 1987.
Despite the elimination of Hutu and the non-Southern Tutsi threats, political
fights went on this time within a narrow intra-ethnic and intra-regional space among
the ruling élite. Fights opposed political leaders from Matana commune to those from
Rutovu commune, both in the same Bururi province. In the late 1980s, in-fights were
between the Bayanzi and the Bashingo clans of Bururi Tutsi. The period 1972-88
was an era of drastic discrimination against the Hutus and non-Bururi Tutsi. Its main
manifestation was through the privileges enjoyed by Bururi Tutsi in accessing
primary, secondary and university education, including access to overseas
scholarships, relative to Burundians from other regions. Illustrating the extreme
concentration of high education among people from Bururi, Jackson (2001) notes
that just one commune of Bururi province, Mugamba, accounts for 15 percent of the
6000 students of the University of Burundi. The fact that the latter was the country’s
single institution of higher education until the creation of the new private University of
Ngozi which numbered less than 500 students in 2000, shows clearly how state
institutions have been captured by the ruling élite. Through these barriers to
education, non-Bururi Burundians were prevented from assuming any substantial
administrative, economic or political power6.
6 Pritchett and Filmer (1999) have shown, in a detailed multi-country study, that access to education increases wealth and that wealth increases the level of education. The implication is that lack of access to education perpetuates poverty, especially in countries like Burundi where access to the civil service is the best and almost only opportunity of escaping poverty.
20
2.1.2. Economic Underpinnings of Political Competition
Economic Interests at the Core of Political Competition: The political evolution
described above was underpinned by economic motives. Up to independence, there
were few Burundians who had accumulated economic wealth through business
activities. A large share of investment and infrastructure were owned by the colonial
state, while private business was in the hands of Belgians. The capital left by
Belgians after independence was in the hands of the post-colonial Burundi new
state. This included a few factories, cars and houses. In the absence of any clear
rules or credible authority to assign property rights on those assets, especially after
the assassination of UPRONA party leader, it was left to the greed of political leaders
to share these rents. Thus, the merciless political fight for leadership was mainly a
struggle for the control and appropriation of this capital.
From Individual interests to collective action: Individual interests were better served
when aggregated along ethnic and regional lines, giving rise to the patterns of
competition evoked earlier. Though UPRONA, the victorious party in legislative
elections leading to independence, included leaders from both Hutu and Tutsi ethnic
groups, political struggles broke out along ethnic lines. Two major factors explain
this: the lopsided Belgian colonial polity and the so-called “social revolution” in
neighbouring Rwanda, a country with the same ethnic configuration.
The Hutu versus Tutsi distinction existed before colonisation, and to a large
extent, the Tutsi ethnic group enjoyed relatively more economic privileges and
political power. However, this state of play was institutionally regulated through
sophisticated rules that tempered the exclusion of Hutus. To divide the population in
order to control it more effectively, the colonial power institutionalised the domination
of Hutu by Tutsi through extremely rigid rules. At the same time, it implemented
policies clearly biased against the Hutus. For instance, in the 1930s, there were 27
Hutu chiefs governing Hutus as well as Tutsis in their constituencies; in 1945, after
the colonial administrative reform, there were no more Hutu chiefs (Reyntjens: 1994;
Nkurunziza and Ngaruko, 2002). Belgian social scientists carried out a large program
of research to “demonstrate” that Tutsis were a superior race similar to Europeans
and that they were born to rule while Hutus were seen as inferior (de Lespinay,
2000). The irony of the matter is that many Hutu and Tutsi were made to believe in
this colonial propaganda. The colonial education policy reflected the objectives of the

21
colonisers. For every Hutu student admitted by the colonial university, there were 5
Tutsi students in 1932, 15 in 1945, 3 in 1954 and 2 in 1959 (Lemarchand, 1970). Not
surprisingly, at independence in1962, a number of Tutsi leaders believed they had
special prerogatives to rule the country.
The second factor relates to the impact of the Rwandan 1959 bloody social
revolution, which eliminated Tutsis from political leadership. While this revolution,
carried out with the help of Belgians, was considered by radical Hutu leaders in
Burundi as the model to replicate, most Tutsi leaders viewed it as the scenario to
avoid by all means. In the early 1960s, suspicion mounted between Rwanda and
Burundi as the leaders in the two countries were from different ethnic groups. For
instance, the decision to end the monetary integration between Rwanda and Burundi
in 1964 and the subsequent loss of the Rwandan market by Burundian industry was
a result of this mistrust. To some extent, even the loss of the East-Congolese market
resulted from the suspicion between Burundi and Congo, with Burundi accusing
Congo of hosting Paul Mirerekano, a key Hutu opponent, while the Congo accused
Burundi of involvement with its southern secessionists such as Gaston Soumialot.
While the interests of political actors aggregated along ethnic lines soon after
independence, this changed from the early 1970 when interests opposed Tutsis from
Bururi and Tutsis from the rest of the country, creating a second though less severe
fracture. This regional fracture was consolidated after the 1972 massacres.
2.1.3: Patterns of Rent-Sharing from the 1970s
Given Burundi’s limited natural resources, political factions fighting for the
control of the state seek to control public institutions, including the public
administration, which have become the centre of a system of rent sharing. In this
regard, the rationale for major policies in the country rests on the role of the public
sector. This is illustrated from three perspectives: First, the role of public employment
and wages; secondly, the role of state-owned enterprises; and thirdly the role of the
army.
Unlike most of African bureaucracies, Burundi’s public sector is relatively small.
Since independence, while many African governments used public employment to
leverage populist policies aimed at providing revenue to a maximum number of
22
people, Burundi’s public sector has remained elitist. This was the result of the choice
by successive governments to reserve the relatively high paying jobs for their
political clients. In Burundi, the mean income of the mean civil servant falls among
the richest 6% of the population7, against an average of 13% in sub-Saharan Africa,
30% in the Middle East and North Africa region, 33% for Asia, 40% in Latin America
and the Caribbean, 76% for Eastern Europe and the former USSR and 63% for
OECD countries. Hence, in Burundi, individuals at the highest levels of office stand
among the richest in country8. This result justifies why ethnic politicking has a high
payoff in Burundi. The following table shows its result by providing information on the
ethnic identity of those in the highest public jobs.
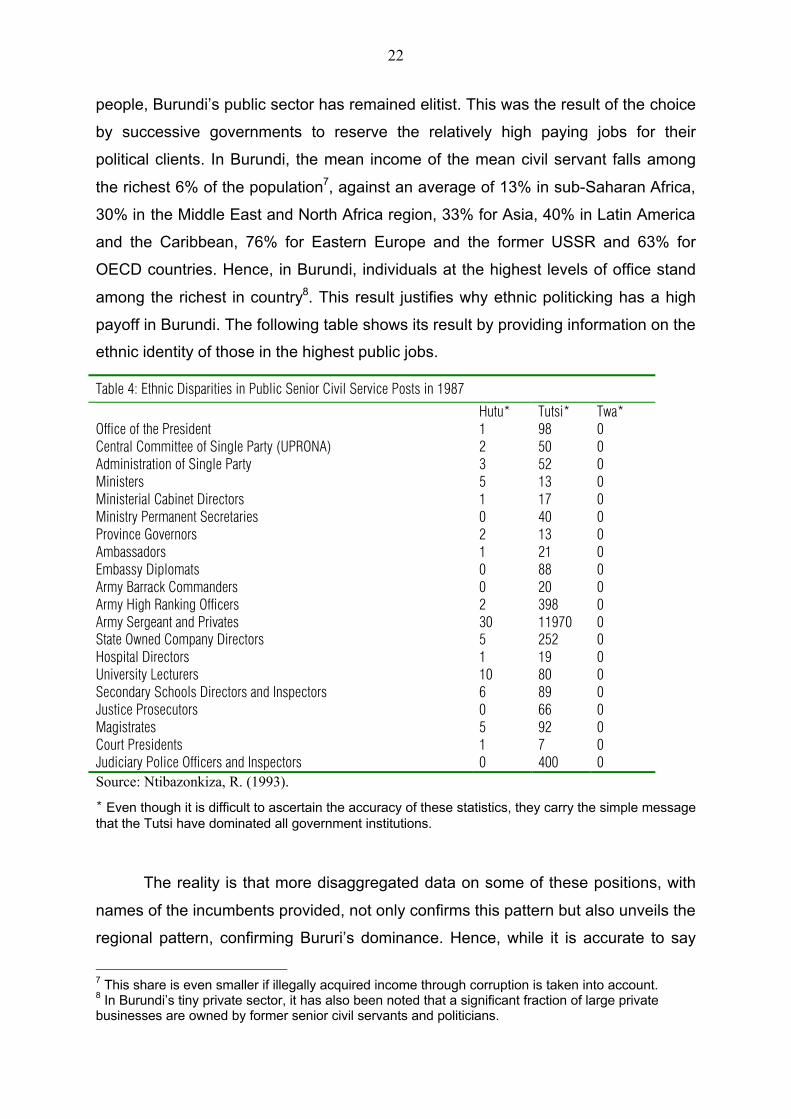
Table 4: Ethnic Disparities in Public Senior Civil Service Posts in 1987 Hutu* Tutsi* Twa* Office of the President 1 98 0 Central Committee of Single Party (UPRONA) 2 50 0 Administration of Single Party 3 52 0 Ministers 5 13 0 Ministerial Cabinet Directors 1 17 0 Ministry Permanent Secretaries 0 40 0 Province Governors 2 13 0 Ambassadors 1 21 0 Embassy Diplomats 0 88 0 Army Barrack Commanders 0 20 0 Army High Ranking Officers 2 398 0 Army Sergeant and Privates 30 11970 0 State Owned Company Directors 5 252 0 Hospital Directors 1 19 0 University Lecturers 10 80 0 Secondary Schools Directors and Inspectors 6 89 0 Justice Prosecutors 0 66 0 Magistrates 5 92 0 Court Presidents 1 7 0 Judiciary Police Officers and Inspectors 0 400 0 Source: Ntibazonkiza, R. (1993).
* Even though it is difficult to ascertain the accuracy of these statistics, they carry the simple message that the Tutsi have dominated all government institutions.
The reality is that more disaggregated data on some of these positions, with
names of the incumbents provided, not only confirms this pattern but also unveils the
regional pattern, confirming Bururi’s dominance. Hence, while it is accurate to say
7 This share is even smaller if illegally acquired income through corruption is taken into account. 8 In Burundi’s tiny private sector, it has also been noted that a significant fraction of large private businesses are owned by former senior civil servants and politicians.

23
that the Tutsi dominated the civil service in 1987, it would be more accurate to say
that the Tutsi from Bururi dominated state institutions. For instance, the data in table
5 on the ethnic and regional origin of managers of public enterprises illustrates this
important distinction.
Table 5: Ethnic and Regional Distribution of Public Corporations’ Managers (%) Ethnic Group
Region of Origin
Tutsis Hutus Twa TOTAL
Bururi Province 60 3 0 63
Remaining 14 Provinces 29 8 0 37
TOTAL 89 11 0 100
Source: Based on data from “La Lumière”, a Burundian weekly, and reported in International Crisis Group (2001).
The country’s resources have been captured and redistributed through the
public sector, dominated by Southern Tutsis. More specifically, employment policies
in the public sector rest on three pillars. First, high public wages and other related
advantages relative to the country’s resources. Secondly, a relatively small
bureaucracy, which is part of the country’s élite. Thirdly, important barriers to entry
into the main public professions applied selectively. The dominance of Bururi Tutsi
has its origin in the country’s history, as already discussed. This is explicit especially
in two sectors: the state owned corporations and the army.
From independence to the mid-1970s, political leaders in Burundi paid little
attention to the economy. The two kings that ruled the country until 1966 and
Micombero adopted multi-year plans of economic development, but these plans
were hardly followed. The country’s leadership invested its energies in political and
ethnic intrigues to reinforce their grip on assets left by the colonial power. Until the
mid-1960s, these assets were shared among the ruling elites, from both the Hutu
and Tutsi groups. Even though the massacres of Hutus and the elimination from
public office of Tutsis openly opposed to the country’s domination by the military
from the South had resulted in new redistributions to the benefit of Southern Tutsis,
by the early 1970s, there were little assets left for further distribution to the new
generations of southern Tutsi elites. There was a need to innovate.
24
The policies adopted by the country’s political class in the mid-1970s
responded to this need. They included heavy interventionism. The government
embarked on an active economic policy programme, which raised the share of public
investment in total investment from 5.6 percent to 42.8 percent between 1971 and
1980. To implement this programme, the country borrowed massively from both the
domestic financial market and from external sources. As a result, coupled with
sustained economic in the 1970s was an increase in the country’s indebtedness. The
funds served mainly to extend the bureaucracy, notably by creating more state
corporations. As Nyamoya (1998) notes, from 1977 to 1982, about 100 State-owned
companies were created. Managed by cronies with no managerial skills whose main
motive was to cater for the needs of their friends and relatives, most of the
corporations experienced cash flow problems accommodated by massive injections
of subsidies. As a result, the country’s budget recorded huge deficits, especially
when the revenues from coffee exports declined in the 1980s.
Although they produced only 9 percent of the country’s GDP in 1990, state
firms accounted for 31 percent of formal sector employment, 25 percent of
outstanding domestic credit, and benefited from 3.4 percent of GDP in financial flows
from the government (World Bank, 1998). By 1995, equity capital for thirty-six such
firms with majority state participation represented 20 percent of the country’s GDP,
but overall, these corporations posted a net loss equivalent to 6 percent of GDP or
14 percent of government revenue, excluding grants (IMF, 1997). These losses and
subsequent government transfers are just illustrations of the ways used to transfer
resources from taxpayers, including farmers, to bail out firms that served group
rather than national interests. The corporations’ privileged access to government
resources, including foreign currency, and their ethnically and regionally biased
employment policies are additional avenues for rent sharing.
The army is at the core of Burundi’s politics. In Burundi, he who controls the
army controls the country. The army plays a prominent role as both an actor and
guarantor of the mechanism of rent collection and distribution within the elite group.
Public expenditures allocated to the army rose by more than 100% between the mid-
1970s and the mid-1980s, reflecting a reinforcement of the institution that protects
the predatory system. The army also acts as a distributive machinery, given that
from the early 1970s, it has been overwhelmingly dominated by Southern Tutsis at
25
all levels. According to the International Crisis Group (2001), out of 37 highest
command positions within the army all of them are Tutsi, with 27 or 73 percent from
Bururi province.
These figures imply that policies that give prominence to the interests of public
servants, the army and state-owned enterprises over the rest of the population are
not coincidental. An illustration of this view is provided by the assassination of the
first democratically elected President, Melchior Ndadaye, a non-Bururi Hutu, by
Bururi dominated military. In June 1993, democratic elections unsurprisingly
changed Burundi’s traditional political landscape. They brought in office a Hutu
dominated government, with relatively few members from Bururi. While attempts by
the new government to reform the system of rent seeking were also, at least
partially, motivated by self-interest, they precipitated the country into chaos within
four months in power.
Among the factors that led to the October 1993 coup and the subsequent civil
war, four are worth noting (Reyntjens, 1994): Firstly, the reduction of the bid bonds of
80%, to allow small businessmen, including many Hutu, to benefit from privatisations
of state-owned enterprises threatened some traditionally well established interests.
Secondly, the attempt to reconsider the conditions under which the Belgian firm
Affimet had been authorized to refine and export gold under an export processing
zone licence a few weeks before the June 1993 elections annoyed influential people
both from the firm itself since it was going to lose its privilege, but also those from the
previous government who had been involved in the deal. Thirdly, the attempt by
returning Hutu refugees to recover their property including houses and land, some of
them in powerful hands, which they had left in 1972 was obviously too sensitive.
Fourthly, the intention of the President to reform the army did not please those who
felt threatened in view of their privileges. These few examples show the role of
special interests in the country’s political discourse. The following sub-section
discusses the way in which special interests led to resource misallocation and to a
divergence from an efficient equilibrium as evoked earlier, thus affecting economic
growth.

26
2.2. Government Economic Policy Choices
The process of rent collection and sharing illustrates how this system has been
politically and economically organized to benefit some individuals while harming
others.
2.2.1. Education Policy
Education policy has been used to filter the access to public employment
through unequal access by instituting skewed regional distribution of educational
infrastructure, the quality of teachers, the types of schools and the distribution of
students into different disciplines. According to Jackson (2001, p. 31-35), Bururi
alone had 15 percent of all primary school teachers, more than those in four
provinces taken together: Cankuzo, Muyinga, Rutana and Ruyigi. With 19 percent of
the country’s students in secondary schools and distributed in 36 schools, Bururi
boasts the highest rate of educational infrastructure in the country. Together with
Bujumbura, the capital city, the two provinces host 11 percent of the country’s
population but they account for 32 percent of all secondary school students. In
contrast, the five least endowed provinces account for only 10 percent of secondary
school students, almost half of the number for Bururi. Jackson notes that in the late
1980s, the government allocated about 60 percent of donor aid to education to
Bururi (p. 35)9.
Hence, before the 1993 crisis, Bururi had attained a rate of primary school
enrolment ratio of 99 percent, compared with the country’s average of 70 percent.
This contrasts with the achievements in other provinces, especially those in the
North such as Kayanza, Kirundo and Muyinga that have never reached a rate of
more than 60 percent. This information is confirmed by a 1998 household survey
(hereafter EP1998)10. Thus, given that the modern labour market is dominated by
public employment, and since access to public employment generally depends on
9 These statistics are so shameful that, according to Jackson (2001), the Belgian minister for development cooperation asked for statistics on the number of colleges in Bururi in 2000 in order to send the required aid but he never got a response from the government. 10 These figures are computed from the results of “Enquête Prioritaire 1998: Etude Nationale sur les Conditions de Vie des Populations” carried out by ISTEEBU (Institut de Statistiques et des Etudes Economiques du Burundi). This source will be subsequently referred to as EP1998.
27
the level of education11, by government design, those who are denied education in
early age are denied access to most opportunities offered by the economic system.
Unequal allocation of resources to different regions by the successive
governments has also been noted. Guichaoua (1991) reports that the Fifth Five-Year
Plan allocated 66% of gross fixed capital formation to a geographical area
comprising Bujumbura, the capital city and its surrounding areas, and the southern
province of Bururi out of the 15 provinces of the country. Although Bururi was one of
the poorest provinces in terms of infrastructure at independence, it has now become
among the most endowed in education infrastructure (Nyamoya, 2001, p. 36),
hospitals and other infrastructure. The point is that rather than preparing future
entrepreneurs, the education system has been shaped to prepare rent-seekers from
public institutions. Even though reliable data on the contribution of education to
economic growth is not available (we mentioned that the proxy of education by
enrolment ratios is abusive), one can hypothesize that the politicisation of Burundi’s
education system has had a negative impact on growth. Burundi is probably the only
country where education plays a negative role on the economy, as suggested by the
results of recent research on Africa by Orivel (1995).
2.2.2. Monetary and financial policy
In the financial sector, the lending and borrowing rates were fixed by the
government, and the large spreads translate the desire of a government that was
interested in collecting resources from its economic agents in order to re-distribute
them to private sector agents associated with the political elite. On average, the
interest rate spread was 8.7 percent for the period 1975 to 1998, for average lending
and borrowing rates of 12.5 and 3.8 respectively. The average spread to lending rate
was 0.70, a value that is higher than in most African countries including Kenya (0.4);
Ghana (0.5); Malawi (0.6); Nigeria (0.65) and Tanzania (0.70)12. The lending rate is
2.5 points lower than the mean for Africa or 83 percent of the latter while the deposit
rate is 4.5 percentage points lower or only 46 percent of the African average. Seen
from a different perspective, the negative real interest rates characteristic of the 11 For instance, every job in the public sector, up to district level, requires knowledge of French. Since the language is only taught in the formal education sector, those who do not attend school or those who do not go far enough are automatically excluded from job opportunities in the public sector. 12 These comparative data are computed in Nkurunziza, J. D. (2001).

28
period were a way of extracting rents from depositors most of whom were not able to
borrow from the same market. Between 1970 and 1998, the average real interest
rate was –6.19 percent per annum. The impact of the policy has been an
underdeveloped financial sector, which will be discussed in the next section.
2.2.3. External Trade Policy
External trade contributed to the policy of patronage inaugurated in the 1970s
as illustrated by government controls is the management of imports. Only officially
licensed agents can import and/or export goods. Importers who have access to
foreign currency from the overvalued official reserves have an advantage over those
who have to buy hard currency in the parallel market. Since imported products are
sold at the same retail price once they reach the country, it is obvious that the profit
margins are wider for the first group of importers, given that prices reflect more the
parallel rather than the official rate (Nkurunziza, 2000a). This is in stark contradiction
with the official motive for controlling the allocation of foreign currency, which is to
guarantee low prices for strategic imports. Given that the central bank determines
discretionarily the list of these products and the people who can import them, it can
be easily inferred that the policy has been maintained to ensure that this source of
rents remains under the control of those in power who benefit from it.
Greenaway and Milner (1990) have estimated the amount of rents associated
with the distribution of quota import licences, based on a sample of 33 imported
commodities. They found that in 1984, discretionary allocation of import licenses
represented rent transfers of about 2 billion Burundi francs, the equivalent of 17
percent of government revenue. As these resources are diverted from use on public
goods and services, these controls negatively affect society at large while benefiting
a small circle of individuals. This circle includes a pool of former high-ranking civil
servants turned businessmen who capitalise on their links with the government. In
this light, any relaxation in government controls erodes these privileges. For
instance, following the adoption of a structural adjustment programme in 1986, the
country put in place trade liberalisation measures, which culminated in the adoption
of a system of Open General Licence (OGL) for both imports and exports in 1992.
Control measures on international trade were relaxed and, not surprisingly, the
number of licensed importers grew from 145 in 1985 to 400 in 1991 (Nkurunziza,

29
1997). This increase by almost 200 percent in just six years could be interpreted as a
measure of potential rents that had been captured by protected importers during the
control regime13.
Likewise, the country’s export sector has also been a victim of the lopsided
policy. Burundi’s exports are essentially cash crops, namely coffee, tea and cotton.
Coffee accounts for more than 80 percent of total exports, and it provides a good
example of how trade policy has served government policy at the expense of coffee
producers. Although producer price stability has been the main justification for the
government’s intervention in the coffee sector through OCIBU14, one of its major
parastatals, the government did not isolate peasants from fluctuating international
prices. This is suggested by the high correlation coefficient between producer and
world prices, which stands at 0.90. This finding is in conformity with Bates (1981),
who notes that “what was stabilized is the off-take of the marketing boards rather
than the incomes of farmers”. Other motives behind government intervention are
discussed in the section on markets.
3. MARKETS AND GROWTH
Markets play a central role in the process of economic development: They
foster specialisation and exchange at low cost. In Africa, it is assumed that markets
are even more important relative to developed economies given the weaknesses of
large hierarchical organisations such as firms, government agencies, banks and
parastatals (Fafchamps, 1999). Governments’ obsession for total control over
politics, economics and social life of their citizens has transformed markets into
political institutions. As a result, politicisation of the economy has undermined market
efficiency and their development as a basis for economic growth. Judging from the
five institutional pillars of free and efficient markets identified in Afeikhena and
Olawale (1999, p.4), Burundi fares poorly. The country’s currency is unstable; the
legal system is not credible; the financial market is rudimentary and poor at enforcing
repayment; market integration is low as a result, among others, of poor market
infrastructure; and, there is little market information on prices and quantities available 13 Some of these liberalisation measures have been reversed as a result of the current crisis facing the country. 14 OCIBU is Office des cultures industrielles du Burundi.

30
to market participants. This section aims to provide insights into these effects by
focusing on the functioning of product, financial and labour markets. Given that
available information relates mostly to the third sub-period, we present the
discussions along the list of issues instead of the time periods delineated in the first
section of the paper.
3.1. Goods Markets
Goods markets are underdeveloped in Burundi. As discussions in the
previous sections have detailed, politicians have structured economic institutions in
such a way that they respond to their political goals, with no importance given to
efficiency or equity. As the economy is expected to serve a narrow partisan political
agenda, the discussion in this sub-section focuses on direct and indirect government
intervention in the goods market to achieve its objective of capturing and
redistributing rents.
3.1.1. Government Direct Involvement in Goods Markets
Traditionally, the government has controlled the marketing of a range of
products through the establishment of a number of marketing boards. Prominent
among them are three that control the marketing of export cash crops, namely
OCIBU for coffee, OTB for tea and COGERCO for cotton15. These three parastatals
control almost 100 percent of Burundi’s exports. The parastatals provide some
extension services to producers and they are responsible for the marketing of the
produce, including their processing before export. One important aspect of the policy
is the decision, by government decree, on the amount to be paid to producers each
season. As the example of coffee shows, the way coffee prices are structured and
distributed among the different agents involved provides a picture of the predatory
character of the government.
Though controls on coffee were relaxed in the early 1990s, producer prices
are still determined by the government. During the 15 years preceding the adoption
of a structural adjustment programme in 1986, coffee farmers were given, on
average, 40 percent of the world price, the difference being appropriated by the
15 OCIBU is Office des cultures industrielles du Burundi; OTB is Office du thé du Burundi and COGERCO is Compagnie de gérance du coton.

31
government and agents involved in processing and export. The ratio of farmer price
to international price is far lower than the ratio in Kenya (about 85 percent) and
Cameroon (50 percent) but almost the same as in Tanzania (about 43 percent).
Recent data shows that, while other countries in the region, namely Rwanda,
Uganda and Tanzania, have increased producer prices in the 1990s, those in
Burundi have remained relatively low. The difference in prices cannot be just
explained by the cost of international transport, given that Rwanda, a country under
similar conditions, has been paying its farmers at least 50 percent more than in
Burundi over the recent years.
In addition, taxes on coffee have accounted for almost all export duties; the
amount represented about 14 percent of total government tax revenue in the mid-
1990s. Since 1991, the government has instituted a coffee export tax, which was set
at 9 percent at the beginning. This rate has been changing according to economic
conditions both in the international market and at home. For instance, following
coffee international price hike in 1994, the tax was increased to 31 percent; by 1997,
it had been reduced to 15 percent (IMF, 1997). Taxation and inappropriate pricing
policies, coupled with the effects of war, have resulted in output decline. While
production had stabilized between 30,000 and 40,000 tons between the early 1980s
and early 1990s, output plummeted to 11,000 tons, its lowest level since the 1960s
despite favourable international prices in the mid-1990s.
Figure 5: Fully washed Coffee Production in tons
0
10000
20000
30000
40000
50000
67 69 71 73 75 77 79 81 83 85 87 89 91 93 95 97
In addition to export cash crops, the government established parastatals to
manufacture and/or market a range of other products including hides and skins,
basic pharmaceutical products, food products such as rice, beans, sorghum, sugar,
salt; the production and processing of fish, etc. starting from the mid-1970s.
Moreover, during the same period, the government created the Office National de
32
Commerce (ONC), a general trading company tasked with the import and marketing
of all consumer goods not produced in the country. It was involved in both retail and
served as a warehouse for retail traders. It sold a wide range of consumer goods
from cement to notebooks to needles. Since most of these products were
subsidized, speculators used to collude with the company’s managers to create
shortages and resell the products in parallel channels at higher prices. ONC’s unfair
competition with the private sector affected the economy in three ways. First, its
policy distorted the market price mechanism, creating shortages that forced buyers
to pay higher than equilibrium prices in the parallel channels. Second, ONC’s
monopoly over the importation of an array of goods delayed the learning process of
private importers by suppressing their link with external markets. Third, the system
created a structure of incentives encouraging rent seeking benefiting a small group
involved in the management of the system. Bad management, nepotism and
corruption eventually killed the parastatals by the late 1980s as connected traders
bought goods on credit and never paid.
The marketing of locally produced food produce, especially staple produce
such as beans and sorghum, was in the hands of a different state corporation,
SOBECOV (Société Burundaise d'Entreposage et de Commercialisation des
produits Vivriers). Unlike the marketing boards for coffee, tea and cotton, SOBECOV
was never involved in the production process. Its role was to buy the produce from
farmers, store and resell it to consumers through its branches throughout the
country. Similar to export cash crops, these marketing boards did not offer prices
based on economic fundamentals. They acted to extract rents from farmers and
distribute them to urban elites known to be politically more powerful than the millions
of farmers (Bates, 1981). This biased incentive structure may have played a role in
the observed steady decline in food production over the years. The production of
staple crops such as maize, sorghum, millet, bananas and cassava declined or
stagnated in the 1970s through the 1980s. In the 1990s, production of all these food
crops declined (World Bank, 1998). Although more than one factor may have
contributed to this trend it should be noted that the introduction of marketing boards
in the second half of the 1970s coincided with a decline in the per capita food
production. From 117 to 120 between 1970 and 1975, the food production index
dropped to 105 in 1980 and to 82 in 1997. The dramatic decline in the 1990s was no
33
doubt precipitated by civil war (Nkurunziza, 2002). Obviously, in a poor country
dominated by a labour-intensive agricultural sector, there is no doubt that a reduction
in the availability of food has hampered the growth process.
3.1.2. Government Indirect Intervention: Direct and Indirect Taxation
The system of taxation in Burundi lacks all three characteristics of an efficient
tax system: certainty, simplicity and transparency. Lack of certainty is illustrated by
the ad hoc use of quantitative import restrictions. Complexity is shown by the variety
of taxes forming the system of border taxation: these are entry taxes and fiscal
taxes, with considerable variations between and within these two broad categories.
For instance, within the category of fiscal taxes, section XVI relating to machinery
has 15 different rates. Lack of transparency of the system is illustrated by the fact
that there are a number of non-tariff forms of protection, among which are quotas.
The characteristics of the tax system in Burundi provide a leeway for abuses that
increase the potential for corruption. For instance, in 1993, import duty exemptions
represented 50 percent of potential import duty revenue. The undefined category of
“other exemptions” represented 3.3 billion Burundi francs in 1996, accounting for as
much as 42 percent of total exemptions. Most officials controlling these decisions do
not hesitate to monetise them. It is known in Burundi that customs and Inland
Revenue officials are the richest civil servants, despite their wages which are similar
to those of other civil servants16.
The extent of indirect taxation is usually proxied by the exchange rate
premium. It is defined as the relative difference between the official and the parallel
rates of exchange. Burundi’s premium stood at an average of 21.2 percent for the
period 1970-1989 (Nkurunziza, 1997). For comparison, the average premium for the
same period was 437 percent in Ghana, 199.93 in Algeria, 150.65 in Tanzania,
99.54 in Sudan, 96.77 in Egypt, 95.14 in Zaire, 93.9 in Nigeria, 92.66 in Zambia,
83.36 in Ethiopia and 52.47 in Malawi (Ghei and Kiguel, 1992). However, the main
difference with these countries is that the latter have managed, during the 1990s, to
unify their foreign exchange markets, while Burundi’s has been surging. Between
16 The public always wonders how an officer with a monthly wage of $40 can afford to buy real estate worth 1000 to 5000 times his monthly wage, which cannot even cover the monthly cost of petrol for his fleet of cars. More amazing is the fact that the country leadership does not seem to be disturbed by facts like these. These indirect benefits are the most dominant form of rent extraction.

34
1990 and 1999, the average level of the premium has doubled to 43 percent, placing
Burundi from the group of moderate to that of high premium economies. The
consequence of a high premium for farmers is that it reduces their real purchasing
power. If the ratio of producer price to world price is evaluated at the parallel
exchange rate, it falls from 40 to 34 percent of the world price for the period 1967-
1998. At this level, Burundi pays the lowest price in the region, relative to
international prices17. The next figure shows the extent of taxation coffee growers
have been subjected to through exchange rate misalignments by comparing the
shares in the world price when the prices are evaluated at both the official (BIFO)
and the parallel market (BIFP) rates.
Figure 6: Ratio of Producer Price to World Price of Coffee (1967-98)
01020304050607080
67 69 71 73 75 77 79 81 83 85 87 89 91 93 95 97
Ratio-BIFO Ratio-BIFP
3.2. Financial Markets
The country’s financial market also reflects Burundian political environment. It
has a limited coverage and effectiveness in fostering growth. Burundi’s low financial
deepening is characteristic of a weak financial system.
3.2.1. Infrastructure and Coverage
For most of the period after independence, the sector was dominated by just
two commercial banks, a savings bank, a development bank and a few specialised
non banking financial institutions. With financial liberalisation in the 1980s and
1990s, Burundi’s financial sector has become relatively more diversified. However,
17 Estimates for 1997/98 season show the following allocation of the average green coffee selling price: producers were paid 43 percent; intermediaries and wholesalers took 18 percent; export costs and charges were 23 percent, the parastatal levy was 13percent, and transport cost 2 percent. Restructuring the cost could allow an increase of producer prices by reducing for instance the portion going to intermediaries and wholesalers, as well as OCIBU levies (13 percent) and export taxes.
35
given that the country has no stock exchange and no dynamic informal financial
market, most of Burundi’s financial transactions are carried out only through banks
and other non-banking financial institutions. Currently, the country has 8 mainly
private commercial banks, one development bank, two leasing companies, two
investment banks, one mortgage bank, a rural development fund and a rural credit
and savings cooperative. There are also two specialized funds that were established
to help private investors raise the required guarantees to access lending. The post
office network also provides financial services. In addition, the country has five
insurance companies, of which four are privately owned.
In terms of the density of the banking network, most of the institutions are still
concentrated in Bujumbura except for the two oldest banks, the Banque de Crédit de
Bujumbura (BCB) and the Banque Commerciale du Burundi (BANCOBU) that have a
wider coverage, with branches in half the country’s provinces. However, these
branches have no penetration beyond the provincial capitals. Rural credit and
savings have been catered for by COOPEC (Coopérative d’Epargne et de Crédit)
starting from the second half of the 1980s. However, their reach is also limited. For
instance, EP1998 data show that on average, rural households need to walk for two
hours to half a day to reach the nearest COOPEC office; yet these are the closest
financial structures available in rural areas. Some areas are so badly covered that an
important proportion of the households in the sample need more than half a day to
walk to the nearest facility and about 13 percent of the households do not have
access to the services of COOPEC at all. Coverage is unequal across the country’s
provinces but we do not have information to determine whether this inequality is
based on economic or political factors.

36
Table 5: Average Time Needed to Walk to the Nearest COOPEC Facility18
Time Required Provinces 1-2 hours Bururi, Gitega, Kayanza, Muramvya, Muyinga, Ngozi 2 hours-half a day Cankuzo, Kirundo, Rutana, Ruyigi More than half a day Cibitoke No access to COOPEC Bubanza, Bujumbura Rural, Karuzi,
Source: Computed by the authors on the basis on EP1998
3.2.2. Efficiency
Despite the increasing diversity of the financial infrastructure, the country is
still characterised by weak financial deepening. The thinness of the financial sector is
illustrated by the low ratio of money demand over GDP. The average ratio of M2 to
GDP is only 15 percent for the period 1965-98, which is 7 percentage points lower
than the African average and less than half that of other LDCs. In the same
connection, the level of M2/M1, which stands at 1.35 is almost half Africa’s as well as
LDC means. These simple statistics show that the economy is less monetised even
relative to other poor economies, suggesting both a lack of openness and a high
level of financial repression. Until the early 1990s, repression policies included the
following (Nkurunziza, 1997): (i) only the central bank could authorise capital
transfers and commercial banks could not purchase or sell foreign assets; (ii)
residents were prohibited from holding foreign currency accounts either in the
country or abroad; (iii) imports and exports were controlled through a strict licensing
system; (iv) the rate of exchange of the Burundi franc was fixed by the government;
(v) the central bank imposed exchange fees, administration fees for imports of some
products, etc.; (vi) fixing the lending and borrowing interest rates at levels that did not
reflect market conditions; (vii) high reserve requirements of the order of 10 percent
and 5 percent for short and long term deposits, respectively; (viii) restrictions on
market entry which resulted in the dominance of only two commercial banks for most
of the country’s post-independence period. Although some of these measures,
18 The time reported is the mode of the responses given by 3908 households interviewed. Bujumbura city is not included since COOPEC was specifically designed for rural areas. The last row (no access to COOPEC) simply means that the modes of distributions fall in this category. In Bubanza and Karuzi respectively, 50 percent and 34 percent of households interviewed have no access to this facility. For Bujumbura rural, lack of access to COOPEC facilities may be due to the fact that households are supposed to use the financial institutions in Bujumbura city.

37
particularly the restrictions on market entry, have been relaxed, most of them remain
in place and the financial sector is still repressed.
The large spreads evoked in the previous section, between lending and
borrowing rates is usually a symptom of an inefficient and oligopolistic financial
sector. In the case of Burundi, however, the spreads were largest in the 1990s
translating lenders’ internalisation of the costs associated with high market
uncertainty and the resulting high lending costs during this period of civil war. It
should also be noted that money demand has become unstable starting from the
early 1990s; this is certainly another consequence of the civil war and the ensuing
macroeconomic instability. Moreover, the particularly low ratio of M2/M0 is
characteristic of a subsistence economy, deriving from high taxation of economic
activity, especially the agriculture sector, as already discussed.
The high level of uncertainty has induced financial institutions to ration credit
and lend short to the private sector. Long-term and medium term lending, which
represented 16 percent each of total credit to the economy in 1992 just before the
crisis declined to 11 percent each in 1998. During the same period, short term
lending, especially in the form of working capital, increased from 62 to 78 percent
(IMF, 1997; 1999), due to high inflation and the decline in firms’ self-financing
capacity. Credit to the government from the banking sector expanded tremendously
as a result of the need for additional resources to fund the war, the drop in fiscal
revenues and the drop in international aid. The ratio of credit to the government over
credit to the economy jumped from 5 percent in 1992 to 29 percent in 1998,
suggesting serious crowding out of resources from productive to unproductive uses.
Moreover, sectoral allocation of credit appears inefficient, as it does not reflect
the sectors’ contribution to the economy. In 1995, credit to agricultural activities
represented only 1.7 percent of total credit, in comparison with 35 percent for trade;
14 percent for civil engineering and other services and 10.5 percent for industrial
activities. This was in spite of the fact that during the same year, the primary sector
contributed about 50 percent to GDP against a lower contribution of 6 percent, 3
percent and 9 percent for trade, other services and manufacturing, respectively.
These figures show an absence of integration of the financial sector into the
economy. It is interesting to note that the high proportion of credit to the trading
sector is in line with the rent sharing model: since trade itself is controlled by the
government through, among others, the issuance of import licenses, the financing of
38
trade activities implies that banks are either part of the game, or they are more
interested in speculative activities, or both. Either way, the financial sector will not be
able to contribute optimally to the process of economic growth without being more
integrated in the country’s economic structure.
3.3. The Labour Markets
Similar to product and financial markets, the labour market does not function
as a competitive market. This sub-section aims to briefly discuss the main features of
the labour market, to highlight the determinants of wages in the modern private
sector and to draw the implications for growth.
3.3.1. The Main Features
Burundi’s economy is essentially agriculture based. Out of 3 million active
people, 84 percent work in the agriculture and livestock sector, with only 4.6 percent
active in the modern public and private sector. The informal labour market in rural
areas is limited, given that only 24 percent of households employ paid labour, often
without a clear wage contract. Even in the modern sector, given the way
recruitments are carried out both in public and private institutions, one wonders
whether there exists a labour market in Burundi. Despite the fact that there are legal
texts that outline how the market “should” operate, very few in Burundi abide by
these rules. The matching of demand and supply is done more informally than
through the allocative function of an open and competitive market.
Information on Burundi’s manufacturing sector illustrates the informality of the
labour market. In 1992, survey information covering 500 workers in 120
manufacturing firms19 shows that recruitments are normally done through informal
channels that privilege direct relations between prospective employees and firm
owners as well as their workers. The data show that firms recruited only about 20
percent of employees through formal channels, namely job advertisement and
recruitment agencies. About 75 percent of workers were recruited as follows: 26
percent through owners’ family members and friends; 20 percent through door-to-
door searches; 15 percent through workers’ family members and friends; and 14
percent through word-of-mouth. The remaining 5 percent were recruited through
19 Private firms account for 92.5 percent of the sample.
39
other channels. Therefore, instead of promoting efficiency through a transparent and
competitive recruitment process, these practices privilege non-economic factors
such as friendship and kin group connections. As in the public sector, securing a job
in the private sector depends not only on what you know but also whom you know.
Thus, skills allocation among sectors is not necessarily determined by relative
wages and there are no transparent information systems that guarantee an optimal
allocation of labour. Moreover, in a context where employment is dominated by the
public sector with its fixed wage rates, the concept of market equilibrium can be
misleading. Given that economic opportunities are limited and public employment is
a major source of accumulation through indirect benefits such as subsidised credit
and housing, free transportation, frequent international travels and other rents
extracted through corruption and patronage, the conditions in the labour market
reflect largely political rather than economic fundamentals, and these choices have
important economic and social consequences. For instance, previous discussions
have shown that large parts of the population are excluded from participation in
public employment by direct ethnic and regional selection, or indirectly by
discriminatory access to education.
Education is very expensive for most households that are unable to send their
children to school without assistance from the state. Household data show that one
child in secondary school costs a poor household 12 percent of its poverty line per
year or the equivalent of the household expenditure on health care, agriculture
inputs, housing, clothing and transport. Therefore, there is a high cost barrier to
education of children from poor households. As a result, child labour is relatively high
in regions with few state sponsored schools. EP1998 data show that 30.6 percent of
children between 7 and 14 years of age are active; this rate is lowest in the regions
where school infrastructure is highest, with the lowest rate in Bujumbura at just 1.7
percent. Therefore, economic fundamentals alone cannot explain the labour market
in Burundi20.
3.3.2. The Determinants of Wages in the Modern Private Sector
Although recruitments do not appear to be based on economic
considerations, wages seem to be determined by economic factors. However, in
20 This issue is covered in detail in Ngaruko and Nkurunziza (2000).
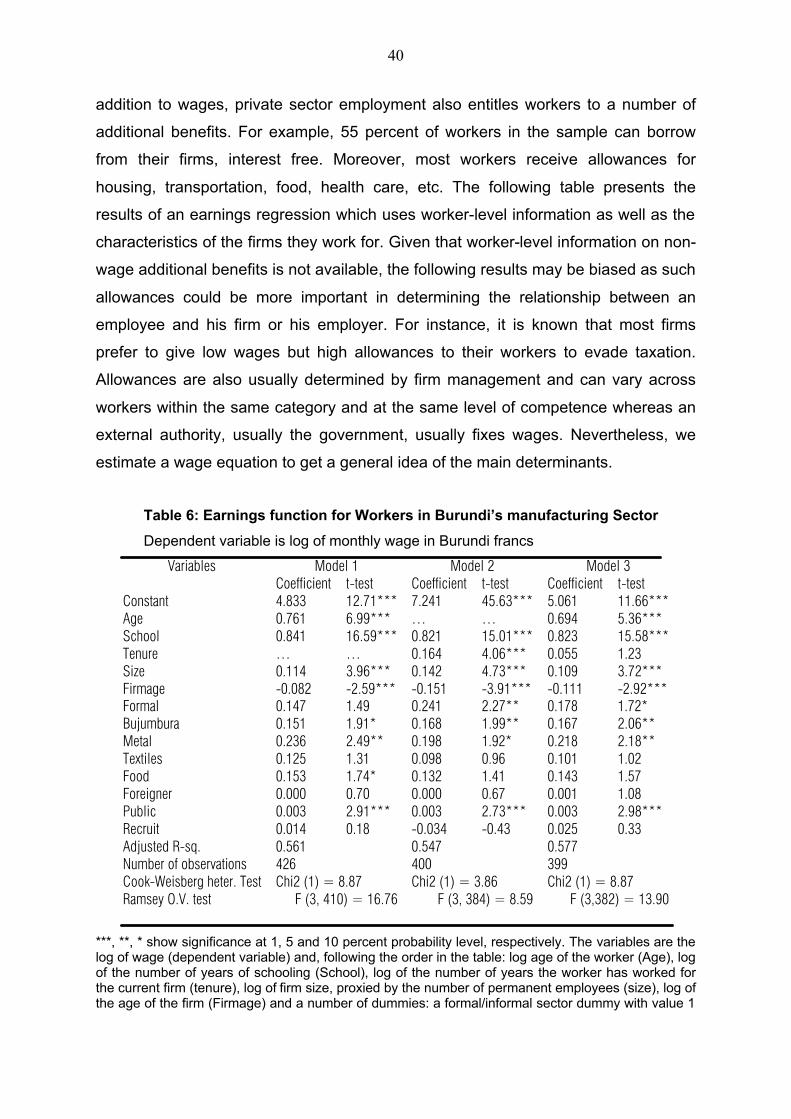
40
addition to wages, private sector employment also entitles workers to a number of
additional benefits. For example, 55 percent of workers in the sample can borrow
from their firms, interest free. Moreover, most workers receive allowances for
housing, transportation, food, health care, etc. The following table presents the
results of an earnings regression which uses worker-level information as well as the
characteristics of the firms they work for. Given that worker-level information on non-
wage additional benefits is not available, the following results may be biased as such
allowances could be more important in determining the relationship between an
employee and his firm or his employer. For instance, it is known that most firms
prefer to give low wages but high allowances to their workers to evade taxation.
Allowances are also usually determined by firm management and can vary across
workers within the same category and at the same level of competence whereas an
external authority, usually the government, usually fixes wages. Nevertheless, we
estimate a wage equation to get a general idea of the main determinants.
Table 6: Earnings function for Workers in Burundi’s manufacturing Sector
Dependent variable is log of monthly wage in Burundi francs
Variables Model 1 Model 2 Model 3 Coefficient t-test Coefficient t-test Coefficient t-test Constant 4.833 12.71*** 7.241 45.63*** 5.061 11.66*** Age 0.761 6.99*** … … 0.694 5.36*** School 0.841 16.59*** 0.821 15.01*** 0.823 15.58*** Tenure … … 0.164 4.06*** 0.055 1.23 Size 0.114 3.96*** 0.142 4.73*** 0.109 3.72*** Firmage -0.082 -2.59*** -0.151 -3.91*** -0.111 -2.92*** Formal 0.147 1.49 0.241 2.27** 0.178 1.72* Bujumbura 0.151 1.91* 0.168 1.99** 0.167 2.06** Metal 0.236 2.49** 0.198 1.92* 0.218 2.18** Textiles 0.125 1.31 0.098 0.96 0.101 1.02 Food 0.153 1.74* 0.132 1.41 0.143 1.57 Foreigner 0.000 0.70 0.000 0.67 0.001 1.08 Public 0.003 2.91*** 0.003 2.73*** 0.003 2.98*** Recruit 0.014 0.18 -0.034 -0.43 0.025 0.33 Adjusted R-sq. 0.561 0.547 0.577 Number of observations 426 400 399 Cook-Weisberg heter. Test Chi2 (1) = 8.87 Chi2 (1) = 3.86 Chi2 (1) = 8.87 Ramsey O.V. test F (3, 410) = 16.76 F (3, 384) = 8.59 F (3,382) = 13.90
***, **, * show significance at 1, 5 and 10 percent probability level, respectively. The variables are the log of wage (dependent variable) and, following the order in the table: log age of the worker (Age), log of the number of years of schooling (School), log of the number of years the worker has worked for the current firm (tenure), log of firm size, proxied by the number of permanent employees (size), log of the age of the firm (Firmage) and a number of dummies: a formal/informal sector dummy with value 1
41
when the sector is formal and zero otherwise; a location dummy with value 1 for firms located in Bujumbura and zero otherwise; three sectoral dummies: metal, textiles and food if the firm is in these sectors (wood work is the omitted category of firms), and two ownership dummies (foreigner and Public) which represent the majority ownership of the firm (Burundi private ownership is the omitted category). We have also added a dummy variable (Recruit) to test whether the way a worker is recruited has a significant impact on his wage. It takes value 1 if he was recruited through job advertisement or through a recruitment agency and zero otherwise.
The coefficients should be interpreted with caution: they appear to be much
higher than results on other African countries. One problem with the data is that the
dependent variable is wages, which does not include many other benefits as already
remarked. A second factor is that the sample is dominated by bigger firms in the
formal sector in the capital city, Bujumbura, where workers are more educated and
earn relatively more. Despite these limitations, the main message of the findings is
that workers’ wages are driven by the same factors that drive wages elsewhere. The
main factors are workers’ education, age or tenure21, the size and the age of the firm.
Different dummies are also included to control for firm characteristics. For instance,
firms in Bujumbura appear to offer better wages than those in the interior, and formal
firms offer higher wages than informal firms, even after controlling for firm size. One
interesting finding is the fact that workers hired through informal and formal channels
do not seem to earn different wages. The reason may be that once a worker is
recruited, the formal wage is the one provided for by government labour laws.
However, differences may be noticeable once allowances are taken into account,
especially those at the discretion of the employer.
These results have some implications for economic growth. Notwithstanding
our caution regarding the interpretation of the coefficients, we can note that, firstly,
the results confirm the argument of a dual economy: rural versus urban and formal
versus informal. Since Burundi is essentially rural, policies that marginalize the rural
economy can only have a detrimental impact on growth. Secondly, given that
schooling is the most important variable explaining the level of wages and that the
latter is an important source of monetary income in an environment where formal
employment is limited, unequal access to education has a strong effect on social
inequality. Thirdly, the fact that workers recruited through informal channels do not
seem to earn more than those recruited through more formal channels should not be
21 Models 1 and 2 show the substitutability of age and tenure variables, suggesting that age usually captures the worker’s experience or his tenure. The influence of tenure disappears once both variables are included in the same model (model 3).

42
misleading. Although workers in both categories may earn the same wages, the fact
is that those recruited informally take places that should have been taken by others
who might remain unemployed or opt for lower paid jobs. In addition, the fact that
employees recruited informally tend to pledge their loyalty to individuals who
recruited them rather than to the firms that employ them creates an incentive
problem that may penalise the firm’s performance. In the end, individuals may
benefit from informality but on the whole, the economy at large loses.
4. MICROECONOMIC CONSTRAINTS TO GROWTH
The microeconomic constraints that firms and households face in Burundi
largely follow from the discussions in the previous sections. The contribution of the
manufacturing sector in the process of the country’s economic growth depends in a
large measure on the determinants of firm growth and how the environment in
Burundi facilitates or hampers this process. On the other hand, as households in
developing economies are also units of production, the same analysis will be carried
out at household level.
4.1. Firm Growth and Constraints to Firm Performance
After a brief presentation of the determinants of firm growth in Burundi, this
section discusses the size of Burundi’s external markets, the legal framework
supporting firms activity, and the risks associated with Burundi’s geographic and
political environment. Due to the lack of statistical data it will not be possible to
present a discussion by sub-periods. The limited microeconomic information
available covers only the last of the three sub-periods of the study. Therefore, the
following discussion follows issues rather than the time periods.
4.1.1. The Determinants of Firm Growth
Among the main factors explaining firm growth in Burundi are firm age, its
size, its location and whether the firm is formal or informal22. The elasticity of firm
size with respect to age is –1.39, consistent with the models of learning. Size and
growth have a negative and significant relationship, with an elasticity of 0.04. This
22 Empirical results in this paragraph are based on Sleuwaegen and Goedhuys (1998)

43
goes against Gibrat’s law, which stipulates that firms grow following a random
drawing from a distribution of growth rates. In Burundi, it appears that smaller firms
grow faster than larger ones. Formal firms also appear to be able to grow faster than
informal ones. The formal status of firms increases their annual growth rate by 0.31,
implying that visibility and legitimisation help in an environment where firms compete
over the distribution of scarce resources. Firms located in Bujumbura grow faster
relative to other firms. This is due to the fact that resources and markets are
unequally distributed, with a high concentration in the capital city, Bujumbura. Firms
in Bujumbura enjoy the best infrastructure, a larger output markets and cheaper and
higher quality inputs. Being located in Bujumbura increases the expected growth rate
by 0.13. The main result from these findings is that firm growth is a learning process
that is spread over time. In this light, the environment within which firms evolve is a
crucial determinant of the quality and the extent of the growth process. Hence,
institutional factors already discussed and others discussed below show the way in
which inappropriate institutions have limited the process of firm growth in Burundi
and hence their potential contribution to the country’s economic growth.
4.1.2. The Size of Burundi’s External Markets
Under colonial rule, Burundi’s manufacturing sector was designed to serve
Burundi, Rwanda and the Kivu region in Eastern Congo. The provision of European
imported goods became difficult during the Second World War, so Belgium decided
to establish import substitution manufacturing firms in Bujumbura, the administrative
and economic capital of Rwanda and Burundi23. The emphasis was put on the
processing of agricultural products within the region. In this regard, firms established
during the time were tailored to meet the demand of this relatively large market.
When Congo and Rwanda became independent in the early 1960s, Burundi lost half
of its Eastern Congolese export market and some of its Rwandan market leaving
Burundi’s manufacturing sector with excess capacity. By 1962-63, capacity utilisation
in the manufacturing sector had been reduced to 25-50 percent (Ngaruko, 1993).
The oldest firm in Burundi’s 1993 RPED sample was created in 1947 and 13
firms or 11 percent of the sample were established before 1960. In support of the
idea that pre-1960 firms were established to serve a larger market, we find that firms
23 It was then called Ruanda-Urundi
44
created before 1960 had an average production capacity of 240 kilowatts per firm
relative to 98.5 kilowatts for firms created after 196024. Therefore, market size has
been a determinant of firm size, other things being equal. However, it also appears
that these firms are still among the biggest in Burundi, suggesting that the collapse
of the economic union had a limited impact on them. In fact, by 1993, these firms
were, on average, more active than the group of firms created after 1960. The
average use of production capacity was 87 percent as compared to 66 percent for
the post-1960 firms. In addition, 33 percent of firms in the first group were exporting
relative to 13 percent in the second group25.
These figures suggest that it will be difficult for Burundi to develop its
manufacturing sector if it relies on its narrow national market. Given that the country
is landlocked, transportation costs increase production costs, especially in function of
the level of imported inputs used in the production process; this constraint limits firm
competitiveness in international markets. One possible avenue for the country to
increase its exports could be to devise a strategy targeting regional markets. Since
Burundi is signatory to a number of regional trading blocks, firms should strive to
take advantage of the preferential provisions of such bodies to increase their
businesses across the region26. However, recent experience with governance failure
in the region does not bode well for a quick achievement of this objective. Mistrust,
nationalist short sightedness and egoistic interests of the leaders have undermined
attempts to establish regional markets. Paradoxically, political crises have
sometimes allowed bypass political barriers and succeed where political voluntarism
had failed. For instance, during the refugee crisis in Eastern Congo in 1994-1996,
some factories in Burundi were operating at full capacity 24 hours a day to meet the
increased demand for products such as blankets and other basic commodities.
24 It has not been possible to compute firm size in terms of the number of workers or the amount of start-up capital because these data were systematically missing for firms established before 1960. 25 These findings suggest persistence of the management culture on which the firms were built. By contrast, those created after independence relied relatively much more on political connections. In fact, as argued in Ngaruko and Nkurunziza (2000), a number of the post-independence economic operators who temporarily and rapidly prospered were not necessarily the best “businessmen” but rather a group of former politicians or high ranking bureaucrats who used their connections in the country’s political and bureaucratic structure to make a fortune. This is illustrated by the fact that a change in government in Burundi is always accompanied by changes in the configuration of the business sector: new faces in politics bring new faces in business. 26 Attempts to create regional institutions include the Communauté Economique des Pays des Grands Lacs (CEPGL), Communaute Economique des Pays d’Afrique Centrale (CEAC), and the Common Market for Eastern and Southern African States (COMESA).

45
4.1.3. The Regulatory Framework Supporting Firm Activity
As a consequence of the policies pursued by different governments, an
inappropriate regulatory framework has hampered firm efficiency, affecting the
process of growth. This is illustrated by the weak legal system that fails to enforce
commercial contracts and property rights, and the high macroeconomic instability
that increases uncertainty.
4.1.3.1. The Legal Framework
Burundi’s does not offer a properly functioning legal system that can credibly
enforce commercial contracts. Although a lack of data on this subject does not allow
make any strong statements, discussions held with commercial bank officials in
Burundi point out the weakness of the legal system. For instance, it appears that
when borrowers default and they are taken to courts, cases can take up to ten years
to be settled. It was reported that that judges tend to sympathize with the plight of
defaulting borrowers27. Given the high cost and unreliability of the legal system, 86
percent of firms interviewed in 1992 preferred to settle their conflicts with clients
through direct negotiations while only 15 percent of the conflicts were taken to
courts. This pattern is not particular to Burundi: It is reported that in Kenya similar
cases take between 4 and 10 years to be resolved (Adeola and Olugboyega, 1999,
p.46). In a study covering Burundi, Cameroon, Côte d’Ivoire, Kenya, Zambia and
Zimbabwe, Bigsten et al. (20000) found that 80 percent of firms settle their disputes
through direct negotiations. The same result was also found in the case of
Madagascar (Fafchamps and Minten, 1999). The high cost associated with the
resolution of conflicts arising from business disputes is one of the factors that limit
market transactions in these economies. As a result, the lack of strong legal
institutions discourages risk taking, which curtails economic activity. For instance, by
1992, only 56 percent of firms had ever applied for a loan and 44 percent had ever
been successful.
In addition to legal institutions, firms also need government business support
services. If well administered, these services can be used to foster the development
27 Personal discussions with Burundi bank managers.
46
of the manufacturing sector. Experience shows that government discretionary
measures have often not been used in a transparent way and have tended to favour
some firms. For example, there are tax and duty exemptions provided for in the
Investment Code. By 1993, 31 percent of firms in the RPED sample had applied for
the benefits. Successful firms represented 60 percent of the applicants or 19 percent
of the total sample. What is striking is that, as for credit, smaller firms not only
applied less, but they were also less successful than bigger ones. This suggests a
different treatment of small relative to big firms, even by government institutions.
4.1.3.2. Macroeconomic Instability
The stability of a country’s currency is one of the key institutional foundations
of free and efficient markets (Afeikhena and Olawale,1999). Burundi’s currency fares
poorly. In the last 15 years, the official exchange rate has lost 400 percent of its
value relative to the American dollar. The loss has been even more pronounced in
the parallel market, where the Burundi franc has lost 550 percent of its value relative
to the dollar during the same period. The parallel market exchange rate is a better
indicator of instability given that it is more linked to economic and political factors and
considering that important amounts of international trade have been traditionally
mediated through the parallel market28.
Among others, instability in the macroeconomic environment has been due to
frequent devaluations, which have increased the cost of doing business in Burundi.
In the period 1990 to 1993, for instance, successive devaluations amounted to 60
percent loss in the currency’s value. This increased the cost of imported inputs and
other capital goods, which was not compensated by an equal rise in the prices of
manufactured output. These problems spilled into the marketing chain: on average,
53 percent of firms failed to pay their loans in time, while 40 percent did not pay at
all. Among the firms reporting conflicts with their clients, there were, on average, 6.5
cases of late repayment and about 4 cases of non-payment. It is believed that very
few of these cases were opportunistic. Genuine or opportunistic, late or non-
repayment of debts disrupt the smooth functioning of firms and impede their
development, especially given the problems they face to access financial resources.
28 Detailed analysis of the parallel market for foreign currency in Burundi and the determinants of the premium may be found in Nkurunziza (2000b).
47
4.1.4. Risky Environment
Economic risk is particularly high in Burundi. It is narrowly associated with the
small size of the private manufacturing sector. It is also associated with political risk,
which in turn is due to recurring wars since the 1960s. Although the impact of risk on
the manufacturing sector in Burundi has never been investigated, some statistics
suggest a negative correlation between manufacturing production and conflict. For
instance, after the killings of more than 200,000 people in 1972, manufacturing
production recorded a negative growth rate of -2.3 percent. Moreover, after the 1988
Ntega and Marangara political crisis in the second half of the year, data on
manufacturing production shows a decline of -2 percent in 1989. The most dramatic
decline in manufacturing has been recorded over the 1990s. On average,
manufacturing production has declined by 13 percent per annum between 1993 and
1997 (World Bank, 2000). In 1994, one year into the current political crisis, a sample
of 84 firms surveyed shows that 45 percent had kept their pre-crisis size or had
reduced it by less than 10 percent; 15 percent shrank by 10 to 25 percent whereas
21 declined by more than 25 percent (MPDR, 2001). In addition, the fact that short-
term lending in the form of working capital increased from 62 to 78 percent of total
lending to the private sector after the beginning of the crisis is another illustration of
the environment facing firms.
Rather than war itself, some other risks are associated with uncertainty about
war occurrence. Whereas the onset of war increases risk, its recurrence increases
uncertainty about the future, resulting in low investment rates. The rate of gross
investment has declined from 17.5 percent in 1990 to a mere 5.6 percent in 1998
(Burundi, MPDR, 2001). The extent of uncertainty is suggested by the fact that over
120 manufacturing firms interviewed in the first half of 1993 about 30 percent had
made recent additional investment in plant and equipment in 1992-1993. This rate of
firms that invest is equal to the one for Kenya in the same period. The fact that a
normal number of firms invested just a few months before a war of unprecedented
proportion erupted suggests that firm managers failed to anticipate the crisis. It will
be interesting to study how uncertainty will affect firms’ investment decisions in the
future when the crisis is over.
48
In addition to war-related risk, Burundi also faces risk associated with
geography. Due to its geographical isolation, Burundi pays a high cost on
international trade transactions. The country is fully dependent on its neighbours’
inefficient transport infrastructure for the importation of raw materials and other
consumer goods, as well as for its export of primary products. As a result, firms in
Burundi have to invest in large stocks of raw materials to minimise the cost resulting
from supply interruptions. At the same time, by minimising this cost, firms incur
opportunity costs when resources are tied up in unproductive assets. On average,
firms held inventories of raw material worth 39 percent of their yearly production or
the equivalent of 87 percent of the total cost of their raw material for a full year. This
is equivalent to about 10 months of raw material production needs29. If we consider
only firms that imported inputs in any proportion, the percentages are 61 and 122,
respectively30. Therefore, Burundi’s geography and poor infrastructure in
neighbouring countries impose additional constraints to the country’s manufacturing
sector and its economic performance.
4.2. Constraints Facing Households
While the previous sections have provided a review of the constraints facing
manufacturing firms and the economy in general, the aim of this sub-section is the
analysis of the environment constraining households, the latter’s responses and their
preferences over policies. Since households act also as firms, their activity has a
direct impact on growth. In this light, constraints to the production side of households
are also constraints to economic growth.
4.2.1. Environment Facing Households
As agriculture dominates household activity and income, their welfare is
affected by exogenous factors such as weather conditions, but also by government
policy that shapes the structure of incentives within the economy. Burundi is
29 Although this figure might appear too high, it is consistent with the fact that under circumstances prevailing in the early 1990s, it took 1.5 to 6 months to ship cargo just from Dar-es-Salaam to Bujumbura (Nkurunziza, 1997, p. 29). This huge time cost has been largely attributed to Tanzania’s wrecked infrastructure and long administrative delays. 30 These high values are explained by the fact that out of 27 firms that imported raw materials, 22 percent kept inventories that were far more in excess of 100 percent of their annual raw material cost. So long as these observations are genuine and not the result of data entry errors, we felt they should be included in the calculation.
49
endowed with generous weather that allows three production seasons in a year:
twice in highlands during the rainy season (October to May) and once in marshlands
during the dry season (June to September). As a result, although land pressure has
been increasing owing to population growth, soil fertility and good weather have, in
general, limited food shortages. Soil is naturally fertile; its conservation has been due
to traditional but efficient production technology associating farming with cattle
breeding. Consequently, until the 1980s, Burundi farmers were able to produce
enough food to feed the population, unlike many countries in Africa that have been
dependent on food aid. For a country like Burundi, this is a notable performance
given the production technologies used by rural households.
However, the lack of appropriate incentives and a support environment in
addition to government policies skewed against the rural sector have hampered the
development of a rural economy, failing to take advantage of the country’s
agricultural potential. Rural households have been the agents most affected by
governments’ predatory policies. The negligence of the agriculture sector is
illustrated by a few statistics. The rate of fertilizer use in Burundi is among the lowest
in Africa, at a mere 3.7 kg/ha compared with an average 14.9 kg/ha for Sub-Sahara
Africa. Moreover, the weaker linkage from industry to agriculture relative to the
stronger linkage from agriculture to industry is an illustration of the persistence of a
discriminatory policy against the agriculture sector. In Burundi, the agriculture sector
provides 11 percent of its production to industry but the rate from industry to
agriculture is only 0.4 percent (Ngaruko and Nkurunziza, 2000). These figures are
consistent with predatory policies pursued by the different regimes that have ruled
the country since independence.
The lack of incentives to farmers is also illustrated by low producer prices.
Taking coffee as an example, prices in Burundi are the lowest in the region, as the
following figure shows. In addition, since the government undermined cooperative
associations in the 1970s that had been formed to coordinate action in order to
rationalise the marketing of cash crops31, a large portion of the 60% margin on the
price of coffee that does not go to producers is reserved for redistribution to agents
31 The same attitude was observed in other African countries in the mid-1970s (Afeikhena and Olawale, 1999).

50
who largely include supporters of the political system, and to the state machinery
used to perpetuate the system of patronage and rent seeking.
Figure 7: Coffee Producer price in East Africa ($ per kilo): 1992(=1) to 1996(=5)
0 0.5 1 1.5 2
12
34
5
Yea
rs
Price
Burundi Rwanda Tanzania Uganda
The lack of a basic market infrastructure in rural Burundi has been a major
cause of market failure and probably the single most important factor that has
affected production in rural areas. As de Janvry et al. (1991, p. 1401) remark, “a
market fails when the cost of a transaction through market exchange creates
disutility greater than the utility gain that it produces, with the result that the market is
not used for the transaction”. The low density of market networks in rural Burundi in
addition to the distortions introduced by the government in the marketing of
agricultural products, have resulted in market failures and a retreat into subsistence
production. According to the EP1998, farmers in rural areas need to walk an average
of one hour to get to the nearest market while it takes them 30 minutes to reach the
nearest grocery. Twenty percent of households in the sample require more than an
hour to walk to the nearest market and 12 percent to the nearest grocery. Adding the
fact that there is only one market day per week in many rural areas, and that there
are no storage facilities, especially for perishable agriculture produce, farmers have
no incentive to produce marketable surpluses, inducing them into a subsistence
economy.
While more access to communication infrastructure could help integrate
markets in different parts of the country, infrastructure is either inexistent or poor,
especially during times of insecurity. For instance, with 3 mainlines per 1000

51
persons, Burundi has not only the lowest telephone density in Africa but it is also
highly concentrated in urban areas. A wider network of telecommunication across
the country could help integrate markets by allowing information exchange on prices,
supply and demand in different parts of the country. Electricity is concentrated in
cities and all households in rural areas and most in the cities depend on fuel wood
for their energy needs. During the war period, electricity infrastructure, a symbol of
urban privileges, has been a target of rebels’ sabotage. Security is precarious in
many places, and roads have not been maintained due to insecurity and shortage of
resources. Infrastructure problems are not limited to war-torn Burundi, however.
Even relatively peaceful countries including Nigeria, Kenya and Uganda report that
infrastructure is a major factor hindering economic activity, especially manufacturing
(Collier and Gunning, 1999; Reinikka and Svensson, 1999).
The lack of a physical market infrastructure in rural Burundi is accompanied
by a lack of financial and insurance markets, as discussed in the previous sections.
Government policy has also affected production through a number of channels. They
include monetary policy, which is another form of taxation through seignorage. This
form of taxation has particularly increased during the current period of war.
Moreover, financial repression has also impoverished households through negative
real deposit rates as a result of the government’s policy of establishing nominal
interest rates at very low levels. To these difficulties were added additional burdens
brought by the many civil wars that have devastated the country over the last four
decades.
The impact of the first four wars (1965, 1972, 1988, 1991) on the economy
was relatively limited by the fact that the massacres were carried out in a period of
just a few months. However, the war that broke out in 1993 has had a
unprecedented impact. It has been the longest, the deadliest and the most
destructive in economic terms32. Not only has production been disrupted but
infrastructure has been extensively damaged or completely destroyed. For instance,
the Ministry of Agriculture has estimated that the stock of livestock, amounting to 2.6
million heads in 1990, fell to 1.8 million by the late 1990s, translating a decline of 31
percent in just ten years (World Bank, 1999). Given the central importance of
32 See Nkurunziza and Ngaruko (2002) for details on war duration and why the last episode has been different from the previous four.

52
livestock on land productivity through its supply of organic fertiliser, it is clear that
such a loss represented an important destruction of household capital. In addition,
looting and killing of livestock has deprived rural households of an important source
of food especially at a time when many of them have been forced to leave their
houses and live in displacement camps due to rebel activity.
War has had a devastating impact on economic growth. In addition to its
sectoral impact discussed in the previous sections, GDP has declined since the early
1990s, recording four consecutive years of negative growth between 1993 and 1996.
Generally, all macroeconomic indicators have worsened as a result of war. At
household level, there has been a dramatic increase in poverty. In 1993, just before
the war, 40 percent of the population lived below the monetary poverty line; by 1998,
this proportion had increased to 60 percent, a rise of 50 percent in just five years.
Although these figures are quite informative, they are unable to translate the level of
rural populations’ agony, and the long-term impact of war on the populations. For
instance, as a result of the crisis, 22.5 percent of household heads countrywide have
become widowed. Seventy-seven percent of household heads admit to have been
directly affected by the crisis, of which 57 percent have been strongly affected.
Twenty-eight percent have lost close relatives while another 23 percent have been
displaced due to fighting. Therefore, in addition to the more direct economic impact
of the crisis on households, its psychological impact may be the most important long-
term factor that will have to be overcome to rebuild the Burundi society and its
economy. It is irrelevant to talk about the contribution of households to economic
growth when they are fighting for physical survival. Only when the war is over and
Burundians believe in a better future will they move on and refocus on their
economic security33.
4.2.2. Household Response
The picture depicted above shows that households face an adverse
environment. Households have responded to the environment in the expected way.
They have reduced their agriculture production, as the decline in the contribution of
33 For instance, the fact that many Burundians, among them many of the most highly trained professionals, have preferred to leave the country and live abroad as refugees is an important dimension of Burundi’s economic future. Whether or not they will choose to go back to the country once the war is over cannot be known now.

53
agriculture to GDP has shown in figure 2. In line with de Janvry et al. (1991),
households have also responded by shying from market exchange. Survey data
show that at the national level producers consume on average 64 percent of their
own food production. In regions where climatic conditions permit diversified
production, this average is as high as 80 percent, suggesting that market
transactions are higher in regions where specific staple foods cannot be grown.
Farmers’ preference for self-sufficiency is also consistent with Cukierman et al.,
(1992) finding that the risk of fiscal and monetary taxation tends to increase in
countries like Burundi experiencing political instability. In addition, the fear of market
exposure and ensuing taxation has induced most households to transform their
surpluses into in-kind savings as suggested by Gosh (1986).
More specifically, a general tendency towards diversification is illustrated by
the following figures. According to household survey data, 80 percent of households
in Burundi produce beans, 72 % produce sweet potatoes, 64 % produce banana, 58
% produce maize, and 52 % produce cassava, despite the fact that different
ecological zones are far more conducive for the production of different products34.
The only factor that tends to limit the portfolio of households production is their
ecological zone. Hence, within the same ecological zone, the level of diversification
is even higher. For instance, in the Western Plateaus ecological zone, the rates are:
93 percent for beans; 91 for sweet potatoes; 86 for banana; 71 for cassava; 66 for
coffee; and 56 for maize. Every household tends to produce a bit of everything. The
result of excessive diversification and political instability has been a drop in
productivity of the agriculture sector as a whole shown in figure 3, and a drop in the
total production of food.
Figure 8 summarises the performance of the agriculture sector by comparing
food and non-food production indices over a period of 35 years. The index of food
production per capita declined from 120 in 1970 to about 100 in 1990 and 80 in
1997. From the early 1970s until 1993, per capita food production index remained
consistently higher, despite a steady growth in population of about 3 percent, than
the average for Africa. During the 1970s and the 1980s the average annual
percentage growth for the non-food production index was at least twice Africa’s
34 The North and East are more productive in beans and sorghum; the West in cassava; the South in peas and maize, etc.

54
average (World Bank, 1998). This picture changed in the 1990s as the country
plunged into civil war. Per capita food production index declined from 103 in 1990 to
85 in 1996 while the African average declined from 99 to 96 over the same period.
Non-food production index declined from 107 in 1991 to 72 in 1996, against an
increase in the African average from 101 to 108 over the same period. Several other
indicators of welfare followed the same pattern in Burundi in the 1990s, translating
an increasing pressure on rural households and deterioration in their standard of
living (World Bank, 1998).
Figure 8: Food and Non-food Production Indexes (1989-91=100)
020406080
100120140
1960 1965 1970 1975 1980 1985 1990 1995 2000
Food Non-food
Government predatory policies encouraged the production of cash crops at
the expense of food crops. This is reflected in figure 8 showing their increase relative
to food production. However, this policy was in a way based on coercion so
monitoring by government agents was essential to its success. In figure 8, the
collapse of government in the mid-1990s due to political instability resulted in a more
pronounced decline of cash crop production. A study undertaken in the Rusizi plains
where most of the country’s cotton is produced showed that farmers were forced to
plant cotton on their prime land although they preferred to grow tomatoes which
generated three times more income than cotton. As a result, farmers were growing
tomatoes under the cover of cotton, but this combination reduced the yields of both
cotton and tomatoes (Nkurunziza, 1987).
In his discussion of coffee production in Burundi, Kaburahe (2001) notes that
extension agents in Burundi behaved as policemen: in many cases the same
individual was the representative of the single party, the administrator of the area
and the extension agent. Such individuals tended to confuse their role as extension

55
agents with their political roles, using their power to impose their choices on farmers
instead of pursuing a participatory approach to the provision of extension services.
Forced specialization by government agencies has failed because it has been ill
advised, ignored the basic cost-benefit economic principle, has been incentive
incompatible and, above all, it has been biased against the food sector that is of
more interest to farmers. In a recent survey in one of Burundi coffee producing
regions, Kaburahe (2001) reports that in monetary terms, one hectare devoted to
growing potatoes was yielding revenue six times higher than that yielded by a
hectare of coffee, despite the fact that coffee required two to three times more labour
than potatoes (Kaburahe, 2001).
Table 7 provides more empirical data on the relative profitability of food and
industrial cash crops. Generally speaking, for comparable land quality and even
taking into account the different levels of taxation for the different products, food
crops are much more productive than industrial crops. Despite the fact that banana
is many times more productive than coffee in the central plateaux region, banana
cultivation has been fought by government agents on the grounds that it harms
coffee production, especially when the two were planted on the same plots.
Government agents would simply cut down all banana trees to clear space for coffee
trees. Cash crops such as coffee and tea are not only less profitable but they also
degrade the soil and imply a high opportunity cost as the land where they are
planted is foreclosed for a number of years in comparison to food crops which free
up the land after just a few months. More generally, as Table 7 suggests, growing
export and industrial crops under the prevailing conditions is clearly a sub-optimal
allocation of factors (labour and land), especially in a country where land is so
scarce. This is a clear instance where, by privileging the production of export crops
that generate more public revenue through predatory taxation, the priorities of the
state have been set in opposition to farmers’ interests as well as economic growth.
To some extent, an appropriate policy to encourage growing export crops could
potentially increase market transactions as specialisation in the production of cash
crops would imply that food produce would be purchased in the market.
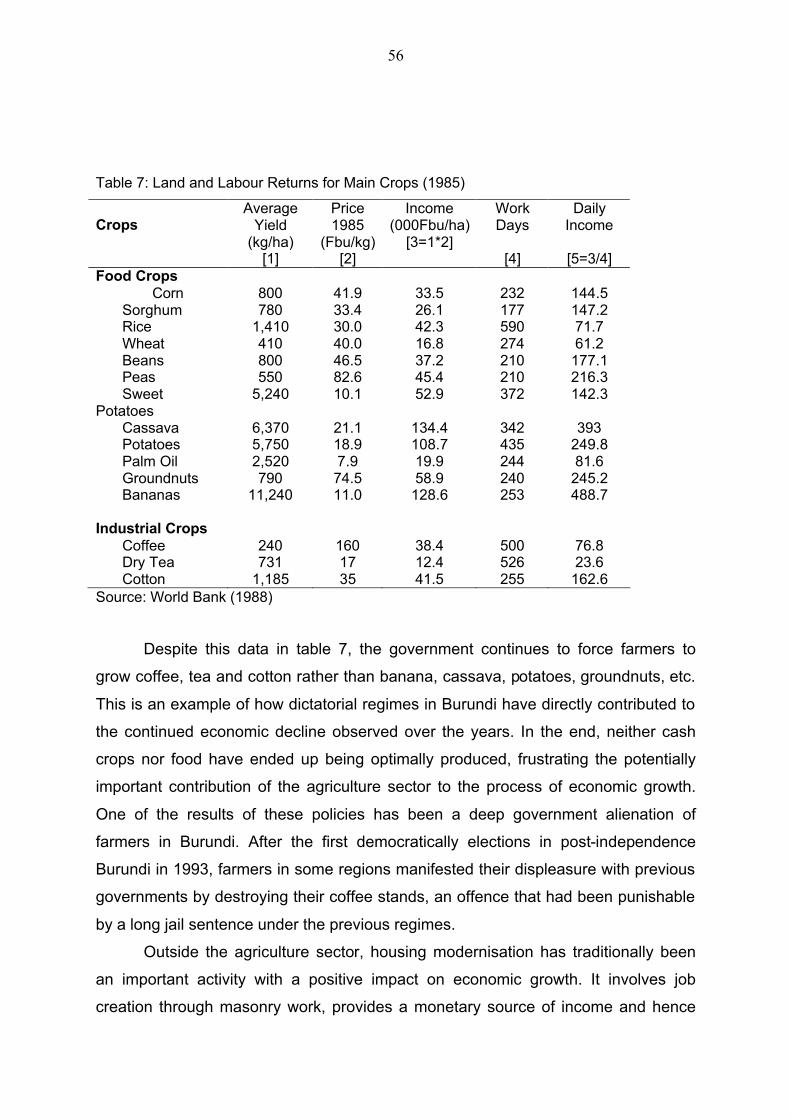
56
Table 7: Land and Labour Returns for Main Crops (1985)
Crops
Average Yield
(kg/ha) [1]
Price 1985
(Fbu/kg) [2]
Income (000Fbu/ha)
[3=1*2]
Work Days
[4]
Daily Income
[5=3/4]
Food Crops Corn 800 41.9 33.5 232 144.5 Sorghum 780 33.4 26.1 177 147.2 Rice 1,410 30.0 42.3 590 71.7 Wheat 410 40.0 16.8 274 61.2 Beans 800 46.5 37.2 210 177.1 Peas 550 82.6 45.4 210 216.3 Sweet Potatoes
5,240 10.1 52.9 372 142.3
Cassava 6,370 21.1 134.4 342 393 Potatoes 5,750 18.9 108.7 435 249.8 Palm Oil 2,520 7.9 19.9 244 81.6 Groundnuts 790 74.5 58.9 240 245.2 Bananas 11,240 11.0 128.6 253 488.7 Industrial Crops Coffee 240 160 38.4 500 76.8 Dry Tea 731 17 12.4 526 23.6 Cotton 1,185 35 41.5 255 162.6 Source: World Bank (1988)
Despite this data in table 7, the government continues to force farmers to
grow coffee, tea and cotton rather than banana, cassava, potatoes, groundnuts, etc.
This is an example of how dictatorial regimes in Burundi have directly contributed to
the continued economic decline observed over the years. In the end, neither cash
crops nor food have ended up being optimally produced, frustrating the potentially
important contribution of the agriculture sector to the process of economic growth.
One of the results of these policies has been a deep government alienation of
farmers in Burundi. After the first democratically elections in post-independence
Burundi in 1993, farmers in some regions manifested their displeasure with previous
governments by destroying their coffee stands, an offence that had been punishable
by a long jail sentence under the previous regimes.
Outside the agriculture sector, housing modernisation has traditionally been
an important activity with a positive impact on economic growth. It involves job
creation through masonry work, provides a monetary source of income and hence
57
constitutes a basis for activity diversification. However, housing modernization has
also been seen as a form of investment in rural areas. Together with livestock
accumulation and land, housing investments have been households’ indirect ways of
preserving wealth from the vagaries of government policy and other forms of
extortion. The current war has changed this picture. Rural households have
particularly suffered frequent raids by rebels who destroy houses and steal livestock,
resulting in population displacements which in turn, has acted as an enormous
disincentive for investment in land, housing or livestock. For instance, 77 percent of
households interviewed in the 1998 admitted to have been affected by the crisis, of
which 16 percent totally lost their capital and household durable goods. As a result,
there has been a shift of preferences towards monetary assets, in spite of an
increase in inflationary taxation. The continuation of war has, therefore, curtailed
rural investments, another way in which the environment facing households has had
a detrimental impact on economic growth.
4.2.3. Preferences Over Policies
Rural Burundians mistrust their governments for many reasons. First, over the
years, rural Burundians have carried the brunt of the country’s tragic experiences in
which the government has been a main actor. Hence, questions regarding rural
Burundians’ perceptions of anything involving the government are usually treated
with suspicion. Secondly, government predation and the coercive nature of policies
have implied that rural households attempt, as much as possible, to conceal their
wealth as well as their preferences. They do not believe anyone would be interested
to know about their preferences because they have only known authoritarian
regimes, including under the monarchic regime. This traumatic experience has made
rural populations very suspicious especially vis-à-vis strangers. Therefore, it is
difficult to know household preferences over different policies because they have
rarely been asked to voice their opinions. Even in the cities, the picture is similar
albeit with the added confusion arising from ethno-economic politicking.
The first time Burundians were given a genuine chance to express their
preferences was when they overwhelmingly voted for the country’s self-
determination in 1961, showing the importance they attached to freedom. Also, until
the first half of the 1980s, the Catholic Church had successfully established parallel
58
institutions of education and social emancipation outside the realm of government
controls. Discussion and prayer meetings, literacy programmes and recreational
activities were regularly organized and used as avenues for information exchange.
These programmes were successful because they constituted the only space for free
expression left for many in rural Burundi. In the cities, the government controlled all
the media in a typical one-party political system. The government finally closed down
these structures in rural areas causing a row with the Catholic Church that led to the
expulsion of a large number of missionaries from the country and the nationalisation
of almost all church-run schools. The government’s extreme suspicion of its own
citizens did not leave room for free expression and preference revelation.
The second opportunity when Burundians expressed freely their preferences
was in 1993 when they voted in a truly democratic and multiparty election. They
showed their displeasure with past policies by overwhelmingly voting out the ruling
party that had dominated Burundian politics since the early 1960s. FRODEBU, a
young party with a new breed of politicians, was seen by many as an opportunity to
force change in a peaceful transition in a country where regime changes had always
been carried out through the barrel of the gun. As soon as they took power,
FRODEBU leaders engaged in a witch hunt filling government posts with their own
clients to reward their loyalty. After only four months in power, the democratically
elected regime was deposed in a bloody military coup in which the leadership of the
new party was decapitated through the killing of its members and forcing most of the
survivors into exile. To date, the population is still paying the price of ethno-economic
politicking between government representatives, a constellation of opposition parties,
and the armed rebels, each driven by individual interests.
In a nutshell, therefore, although it is difficult to tell for sure the population’s
preferences over policies since they have been given very few opportunities to voice
their desiderata, we can make inferences based only on the 1993 elections35. In
1993, Burundians rejected past government policies that viewed the rural sector only
as a source of rents. Some reactions also such as the burning of cash crops and the
growing of tomatoes under the cover of cotton were methods of expression of
peasants’ disapproval of government measures. The gulf separating Burundians and
35 The 1961 elections were held in a particular context and for a particular reason: accession of the country to self-determination.

59
their political leaders has been revealed by events in the 1990s, which have shown
the level of politicians’ greed and their total lack of interest in the plight of the
populations they all claim to be fighting for. As a result, more and more Burundians
are voicing openly that they feel cheated by those who should have represented
them. The populations have been begging for no more than security from their
politicians, the minimum condition that will allow them to work hard and earn their
living as they have done throughout their long history.
4. CONCLUSION
This study has analysed the process of economic growth in Burundi over the
period 1960-2000. The pattern of economic growth followed closely the country’s
political trajectory represented in three sub-periods: 1960-1972; 1972-1988, and
1988 to date. Economic decline during the first sub-period was largely due to two
main factors: First, decolonisation resulted in the loss of Burundi’s export markets in
neighbouring Rwanda and Congo which, together with Burundi, had formed an
economic union under Belgian rule. The second factor is political instability, resulting
from a legacy of high ethnic tensions left by the colonial power at a time when
different groups in the country were competing to control state institutions and some
assets left by departing Belgians. These tensions resulted in two civil wars in 1965
and 1972, respectively. During the period 1972-1988, economic growth was fuelled
by an increase in coffee export revenues in the second half of the 1970s and
massive foreign borrowing. Most investment was undertaken by the state mostly in
inefficient projects. During the third sub-period, economic decline was a result of
three civil wars, a total economic blockade, the freezing of aid from international
donors and the collapse in investment and production infrastructure.
More specifically, the study explored four main economic factors to explain
the patterns of economic growth in Burundi. First, farmers have been over-taxed
through several means, including cash crop producer prices and exchange rate
policy. This policy has prevented accumulation in agriculture and its transformation
into a more productive sector. In a system where returns to investment have been
appropriated by other groups, producers faced disincentives to domestic
accumulation leading to stagnation (Benhabib and Rustichini, 1996). Secondly, while
the industrial sector has benefited from the massive external borrowing that took
60
place from the mid-70s, the process disconnected economic growth from an
increase in productivity in agriculture (Figure 3). Thirdly, the creation of state-owned
enterprises resulted in bureaucratic expansion and predation that benefited mostly a
small elite of people from the Southern province of Bururi. Fourthly, the ensuing
public deficits increased the fiscal pressure on private manufacturers to secure
massive subsidies to be transferred to poorly managed public enterprises. This
pressure was transmitted to agriculture through the marketing board for export crops.
As Hugon (1993) has remarked, an economic approach cannot, alone,
explain the performance of a war economy such as Burundi’s. Therefore, the study
blended traditional macroeconomic growth analysis with microeconomic and
institutional approaches to understand the process of economic growth in Burundi.
This approach was necessary since in Burundi, more than economic factors, political
factors generate macroeconomic variables used to analyse economic performance.
For instance, the tragic events of 1972 saw the country losing more than 200000 of
its most active labour force, wiping part of its best human capital stock in just about
four months. From an economist standpoint, this was a disaster but political
imperatives prevailed over economic considerations. In the 1990s, in the war
opposing rebels and the government, destruction of physical capital including health
centres, administrative buildings, private residences and other non-military
infrastructure has become the norm within the rebellion. Given this picture, it would
be too naïve to assume that economic growth in Burundi might just be predicted by
values of physical and human capital which are themselves endogenous to political
variables. In this light, political economy appeared as a more powerful tool in
explaining Burundi’s economic performance.
The study has argued that Burundi’s dismal economic performance is mainly
a direct result of a failure in the country’s governance. Ruled by dictators obsessed
with controls, the country’s economy has remained highly centralised with a myriad
of economic controls. Monetary, exchange rate and other financial policies were put
in place to control the allocation of the country’s resources. Even more directly, the
creation of state corporations to oversee the marketing of agricultural and imported
products was another way of ensuring that the government was in charge of the
allocation of strategic products, including domestically produced food. The
overarching objective of the policies was the government’s desire to hold its grip over
the different sources of economic rents. Different methods were used to distribute

61
these rents among the ruling elite. For instance, by creating a big number of state
corporations and putting their management into the hands of those close to power,
rent sharing was one of the functions of state enterprises. As a result, the rent
sharing system has not been concerned with efficiency and most of those firms have
rarely been profitable.
Using discriminatory education policies, the country chose to limit its stock of
human capital by filtering access to education to ensure that the system of rent
seeking was stable. Through concentrations in the allocation of education
infrastructure in the country and through other complex mechanisms, the country
leaders favoured those identifiable with their group, aware that education was the
conduit through which Burundians could improve their standards of livings, as the
earnings equation has suggested. Other policies included predation over farmers by
offering them the lowest prices in the region, different forms of taxation, as well as a
complete negligence of the agriculture sector despite it being the backbone of the
economy. Lack of a basic market infrastructure in rural areas and the inappropriate
interventions in the agriculture sector have locked farmers into subsistence
agriculture. On the whole, economic efficiency has been sacrificed in order to fulfil
individual and group interests.
As a result, given that economic principles have been systematically violated
in the management of the country’s economy, it is not surprising that Burundi has
performed so poorly. The policies pursued have led to recurrent wars and a
generalised decline in the standards of living of the majority of Burundians. Currently,
Burundi’s per capita income is almost half its 1960 level. In addition to the huge
number of lives lost due to five episodes of an endless civil war, the country has
been caught in a cycle of construction, destruction and re-construction, both in terms
of physical and human capital, with an incalculable cost on the economy. The
recurrence of war with its accompanying destructions have created extreme
uncertainty which in turn, has affected economic activity through an extremely low
level of private investment and high credit costs. Burundi’s dismal economic
performance has led to the conclusion that it will take 225 years to cut the country’s
poverty level by half, given Burundi’s track record (Ali Ali, 2001).
The natural question following these discussions is how will Burundi recover
from these long years of economic decline? What is shown in the study is that
62
economic decline has been due to identifiable factors that could have been avoided.
Most of the current economic crisis is the consequence of poor governance.
Therefore, without pretending to have a miracle solution to the deeply rooted
problems facing the country, it is not appropriate to advocate economic measures in
Burundi without deep political reforms. When the current war broke out in 1993, the
country was 7 years into a structural adjustment programme that had been hailed as
a success in Africa. However, as the war raged, most of the gains made in terms of
economic reforms were lost. Radical political changes are needed to lay the basis for
a stable and equitable system in which the fruits of economic activities will benefit
first and foremost those who undertake them, namely Burundian farmers. If the
leadership transforms its zero-sum political system into one based on reputation and
predictability, politicians will become more accountable to the population. This
change will loosen government controls over the economy, changing the priorities
from patronage to targeting the rural populations where more than 90 percent of their
constituencies live.
To achieve this objective, there will be a need for confidence building between
Burundi leaders and their populations. Burundians feel alienated from their leaders
who, through their biased policies, have privileged their own interests at the expense
of the population as a whole. Policies ignoring farmers’ needs, such as forcing them
into the production of crops that are not profitable to them has been a mistake that
will need to be redressed. In Burundi as elsewhere, economic agents such as
households and firms respond to incentives so their contribution to the process of
economic growth will in large depend on the structure of incentives within the
economy (Easterly, 2001), such as the price structure of agriculture production.
Obviously, any effort at boosting the country’s economy will be futile unless the root
causes of the long cycle of violence are addressed. In all the crises that have rocked
the country since its independence, the major players have been politicians although
the population they claim to represent is the one that has been paying the price.
Therefore, more importantly than any economic considerations, the protection of
human life and socio-economic integration of all Burundians without any distinction
based on regional or ethnic background should be the basic principle guiding
Burundi’s political and economic reforms. It remains to be seen whether the current

63
political “reforms” and the installation of a new “inclusive” interim government on 1
November 2001 will bring about such changes.

REFERENCES
Adeola, F. A. and Olugboyega, O. (1999), “Characteristics and Behaviour of African
Factor Markets and Market Institutions and their Consequences for Economic
Growth”, background paper prepared for the AERC Collaborative Project on
“Explaining Africa’s Economic Growth Performance”, Nairobi, Kenya.
Afeikheana, J. and Olawale, O. (1999), Characteristics and Behaviour of African
Commodity/Product Markets and Market Institutions and their Consequences for
Economic Growth”, background paper prepared for the AERC Collaborative Project
on “Explaining Africa’s Economic Growth Performance”, Nairobi, Kenya.
Ali, A. G. Ali (2001), “Can Africa cut its poverty level by half by 2015?”, United
Nations Economic Commission for Africa, Economic Report on Africa 2000, Addis
Ababa, Ethiopia.
Ali, A. G. A. and Elbadawi, I. (1999), “Inequality and the Dynamics of Poverty and
Growth”, Revised version of the background paper prepared for the AERC
Collaborative Project on “Explaining Africa’s Economic Growth Performance”,
Nairobi, Kenya.
Aryeetey, E. and Udry, C. (1999), “Saving in Sub-Saharan Africa”, background paper
prepared for the AERC Collaborative Project on “Explaining Africa’s Economic
Growth Performance”, Nairobi, Kenya.
Bates, R. (1983), Essays on the Political Economy of Rural Africa, Cambridge:
Cambridge University Press, United Kingdom.
Benhabib, J. and Rustichini, A. (1996), “Social Conflict and Growth”, Journal of
Economic Growth, 1 (March), 125-142
BIGSTEN, A., P. COLLIER, S. DERCON, M. FAFCHAMPS, B. GAUTHIER, J. W. GUNNING, M.
SODERBOM, A. ODURO, R. OOSTENDORP, C. PATTILLO, F. TEAL, and A. ZEUFACK (2000):
“Contract Flexibility and Dispute Resolution in African Manufacturing," Journal of
Development Studies, 36, 1-37.
Burundi, Ministère de la Planification du Développement et de la Reconstruction-
MPDR (2001), Programme National d’Action pour le Développement du Burundi
2001 – 2010, Troisième Conférence des Nations Unies sur les Pays les Moins
Avancés, Bruxelles, 13 – 20 mai
Chretien, J. P. (2001), “Le Burundi Après la Signature de l’Accord d‘Arusha”,
Politique Africaine, 80 Décembre, 136-51.

66
Collier, P. and Gunning, J. (1999), “Explaining African Economic Performance”,
Journal of Economic Literature, Vol. XXXVII (March), 64-111.
Collins, S. M. and Bosworth, B. P. (1996), “Economic Growth in East Asia:
Accumulation versus Assimilation”, Brookings Papers on Economic Activity, 2.
Cukierman, A., Edwards, S. and Tabellini, G. (1992), “Seignorage and Political
Instability”, The American Economic Review, vol. 82.
De Janvry, A., Fafchamps, M. and Sadoulet, M. (1991), “Peasant Household
Behaviour with Missing Markets: Some Paradoxes Explained”, The Economic
Journal, 101(409), 1400-1417
De Lespinay, C. (2000), “Les Eglises et le genocide dans la région des Grands Lacs
est-africains”, http://www.u-paris10.fr/gdr1178/lesp-egl.htm
Easterly, William (2001), The Elusive Quest for Growth. The MIT Press, Cambridge,
Massachusetts.
Fafchamps, M. (1999), “Networks, Communities, and Markets in Sub-Saharan
Africa: Implications for Firm Growth and Investment”, Journal of African Economies,
forthcoming
FAFCHAMPS, M., and B. MINTEN (1999): "Relationships and Traders in Madagascar,"
Journal of Development Studies, 35, 1-35.
Gemmell, N. (1996), Evaluating the impacts of Human Capital Stocks and
Accumulation on Economic Growth: Some New Evidence, Oxford Bulletin of
Economics and Statistics, 58, 9-28.
Ghei, N. and Kiguel, M. A. (1992), “Dual and Multiple Exchange Rate Systems in
Developing Countries: Some Empirical Evidence”, World Bank Working Paper
Series, WPS No. 881 (April)
Ghosh, D. (1986), “Savings Behaviour in the Non-Monetized Sector and Its
Implications”, Savings and Development, 2.
Greenaway, D. and Milner, C. R. (1990), “Policy Appraisal and the Structure of
Protection in a Low-Income Developing Country: Problems of Measurement and
Evaluation in Burundi”, The Journal of Development Studies, Volume 27, 22-42
Hugon, P. (1993), L’Economie de l’Afrique, Repères – La Découverte, Paris.
IMF (1997), “Burundi: Recent Economic Developments”, IMF Staff Country Report
No. 97/114, November 17.
IMF (1999), “Burundi: Statistical Annex”, IMF Staff Country Report No. 99/8
(February), International Monetary Fund, Washington, D. C.

67
International Crisis Group (2001), Burundi: Breaking the Deadlock: The Urgent Need
for a New Negotiating Framework, Africa Report No. 29, May 14, Brussels/Nairobi.
ISTEEBU (2001), “Enquête Prioritaire 1998: Etude Nationale sur les Conditions de
Vie des Populations”, Bujumbura, Burundi.
Jackson, T. (2001), “L’Egalite d’accès à l’éducation: un impératif pour la paix au
Burundi”, International Alert, manuscript.
Kaburahe, C. (2001), “Plaidoyer pour le caféiculteur Burundais”, In-
burundi.com/presse1411analyse.htm
Lemarchand, René (1994). Burundi : Ethnic Conflict and Genocide. Cambridge
University Press.
Ndulu, B. J. and O’Connel, A. O. (2000), Background Information on Economic
Growth, AERC Explaining African Economic Growth Project, Nairobi, Kenya.
Ngaruko, F. (1993), “L’Industrie et l’Accumulation au Burundi”, Mondes En
Développement Vol. 21 No. 2.
Ngaruko, F. and Nkurunziza, J. D. (2000), “An Economic Interpretation of Conflict in
Burundi”, Journal of African Economies, Volume 9, No.3, 370-409
Nkurunziza, Janvier D. and Floribert Ngaruko (2002), War and Its Duration in
Burundi, presented at the World Bank/Yale University conference on “The
Economics of Political and Common Violence”, University of Yale, (April).
Nkurunziza, Janvier D. (1987), L’Economie Cotonnière au Burundi, University of
Burundi, Licence Thesis
------------------------- (1997), Determination of Efficiency, Exchange Rate and the
Premium of the Parallel Market for Foreign Currency in Burundi, M.Sc. Thesis
------------------------- (2000a), “Devaluation, Inflation and Money Supply in a War-torn
Economy: An Empirical Test of the Vicious Cycle Hypothesis for Burundi”, research
project proposal, African Economic Research Consortium (AERC), Nairobi, Kenya.
------------------------- (2000b), “The Parallel Market for Foreign Currency in Burundi”,
AERC Research Paper, Nairobi, Kenya (forthcoming)
------------------------- (2001), “Contract Enforcement and Credit Markets in Africa”, D.
Phil Thesis, University of Oxford, work in progress
------------------------ (2002), Policy, War and Food Security in Burundi, Report
prepared for the Food and Agriculture Organization (FAO), Manuscript.

68
Ntibazonkiza, R. (1993), “Au Royaume des Seigneurs de la Lance. Une Approche
Historique de la Question Ethnique au Burundi. Tome 2 – De l’independence à Nos
Jours (1962-1992)”, La Louvière: Centre d’Animation en Langues.
Nyamoya, P. (1998), “Pour un Modèle Original de Privatisation des Entreprises
Publiques au Burundi”, RIDEC, Vol. 2 No. 2, Septembre, Bujumbura, Burundi.
Nyamoya, P. (2001), Analyse Economique Appliquée au Système Educatif
Burundais 1980-2000, Rapport Provisoire, IDEC, Juin, Bujumbura, Burundi.
O’Connel, S.A. and Ndulu, B. J. (2000), Africa’s Growth Experience: A Focus on
Sources of Growth, AERC, Nairobi, Kenya.
Orivel, F. (1995), “Education Primaire et Croissance Economique en Afrique sub-
Saharienne: Les Conditions d’une Relation Efficace”, Revue d’Economie du
Développement, No. 1.
Oyejide, T. A. (1999), “Markets and Economic Growth in Africa”, background paper
prepared for the AERC Collaborative Project on “Explaining Africa’s Economic
Growth Performance”, Nairobi, Kenya.
Pritchett, Lant and Deon Filmer (1999), “What Educational Production Functions
Really Show: A Positive Theory of Education Spending”, Economics of Education
Review 18, no. 2 (April): 223-239.
Reinikka, R. and Svensson, J. (1999), “How Inadequate Provision of Public
Infrastructure and Services Affects Private Investment”, Policy Research Working
Paper 2262, The World Bank, Washington, D. C.
Reyntjens, P. (1994), L’Afrique des Grands Lacs en Crise, Karthala, Paris: Summers
Sleuwaegen, L. and Goedhuys, M. (1998), “Barriers to Growth of Firms in
Developing Countries: Evidence from Burundi”, RPED Discussion Paper No. 91,
The World Bank, Washington, D. C.
World Bank (1992), Regional Program on Enterprise Development (RPED): Burundi,
original data set.
World Bank (1998), African Development Indicators 1998/1999, Washington D.C.
World Bank (1999), Burundi. Poverty Note. Prospects for Social Protection in a Crisis
Economy, Report No. 17909-Bu, Washington, D.C., February 23.
World Bank (2000), World Development Indicators 2000, CD-ROM database.