Embed Size (px)
Citation preview
University of Chicago Law SchoolChicago UnboundKreisman Working Paper Series in Housing Law andPolicy Working Papers
2014
Expertise Value Added in the Real Estate MarketSebastien Gay
Allen T. Zhang
Follow this and additional works at: https://chicagounbound.uchicago.edu/housing_law_and_policy
Part of the Law Commons
Chicago Unbound includes both works in progress and final versions of articles. Please be aware thata more recent version of this article may be available on Chicago Unbound, SSRN or elsewhere.
This Working Paper is brought to you for free and open access by the Working Papers at Chicago Unbound. It has been accepted for inclusion inKreisman Working Paper Series in Housing Law and Policy by an authorized administrator of Chicago Unbound. For more information, please [email protected].
Recommended CitationSebastien Gay & Allen T. Zhang, "Expertise Value Added in the Real Estate Market" (Kreisman Working Papers Series in Housing Lawand Policy No. 20, 2014).

CHICAGO KREISMAN WORKING PAPER ON HOUSING LAW AND POLICY NO. 20
EXPERTISE VALUE ADDED IN THE REAL ESTATE MARKET
Sebastien Gay and Allen T. Zhang
THE LAW SCHOOL THE UNIVERSITY OF CHICAGO
December 2014
This paper can be downloaded without charge at the Kreisman Working Papers Series in Housing Law
and Policy: http://chicagounbound.uchicago.edu/housing_law_and_policy_wp/ and The Social Science Research Network Electronic Paper Collection.

Expertise Value Added in the Real Estate Market
Sebastien Gay, University of Chicago
Allen T. Zhang, Chicago Booth School of Business∗
December 6, 2014
Abstract
We consider the effect of expertise on economic transactions, with a particular focus on the real
estate market. We show that even as listing information becomes increasingly accessible on real es-
tate aggregation websites, realtor expertise remains important in securing a desirable sale price. One
main channel for the effects of such expertise is improving information dissemination to potential buyers
through higher quality listings. Using listing photos and remarks as measures of quality, we find that
realtor activity is correlated with significantly higher quality listings. We then measure the price impact
of these measures of quality and find that, even after controlling for a large spectrum of house character-
istics, listing quality is correlated with higher sale prices. Additionally, we find that unobserved benefits
of expertise such as negotiation or showmanship remain even after controlling for listing quality.
∗We thank Ed Coulson, Gilles Duranton, Greg Lewis, Abdullah Yavas, and especially Matthew Gentzkow and Jesse M. Shapirofor their helpful comments. All mistakes are our own. E-mail addresses: [email protected], [email protected].
1

1 Introduction
Expert agents have traditionally played important roles in facilitating the exchange of goods. For example,
travel agents match hotels and flights with potential travelers and realtors match buyers and sellers of houses.
Many of these roles have recently come under attack due to the entry of online platforms that provide much
of the same information, often at no cost. In some markets, experts have remained resilient to this entry and
still play crucial roles in facilitating transactions. We want to study how experts can continue to add value
in these markets.
In this paper, we focus on the real estate market, which is particularly suited for this study as ample
information is available not only on the goods exchanged but also on the relevant realtors. Realtors are
important intermediaries in real estate transactions as they smooth the process of information gathering,
match buyers and sellers, and aid in the ultimate negotiation process. They also advertise and market the
house by putting up listings on the MLS (Multiple Listing Service) system and real estate web portals
such as Zillow, Trulia, and Redfin.1 Realtor expertise aids in these aspects and also leads to more reliable
assessments of the house’s value. Simply put, realtors match buyers and sellers for a given property and rely
on their expertise of the local market and observable and unobservable characteristics to form their expert
opinions.
The entry of internet real estate listing aggregation websites has provided house buyers and sellers with
opportunities to bypass agents. Most buyers now start their research on the internet and trim down the num-
ber of houses they consider by searching for desired characteristics. Home buyers and sellers can easily
access information about properties of interest or comparable properties in their locale or even around the
country using Trulia, Zillow, Google maps, and countless other freely accessible online resources. Accord-
ing to the 2014 Real Estate Association Report, “90% of home buyers searched online during their home
buying process.” By providing easy access to almost all of the houses for sale, website have essentially
supplanted much of the realtor’s role in the search process.2 Nonetheless, more than 75% of the potential
pool of buyers and sellers still employ realtors. We focus on how the expertise (as measured by realtor ac-
tivity and realtor experience) of the seller’s realtor can contribute to this search process: by providing higher
1Ford, Rutherford, and Yavas (2005) show that houses that were listed on the internet take slightly longer to sell but sell formarginally higher prices.
2This increasing use of online search has caused industry experts to question the future of realtors (Kasanoff 2014). However,other experts are more optimistic: some say that realtors are nonetheless very important in the real estate market as they helpprovide additional information and services (e.g., the builder having a reputation for leaky roofs or the granite counter tops havinga very slight pitch) that may not be precisely presented in photos or descriptions (Calltharp 2014).
2

quality listings, expert realtors can improve the dissemination of information to potential buyers. Our paper
differs from the existing literature as it explicitly shows how realtor expertise is correlated with higher sale
prices through the channel of listing quality.
We measure listing quality by its ability to disseminate information about the house of interest. To do so,
we construct three measures of listing quality: number of photos, the median resolution of photos, and the
objectiveness of its text remarks. All three measures seek to measure the effectiveness of the listing in infor-
mation dissemination. Greater numbers of quality photos provide buyers more comprehensive information
about a house’s features, while having objective as opposed to subjective remarks reduces ambiguities about
specific characteristics.
We then show that realtors with more activity are associated with higher quality listings, which are then
correlated with increases in the sale price. These results hold even after a rich set of controls on house
characteristics (such as square feet, number of bedrooms, number of bathrooms, the age of the house in
years, and the average rating of nearby schools), calendar year-quarter fixed effects, zip code fixed effects,
city-block fixed effects, and controls for the length of the remark and potential physical upgrades. Finally,
we find that the coefficients for objective phrases are larger in magnitude when describing basic features
of the house (e.g., kitchen, windows, cabinets, lighting) as opposed to premium features of the house (e.g.,
fireplace, swimming pool). We interpret these results to mean that objective phrasing is able to better
communicate additional information for basic house characteristics. For premium characteristics, their mere
existence is sufficient information.
Our results are subject to a number of important limitations, primarily due to the difficulties in identi-
fying causal effects in the presence of unobserved house characteristics. The first limitation concerns our
analysis of the relationship between listing quality and realtor experience / activity. The assignment of real-
tors to properties is unlikely to be random—experienced or active realtors may be more likely to represent
houses with more positive unobservable characteristics. Our main concern is that these houses present more
opportunities for photos, which could explain part of the correlation we observe between realtor experience
/ activity and photo quality. We partially address this concern by exploiting the fact that any sell-side realtor
also works on the buy-side, where they are likely to transact houses with similar unobservable characteris-
tics, but have no influence on listing quality. Thus, we account for the effects of unobservable characteristics
on listing quality by adding the observable house characteristics and listing quality of these buy-side houses
as controls. Additionally, we note that photo quality is relatively cheap to produce (even standard smart
3

phones are able to produce high quantities of high-resolution photos), so the realization of listing quality is
likely to be more realtor-dependent rather than property-dependent.
The second limitation concerns our results of sale price and time on market on listing quality. Due to
unobserved house characteristics, we caution against interpreting the coefficients from these regressions as
causal effects. However, note that we partially address these confounds by adding property fixed effects and
focusing on the variation between multiple sales of the same property.
Our measures capture listing features considered important by both industry and academic experts.
Lewis (2011) also employs quantity of photos and text remarks. He shows that a precise description, re-
gardless of whether it’s positive or negative, has a significant effect on the price of cars on average. The
effect of descriptions and words in particular has been extensively studied. A 2005 National Bureau of Eco-
nomic Research study explains that remarks containing words that depict objective attributes like "granite,"
"maple," or "gourmet" leads to higher sale prices of homes whereas more subjective words, open to any-
one’s interpretation and preferences, like "clean," "quiet," "fantastic," and "charming" are at best ineffective
or worse hurt prices. Haag, Rutherford, and Thomson (2000) find that mentioning “garage,” “lake,” and
“move-in-condition” are associated with increases in the sales price of 9.8%, 5.6%, and 12% respectively.
Levitt and Syverson (2008) employ indicators for keywords in the text remark in their analysis. In practice,
the 2014 Real Estate Association Report states that, “[t]he quality and number of pictures matter in the im-
pression that potential buyers have of the home they would potentially visit. The pictures serve as a hook
to make potential buyers come on a visit of the home.” It also mentions how “[g]ood agents would hire a
professional photographer to take pictures and process them. MLS usually requires an outside picture. Bad
realtors would usually take pictures with their own personal camera or even worse with their cell phones.”
Our results contribute to a rich set of literature that empirically examines the effects of the realtor exper-
tise. Waller and Jubran (2012) find that properties listed by experienced realtors (licensed realtors with ten or
more years of experience) sell for approximately 2% more than those of inexperienced realtors and usually
32% faster. Munneke and Yavas (2001) present both theoretical and empirical support for their hypothesis
that there is no significant difference in listing duration between realtors from full-commission firms and
other realtors, even though one might think that realtors from full-commission firms have higher expertise.
The authors suggest that the self-selected expert realtors ultimately end up with more listings, which slows
down their sales rate to the market average. Levitt and Syverson (2008) and Rutherford, Springer, and Yavas
(2005) show that the effects of realtor expertise may only be fully realized when selling their own homes
4

(as opposed to client-owned homes). Salant (1991) and Hendel, Nevo, and Ortalo-Magné (2009) examine
whether the realtor expertise is necessary at all by comparing realtor-assisted listings against for-sale-by-
owner listings. Barwick and Pathak (Forthcoming) find that realtors are differentiated by experience. This
paper provides evidence on how such differentiation may be realized in listing quality.
Perhaps closest to our analysis of photos and text remarks is Lewis (2011), who finds that car dealers
post significantly more photos and more frequently use professional listing software than non-dealers selling
similar used cars on eBay motors. Additionally, Lewis (2011) finds that dealers sell cars that are more likely
to fetch a higher price according to a hedonic regression. Dealers sell newer, lower mileage cars that are
more often under warranty, and they employ a revenue-improving strategy of lower minimum bids with
higher reservation prices. Non-dealers, on the other hand, often face a higher disclosure cost on the website
as there are substantial economies of scale in using professional listing software and in providing an optimal
number of photographs to aid the information asymmetry problem. Lewis (2011) also finds that wording
in a listing tends to be accurate, even though cars listed with “rust” in the description sell for less than cars
with no mention of rust at all, positing that seller reputation and optimal disclosure yield this outcome.
Finally, our results can be interpreted in the scope of a matching and search model of the housing market,
such as those in Yinger (1981), Yavas (1992), and Carrilo (2012). In Carrillo (2012)’s model, buyers and
sellers search randomly with sellers posting advertisements in hopes of getting prospective buyers to visit
and ultimately buy their house. Since physical viewing is costly, this approach makes it critical to sellers to
improve listing quality and develop a form of targeted advertising in order to match buyers with desirable
preferences. The rise of real estate web portals means that online viewing now always precedes physical
viewings, which diminishes the importance of face-to-face “sale” tactics while increasing the importance of
ex-ante marketing and information dissemination.
2 Data
We construct a novel dataset of real estate listings and sales from publicly available data from a major real
estate website. This dataset covers a total of 40,049 real estate sales from across three states: Arizona,
California, and Illinois. For each listing, we capture all of the critical information typically used by a
potential buyer before buying a home: size (in square feet), number of bedrooms, number of bathrooms,
year built, buyer and seller realtor names, past sale history, school rating, as well as all realtor-uploaded
5

photos and the realtor’s text remark. Additionally, we obtain post-sale information such as the final sale date
and final price. Table 1 reports summary statistics for some of these variables. Figure 1 shows trends in sale
price and time to sale over time. In order to ensure standardization across listings, we restrict our sample to
MLS listings.
We construct novel measures of listing quality using the photo and text data. The only other signifi-
cant aspect of listing quality is the completion of forms related to house characteristics, an activity where
expertise is likely to make little difference. (While inexperienced realtors may neglect to fill these character-
istics, MLS software requires the most basic information on each listing to be listed. Realtors are unlikely
to make factual errors in this process.)3 Photos and text serve as strong promotional tools for realtors to
convince potential buyers of the quality of the house, and often constitute as the house’s first impression to
buyers. Given that physical viewings are costly for buyers, these first impressions are crucial determinants
of physical viewings and thus of the potential sale of the house.
We construct our dataset by first sampling from sold listings from the years 2010 to 2013 randomly
picking zip codes within the three states of interest. We then supplement these listings with recent past
completed listings from the same houses. In part of our later analysis, we use house fixed-effects, and rely
on these past listings to identify our coefficients. In these specifications, we are only able to use houses with
more than one observed listing. Of the 40,049 total listings, 9,799 listings satisfy this constraint (henceforth
referred to as the “multiple listings sample”). Table 1 reports summary statistics for this subset of listings.
2.1 Measures of listing quality
Due to the high number of listings in our dataset and the fact that photo quality in themselves can be fairly
subjective, 4 we use two easily accessible, objective measures instead. The first is the number of photos
uploaded, which is readily observable to the potential buyer (real estate web pages often prominently display
the total number of photos available right next to the photo display box). Figure 2 shows trends in the number
of photos over time. The second is the median resolution of the photos, measured in number of pixels (for
example, a standard 640 x 480 photo is computed as 307,200 pixels). This secondary characteristic allows us
to measure the quality of uploaded photos, which can vary significantly across listings. Even a high quantity
3It is possible for realtors to submit an initial listing without having completed uploading photos to the system. However, thisprocess is typically completed within a few days and not reflected in the final listing information.
4Most obvious photo rating measures involve subjective judgment, and even more measurable traits such as angles and lightingstill rely on subjective criteria.
6

of photos can be uninformative at lower resolutions. Note that the MLS system places restrictions on both
the number and the resolution of uploaded photos, so both of our measures are bounded from above.5 Photos
of the home listings have also file size requirements, as they must be at least 11KB, and no more than 4MB
in size. Despite these limits, there remains enough variation in both number and resolution of pictures for
our analysis (while photos of larger resolution will likely be larger in size, 4MB is high enough not to exert
any strong effects on resolution). One further complication is that the resolution limit is fixed with respect
to orientation (i.e., any portrait photo must include a “letterbox” on the two sides), which means that portrait
photos will have much smaller resolution than landscape photos. We avoid this issue by considering only
landscape photos in our calculation of the median resolution.
In order to measure the information content of the text remarks, we focus on a few important physical
characteristics and manually classify the ways in which they are described. We define two classifications of
interest—objective phrases and subjective phrases. In general, an objective phrase corresponds to a value
that is inherent in the characteristic itself, i.e., the characteristic has value because it is there: for example,
a “gourmet kitchen” corresponds to a type of kitchen, and “cherry cabinets” refers to the type of material
of the cabinets. In a way, an objective remark emphasizes that it is costly to produce such an objective
characteristic. Objective remarks also represent contractual obligations, as potential buyers can bring a
lawsuit in the event of a false claim from the realtor or seller. A subjective characteristic relates to the value
attributed by the beholder, here the seller’s realtor, rather than the value contained in the characteristic itself.
A subjective characteristic is a perception, not a fact: for example, a kitchen defined as “beautiful” or a
“cozy” fireplace might be a characteristics debatable between different people.
In the end, we focus on six important physical characteristics: kitchen, window, cabinet, lighting, fire-
place, and swimming pool. For each characteristic, we define a dictionary to be the set of all two-word
phrases with the characteristic as the second word (e.g., gourmet kitchen, eatin kitchen, spacious kitchen).
Within each dictionary, we manually classify phrases as objective or subjective. We also remove phrases
that are either uninformative or unrelated, such as “the kitchen” or “a kitchen.”
The use of objective and subjective phrasing is central in practice: a study by Point2Homes, a company
specializing in real estate marketing, uses a word count study to determine the types of words that increased
the value of the home.6 They list the occurrences of the most used words in descriptions: the very subjective
5For an example of such restrictions, see http://portal.mlslistings.com/help/2011/07/13/photo-upload-faq/ (last accessed on8/2/2014).
6See Point2Homes, “The Most Popular Real Estate Listing Keywords”, Feb. 14, 2013
7

word “beautiful” tops the ranks, followed by more objective remarks, like “hardwood floors” and “stainless
steel appliances”. We hypothesize that a more experienced realtor would emphasize more concrete attributes
of the home as they are more marketable compared to more subjective ones. These concrete attributes help
the realtor confidently justify a certain price, and potentially lead to a final price not too far away from the
list price.
2.2 Measure of realtor expertise
Realtor expertise is central to the seller’s choice of realtor due to the effects of disparities in qualities of real-
tors on the ultimate sales price. Unskilled realtors may result in unfavorable market outcomes—should the
seller not get an offer above her reservation price, it may be necessary for her to take the home temporarily
off the market (for potential renovations or repaints).7 Able realtors, on the other hand, obtain higher sale
prices due through marketing and negotiation expertise, and may also minimize time on the market (condi-
tional on achieving a desirable sale price). They are also able to advise the seller on an efficient list price to
achieve a desirable sale price and make the home marketable to potential buyers.8 (Note that usually homes
sell within 10% of the list price.)
We consider two main characteristics of realtor expertise that complement each other: realtor activity
and realtor experience.9 We define realtor activity as the total number of sales attributed to the realtor within
the same calendar year. While shorter time periods might give a more accurate measure of activity, we use
the entire calendar year in order to avoid seasonality effects.10
We define realtor experience as the number of days since the realtor’s first acquisition of her real estate li-
cense. We obtain the date of real estate license acquisition for each realtor using a database from the Arizona
Department of Real Estate, so we simply construct the experience variable via name matching, dropping all
cases where the match is imperfect or not found. Unfortunately, such data is not easily accessible for Cali-
fornia and Illinois, so any later analysis with respect to experience uses only the subset of observations from
Arizona that resulted in a full realtor name match, henceforth referred to as the “realtor experience sample”.
10,630 of 40,049 observations remain after these exclusions, and table 1 reports summary statistics for this
7Delisting a home could be a bad signal for future sales. Potential future buyers might suspect that the seller has unrealisticexpectations about the sale price or that problems had come up during inspection.
8Spending too much time on the market might make a home seem like a “lemon,” therefore realtor expertise is important tomake sure home prices are not prohibitively high.
9We consider activity and experience as an adaptation of the Mincer wage equation (Mincer 1974).10A potentially better measure could be the total number of past sales throughout all years, but for the present analysis our lack
of data availability before 2009 makes difficult to track experience over time.
8
subset.
3 Empirical Strategy
3.1 Realtor expertise
We assume that the quality of any house listing is an additive function of the house’s characteristics and
realtor expertise:
quality = Xβ +η (agent expertise)+ν ,
where X is a vector of physical characteristics (e.g., square feet, number of bedrooms) and state-calendar
quarter fixed effects.11 In our empirical application, we use the most important determinants of a given
realtor’s expertise: their sale activity and their career experience. It is important to separate both effects as
realtors might be assigned a given listing or buyers based on their reputation and the amount of time their
past listings stayed on the market, or a combination of both.
We define the sale activity for each realtor by considering (the logarithm of) the number of listings sold
by a given realtor within the same calendar year. This captures the realtor’s productivity and success rate.
Sale activity is an important performance metric for realtors in practice as it is a direct measure of their
compensation: realtors are paid roughly half of the commission on a real estate transaction, which is usually
between 2% and 6% of the sale price.12 We define the realtor’s career experience as the number of days
since their real estate license certification. Experience is central to potential sellers of a home, as seasoned
realtors are more likely to have greater market reach and network size. Realtors with more experience are
also expected to be better negotiators on average and more knowledgeable about the market.
Our dependent variable is the quality of a given listing.13 We use in this paper three measures of the
quality of a real estate listing: the number of pictures available on the listing, the median number of pixels
in all landscape photos, and the prevalence of objective phrases in the listing remark. All three measures
capture the ability of the listing to accurately convey information to potential buyers, especially with respect
11The fixed effects take into account the potential seasonality and location effects, as well as general trends in the U.S. housingmarket.
12See, for example, Blanche Evans, “Buyers Mad They Can’t Cut Threshold Agent Out of the Deal,” Realty Times, Aug. 24,2005.
13For the purposes of our analysis, we focus on the quality of a particular listing as it appears on the web, especially with respectto its ability to accurately convey information. Other methods of improving the general quality of a listed home includes last-minuteupgrades (e.g., painting the home prior to listings), or increasing the reach of the listing (e.g., placing advertisements on a varietyof real estate websites).
9
to how a particular house is distinguished from other houses with a similar price range or similar amenities.
The number of pictures measures the quantity of information that a buyer has access to for getting quick
information on features of a particular house. The median number of pixels complements the quantity of
pictures in providing more information about the house. Higher-resolution photos serve both as effective
communication of physical qualities of the home and as a signal that the sell-side was willing to pay for an
experienced photographer.14 The prevalence of objective phrases in the remark represents the overall quality
of the listing: a good listing would be more likely to be emphasized with objective phrases like “gourmet
kitchen” whereas a lower quality listing would read more like a “stunning spacious kitchen area”.
One important confound in this approach is that the assignment of realtors to properties is unlikely to
be random—more experienced or active realtors may be more likely to represent houses of higher quality.
If expert realtors represent houses with better unobservable characteristics, there may be more opportuni-
ties for pictures, resulting in a strong correlation between realtor expertise and photo quantity and quality.
Addressing this confound requires controlling for the unobservable features of houses that the realtor is
typically associated with, especially the effects of these characteristics on photo quality.
We partially address this confound using information about transactions where the seller’s realtor (whose
expertise we are exploring) worked as a buy-side realtor. If we assume that the realtor’s clients are similar
between the sell- and buy-sides, then we would expect the unobservable features of the sell- and buy-
side houses to be similar as well. In such a case, the listing quality of these buy-side houses captures the
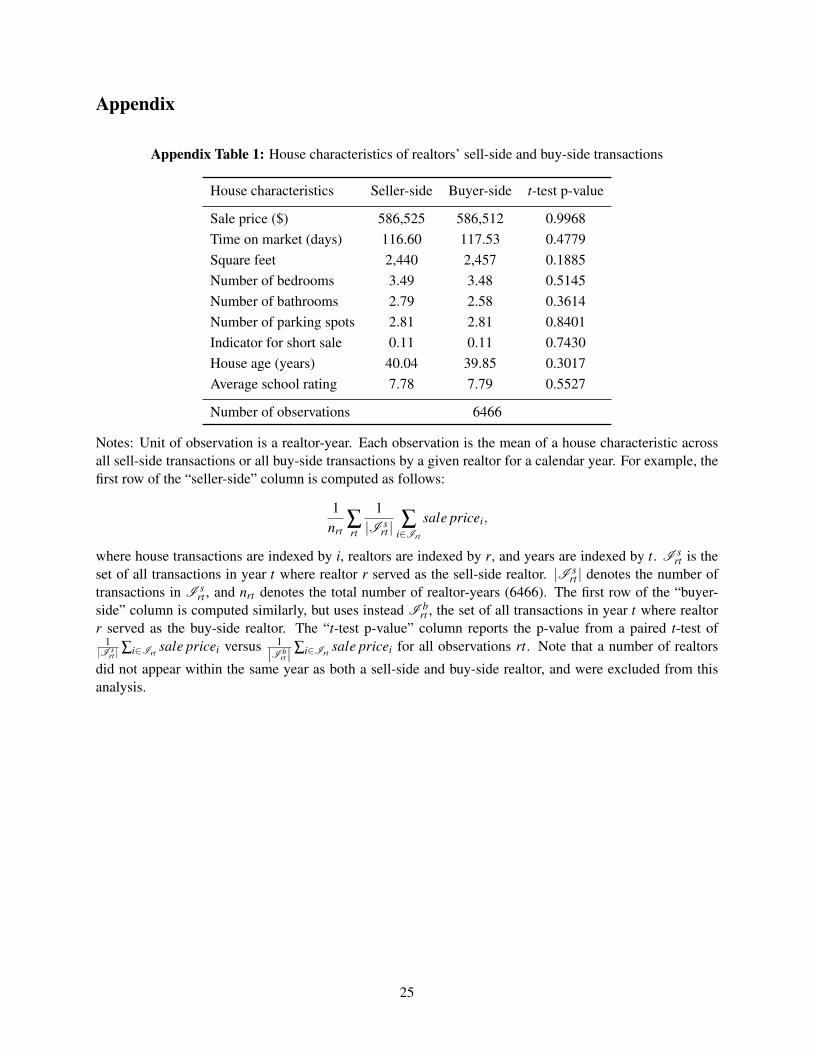
effect of unobservable features on listing quality. In Appendix table 1, we show that for any given realtor,
houses where they worked as a sell-side realtor are statistically indistinguishable in terms of observable
characteristics from houses where they worked as a buy-side realtor. While we are unable to conduct a
similar test for unobservable features, the equivalence of observable features suggests that this finding may
be generalizable.
Thus, we define our buy-side transaction controls as follows. For each transaction i, we define the set
of buy-side transactions to be all transactions from the same calendar year where transaction i’s sell-side
realtor serves as the buy-side realtor. Our control variables are then the mean of the following variables
within the set of buy-side transactions: number of photos, the median photo resolution, square feet, number
of bedrooms, number of bathrooms, number of parking spots, indicator for short sale, house age in years,
14See, for example, Gene Stowe, ”Photographs are Key for Selling Real Estate,” Tribune Business Weekly, Jun. 06, 2011 orAmy Hoak, “The Power of Real Estate Photos,” Chicago Tribune, Sept. 07, 2012.
10

and average school rating. The table notes to Appendix table 1 provide more details on the construction
of these control variables. The primary variables of interest are the controls defined with respect to the
quantity and quality of photos, which capture the realized effect of unobservable house characteristics on
photo quality.15
3.2 House prices
We assume the following hedonic model for house prices:
(1) ln(p) = Xβ +(photoquality)γ +φk (ob j phrase)k +ϕk (sub j phrase)k + ε,
where X is a vector of house characteristic controls (number of photos, square feet, number of bedrooms,
number of bathrooms, whether the sale was a short sale, the age of the house in years, the average rating of
nearby schools, and indicators for the existence of a fireplace or pool), photo quality is the a vector of photo
characteristics (number of photos, median resolution), and (ob j phrase) k and (sub j phrase) k are indicators
for whether characteristic k is described in an objective or subjective way, respectively.16
Unbiased estimates of φk and ϕk rely on confronting a crucial confound: the effects of the physical
existence and the value or quality of characteristic k. We address this in two ways. First, our characteristics
are either common to all properties (e.g., kitchen, window, cabinet, lighting) or their existence can be easily
controlled for (every listing has tick boxes for whether the house has a fireplace or a pool). Moreover, we
focus on houses for which we observe multiple sales by adding house fixed effects, effectively restricting
the identification of φk and ϕk to within-house variation. We also control for renovation and remodeling
effects, and drop all properties where we observe consecutive sales within the same 365 day period. Houses
that experience this kind of rapid resale are often rehabilitation project type of homes, later called simply
“rehabs,” and removing such observations ensures that our objective phrase measures do not pick up the
effect of additional features during these “rehabs.”17 These considerations allow us to control for the value
or quality of the characteristics. As an additional check, we include in our regression a dummy for whether
15While other houses where the realtor worked on the sell-side are also likely to share similar unobservable characteristics, wecannot use the photo quality of such houses as controls as it would become difficult to identify the effect of realtor activity andexperience.
16While time to sale is likely an important determinant of sale price, we suspect part of listing quality’s effect on price is throughits effect on time. In order to capture this effect, we do not include time as a control in our baseline specification.
17Rehabilitation can mean anything from just the inside of the home needing minor work, to a full rebuilding of the homewithout altering the floor plan, like new plumbing, electrical systems, windows, roofing, among others.
11

the word “view”—a feature unlikely to change in time—appears in the remark.
4 Results
Table 2 details the regression estimates of the determinants of listing quality. Each column uses a different
measurement of quality. Columns (1)-(2) use as the dependent variable the number of photos, while columns
(3)-(4) use the median number of pixels from all landscape photos.18 Columns (2) and (4) implements the
strategy discussed in section 3 and add controls for house characteristics from the sell-side realtor’s buy-
side transactions. The coefficient for realtor activity is positive and statistically significant for both columns,
while the coefficient for realtor experience is somewhat ambiguous. The additional controls in columns (2)
and (4) did not change the coefficients for realtor activity significantly, though it did increase the standard
errors due to the decrease in power. It is important to note that our measure for realtor experience, time since
first acquisition of the real estate license, is highly correlated with age. While we expect realtor experience
to positively correlate with listing quality, it may be possible that age is negatively correlated with the listing
quality (older realtors may be less familiar with technology, and thus be unable to upload a large number of
high quality photos). Additionally, the realtor’s experience may not accurately account for the existence of
a support team, which may include members with less experience.
Table 3 presents the results of the regressions of the log of sale price on photo quality measures, realtor’s
sale activity, and realtor experience. For all specifications, we add house characteristic controls (square
feet, number of bedrooms, number of bathrooms, number of parking spots, indicator for short sale, the
age of the house in years, and the average rating of schools serving the address) and year-quarter fixed
effects. Column (1) presents estimates for our baseline specification. The coefficients for both photo quality
measures (number of photos and median number of pixels) are positive and significant. Additionally, the
coefficients for realtor expertise (realtor activity and realtor experience) remain significant after controlling
for photo quality, suggesting that expertise contributes to the final sale price through mechanisms other than
photo quality. (For example, experienced realtors may be better negotiators, improve the presentation of the
house, or possess larger networks and relationships with realtors, therefore increasing the likelihood that
they would have worked with a potential buyer’s realtor).
Column (2)-(4) of table 3 explore the identification of our coefficients of interest by adding zip code fixed
18Due to the presence of the confound described in the previous section and the scarcity of observations that contain bothmultiple listings and realtor experience data, we are unable to conduct this analysis for the objectiveness of text remarks.
12

effects, city-block fixed effects and property fixed effects, respectively. We find that both the magnitude and
significance of the photo quantity and photo quality coefficients remain similar, though the magnitude of
the photo quantity coefficient increases in the specification with property fixed effects. Column (5) adds
(the logarithm of) time to sale as an independent variable. We find that the coefficients remain essentially
unchanged compared to our baseline specification, which is consistent with the fact that the coefficient for
time to sale is essentially zero. Finally, column (6) adds the logarithm of the ratio between sale price and list
price as an independent variable. Compared to our baseline specification, the coefficient for realtor activity
changed significantly, and the coefficient on the price ratio is negative and statistically significant (i.e.,
conditional on observable characteristics, houses listed at lower prices tend to sell for less). This suggests
that realtors who make large numbers of transactions may list houses at lower prices to facilitate quicker
sales. Our results on the quantity of photos used in the listings are similar to those from Lewis (2011), which
finds analogous results for automobile auctions.
Table 4 reports the results of regressions of time on market on photo quality measures. With the excep-
tion of the change in the dependent variable, columns (1)-(4) are identical in specification to those in table
3. Having higher quality photos is correlated with a decrease in the amount of time on market. Surprisingly,
the same correlation for number of photos is opposite in sign—having more photos is actually associated
with longer time on market. One explanation for this result is seller behavior. Conditional on house charac-
teristics, sellers who post more photos are choosing to show more characteristics, and are thus likely more
confident of such characteristics. Therefore, the seller might have higher expectations for the house’s sale
price and be more patient in waiting for an acceptable offer. We also find that
Table 5 reports results for regressions of log of sale price on remark quality measures. The addition of
house fixed effects results in a significant decrease in the number of observations since only houses for which
we observe two or more sales are included. In order to compensate for this decrease, we draw our estimation
sample from the entire sample of listings instead of only those for which we have an accurate measure of
realtor experience (Arizona). As discussed in section 2, we include indicators for whether characteristics k
(kitchen, window, cabinet, lighting, fireplace, and pool) are described using objective or subjective phrases.
We also include an indicator for the word “view”—an exogenous quality that is unlikely to change over
time. For a majority of the characteristics, the coefficient φk for objective phrasing is statistically significant
and positive. Moreover, they are higher than ϕk, their subjective counterparts. In columns (2) and (3), we
add controls for the length of the remark and whether the house received any upgrades. Our qualitative
13
conclusions remain the same after these additions.
The result of the positive and significant coefficients for objective phrases provides evidence that using
objective qualifiers to describe house characteristics is correlated with higher sale prices on average. We
interpret this as the result of effective communication of details of the house’s characteristics, as objective
qualifiers highlight salient, intriguing home features to potential buyers. In contrast, subjective qualifiers are
left to the appreciation of both the writer and the reader, leaving ambiguities in interpretation. Moreover,
we find that the effects of objective phrasing actually differ systematically depending on the characteristic
qualified. Premium characteristics such as fireplaces or swimming pools are relatively unaffected by the
choice of objective or subjective phrasing. One likely explanation is that the bulk of the buyer’s considera-
tion is based on whether such a characteristic exists, and many of the distinguishing features are not often
commonly described (for example, few listings state the exact size of a swimming pool). This means that
additional levels of distinction will only be appreciated by buyers during home visits. On the other hand,
basic characteristics (e.g., kitchen, windows, cabinets, lighting) are associated with significant higher prices
in the event of objective phrasing. Since all homes contain such features, it is likely that objective phrasing
allows the seller realtor to show how these characteristics differ from those in other homes in the area. We
interpret these results to mean that objective phrasing is able to better communicate additional information
in the event of basic house characteristics.
We also consider the effect of objective and subjective phrases in aggregate by summing the number of
characteristics (out of the six that we consider) that are qualified by objective or subjective phrasing. Due to
our cautious approach in classifying phrases as objective or subjective, not all characteristics were classified
into one or the other for each listing. In fact, only 37% of listings had one or more classified objective
phrase, and only 10% had two or more. Rather than using the absolute number of objective phrases in each
listing’s remark, we instead create two indicator variables: the first is activated when a particular listing has
one objective phrase, and the second is activated when a particular listing has two or more objective phrases.
We do the same for subjective phrases. Then, we estimate the same regressions as those from table 5.
The results from regressions on these indicators are presented in table 6. Once again, we find that
the coefficients for objective phrases are positive and significant, while those for subjective phrases are
statistically indistinguishable from zero. In the specification with our full set of controls, we find that having
one characteristic with an objective qualifier is associated with a 2.03% increase in the sale price, while
having two or more characteristics with objective qualifiers is associated with a 3.83% increase in the sale
14
price. We caution, however, with extrapolation towards higher number of objectively phrased characteristics,
as few observations in our sample had three or more characteristics with objective qualifiers. Additionally,
while we have addressed the confounding effects of the physical existence of characteristics, we still caution
against causal interpretations of these findings and their magnitudes.
5 Conclusion
Previous research on market expertise focused on efficiency and market clearing conditions; our paper fo-
cuses on the added value that market expertise of a sell-side realtor brings to the sale of a home. This study
contributes to the existing literature by incorporating three measures of listing quality into the sale price
of a home. Our results indicate that realtor activity is associated with higher quality listings, as measured
by photo quantity, photo quality, and the objectiveness of text remarks. These higher quality listings are
then correlated with higher sale prices on average. We interpret the higher sale prices of objective phrasing
compared to subjective phrasing in the text remark of the listing as a result of information dissemination.
We propose a similar interpretation for the effects on price from quantity and quality of photos. Moreover,
we find evidence suggesting that objective phrases have larger effects when describing basic features of
the house (e.g., kitchen, windows, cabinets, lighting) as opposed to premium features of the house (e.g.,
fireplace, swimming pool). However, we caution against taking these findings as causal effects due to the
inherently difficult identification problems that arise as a result of unobserved house characteristics.
Our study leaves a number of areas for future research. One could replace our manual process of clas-
sifying objective / subjective phrasing with an automated learning method such as the one employed in
Gentzkow and Shapiro (2010). The benefits are twofold—automated methods allow more coverage with
respect to the number of phrases classified and may be also less susceptible to bias and errors. The main
challenge is finding an an appropriate external source of text, though services that offer upgrades or ren-
ovations likely rely on objective contractural obligations and might be useful sources of information for
classifying objective phrases. Additionally, listing quality may be more effective when search costs are
higher. One could test such a hypothesis with data on determinants of search cost (for example, entry of
major listing aggregation websites). Finally, since we expect listing quality to affect prices mainly through
its effect on bringing in more potential buyers, having access to a measure of views (e.g., data on open
houses) would allow a more direct verification of this mechanism.
15

Table 1: Summary statistics
Variable All Multiple listings sample Realtor experience sample
Sale price 556,386 518,167 498,607(336,380) (314,958) (300,452)
Square feet 2,305 2,236 2,764(1,111) (1,016) (1,133)
Number of bedrooms 3.45 3.40 3.62(0.89) (0.88) (0.83)
Number of photos 17.91 15.91 23.44(12.67) (12.47) (14.91)
House age (years) 42.34 40.05 24.47(25.17) (25.84) (14.76)
Realtor activity 5.10(6.82)
Realtor experience 4,110(3,094)
Number of listings 40049 9799 10630
Notes: Unit of observation is a sale of a house. Table reports the mean and standard deviations for variablesin dataset and two subsets used in estimation. Standard deviations are in parentheses.
16
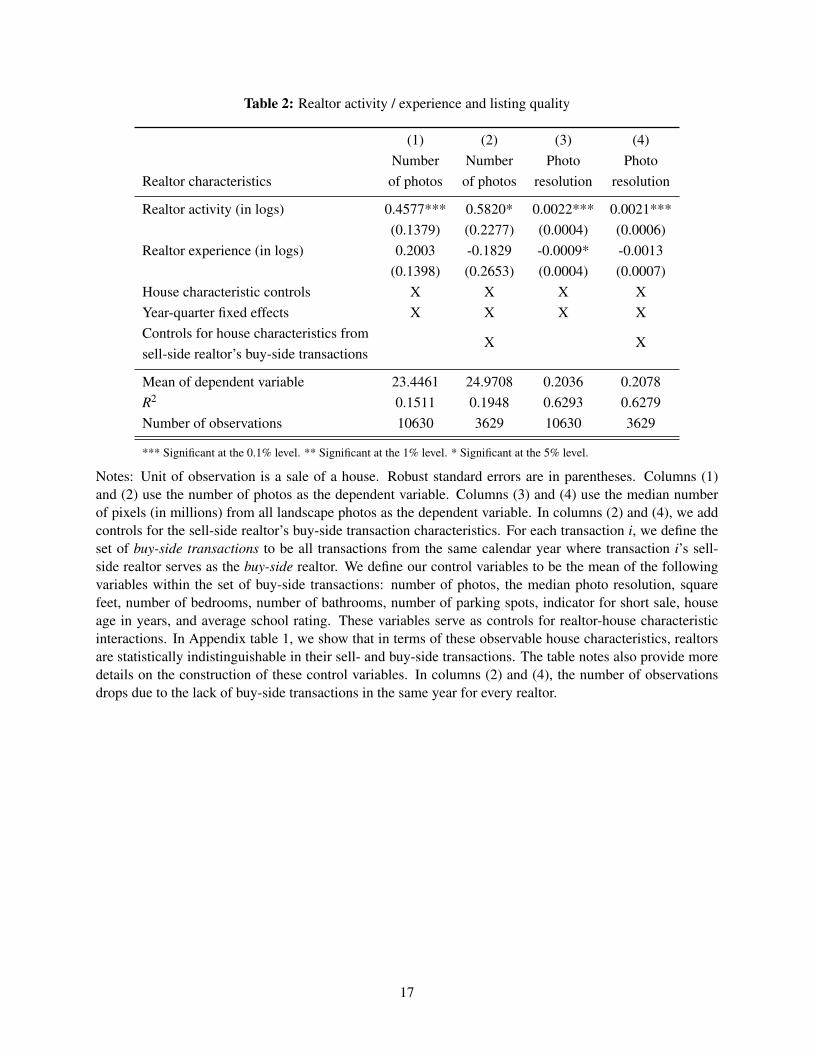
Table 2: Realtor activity / experience and listing quality
(1) (2) (3) (4)Number Number Photo Photo
Realtor characteristics of photos of photos resolution resolution
Realtor activity (in logs) 0.4577*** 0.5820* 0.0022*** 0.0021***(0.1379) (0.2277) (0.0004) (0.0006)
Realtor experience (in logs) 0.2003 -0.1829 -0.0009* -0.0013(0.1398) (0.2653) (0.0004) (0.0007)
House characteristic controls X X X XYear-quarter fixed effects X X X XControls for house characteristics from
X Xsell-side realtor’s buy-side transactions
Mean of dependent variable 23.4461 24.9708 0.2036 0.2078R2 0.1511 0.1948 0.6293 0.6279Number of observations 10630 3629 10630 3629
*** Significant at the 0.1% level. ** Significant at the 1% level. * Significant at the 5% level.
Notes: Unit of observation is a sale of a house. Robust standard errors are in parentheses. Columns (1)and (2) use the number of photos as the dependent variable. Columns (3) and (4) use the median numberof pixels (in millions) from all landscape photos as the dependent variable. In columns (2) and (4), we addcontrols for the sell-side realtor’s buy-side transaction characteristics. For each transaction i, we define theset of buy-side transactions to be all transactions from the same calendar year where transaction i’s sell-side realtor serves as the buy-side realtor. We define our control variables to be the mean of the followingvariables within the set of buy-side transactions: number of photos, the median photo resolution, squarefeet, number of bedrooms, number of bathrooms, number of parking spots, indicator for short sale, houseage in years, and average school rating. These variables serve as controls for realtor-house characteristicinteractions. In Appendix table 1, we show that in terms of these observable house characteristics, realtorsare statistically indistinguishable in their sell- and buy-side transactions. The table notes also provide moredetails on the construction of these control variables. In columns (2) and (4), the number of observationsdrops due to the lack of buy-side transactions in the same year for every realtor.
17
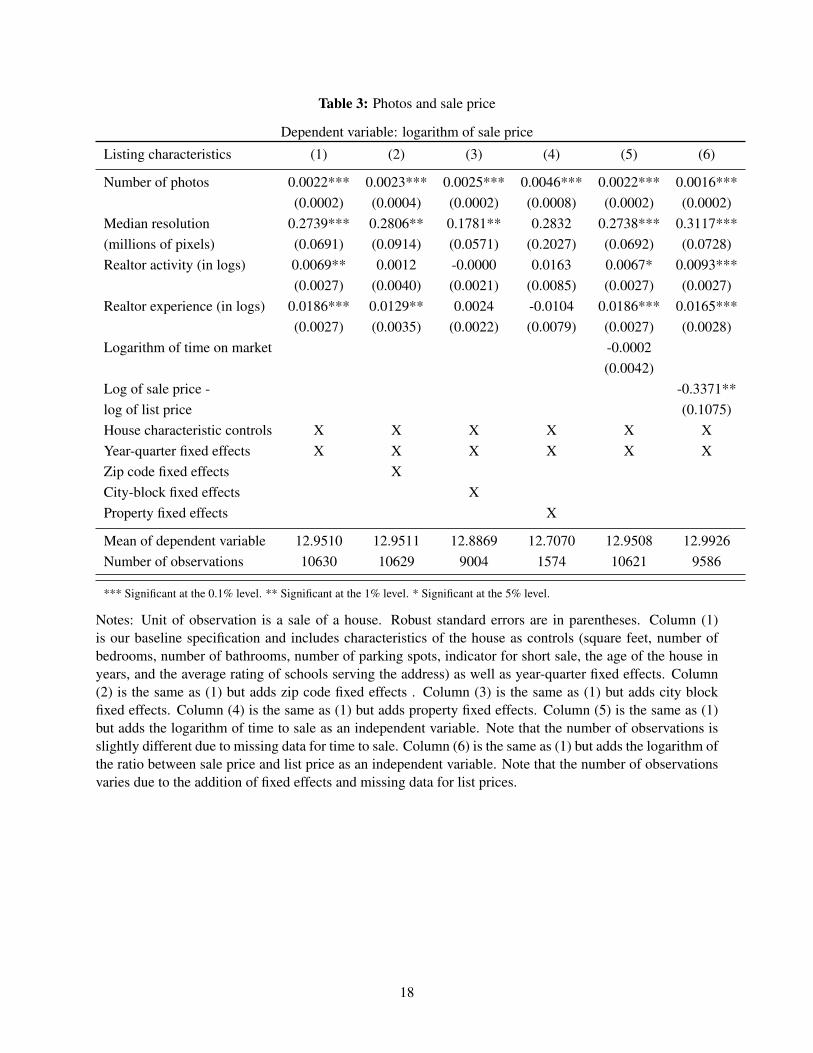
Table 3: Photos and sale price
Dependent variable: logarithm of sale price
Listing characteristics (1) (2) (3) (4) (5) (6)
Number of photos 0.0022*** 0.0023*** 0.0025*** 0.0046*** 0.0022*** 0.0016***(0.0002) (0.0004) (0.0002) (0.0008) (0.0002) (0.0002)
Median resolution 0.2739*** 0.2806** 0.1781** 0.2832 0.2738*** 0.3117***(millions of pixels) (0.0691) (0.0914) (0.0571) (0.2027) (0.0692) (0.0728)Realtor activity (in logs) 0.0069** 0.0012 -0.0000 0.0163 0.0067* 0.0093***
(0.0027) (0.0040) (0.0021) (0.0085) (0.0027) (0.0027)Realtor experience (in logs) 0.0186*** 0.0129** 0.0024 -0.0104 0.0186*** 0.0165***
(0.0027) (0.0035) (0.0022) (0.0079) (0.0027) (0.0028)Logarithm of time on market -0.0002
(0.0042)Log of sale price - -0.3371**log of list price (0.1075)House characteristic controls X X X X X XYear-quarter fixed effects X X X X X XZip code fixed effects XCity-block fixed effects XProperty fixed effects X
Mean of dependent variable 12.9510 12.9511 12.8869 12.7070 12.9508 12.9926Number of observations 10630 10629 9004 1574 10621 9586
*** Significant at the 0.1% level. ** Significant at the 1% level. * Significant at the 5% level.
Notes: Unit of observation is a sale of a house. Robust standard errors are in parentheses. Column (1)is our baseline specification and includes characteristics of the house as controls (square feet, number ofbedrooms, number of bathrooms, number of parking spots, indicator for short sale, the age of the house inyears, and the average rating of schools serving the address) as well as year-quarter fixed effects. Column(2) is the same as (1) but adds zip code fixed effects . Column (3) is the same as (1) but adds city blockfixed effects. Column (4) is the same as (1) but adds property fixed effects. Column (5) is the same as (1)but adds the logarithm of time to sale as an independent variable. Note that the number of observations isslightly different due to missing data for time to sale. Column (6) is the same as (1) but adds the logarithm ofthe ratio between sale price and list price as an independent variable. Note that the number of observationsvaries due to the addition of fixed effects and missing data for list prices.
18

Table 4: Photos and time on market
Dependent variable: logarithm of time on market (days)
Listing characteristics (1) (2) (3) (4)
Number of photos 0.0011 0.0009 0.0005 0.0007(0.0005) (0.0010) (0.0007) (0.0024)
Median resolution (millions of pixels) -0.6329*** -0.5947* -0.4983* -2.4609**(0.1781) (0.2080) (0.2164) (0.7911)
Realtor activity (in logs) -0.0325*** -0.0336** -0.0348*** -0.0402(0.0070) (0.0095) (0.0088) (0.0321)
Realtor experience (in logs) 0.0056 0.0039 -0.0014 -0.0143(0.0074) (0.0122) (0.0090) (0.0306)
House characteristic controls X X X XYear-quarter fixed effects X X X XZip code fixed effects XCity-block fixed effects XProperty fixed effects X
Mean of dependent variable 4.4675 4.4673 4.4297 4.2596Number of observations 10621 10620 8996 1572
*** Significant at the 0.1% level. ** Significant at the 1% level. * Significant at the 5% level.
Notes: Unit of observation is a sale of a house. Robust standard errors are in parentheses. Column (1)is our baseline specification and includes characteristics of the house as controls (square feet, number ofbedrooms, number of bathrooms, number of parking spots, indicator for short sale, the age of the house inyears, and the average rating of schools serving the address) as well as year-quarter fixed effects. Column(2) is the same as (1) but adds zip code fixed effects . Column (3) is the same as (1) but adds city block fixedeffects. Column (4) is the same as (1) but adds property fixed effects. Note that the number of observationsvaries due to the addition of fixed effects.
19

Table 5: Effect of remark content on sale price
Dependent variable: log of sale price
Listing characteristics (1) (2) (3)
Kitchen (objective qualifiers) 0.0299*** 0.0261*** 0.0220**
(0.0078) (0.0077) (0.0075)
Kitchen (subjective qualifiers) 0.0104 0.0072 0.0063
(0.0075) (0.0074) (0.0070)
Window (objective qualifiers) 0.0467*** 0.0396*** 0.0263**
(0.0092) (0.0090) (0.0085)
Window (subjective qualifiers) 0.0157 0.0099 0.0098
(0.0147) (0.0148) (0.0140)
Cabinet (objective qualifiers) 0.0496*** 0.0437*** 0.0346***
(0.0105) (0.0105) (0.0100)
Cabinet (subjective qualifiers) 0.0285* 0.0239 0.0173
(0.0135) (0.0135) (0.0127)
Lighting (objective qualifiers) 0.0548*** 0.0474*** 0.0321**
(0.0105) (0.0105) (0.0099)
Lighting (subjective qualifiers) 0.0140 0.0143 0.0180
(0.0203) (0.0203) (0.0191)
Fireplace (objective qualifiers) 0.0120 0.0066 0.0080
(0.0071) (0.0071) (0.0069)
Fireplace (subjective qualifiers) 0.0000 -0.0077 -0.0040
(0.0125) (0.0124) (0.0119)
Pool (objective qualifiers) 0.0046 0.0017 0.0011
(0.0079) (0.0078) (0.0074)
Pool (subjective qualifiers) 0.0082 0.0048 0.0039
(0.0131) (0.0129) (0.0123)
Indicator for “view” 0.0240** 0.0167* 0.0175*
(0.0075) (0.0075) (0.0074)
House characteristic controls X X X
State-year quarter fixed effects X X X
Property fixed effects X X X
Removes properties with rapid resale X X X
Control for length of remark X X
Upgrade controls X
R2 0.6160 0.6199 0.6462
Number of observations 9799 9799 9799
*** Significant at the 0.1% level. ** Significant at the 1% level. * Significant at the 5% level.
Notes: Unit of observation is a sale of a house. Robust standard errors are in parentheses. Sample includes all houses with more
than one sale in our dataset, excluding those for which we observe consecutive sales within the same 365 day period. Column (1)
is our baseline specification and includes controls for house characteristics (number of photos, square feet, number of bedrooms,
number of bathrooms, whether the sale was a short sale, the age of the house in years, and indicators for the existence of a fireplace
or pool), state-year quarter fixed effects, and house fixed effects. Column (2) is similar to (1), but adds a control for the (logarithm)
of the length of the listing remark. Column (3) is similar to (2), but adds controls for possible physical upgrades.
Table 6: Effect of remark content on sale price
Dependent variable: log of sale price
Listing characteristics (1) (2) (3)
One characteristic with objective qualifier 0.0345*** 0.0268*** 0.0203***(0.0055) (0.0055) (0.0052)
More than one characteristic with objective qualifier 0.0601*** 0.0499*** 0.0383***(0.0079) (0.0079) (0.0075)
One characteristic with subjective qualifier 0.0133* 0.0086 0.0078(0.0059) (0.0059) (0.0056)
More than one characteristic with subjective qualifier 0.0252 0.0168 0.0142(0.0138) (0.0137) (0.0129)
Indicator for “view” 0.0233** 0.0159* 0.0173*(0.0075) (0.0075) (0.0074)
House characteristic controls X X XState-year quarter fixed effects X X XProperty fixed effects X X XRemoves properties with rapid resale X X XControl for length of remark X XUpgrade controls X
R2 0.6136 0.6177 0.6451Number of observations 9799 9799 9799
*** Significant at the 0.1% level. ** Significant at the 1% level. * Significant at the 5% level.
Notes: Unit of observation is a sale of a house. Robust standard errors are in parentheses. Sample includesall houses with more than one sale in our dataset, excluding those for which we observe consecutive saleswithin the same 365 day period. Column (1) is our baseline specification and includes controls for housecharacteristics (number of photos, square feet, number of bedrooms, number of bathrooms, whether the salewas a short sale, the age of the house in years, and indicators for the existence of a fireplace or pool), state-year quarter fixed effects, and house fixed effects. Column (2) is similar to (1), but adds a control for the(logarithm) of the length of the listing remark. Column (3) is similar to (2), but adds controls for possiblephysical upgrades.
21

Figure 1: Sale price and time on market40
0000
5000
0060
0000
7000
00M
ean
sale
pric
e ($
)
2007q3 2009q1 2010q3 2012q1 2013q3Year/calendar quarter
100
150
200
250
Mea
n tim
e on
mar
ket (
days
)
2007q3 2009q1 2010q3 2012q1 2013q3Year/calendar quarter
Notes: Plots show the average monthly sale price (left) and time on market (right) for observations in theentire dataset. Note that due to the construction of the dataset, the number of observations is much smallerin the first half of the time range than in the second half. Thus, the higher volatility in both plots is expected.
Figure 2: Number of photos
05
1015
2025
Num
ber
of p
hoto
s
2007q3 2009q1 2010q3 2012q1 2013q3Year/calendar quarter
Notes: Plots show the average monthly number of photos for observations in the “realtor experience sample.”
22
References
Barwick, P. J. and P. A. Pathak. Forthcoming. The Costs of Free Entry: An Empirical Study of Real Estate
Agents in Greater Boston. RAND Journal of Economics.
Carrillo, P. E. 2012. An Empirical Stationary Equilibrium Search Model of the Housing Market. Interna-
tional Economic Review 53(1): 203-234.
Calltharp, B. 2014. “Can You Explain to Buyers Why Technology Hasn’t Made Real Estate Brokers Obso-
lete?” Inman News online edition, 11 April 2014, www.inman.com.
Carrillo, P. E. 2012. An Empirical Stationary Equilibrium Search Model of the Housing Market. Interna-
tional Economic Review 53(1): 203-234.
Ford, J. S., R. C. Rutherford, and A. Yavas. 2005. The Effects of the Internet on Marketing Residential Real
Estate. Journal of Housing Economics 14(2): 92-108.
Gentzkow, M and J. M. Shapiro. 2010. What Drives Media Slant? Evidence from U.S. Daily Newspapers.
Econometrica 78(1): 35-71.
Haag, J. T., R. C. Rutherford, and T. A. Thomson. 2000. Real Estate Agent Remarks: Help or Hype?
Journal of Real Estate Research 20: 205-215.
Hendel, I., A. Nevo, and F. Ortalo-Magné. 2009. The Relative Performance of Real Estate Marketing
Platforms: MLS versus FSBOMadison.com. American Economic Review 99(5): 1878-1898.
Kasanoff, B. 2014. “Are Real Estate Brokers Obsolete?” Forbes online edition, 4 April 2014, www.Forbes.com.
Levitt, S. and C. Syverson. 2008. Market Distortions when Agents are Better Informed: The Value of
Information in Real Estate Transactions. Review of Economics and Statistics 90(4): 599-611.
Lewis, G. 2011. Asymmetric Information, Adverse Selection, and Online Disclosure: the Case of eBay
Motors. American Economic Review 101: 1535-1546.
National Association of Realtors. 2014. “Home Buyer and Seller Generational Trends.”
Mincer, J. 1974. Schooling, Experience and Earnings. New York: National Bureau of Economic Research.
Munneke, H. and A. Yavas. 2001. Incentives and Performance in Real Estate Brokerage. Journal of Real
Estate Finance and Economics 22(1): 5-21.
Rutherford, R. C., T. Springer, and A. Yavas. (2005). Conflicts between Principals and Agents: Evidence
from Residential Brokerage. Journal of Financial Economics 76(3): 627-665.
Salant, S. 1991. For Sale by Owner: When to Use a Broker and How to Price the House. Journal of Real
23
Estate Finance and Economics 4: 157-173.
Waller, B. D. and A. M. Jubran. 2012. The Impact of Agent Experience on the Real Estate Transaction.
Journal of Housing Research 21(1): 67-82.
Yavas, A. 1992. A Simple Search and Bargaining Model of Real Estate Markets. Real Estate Economics
20(4): 533-548.
Yinger, J. 1981. A Search Model of Real Estate Broker Behavior. American Economic Review 71(4):
591-605.
24
Appendix
Appendix Table 1: House characteristics of realtors’ sell-side and buy-side transactions
House characteristics Seller-side Buyer-side t-test p-value
Sale price ($) 586,525 586,512 0.9968Time on market (days) 116.60 117.53 0.4779Square feet 2,440 2,457 0.1885Number of bedrooms 3.49 3.48 0.5145Number of bathrooms 2.79 2.58 0.3614Number of parking spots 2.81 2.81 0.8401Indicator for short sale 0.11 0.11 0.7430House age (years) 40.04 39.85 0.3017Average school rating 7.78 7.79 0.5527
Number of observations 6466
Notes: Unit of observation is a realtor-year. Each observation is the mean of a house characteristic acrossall sell-side transactions or all buy-side transactions by a given realtor for a calendar year. For example, thefirst row of the “seller-side” column is computed as follows:
1nrt
∑rt
1|I s
rt |∑
i∈Irt
sale pricei,
where house transactions are indexed by i, realtors are indexed by r, and years are indexed by t. I srt is the
set of all transactions in year t where realtor r served as the sell-side realtor. |I srt | denotes the number of
transactions in I srt , and nrt denotes the total number of realtor-years (6466). The first row of the “buyer-
side” column is computed similarly, but uses instead I brt , the set of all transactions in year t where realtor
r served as the buy-side realtor. The “t-test p-value” column reports the p-value from a paired t-test of1
|I srt | ∑i∈Irt sale pricei versus 1
|I brt | ∑i∈Irt sale pricei for all observations rt. Note that a number of realtors
did not appear within the same year as both a sell-side and buy-side realtor, and were excluded from thisanalysis.
25

Appendix Table 2: Effects of descriptive remarks
Log of sale price Log of time on market
Descriptive remark Estimate Std. Err. Estimate Std. Err.
Foreclosure -0.0183 0.0135 -0.2117 0.0638
Handyman -0.0724 0.0401 0.0663 0.1698
Needs -0.0759 0.0094 0.0389 0.0435
Tlc -0.0175 0.0118 -0.0104 0.0603
Motivated 0.0099 0.0127 0.1910 0.0696
Potential -0.0706 0.0112 -0.0048 0.0422
Youthful 0.2225 0.0264 0.4393 0.1228
Close -0.0021 0.0040 0.0103 0.0190
New 0.0779 0.0051 -0.0402 0.0206
Spacious -0.0135 0.0045 -0.0153 0.0211
Elegance 0.0414 0.0192 -0.1751 0.0906
Beautiful 0.0303 0.0046 -0.0081 0.0190
Appealing -0.0109 0.0299 0.2798 0.2044
Renovated 0.0631 0.0129 -0.0970 0.0532
Remodeled 0.0538 0.0046 -0.0553 0.0229
Vintage 0.0153 0.0230 -0.2291 0.0920
Maintained -0.0159 0.0081 0.0088 0.0435
Wonderful -0.0087 0.0060 0.0127 0.0292
Fantastic -0.0066 0.0093 -0.0206 0.0402
Charming -0.0102 0.0067 -0.0605 0.0316
Stunning 0.0473 0.0105 -0.1161 0.0342
Amazing 0.0004 0.0076 -0.0124 0.0362
Granite 0.0779 0.0048 -0.0282 0.0230
Immaculate 0.0167 0.0092 -0.0270 0.0542
Breathtaking 0.0337 0.0178 0.1244 0.0866
Neighborhood -0.0065 0.0067 0.0153 0.0249
Spectacular 0.0036 0.0116 0.0098 0.0513
Landscaped 0.0144 0.0068 0.0009 0.0343
Tasteful 0.0227 0.0104 -0.1143 0.0525
Fabulous 0.0071 0.0079 0.0980 0.0363
Leaded -0.0381 0.0298 0.1618 0.1055
Delightful -0.0041 0.0175 0.0061 0.0821
Gourmet 0.0126 0.0078 0.0470 0.0387
Copper 0.0427 0.0082 0.0046 0.0373
Corian -0.0159 0.0189 0.2340 0.0839
Custom 0.0227 0.0067 -0.0243 0.0240
Unique 0.0253 0.0124 -0.1323 0.0544
Maple 0.0230 0.0107 0.1186 0.0542
Newer -0.0485 0.0060 -0.0014 0.0288
Hurry 0.0134 0.0106 -0.1425 0.0534
Pride 0.0148 0.0122 -0.0077 0.0617
26

(Continued from above)Log of sale price Log of time on market
Descriptive remark Estimate Std. Err. Estimate Std. Err.
Clean 0.0236 0.0088 0.0078 0.0461
Quiet 0.0036 0.0065 -0.0440 0.0318
Dream 0.0075 0.0097 -0.0147 0.0407
Block -0.0098 0.0093 -0.0415 0.0426
Huge 0.0066 0.0054 0.0035 0.0248
Desk -0.0135 0.0122 0.0500 0.0791
Mint 0.0427 0.0334 -0.1797 0.1555
Stately 0.0342 0.0405 0.1335 0.1602
Needs updating 0.0091 0.0394 -0.1000 0.1513
Estate sale -0.1033 0.0855 -0.1641 0.1922
As-is -0.0641 0.0061 -0.1665 0.0277
Bank-owned -0.0035 0.0102 -0.1905 0.0530
Priced-to-sell -0.0266 0.0136 -0.0480 0.0635
State-of-the-art 0.0517 0.0350 -0.1289 0.1220
Built-in -0.0026 0.0066 -0.0285 0.0252
Move-in 0.0284 0.0077 -0.0777 0.0296
House characteristic controls X X
Year-quarter fixed effects X X
R2 0.6634 0.2074
Number of observations 12409 12387
Notes: Unit of observation is a sale of a house. Standard errors are in parentheses. Both columns include characteristics of the
house as controls (square feet, number of bedrooms, number of bathrooms, number of parking spots, indicator for short sale, the
age of the house in years, and the average rating of schools serving the address) as well as year-quarter fixed effects. The first two
columns use the log of sale price as the dependent variable. The last two columns use the log of time on market as the dependent
variable.
27
Readers with comments may address them to: Professor Sebastien Gay University of Chicago Department of Economics 1126 East 59th Street Chicago, IL 60637 [email protected]

The University of Chicago Law School Kreisman Working Papers on Housing Law and Policy
For a listing of papers, please go to http://chicagounbound.uchicago.edu/housing_law_and_policy_wp/. 1. Lee Anne Fennell and Eduardo M. Peñalver, Exactions Creep, December 2013 2. Lee Anne Fennell, Forcings, November 2013 3. Neil Bhutta and Benjamin J. Keys, Interest Rates and Equity Extraction during the
Housing Boom, January 2014 4. Christopher Mayer, Edward Morrison, Tomasz Piskorski, and Arpit Gupta, Mortgage
Modification and Strategic Behavior: Evidence from a Legal Settlement with Countrywide, January 2014
5. Edward R. Morrison, Coasean Bargaining in Consumer Bankruptcy, January 2014 6. Atif Mian, Amir Sufi, and Francesco Trebbi, Foreclosures, House Prices, and the Real
Economy, January 2014 7. Sumit Agarwal, Gene Amromin, Itzhak Ben-David, Souphala Chomsisengphet, Tomasz
Piskorski, and Amit Seru, Policy Intervention in Debt Renegotiation: Evidence from the Home Affordable Modification Program, August 2012
8. Sumit Agarwal, Effi Benmelech, Nittai Bergman, and Amit Seru, Did the Community Reinvestment Act (CRA) Lead to Risky Lending? November 2012
9. Tomasz Piskorski, Amit Seru, and James Witkin, Asset Quality Misrepresentation by Financial Intermediaries: Evidence from RMBS Market, February 2013
10. Umit G. Gurun, Gregor Matvos, and Amit Seru, Advertising Expensive Mortgages, March 2013
11. Benjamin J. Keys, Devin G. Pope, and Jaren C. Pope, Failure to Refinance, August 2014 12. Adam B. Badawi and Anthony J. Casey, The Fannie and Freddie Bailouts through the
Corporate Lens, March 2014 13. Lee Anne Fennell, Property in Housing, March 2013 14. Lee Anne Fennell, Just Enough, August 2013 15. Yun-chien Chang and Lee Anne Fennell, Partition and Revelation, April 2014 16. Robert J. Chaskin and Mark L. Joseph, Contested Space: Design Principles and
Regulatory Regimes in Mixed-Income Communities Replacing Public Housing Complexes in Chicago, October 2014
17. Lee Anne Fennell, Agglomerama, December 2014 18. Sebastien Gay and Nadia Nasser-Ghodsi, Guarding the Subjective Premium:
Condemnation Risk Discounts in the Housing Market, December 2014 19. Brian A. Jacob, Max Kapustin, and Jens Ludwig, Human Capital Effects of Anti-Poverty
Programs: Evidence from a Randomized Housing Voucher Lottery, December 2014 20. Sebastien Gay and Allen T. Zhang, Expertise Value Added in the Real Estate Market,
December 2014


![REAL ESTATE, PERSONAL PROPERTY OR FIXTUREeweb.irwaonline.org/eweb/upload/web_marapr_15_Relo.pdfinterest is not covered by this offer [italics added]. The separation of real estate](https://img.pdfslide.us/doc/110x75/5fd4f60da1bcd64b66052b10/real-estate-personal-property-or-interest-is-not-covered-by-this-offer-italics.jpg)