Embed Size (px)
Citation preview

Phone 360-332-4653 441 Peace Portal Drive Fax: 360-332-4652 Blaine WA 98230
Identifier # Summary of Key Questions Expert Advisory Group
MVEIRB INAC EC Mine Inflow
M-1 Revise Basal Inflow Estimates to include upper and lower limits X X
M-2 Recommend 500 m³/hr using 50-5000 m³/hr for contingency planning X
M-3 Revise dewatering pump capacity & eliminate contingency pond. X
End-of-Pipe Discharge E-1 Re-evaluate End-of-Pipe concentrations for
all constituents, local water source, and low, likely and high basal inflow rates.
X X
E-2 Contingencies for unexpected dewatering rates X X
E-3 Range of estimated ammonia concentrations X
E-4 Clarification on units of consumption on pg. 54 of 2nd round IR responses X
Injection Well I-1 Injection well design X X X I-2 Dilution rate calculations from process
water X X
I-3 Recommended monitoring wells X I-4 Monitoring requirements X I-5 Back-up well plumbed in-line X I-6 Pump Testing X
Brine usage Contingencies B-1 Commitment of isolation valves-design dwg X X B-2 Size of possible spill from breakage X B-3 Incident precipitation X B-4 Brine containment within surface plant X B-5 Dilution plan of escaped brine X
Settling Pond S-1 Provide design parameters & liner material X X S-2 Clarify design volume X S-3 Clarify proposed treatment “in the tank” X X S-4 Justification of necessity X
Ore Beneficiation O-1 Flow diagram and description O-2 Efficiency of reagent usage and fate X X O-3 Power usage adjustments X
Closure and Reclamation C-1 Freeze wells X C-2 Injection Wells X C-3 External pipes X
Phone 360-332-4653 441 Peace Portal Drive Fax: 360-332-4652 Blaine WA 98230
M-1 Basal Inflow Estimates Please See Appendix A, EBA Engineering Consultants Ltd., document of October 5, 2007, “Commentary on Regulatory Technical Reviews, Pine Point Pilot Project, Hay River, Northwest Territories. M-2 Contingency Planning around Basal Inflows For the purposes of contingency planning with regards to potentially varying basal inflow rates, Tamerlane is providing calculations within this document that reflect a low, realistic and high basal inflow rates with regard to dewatering, discharge water, ammonia influence, reagents and injection well design. The basal inflow rates utilized are 50, 500, 941 and 3120 cubic meters per hour. Tamerlane has chosen not to include any rates higher than 3120 m³/hr based on this being the upper range of estimated basal inflow calculated through numerical modeling by EBA Engineering Consultants. Additionally, MVEIRB’s expert advisors have provided a simplified MODFLOW model with upper ranges of 1,572 m³/hr. As indicated by EBA Engineering Consultants, basal inflow estimates are most sensitive to values of hydraulic conductivity for the Pine Point Formation. Tamerlane would like to point out that all calculations to date have been conducted on information compiled at the middle of the Karst deposit which already indicates a worst case scenario as the freeze perimeter will NOT be in this Karst area but outside the ore zone in much more competent and less permeable rock. M-3 Dewatering Pump Capacity & Settling Pond Tamerlane is confident that the designed dewatering capacity of the mine is more than adequate to handle the basal inflows entering the mine. Tamerlane did not utilize the porosity data gathered from core samples sent to an independent laboratory. These samples sent were exclusively from the ore body which is known to be of a karst nature and more porous than the surrounding material. Tamerlane utilized old core drilling data taken between the discovered ore bodies as well as interviewed geologists who worked at the old Pine Point mine to determine the best layers to drill the freeze curtain into to minimize the upwelling of the aquifer. In the event that higher inflows of water are encountered early on during development and operations, Tamerlane would be able to utilize additional pump capacity that will be on site by Thyssen mining, the shaft sinking and development contractor. Tamerlane fully intends to construct the temporary settling pond not only as a temporary storage for process water in the event of high suspended solids but also as an initial usage during start-up of operations to test all facilities and processes before discharging into the primary injection well. E-1 End-of-Pipe Concentrations The following information is provided by Godfrey McDonald, Confidential Metallurgical Services. The flotation discharge from each cycle of a laboratory “locked cycle” flotation test were discharged into a pail and after two hours of natural settling a sample of the tailings water above the settled, flotation tailings solids was collected. This water was sent to the analytical laboratory for analysis. The analytical report CA 10209 – Jul07, ICP-MS Metals (using laboratory water) is attached (2 pages) with a detailed, activity schedule

Phone 360-332-4653 441 Peace Portal Drive Fax: 360-332-4652 Blaine WA 98230
and the completed analyses. There will not be any cyanide compounds used in the flotation process. The ground seepage that will report to the mine workings, mine seepage sumps and then will be pumped to surface where it will be temporarily used for ROM ore processing before being pumped through an injection well back to the same deep, hard water aquifer that has a very high estimated volume. It can be seen as a water loop with limited time and characteristic change during it’s cycling. The following three scenarios have the underground seepage volumes larger than the calculated volume of process effluent that will report with the excess underground seepage to the Injection Well. The “Characteristic” concentrations listed should be considered the “Worst Case” for the end-of-pipe to the Injection Well. The first table shows the “Characteristic” concentrations of the Testwork Discharge Effluent (laboratory water), the Underground Seepage (deep, hard water aquifer) and the Calculated End-of-Pipe discharge to the Injection Well.
Water Characteristic
Analyses Testwork Effluent
137 m3/h
Underground Seepage 137 m3/h
Worst Case Process Effluent
137 m3/h pH 11.4 7.8 8.5 Sulphate (mg/l) 300 1780 2080 TDS (mg/l) 200 3140 3340 Copper (mg/l) 0.495 0.001 0.496 Lead (mg/l) 0.302 0.001 0.303 Zinc (mg/l) 0.186 0.016 0.202 The second table shows three operating scenarios “Worst Case” in which the quantity of underground seepage is varied:
Water Characteristic. Scenario #1 Scenario #2 Scenario #3
Proc Eff. 137m3.h
UG Seep 363 m3/h
EoP 500 m3/h
Proc Eff. 137 m3/h
UG Seep 804 m3/h
EoP 941 m3/h
Proc Eff. 137 m3/h
UG Seep 2983 m3/h
EoP 3120 m3/h
pH 8.5 7.8 8.0 8.5 7.8 7.9 8.5 7.8 7.8 Sulphate (mg/l) 2080 1780 1862 2080 1780 1823 2080 1780 1793 TDS (mg/l) 3340 3140 3192 3340 3140 3169 3340 3140 3148 Copper (mg/l) 0.496 0.001 0.136 0.496 0.001 0.073 0.496 0.001 0.022 Lead (mg/l) 0.303 0.001 0.083 0.303 0.001 0.044 0.303 0.001 0.014 Zinc (mg/l) 0.202 0.016 0.066 0.202 0.016 0.043 0.202 0.016 0.024
The third table shows an operating scenario “Worst Case” if the underground seepage (50 m3/h) is less than the volume of the process requirement. Process water would have to be acquired from surface wells in the area and for purposes of this unexpected scenario the laboratory water characteristic will be assumed. It is softer water as would be the area’s surface water.

Phone 360-332-4653 441 Peace Portal Drive Fax: 360-332-4652 Blaine WA 98230
Water
Characteristic Scenario #4
Process Effluent
137 m3/h
Underground Seepage 50 m3/h
End-of-Pipe
137 m3/h pH 11.4 7.8 11.4 Sulphate (mg/l) 300 1780 840 TDS (mg/l) 200 3140 1273 Copper (mg/l) 0.495 0.001 0.495 Lead (mg/l) 0.302 0.001 0.302 Zinc (mg/l) 0.186 0.016 0.186 The four operating scenarios presented in the tables have been “Worst Case” because there was no anticipated, modification to the deep aquifer (underground seepage) water characteristics by it’s contact with mine fines or pumps agitation or flotation aeration and flotation reagents that will occur in an actual operation. We know from other operations that some of the flotation circuit reagents like, soda ash (Na2C03), a water softener, and lime, a pH modifier have an affect on hard water and will precipitate sulphates, from this type of process water. The volume of the aquifer (underground seepage) will have the most direct affect on the end-of-pipe water characteristics as shown in the operating scenario tables. E-2 Contingencies for Dewatering Rates As mentioned in answer M-3, Tamerlane feels confident in its ability to dewater any basal inflows entering the mine. In the unlikely event inflows are greater than the designed 2,270 m³/hr pumping station, Tamerlane will call upon its local mining contractor, Thyssen Mining to utilize additional pumping systems while additional pumps are ordered and delivered. Additionally, as mentioned earlier in this review process, no mining activities will begin until the freeze curtain is established and the water encapsulated within the freeze curtain is dewatered. E-3 Range of Estimated Ammonia Concentrations A range of estimated Ammonia concentrations were calculated by EBA Engineering that encompasses 50, 500, 941 and 3,120 m³/hr basal inflows. Tamerlane feels that these numbers would be further diluted after reintroduction into the injection well of the aquifer. These calculations and results can be seen as presented by EBA engineering consultants in the below correspondence:

Phone 360-332-4653 441 Peace Portal Drive Fax: 360-332-4652 Blaine WA 98230

Phone 360-332-4653 441 Peace Portal Drive Fax: 360-332-4652 Blaine WA 98230

Phone 360-332-4653 441 Peace Portal Drive Fax: 360-332-4652 Blaine WA 98230
E-4 Clarification of Units of Consumption As noted on page 54 of the 2nd round IR responses, the below was provided: Reagents and Substances Consumed grams/tonne ore*
• DMS circuit –ferrosilicon powder 500
• Flotation circuits –Soda Ash 4,000 -P82 (25% sodium bisulphate) 188 (25% sodium sulphite) 188 (50% zinc sulphate) 374 -AQ8 (20% CMC) 655 (20% Dispersogen) 655 (60% Sodium Silicate) 1,965 -Sodium Sulphide 800 -Potassium Amyl Xanthate 48 -Dowfroth 067 20 -Lime 1,300 -Copper Sulphate 1,200 -R3894 10
*based on 3,000 tonnes of ROM ore per day For clarification, the consumed grams per tonne of ore indicate actual grams per tonne of ore processed. I.e. 500 grams of ferrosilicon per one (1) tonne of ore processed. These numbers were referenced assuming a full days processing of 3,000 tonnes of ROM ore per day. I-1 Injection Well Design Please See Appendix A, EBA Engineering Consultants Ltd., document of October 5, 2007, “Commentary on Regulatory Technical Reviews, Pine Point Pilot Project, Hay River, Northwest Territories. I-2 Dilution Rate Calculations Please See Appendix A, EBA Engineering Consultants Ltd., document of October 5, 2007, “Commentary on Regulatory Technical Reviews, Pine Point Pilot Project, Hay River, Northwest Territories. I-3 Monitoring Wells Please See Appendix A, EBA Engineering Consultants Ltd., document of October 5, 2007, “Commentary on Regulatory Technical Reviews, Pine Point Pilot Project, Hay River, Northwest Territories. I-4 Monitoring Requirements Please See Appendix A, EBA Engineering Consultants Ltd., document of October 5, 2007, “Commentary on Regulatory Technical Reviews, Pine Point Pilot Project, Hay River, Northwest Territories.

Phone 360-332-4653 441 Peace Portal Drive Fax: 360-332-4652 Blaine WA 98230
I-5 Plumbing of Secondary Injection Well Although not clearly stated in the review process, Tamerlane fully intends to plumb in the secondary injection well with the primary injection well isolated by a valve. This will enable Tamerlane to quickly transfer discharge water from the primary to the secondary or both if necessary. I-6 Pump Testing Please See Appendix A, EBA Engineering Consultants Ltd., document of October 5, 2007, “Commentary on Regulatory Technical Reviews, Pine Point Pilot Project, Hay River, Northwest Territories. B-1 Isolation Valve Commitment Tamerlane would like to clarify its commitment to utilize isolation valves on each of the freeze pipes in the freeze perimeter. Please see Layne Christensen’s detailed drawing below showing isolation valves on the supply and return brine lines:

Phone 360-332-4653 441 Peace Portal Drive Fax: 360-332-4652 Blaine WA 98230

Phone 360-332-4653 441 Peace Portal Drive Fax: 360-332-4652 Blaine WA 98230
B-2 Size of Possible Spill from Breakage As indicated on page 63 of Tamerlane’s 2nd round IR responses, Layne Christensen calculated that each freeze pipe would contain 400 gallons of brine at any given time. Layne Christensen also indicated that breakage of the freeze pipes is unlikely for the following reasons:
1. A mine rock failure would be localized and affect a very small number of pipes;
2. The pipes are capable of bending without breaking in the event of rock movement; and
3. It is possible to place isolation valves at the surface that can be operated either manually or automatically to isolate the manifold and prevent brine loss.
As previously indicated, Tamerlane has committed to the installation of isolation valves of the freeze pipe system to ensure minimal brine intrusion in the unlikely event of breakage. B-3 Incidental Precipitation Incidental precipitation will not interfere with or negatively affect the freeze manifold system as these HDPE pipes will already have a layer of frozen precipitation on them. If precipitation builds up in the lined trench, then Tamerlane will take measures to clear the additional ice as necessary so as to ensure proper volume allotment in the event of a rupture. Additionally, in discussions with Joe Sopko (Layne Christensen), he has indicated that in all his experience with various freeze projects, he has never encountered a rupture of the freeze manifold systems. B-4 Brine Containment within Surface Plant Ensuing discussions with Joe Sopko (Layne Christensen) indicate isolated containment will be available for the brine tank. In addition, Tamerlane will be placing berms around the freeze plant so as to contain and prevent the spreading of brine in the unlikely event of a tank rupture. The brine tanks are also equipped with low level sensors and valving that will detect a lower than normal level and automatically shut the outgoing valve off. B-5 Dilution Plan of Escaped Brine A common use for the type of brine Tamerlane is utilizing for the freeze perimeter solutions is for dust suppressant on dirt/gravel roadways. As indicated in the below email by Joe Sopko (Layne Christensen), dilution of the brine solution typically occurs at a 7 to 1 ratio (7 gallons water to dilute 1 gallon brine solution). In the unlikely event of an uncontained brine spillage, Tamerlane will follow a 10 to 1 dilution ratio as part of its cleanup plan and include this in its spills contingency planning.

Phone 360-332-4653 441 Peace Portal Drive Fax: 360-332-4652 Blaine WA 98230
From: Joseph Sopko [mailto:[email protected]] Sent: Monday, October 01, 2007 2:37 PM To: 'David Swisher' Subject: Brine Dilution David, One gallon of our 28% calcium chloride would have to be diluted with seven gallons of water to get the same salinity as sea water. Joe S-1 Settling Pond Design Parameters Tamerlane plans to construct an above ground temporary sediment settling pond for storage capacity exceeding 3 days. The pond will be constructed during the construction phase of the project and utilize materials excavated during the shaft sinking operations. A high density polyethylene (HDPE) liner will be utilized in the pond. Tamerlane would like to clarify a typo found in IR0607-002-47, page 34 of the 2nd Round IR Responses. This statement should read, “A thin layer of gravel or waste rock will be utilized under the HDPE liner to act as protection against puncture. The amount of material and dimensional size of the settling pond is shown in the diagram below.

Phone 360-332-4653 441 Peace Portal Drive Fax: 360-332-4652 Blaine WA 98230
S-2 Clarify design volume The designed Sediment Settling Pond (SSP) will be situated in a North to Northeast fashion with an approximate length of 195 meters and width of 104 meters. Fill will be required for the Northeast, East and Southeast portions of the SSP. Approximately 26,130 cubic meters of fill will be trucked from the shaft sinking operations and placed in two meter lifts until a final height of 6 meters is established. The estimated volume of the SSP is calculated at 121,680 m³. The below compares SSP capacity based on varying basal inflow rates:

Phone 360-332-4653 441 Peace Portal Drive Fax: 360-332-4652 Blaine WA 98230
Basal Inflow Daily Quantity SSP Capacity (Days)
50 m³/hr 1,200 m³ 101 500 m³/hr 12,000 m³ 10 941 m³/hr 22,584 m³ 5
S-3 Clarify Proposed Treatment “in the Tank” Our statement on page 35 of 2nd round IR was in error. We will not be using a tank. If there are any contaminates of concern diverted to the pond, the water in the pond will be treated, likely with lime, prior to pumping into the disposal well. Treatment, if needed, will be for pH and metals. S-4 Justification of Necessity Tamerlane does not foresee the Sediment Settling Pond to be utilized on a continual basis. Tamerlane will initially utilize the pond during its start-up operations to ensure discharge water quality into the injection well, however, does not anticipate using the pond throughout the course of the R-190 operations. As indicated previously, the Pond will be available for diversion of discharge water in the unlikely event of higher than expected suspended solids or injection well maintenance and diversion to secondary well. O-1 Flow Diagram and Description
At the PPPP the lead, zinc and iron sulphides are present as veins, massive sulphide occurrences and remnants in a limestone host rock association. The waste in the ROM ore will be limestone which has a significantly lower specific gravity (S.G.) than the sulphides. The S.G. of the limestone is 2.7 while the S.G. of the sulphides varies from 4.1 to 7.6. Crushing the ROM ore can optimize the liberation of the host rock from the sulphides present. A pre-concentration process like Dense Media Separation (DMS) can take advantage of the significant difference in the specific gravity (S.G.) of the liberated host rock and remove it from the crushed ROM ore with minimal loss of sulphides. The ROM ore from the R190 mineralized deposit will be crushed to 100 % passing one quarter inch. The crushed product will be washed on a 28-mesh vibrating, pre-screen which will remove the minus 28 mesh undersize screen fraction. These fines will be removed so they do not interfere with the ferrosilicon {dense media} used to develop the “2.95 S.G. Slurry” that will separate the liberated + 28 mesh, pre-screen fraction, waste product from the sulphide product.

Phone 360-332-4653 441 Peace Portal Drive Fax: 360-332-4652 Blaine WA 98230
The DMS plant comprises pumps, cyclones, sieve bends, vibrating drain/wash screens, a magnet separator and “dense medium slurry” adjustment equipment to facilitate the separation of the high and low specific gravity particles in a continuous process. The pre-screen +28 mesh fraction will discharge into a pump box to which 2.95 S.G. slurry has already been added. This screen product and the 2.95 S.G. dense medium slurry (water and ferrosilicon) mix and will be pumped to the S.G. density medium, separation cyclone(s). The higher, S.G. particles and associated dense medium slurry will leave the cyclone chamber as underflow (called the “Sink” product) while the lower, S.G. particles and associated dense medium slurry will leave the cyclone chamber as overflow (called the “Float” product). The cyclone underflow and overflow products will pass over identical but separate drain/rinse sieve bends and vibrating screens. The sieve bends and feed end of the vibrating screens (28 mesh screen cloth) will drain dense medium slurry at the operating S.G. of 2.95 directly to the wash, pre-screen oversize pump box for reuse. The latter sections of the drain/rinse vibrating screens will be vigorously washed to remove the remaining ferrosilicon from the sulphide and host rock particle surfaces. The drain/rinse screen, recovered ferrosilicon media will have to be densified to the correct medium slurry density of 2.95 so it can be returned to the DMS separation circuit. The ferrosilicon is magnetic and can be selectively recovered on a magnet. Then the ferrosilicon will be scraped from the surface of the magnet and mixed with a measured amount of water to produce the correct dense medium slurry of 2.95. The washed DMS “Float” product will be conveyed to a storage pile and subsequently used to backfill and shotcrete mined-out openings and stopes underground. The washed DMS “Sink” product will be sent for further processing. The washed fines (-28 mesh) will be held in a storage tank for subsequent mixing with the DMS “Sink”. The process for the handling of the ROM ore and associated water at the surface DMS plant will be as follows:
• Washed pre-screen fines (-28 mesh) to storage area for flotation. • Washed pre-screen coarse (+28 mesh) to the DMS circuit –Float to
underground backfill and shotcrete. • Ferrosilicon – recycled to the DMS circuit.

Phone 360-332-4653 441 Peace Portal Drive Fax: 360-332-4652 Blaine WA 98230
• Process Water – all will be recycled to the DMS process except for a small loss on the surfaces of the DMS products.
• Underground Water – make-up water for the DMS circuit (water loss on surfaces of the DMS products); excess underground water will be pumped to the injection well.
The plus 28 mesh DMS “sink” product (ore) will be sent to a 3.5m diameter by 5.6m long (11.5’ dia. X 18.5’ long) ball mill where it will be coarse ground to 80% passing 105 microns. Specific reagents are added to the ball mill feed to prepare the ore for selective lead and later zinc flotation. The ground ore and the DMS pre-screen, minus 28 mesh fines will be pumped to a bank of cyclones. The coarser particles will report to the cyclone underflow and will return to the ball mill feed for more grinding. The cyclone overflow with the minus 105 micron particles will flow to a 2.4m diameter by 2.7m high agitated conditioner where reagents are added to selectively float the lead. The conditioned ground ore will report to the lead rougher and scavenger flotation circuits that consist of six, 300 cubic foot flotation cells. The lead concentrate floated will be further upgraded in three stages of cleaning. The cleaning will be respectively done in five, 100 cubic foot flotation cells, four, 50 cubic foot flotation cells and three, 50 cubic flotation cells. The final, lead cleaner concentrate will be thickened in a 16m diameter, conventional thickener before being stored in an agitated holding tank prior to dewatering in an 8’10” diameter-10 disc vacuum filter. The dewatered concentrate will be shipped by road and rail to designated, custom smelters. The lead circuit flotation tailings will be pumped to a three stage conditioning circuit, to which reagents are added to depress iron, activate the zinc and prepare the zinc for selective flotation recovery. The conditioned ore will pass through the zinc rougher and scavenger flotation circuits that consist of six, 200 cubic foot flotation cells. The zinc concentrate floated will be further upgraded in three stages of cleaning. The cleaning will be respectively done in an eight, five and four bank of 100 cubic foot flotation cells. The final zinc concentrate will be thickened in a 26m diameter, conventional thickener before being stored in an agitated holding tank prior to dewatering in two, 8’10” diameter-10 disc vacuum filter. The dewatered concentrate will be shipped by road and railway to designated, custom smelters. The zinc circuit discharge will be sent to an agitated holding tank prior to mixing them with DMS “float” reject and cement for subsequent deposition as backfill and shotcrete underground. A simplified process flowsheet can be found below.

Phone 360-332-4653 441 Peace Portal Drive Fax: 360-332-4652 Blaine WA 98230
Phone 360-332-4653 441 Peace Portal Drive Fax: 360-332-4652 Blaine WA 98230
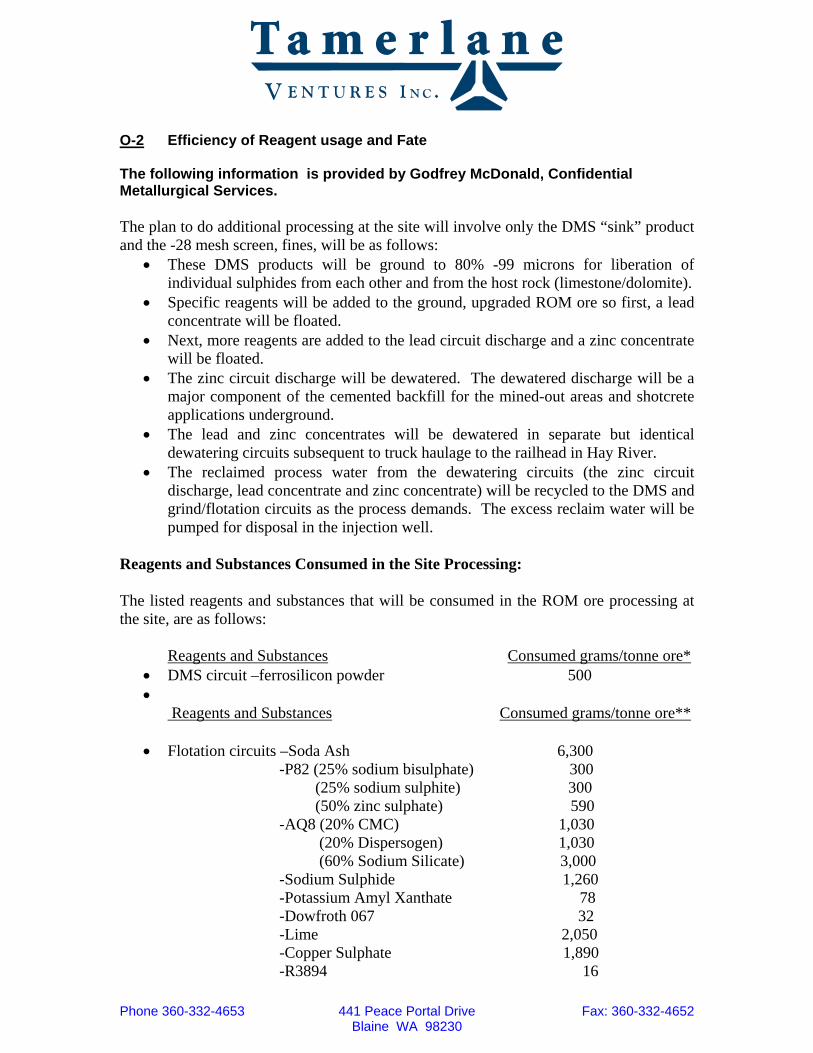
O-2 Efficiency of Reagent usage and Fate The following information is provided by Godfrey McDonald, Confidential Metallurgical Services. The plan to do additional processing at the site will involve only the DMS “sink” product and the -28 mesh screen, fines, will be as follows:
• These DMS products will be ground to 80% -99 microns for liberation of individual sulphides from each other and from the host rock (limestone/dolomite).
• Specific reagents will be added to the ground, upgraded ROM ore so first, a lead concentrate will be floated.
• Next, more reagents are added to the lead circuit discharge and a zinc concentrate will be floated.
• The zinc circuit discharge will be dewatered. The dewatered discharge will be a major component of the cemented backfill for the mined-out areas and shotcrete applications underground.
• The lead and zinc concentrates will be dewatered in separate but identical dewatering circuits subsequent to truck haulage to the railhead in Hay River.
• The reclaimed process water from the dewatering circuits (the zinc circuit discharge, lead concentrate and zinc concentrate) will be recycled to the DMS and grind/flotation circuits as the process demands. The excess reclaim water will be pumped for disposal in the injection well.
Reagents and Substances Consumed in the Site Processing: The listed reagents and substances that will be consumed in the ROM ore processing at the site, are as follows: Reagents and Substances Consumed grams/tonne ore*
• DMS circuit –ferrosilicon powder 500 •
Reagents and Substances Consumed grams/tonne ore**
• Flotation circuits –Soda Ash 6,300 -P82 (25% sodium bisulphate) 300 (25% sodium sulphite) 300 (50% zinc sulphate) 590 -AQ8 (20% CMC) 1,030 (20% Dispersogen) 1,030 (60% Sodium Silicate) 3,000 -Sodium Sulphide 1,260 -Potassium Amyl Xanthate 78 -Dowfroth 067 32 -Lime 2,050 -Copper Sulphate 1,890 -R3894 16
Phone 360-332-4653 441 Peace Portal Drive Fax: 360-332-4652 Blaine WA 98230
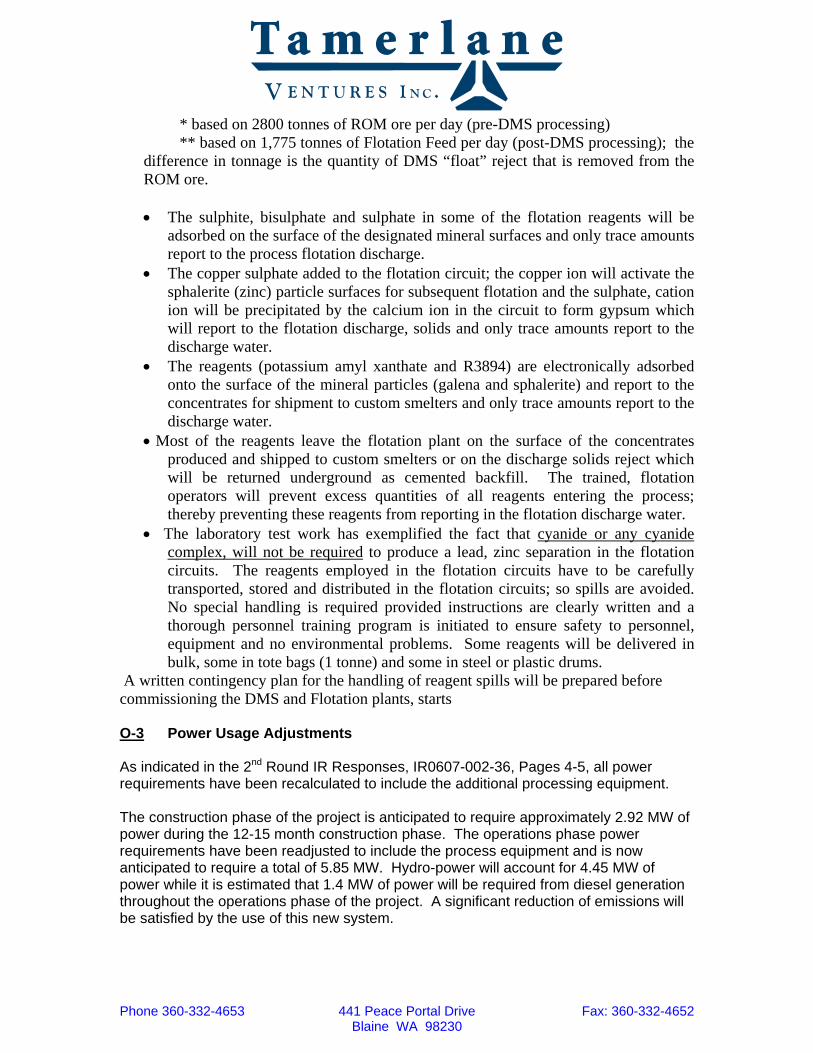
* based on 2800 tonnes of ROM ore per day (pre-DMS processing) ** based on 1,775 tonnes of Flotation Feed per day (post-DMS processing); the difference in tonnage is the quantity of DMS “float” reject that is removed from the ROM ore. • The sulphite, bisulphate and sulphate in some of the flotation reagents will be
adsorbed on the surface of the designated mineral surfaces and only trace amounts report to the process flotation discharge.
• The copper sulphate added to the flotation circuit; the copper ion will activate the sphalerite (zinc) particle surfaces for subsequent flotation and the sulphate, cation ion will be precipitated by the calcium ion in the circuit to form gypsum which will report to the flotation discharge, solids and only trace amounts report to the discharge water.
• The reagents (potassium amyl xanthate and R3894) are electronically adsorbed onto the surface of the mineral particles (galena and sphalerite) and report to the concentrates for shipment to custom smelters and only trace amounts report to the discharge water.
• Most of the reagents leave the flotation plant on the surface of the concentrates produced and shipped to custom smelters or on the discharge solids reject which will be returned underground as cemented backfill. The trained, flotation operators will prevent excess quantities of all reagents entering the process; thereby preventing these reagents from reporting in the flotation discharge water.
• The laboratory test work has exemplified the fact that cyanide or any cyanide complex, will not be required to produce a lead, zinc separation in the flotation circuits. The reagents employed in the flotation circuits have to be carefully transported, stored and distributed in the flotation circuits; so spills are avoided. No special handling is required provided instructions are clearly written and a thorough personnel training program is initiated to ensure safety to personnel, equipment and no environmental problems. Some reagents will be delivered in bulk, some in tote bags (1 tonne) and some in steel or plastic drums.
A written contingency plan for the handling of reagent spills will be prepared before commissioning the DMS and Flotation plants, starts O-3 Power Usage Adjustments As indicated in the 2nd Round IR Responses, IR0607-002-36, Pages 4-5, all power requirements have been recalculated to include the additional processing equipment. The construction phase of the project is anticipated to require approximately 2.92 MW of power during the 12-15 month construction phase. The operations phase power requirements have been readjusted to include the process equipment and is now anticipated to require a total of 5.85 MW. Hydro-power will account for 4.45 MW of power while it is estimated that 1.4 MW of power will be required from diesel generation throughout the operations phase of the project. A significant reduction of emissions will be satisfied by the use of this new system.

Phone 360-332-4653 441 Peace Portal Drive Fax: 360-332-4652 Blaine WA 98230
C-1 Freeze Wells As indicated in the 2nd Round IR Response, IR0607-002-51, the internal down-hole freeze pipes will be salvaged and removed. The external freeze pipes will be capped and left in place. As indicated by our freezing contractor, the external pipes are not removed due to the removal process potentially creating a greater amount of disturbance both on surface and sub-surface, and the extreme difficulty in doing so. Similar to the Injection Well, Tamerlane will ensure that the external pipes are capped below surface and the area returned to its natural contours. C-2 Injection Wells The injection wells will be capped and firmly secured upon closure and reclamation. Tamerlane is suggesting that these wells not be plugged as they, similar to existing dewatering wells, can provide a means for future water surveys and test work by both the developer and government officials. C-3 External Pipes Tamerlane fully intends to reclaim all externally exposed piping on or near the surface during its closure and reclamation activities.

Phone 360-332-4653 441 Peace Portal Drive Fax: 360-332-4652 Blaine WA 98230
Appendix A

October 5, 2007 EBA File: 1740149.005 Tamerlane Ventures Inc.441 Peace Portal DriveBlaine, WA 98230 USA Attention: Mr. David Swisher Vice President/Senior Project Manager Dear Mr. Swisher: Re: Commentary on Regulatory Technical Reviews, Pine Point Pilot Project Hay River, Northwest Territories
Introduction Further to your request to EBA Engineering Consultants Ltd. (EBA), we present here our comments on technical questions raised by regulatory agencies relating to basal inflow, injection wells, dilution of injected water and monitoring for the Tamerlane Ventures Inc. (Tamerlane) Pine Point Pilot Project (R-190 site), near Hay River, NWT. The topics and questions addressed here come from technical reviews presented to Tamerlane by Indian and Northern Affairs Canada (INAC) in a letter dated September 21, 2007 and the Mackenzie Valley Environmental Impact Review Board (MVEIRB) in a letter dated September 24, 2007.
Topics to address The topics you have requested that we address are as follows:
1. Basal inflow estimates to include upper and lower limits.
2. Provide a schematic injection well design.
3. Determine the dilution rate for injected water into the Presquile aquifer.
4. Comment on suggested monitoring well system (four dedicated monitoring wells)
5. Comment on the need for pumping tests in injection wells.
6. Comment on methods and frequency of injection well maintenance.
7. Comment on monitoring requirements for the injection well system during operation and after closure.
These are discussed below.
p . 250 .862 .4832 • f . 250 .862 .2941 150 , 1715 D i cks on Av enue • Ke lowna , B r i t i s h Co lumb ia V1Y 9G6 • CANADA
Technical response letter 5Oct2007.doc
EBA Eng inee r ing Consu l t an ts L td .

1740149.005 October 5, 2007
2
Basal inflow range
From our initial modelling, an estimated basal inflow value of 941 m3/hr was determined based on reasonable values for the model input parameters obtained from existing reports. Readers should understand that this coarse modelling approach was intended to give an approximate expected basal inflow, rather than a precise range of predicted inflows (as would be expected from detailed modelling done for mine design). The intent was more to answer the question “will it be 100, 1,000 or 10,000 m3/hr” as a coarse dewatering prediction for purposes of regulatory permitting. From this perspective, we could just as well have chosen to report the basal inflow results as “about 1,000 m3/hr”.
The concept of obtaining a detailed range of basal inflows hinges on knowing a realistic range of hydraulic conductivities for the Pine Point Formation (K3 in our model terminology). At present, we are not aware of values for K3 other than the values reported for core samples in 1983 by Stevenson Groundwater Consultants, which we used in our model. Estimates of ranges of basal inflow determined by entering arbitrarily higher or lower K3 values into our SEEP/W model that are not based on additional information becomes speculation. We acknowledge that there would be a range of basal inflows expected over time during mine operation (from mine start-up, through different mine configurations and at mine closure).
However, in our view, the key question is not to determine a precise upper limit of basal inflow at this stage in the mine development, but rather could anticipated levels of groundwater pumping be reinjected into the Presquile aquifer. From that perspective, the arbitrary upper limit of 5,000 m3/hr suggested by the technical reviewers could simply be adopted in the context of this discussion, since even that flow of groundwater could be reinjected into the Presquile aquifer given proper injection well sizing and design.
In considering a lower basal inflow limit, it is useful to consider the water balance of the Presquile aquifer. When reinjection is underway (at injection wells likely to be located only a few hundred metres outside of the freeze wall around the mine workings) and stabilized, a direct recharge path will be established back to the Presquile aquifer. A similar amount of water will be reinjected to the aquifer outside of the freeze wall as is pumped out from the mine workings inside the freeze wall. We expect that a nearly steady state circuit of water flow will be established, starting from the pumps within the mine, through the surface process circuit, into the injection well(s), back into the Presquile aquifer.
Ultimately, the only water loss from the Presquile aquifer will be equal to whatever losses or diversions occur in the surface process circuit. These losses/diversions are anticipated to be negligible compared with the natural recharge to the Presquile aquifer. Therefore, we do not anticipate a gross change in the water balance in the Presquile aquifer in the vicinity of the mine due to mine dewatering and reinjection. Whatever water loss occurs will be rapidly compensated by horizontal flow through the highly-transmissive Presquile aquifer toward the mine area. Without substantial water loss from the confined aquifer, we do not expect that the Presquile aquifer will noticeably depressurize progressively over the long term due to mine dewatering. Therefore, we do
Technical response letter 5Oct2007.doc

1740149.005 October 5, 2007
3
not expect a progressive decrease in basal inflow due to depressurization, as suggested in the technical review.
Also, given the fact that the core test hydraulic conductivity values from the 1983 report (used for K3 in our earlier modelling) did not include fracture permeability, the actual hydraulic conductivity of fractured Pine Point Formation rocks will tend to be higher than the K3 value used in the model. So, considering fracture permeability suggests that basal inflows would not tend to be lower than our 941 m3/hr estimate but, if anything, higher. When site-specific bulk hydraulic conductivity values (including the effects of fracture permeability) are available for the Pine Point Formation, meaningful and defensible ranges of basal inflow can be modelled. We see no justification, based on the current information, for considering a radically lower limit for basal inflow (i.e., 50 m3/hr as suggested in the technical review).
Schematic injection well design
A schematic injection well is depicted in Figure 1 (not to scale).
Injection Water
Figure 1 – Schematic diagram of injection well for the Pine Point R-190 site
Till
Hay River Shale
Slave Point Dolomite
Watt Mountain Dolomite
Presquile Dolomite
Pine Point Formation
Surface
Static water level (SWL) ~25 m bgl
Well casing, diameter D
Open hole with liner
Drop pipe to below SWL
Technical response letter 5Oct2007.doc

1740149.005 October 5, 2007
4
The key features of this concept are as follows:
• Well is cased fully down through the Watt Mountain Dolomite to prevent cross-flow between the Presquile aquifer and shallower water-bearing zones and to maintain the water balance within the Presquile aquifer.
• Bottom of injection well is an open hole drilled through the entire thickness of Presquile Dolomite, to take advantage of all available injection capacity back into that formation.
• Open hole section should be lined with a perforated well liner (e.g., PVC pipe of slightly smaller diameter than the open borehole and with many perforations to allow rapid through-flow of water). The liner acts to keep any sloughing or caving rock fragments from the borehole wall out of the well.
• Injection water is admitted from surface piping to a drop pipe that extends below the static water level in the well (about 25 m below ground surface). This will minimize cascading effects and aeration of water entering the injection well.
• Well diameter D will be commensurate with the injection flow required. Diameters expected in the range of 305 mm (12 in) to 610 mm (24 in).
Detailed design of injection wells and surface controls, piping and instrumentation has not yet been done.
Dilution rate for water injected into the Presquile aquifer The technical review included a set of calculations of mixing distances and dilution factors for water injected into the Presquile aquifer, ranging from zero mixing (piston flow of an unmixed slug of water) up 100% mixing with all pore water immediately. Realistically, actual mixing will be somewhere between these two end-members given the high porosity (10-20%) and permeability of the karstic Presquile dolomite. However, actual mixing behaviour in the aquifer is indeterminate based on currently available information.
If we assume 50% mixing efficiency, it would take two parts of formation pore water to completely mix with one part of injected water. This complete mixing would act to reduce any differences in chemical concentrations between the injected water and the formation groundwater (in pores) by half, or 100% dilution.
The radial distance from the injection well where this condition would exist can be calculated given these mixing assumptions, the injection rate and aquifer porosity and thickness. For this calculation, we assumed the following:
• Injection rate of 941 m3/hr (8,243,160 m3/yr);
• Injected water dispersed over the whole thickness of the Presquile dolomite (61 m);
• Porosity of Presquile dolomite of 15%.
Technical response letter 5Oct2007.doc

1740149.005 October 5, 2007
5
With 50% mixing efficiency, the 100% dilution radial distance will occur where the pore volume of the rock mass equals twice the injected water volume. At one year, the mathematical expression becomes:
V(pore) = V(rock mass) x porosity = π r2 D n = 2 V(injected)
Where r = radial distance from the injection well (m), D = thickness of the Presquile dolomite (61 m) and n = rock porosity (15%).
So: r2 = (2 Vinjected) / (π D n)
r2 = (2 x 8,243,160 m3) / (3.1416 x 61 m x 0.15) = 573,525 m2
r = 757 m.
As described below, we recommend that one of the monitor wells be located 800 m from the primary injection well. Under the above assumptions, this should be a suitable distance to gauge the fate and transport of chemicals in the injected water.
Suggested monitoring well system
Tamerlane currently proposes to have two injection wells, with the second (backup) injection well useable also as a monitor well for groundwater quality monitoring. In addition, two dedicated monitor wells would be completed into the Presquile aquifer for deep groundwater monitoring. The locations of the injection wells are yet to be determined. In turn, the location of the two monitoring wells should depend on where the injection wells are located. In general terms, the primary injection well would be located outside and east of the freeze wall around the mine, and the backup injection well would be nominally 100 m away from and east of the primary injection well, along the Main Hinge trend. One dedicated monitor well could be located to provide monitoring coverage approximately 300 m west of the primary injection well (in a location near the freeze wall so as to also provide monitoring for that). The other dedicated monitor well could be located nominally 800 m east or northeast of the primary injection well. This system of three monitoring points (proximal backup injection well, middle distant monitor well near the freeze wall, and a distal monitoring well 800 m E-NE of the primary injection well) would provide monitoring over a range of distances from the primary injection well, with two points at increasing distance in the general direction of regional north-easterly groundwater flow.
The degree of groundwater monitoring should be commensurate with the anticipated risk to users of the groundwater. There is no current or expected groundwater extraction from the Presquile aquifer for human consumption or other use except mine dewatering, and no obvious direct pathways for this deep aquifer water to ecological receptors at the surface. Therefore there is no anticipated exposure to and or risk posed by reinjecting water (originally derived from the Presquile aquifer through mine dewatering) back into the Presquile aquifer. Under this negligible risk setting, we consider the monitoring well system described above to be adequate. As a final thought, since groundwater moves very slowly, if there were to be a condition requiring additional groundwater monitoring in the Presquile aquifer, there would be plenty of time to install additional wells in future if required.
Technical response letter 5Oct2007.doc

1740149.005 October 5, 2007
6
The need for pumping tests in injection wells
It is essential that both injection wells be hydraulically tested after drilling, installation and development. This is standard practice for commissioning of commercial injection wells to document their hydraulic and operating characteristics. This testing can be in the form of pumping tests or injection tests, carried out at or near the full scale injection rate. Given the lack of abundant available surface water near the R-190 site, it would be most practical to carry out hydraulic tests by pumping groundwater out of the wells.
The results of these tests can be used to calculate key hydraulic well characteristics (specific capacity (flow rate per m of build-up or drawdown), expected water level build-up above static water level under different injection rates, and other characteristics) that are required for planning actual injection operation. The pumping tests along with water level observations in nearby monitor wells can also provide data to determine aquifer characteristics for the Presquile aquifer (e.g., bulk transmissivity and storativity). These will be useful parameters for anticipating the hydraulic effects out into the Presquile aquifer under long term injection operation and for other aspects of mine development.
Hydraulic testing for the injection wells could be staged after these wells were installed and after the freeze wall boreholes were drilled, instrumented and activated. This would allow the freeze wall to be constructed under natural groundwater conditions, with low ambient groundwater velocities. The pumping test would induce a short-term higher-than-ambient hydraulic gradient in the vicinity of the freeze wall, but this hydraulic stress would relax rapidly after the test was completed, due to the very high transmissivity of the Presquile aquifer. The scheduling of freeze wall construction and injection well testing is an operational matter in the mine development.
Methods and frequency of injection well maintenance
The injection wells (as with any high flow water well) will need occasional maintenance due to the natural effects of well fouling. All wells show a progressive degrading of well performance (specific capacity) due to well fouling (reduction of open area for flow through the well and into the formation) over time.
Maintenance methods should be designed based on the type of fouling the well is experiencing. Typically, a down-hole camera survey is completed and water samples analyzed for inorganic chemistry and microbiological parameters (especially if a well has been unused with stagnant water in the casing for long periods of time) to visually and chemically assess the nature of the well deterioration. A camera survey can also reveal any physical damage or deterioration within the well.
Based on the type of fouling, a combination of mechanical, chemical and hydraulic methods can be tailored to the well condition. These methods include mechanical brushing, adding corrosive chemicals (acid) to dissolve scale deposits, jetting and surge block well development techniques, and adding selected disinfecting chemicals or bacteriocides to remove biofilm build-up due to bacterial growth.
Technical response letter 5Oct2007.doc

1740149.005 October 5, 2007
7
Typically, when the specific capacity of a well drops 25%, planned well maintenance is indicated. How often this condition occurs depends on flow rate, well design and construction, and water quality entering the well. We expect that well maintenance will be required every two to three years. Well fouling is typically a slow and progressive process, so well maintenance can be scheduled to have the least impact on mining operations. The purpose of having two injection wells is to have a backup well available both for planned maintenance and for unexpected down time of the primary injection well.
Monitoring requirements for the injection well system during operation and after closure
Important parameters to measure and monitor at an injection well during operation are: • Flow rate (using a flow meter built into the control infrastructure at the well head); • Pressure at injection well head (to maintain within operable limits); • Pumping water level (showing the build-up of water level in the injection well casing compared
with the static water level); • Injection water chemistry (sampling and testing, and in-line monitoring of indicator parameters); • Air venting (to release air/gas from inside injection pipe to avoid gas bubbles entrained into
injection well); • Sediment filtering (monitor build-up of fines in filter/sediment trap system at injection well head
control house).
After closure of the mine and shutting down of the injection well system, monitoring could be carried on to document the recovery of groundwater to a natural static water level, as well as groundwater sampling for chemical analysis in accordance with the mine closure plan.
Closure
We trust these comments are satisfactory for your current needs. This letter is to be read in conjunction with our General Conditions (attached), which form part of this report. If you have any questions, please contact us at your convenience. Yours truly, EBA Engineering Consultants Ltd.
H. Scott Schillereff, Ph.D., P.Geo. Richard Hoos Principal Consultant Principal Consultant Pacific Environment Practice Environmental Practice Direct Line: 250.862.4832 x225 Direct Line: 604.685.0275 [email protected] [email protected]
Attachments – General Conditions
Technical response letter 5Oct2007.doc