Embed Size (px)
Citation preview
Experion MX IntelliMap R610.0
User Manual 6510020464 Rev 01


IntelliMap R610.0 User Manual
March, 2017

Confidentiality Statement
This manual is a product of Honeywell. It is intended for use only by Honeywell and customer personnel in connection with Honeywell products. It is strictly prohibited to copy this manual or any part thereof or to transfer this manual or any part thereof to any non-Honeywell person or entity, except customer personnel for use in connection with Honeywell products. Persons employed by a third-party service company shall not have access to this manual.
Notice
All information and specifications contained in this manual have been carefully researched and prepared according to the best efforts of Honeywell, and are believed to be true and correct as of the time of this printing. However, due to continued efforts in product improvement, we reserve the right to make changes at any time without notice.
To view or order additional or revised copies of this publication, visit Honeywell's Process Solutions Center.
Trademarks
All trademarks and registered trademarks are the properties of their respective holders.
Copyright
© 2017 Honeywell 500 Brooksbank Ave, North Vancouver, BC, Canada V7J 3S4.
All rights reserved. No part of this publication may be reproduced or translated, stored in a database or retrieval system, or transmitted in any form or by any means, electronic, mechanical, photocopying, recording, or otherwise, without the prior written permission of Honeywell.

P/N 6510020464 Rev 01 3/16/17 i
Table of Contents
Introduction ................................................................................................................................... v Audience .................................................................................................................................... vi About This Manual .................................................................................................................... vi Related Reading ........................................................................................................................ vii Conventions .............................................................................................................................. vii
1. Installation ............................................................................................................................. 1-1 1.1. Before Starting Installation ........................................................................................... 1-1 1.2. Hardware Requirements ................................................................................................ 1-1 1.3. Software Requirements ................................................................................................. 1-2 1.4. Software Installation ..................................................................................................... 1-2
2. Startup .................................................................................................................................... 2-1 2.1. Before Starting the Application .................................................................................... 2-1 2.2. Starting IntelliMap ........................................................................................................ 2-2 2.3. Verifying Communication Data .................................................................................... 2-5
3. Bump Test, Alignment and Model Identification ............................................................... 3-1 3.1. Configuring a Bump Test .............................................................................................. 3-1 3.2. Executing a Bump Test ................................................................................................. 3-3 3.3. Saving a Bump Test ...................................................................................................... 3-6
4. Traditional Controller Tuning ............................................................................................. 4-1
5. Implementing Alignment, Model, and Traditional Tuning Parameters .......................... 5-1
6. Multivariable Controller Tuning ......................................................................................... 6-1
7. CD Analysis ............................................................................................................................ 7-1 7.1. Getting Started .............................................................................................................. 7-1
IntelliMap R610.0 User Manual Table of Contents
3/16/17 P/N 6510020464 Rev 01 ii
7.2. Configuring CD Analysis ............................................................................................. 7-4 7.3. Figures .......................................................................................................................... 7-6 7.4. Action Panel ................................................................................................................ 7-17
8. Reports ................................................................................................................................... 8-1 8.1. Getting Started .............................................................................................................. 8-1 8.2. Report Types ................................................................................................................. 8-4 8.3. Report Screens .............................................................................................................. 8-5 8.4. Report Viewers ............................................................................................................. 8-6
9. Glossary ................................................................................................................................. 9-1
Index ............................................................................................................................................ 9-1
List of Figures Figure 2-1 Command Prompt .................................................................................................................. 2-2 Figure 2-2 IntelliMap Startup .................................................................................................................. 2-3 Figure 2-3 IntelliMap Overview .............................................................................................................. 2-5 Figure 3-1 Bump Test Configuration....................................................................................................... 3-2 Figure 3-2 Bump Test Execution ............................................................................................................. 3-4 Figure 4-1 Traditional Controller Tuned to be Too Aggressive (X90 < Xc) .......................................... 4-2 Figure 4-2 Traditional Controller Tuned to Be Too Conservative (X90 > X3dB) .................................. 4-3 Figure 4-3 Traditional Controller Tuned for Balanced Control ( X90 = Xc) .......................................... 4-4 Figure 5-1 Alignment Implementation Sub screen .................................................................................. 5-2 Figure 5-2 Model Implementation Sub screen ........................................................................................ 5-3 Figure 5-3 Traditional Tuning Implementation Sub screen..................................................................... 5-4 Figure 5-4 IntelliMap Parameters To Transfer Dialog Box .................................................................... 5-5 Figure 6-1 Multivariable Controller with equal emphasis on sheet properties and balanced actuation .. 6-4 Figure 6-2 Multivariable Controller with more emphasis on base sheet Moisture and balanced actuation
......................................................................................................................................................... 6-5 Figure 6-3 Multivariable Controller with equal emphasis on sheet properties and less aggressive
AutoSlice ......................................................................................................................................... 6-6 Figure 6-4 Implementation screen with the Tuning Parameters option selected ..................................... 6-7 Figure 7-1 IntelliMap Startup .................................................................................................................. 7-2 Figure 7-2 CD Analysis Startup............................................................................................................... 7-3 Figure 7-3 Configuration Button ............................................................................................................. 7-4 Figure 7-4 Configuration Dialog Box ...................................................................................................... 7-5 Figure 7-5 Sample Figure with One Graph ............................................................................................. 7-5 Figure 7-6 Sample Figure with Two Graphs ........................................................................................... 7-6 Figure 7-7 Average Profile ...................................................................................................................... 7-7 Figure 7-8 Profile Stability ...................................................................................................................... 7-8

IntelliMap R610.0 User Manual Table of Contents
P/N 6510020464 Rev 01 3/16/17 iii
Figure 7-9 Spatial Model ......................................................................................................................... 7-9 Figure 7-10 Dynamic Response ............................................................................................................. 7-10 Figure 7-11 Power Spectrum and Cumulative Power Spectrum ........................................................... 7-11 Figure 7-12 Profile Color Map ............................................................................................................... 7-12 Figure 7-13 Profile Overlay ................................................................................................................... 7-13 Figure 7-14 Total Variance Partition ..................................................................................................... 7-14 Figure 7-15 Average Trend and 2-Sigma Trend ................................................................................... 7-15 Figure 7-16 CD Variance Partition ........................................................................................................ 7-16 Figure 7-17 Edit Titles ........................................................................................................................... 7-17 Figure 7-18 Action Panel ....................................................................................................................... 7-18 Figure 7-19 Summary Screen ................................................................................................................ 7-19 Figure 8-1 IntelliMap Navigation Panel .................................................................................................. 8-2 Figure 8-2 IntelliMap Reports Screen ...................................................................................................... 8-3 Figure 8-3 Name & Location of Report files ........................................................................................... 8-5 Figure 8-4 Report Viewers ....................................................................................................................... 8-7
List of Tables Table 8-1 Reports View Toolbar Components ........................................................................................ 8-8

P/N 6510020464 Rev 01 3/16/17 v
Introduction
This manual explains how to use Experion MX IntelliMap™ CD Controller Alignment and Tuning software for Experion MX CD Controls.
All references to IntelliMap in this manual are to Experion MX IntelliMap R610.0 unless otherwise specified.
IntelliMap is an automatic tool providing alignment and complete tuning of Honeywell CD control strategies – true multivariable profile control and traditional mapped single-variable profile control.
IntelliMap offers industrial-quality automated multivariable identification of CD processes, including alignment, shrinkage profile, CD response shape and time response. Multivariable CD process model identification describes the effect of each CD actuator beam on each sheet property.
IntelliMap includes the Multivariable Tuner for robust and optimal tuning of the Experion MX CD Controls multivariable controller and two-dimensional loop shaping for Experion MX CD Controls traditional controller. Users can tune their CD control system while previewing the predicted performance of measurement and actuator profiles for Experion MX CD Controls. The tool gives an industrial highly automated and integrated access to advanced computation algorithms for multivariable CD process model identification and CD control system tuning. It also allows the maintenance of grade-dependant process models. The advanced algorithms employed in the tool are completely automated and simple to use, enabling the on-site personnel to maintain and optimize the highly sophisticated Experion MX CD Controls with minimum effort for maximum results.
IntelliMap provides three user modes to accommodate different levels of expertise, while simplifying and automating the operations necessary for successfully starting and maintaining a CD control system.

IntelliMap R610.0 User Manual Introduction
3/16/17 P/N: 6510020464 Rev 01 vi
IntelliMap is designed as a separate stand-alone tool that can be fully integrated for use with an existing Honeywell network-based Experion MX Quality Control System.
Audience This manual is intended for use by Honeywell field site support personnel and process control specialists who are familiar with the Experion MX QCS and Experion MX CD Controls.
About This Manual This manual contains eight chapters, a glossary, and an index.
Chapter 1, Installation, describes the installation of IntelliMap software.
Chapter 2, Startup, describes the IntelliMap startup utility.
Chapter 3, Bump Test, Alignment and Model Identification, describes the activities required to perform a bump test, calculate alignment, identify CD process model, and save bump test to a file.
Chapter 4, Traditional Controller Tuning, describes how to align and tune a traditional single-variable CD controller.
Chapter 5, Implementing Alignment, Model, and Traditional Tuning Parameters, describes how to transfer the calculated alignment, model, and/or traditional tuning parameters to the QCS from IntelliMap.
Chapter 6, Multivariable Controller Tuning, details how to tune multivariable CD control. This chapter is only relevant to systems that have the multivariable controller included.
Chapter 7, CD Analysis, describes how to use the CD Analysis tools to evaluate process performances.
Chapter 8, Reports, describes the different types of alignment, model and tuning reports and how to generate them.
Introduction Related Reading
P/N 6510020464 Rev 01 3/16/17 vii
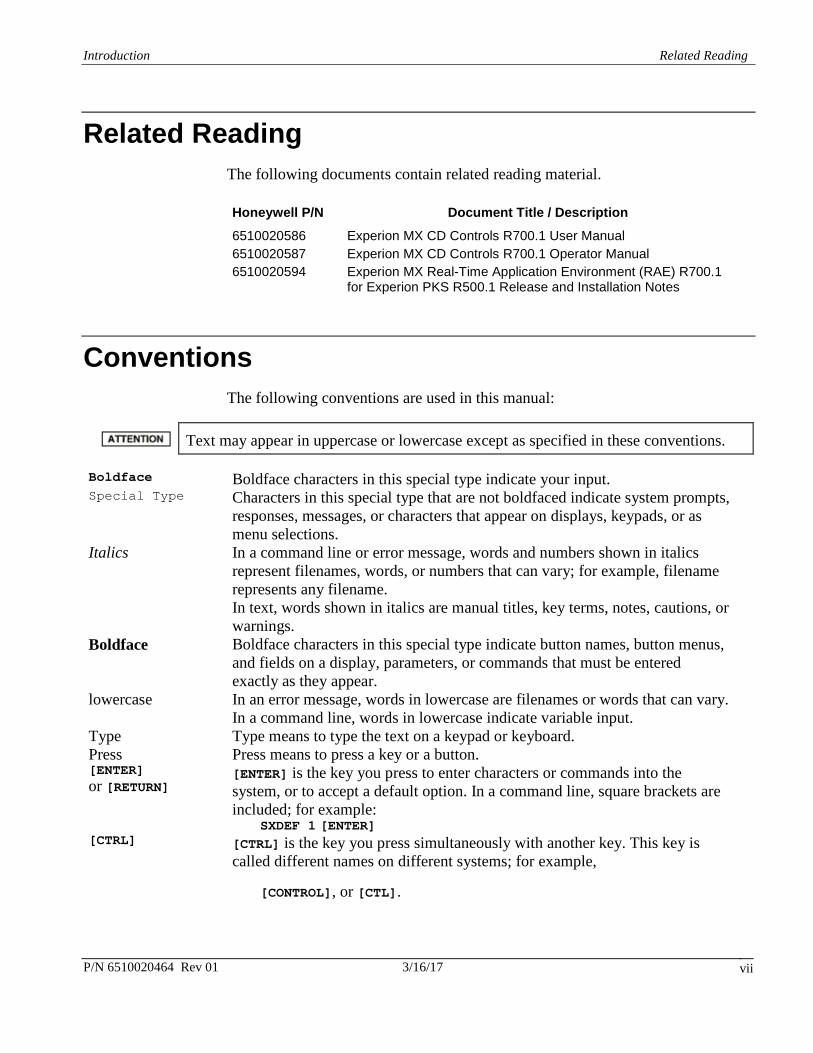
Related Reading The following documents contain related reading material.
Honeywell P/N Document Title / Description
6510020586 Experion MX CD Controls R700.1 User Manual 6510020587 Experion MX CD Controls R700.1 Operator Manual 6510020594 Experion MX Real-Time Application Environment (RAE) R700.1
for Experion PKS R500.1 Release and Installation Notes
Conventions The following conventions are used in this manual:
Text may appear in uppercase or lowercase except as specified in these conventions. Boldface Boldface characters in this special type indicate your input. Special Type Characters in this special type that are not boldfaced indicate system prompts,
responses, messages, or characters that appear on displays, keypads, or as menu selections.
Italics In a command line or error message, words and numbers shown in italics represent filenames, words, or numbers that can vary; for example, filename represents any filename. In text, words shown in italics are manual titles, key terms, notes, cautions, or warnings.
Boldface Boldface characters in this special type indicate button names, button menus, and fields on a display, parameters, or commands that must be entered exactly as they appear.
lowercase In an error message, words in lowercase are filenames or words that can vary. In a command line, words in lowercase indicate variable input.
Type Type means to type the text on a keypad or keyboard. Press Press means to press a key or a button. [ENTER] or [RETURN]
[ENTER] is the key you press to enter characters or commands into the system, or to accept a default option. In a command line, square brackets are included; for example:
SXDEF 1 [ENTER] [CTRL] [CTRL] is the key you press simultaneously with another key. This key is
called different names on different systems; for example,
[CONTROL], or [CTL].

IntelliMap R610.0 User Manual Introduction
3/16/17 P/N: 6510020464 Rev 01 viii
[KEY-1]-KEY-2 Connected keys indicate that you must press the keys simultaneously; for example,
[CTRL]-C. Click Click means to position the mouse pointer on an item, then quickly depress
and release the mouse button. This action highlights or “selects,” the item clicked.
Double-click Double-click means to position the mouse pointer on an item, then click the item twice in rapid succession. This action selects the item “double-clicked.”
Drag X Drag X means to move the mouse pointer to X, then press the mouse button and hold it down, while keeping the button down, move the mouse pointer.
Press X Press X means to move the mouse pointer to the X button, then press the mouse button and hold it down.
The information icon appears beside a note box containing information that is important.
The caution icon appears beside a note box containing information that cautions you about potential equipment or material damage.
The warning icon appears beside a note box containing information that warns you about potential bodily harm or catastrophic equipment damage.
P/N 6510020464 Rev 01 3/16/17 1-1
1. Installation
This chapter describes the procedures for initial installation of IntelliMap software.
1.1. Before Starting Installation This chapter assumes you can logon as a user with Administrator privileges on the installation target Windows 10 or Windows 7 workstation, and have proficient skills in the following areas of Windows workstation operations:
• running applications under Windows Programs Menu
• running and manipulating files under Windows Explorer
• accessing files from a DVD drive
• using Windows based applications
• shutting down and restarting Windows
• using the Experion MX CD Controls application software
1.2. Hardware Requirements • Intel® Dual-Core Processor @ 2.3GHz
• 4.0GB RAM available
• 700 MB of free disk space
• graphic adapter and color monitor capable of 1024 x 768 resolution
IntelliMap R610.0 User Manual Installation
3/16/17 P/N: 6510020464 Rev 01 1-2
• 10/100/1000 Megabit Ethernet Adapter
• mouse
• DVD +/- RW Drive
1.3. Software Requirements IntelliMap supports the Honeywell CD control system Experion MX CD Controls.
IntelliMap software must NOT be installed on the Experion MX QCS server or operator stations or other machines that are running RAE platform-based applications under any circumstances.
1.4. Software Installation
To install IntelliMap:
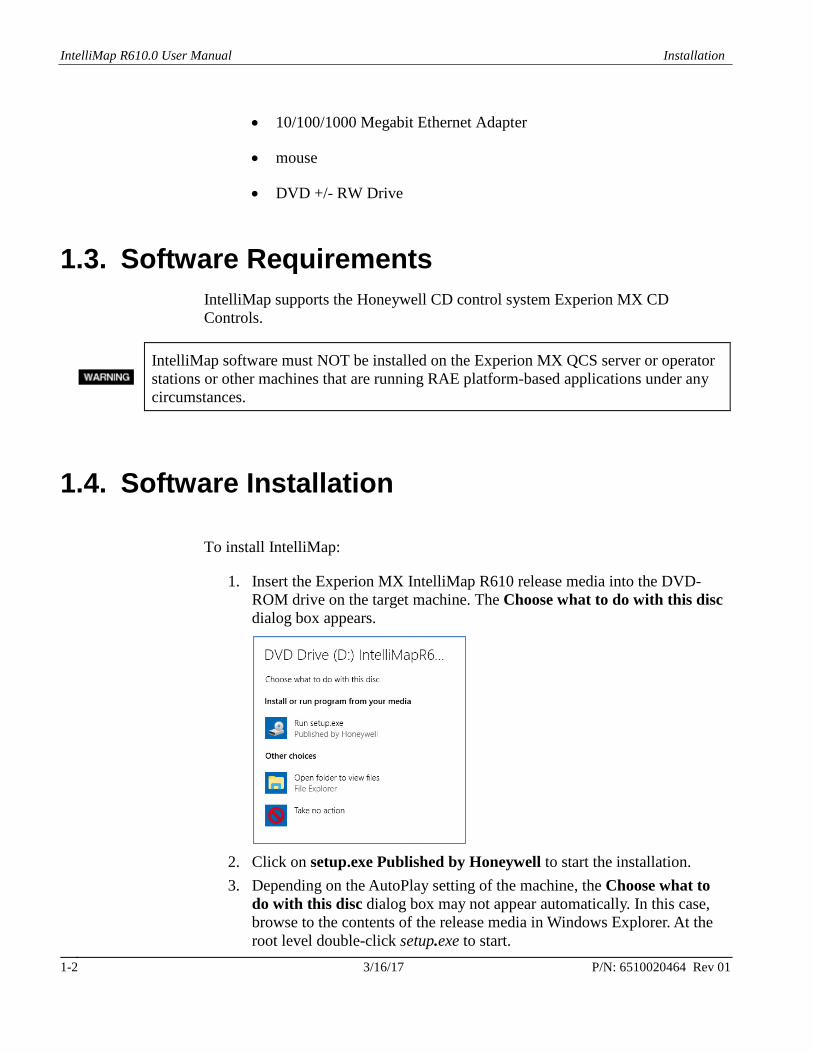
1. Insert the Experion MX IntelliMap R610 release media into the DVD-ROM drive on the target machine. The Choose what to do with this disc dialog box appears.
2. Click on setup.exe Published by Honeywell to start the installation. 3. Depending on the AutoPlay setting of the machine, the Choose what to
do with this disc dialog box may not appear automatically. In this case, browse to the contents of the release media in Windows Explorer. At the root level double-click setup.exe to start.
Installation Software Installation
P/N 6510020464 Rev 01 3/16/17 1-3
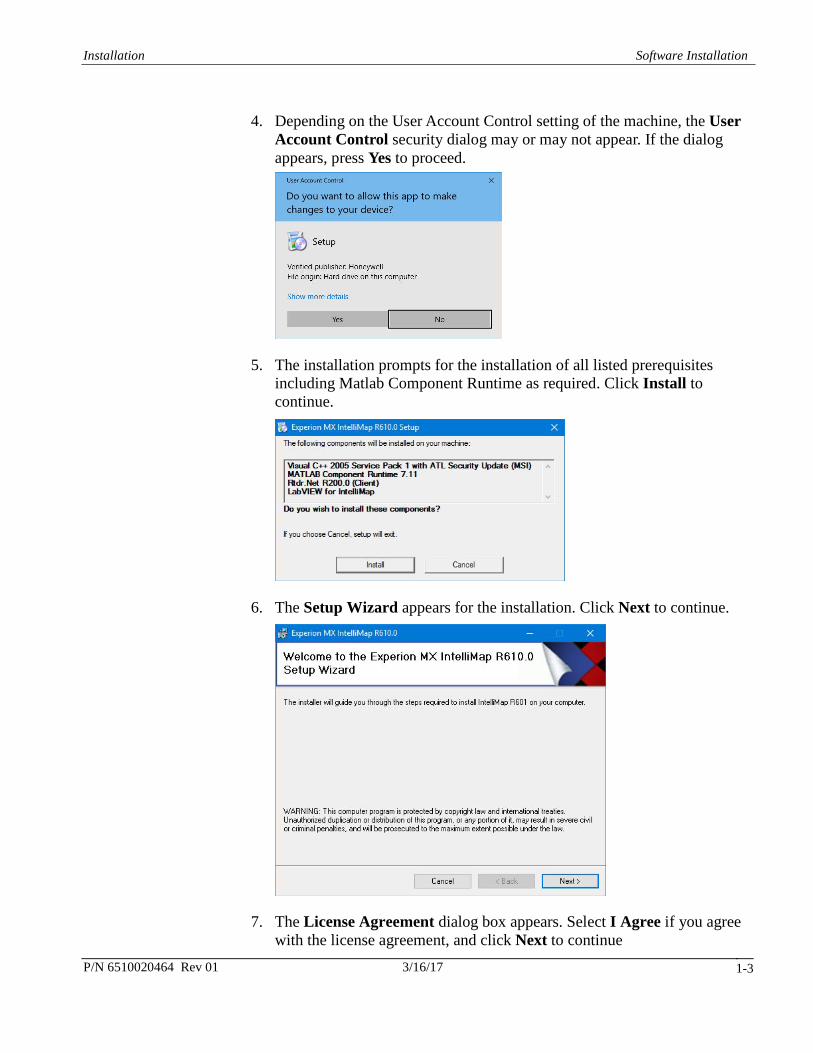
4. Depending on the User Account Control setting of the machine, the User Account Control security dialog may or may not appear. If the dialog appears, press Yes to proceed.
5. The installation prompts for the installation of all listed prerequisites including Matlab Component Runtime as required. Click Install to continue.
6. The Setup Wizard appears for the installation. Click Next to continue.
7. The License Agreement dialog box appears. Select I Agree if you agree with the license agreement, and click Next to continue
IntelliMap R610.0 User Manual Installation
3/16/17 P/N: 6510020464 Rev 01 1-4
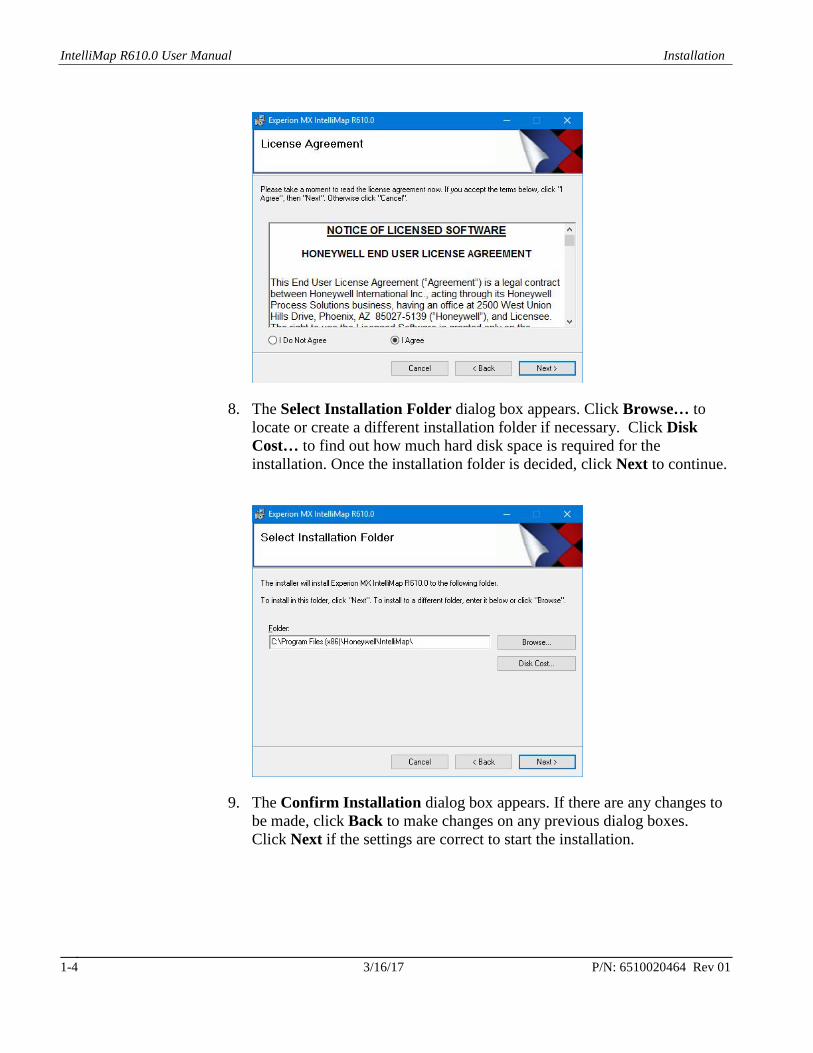
8. The Select Installation Folder dialog box appears. Click Browse… to locate or create a different installation folder if necessary. Click Disk Cost… to find out how much hard disk space is required for the installation. Once the installation folder is decided, click Next to continue.
9. The Confirm Installation dialog box appears. If there are any changes to be made, click Back to make changes on any previous dialog boxes. Click Next if the settings are correct to start the installation.
Installation Software Installation
P/N 6510020464 Rev 01 3/16/17 1-5
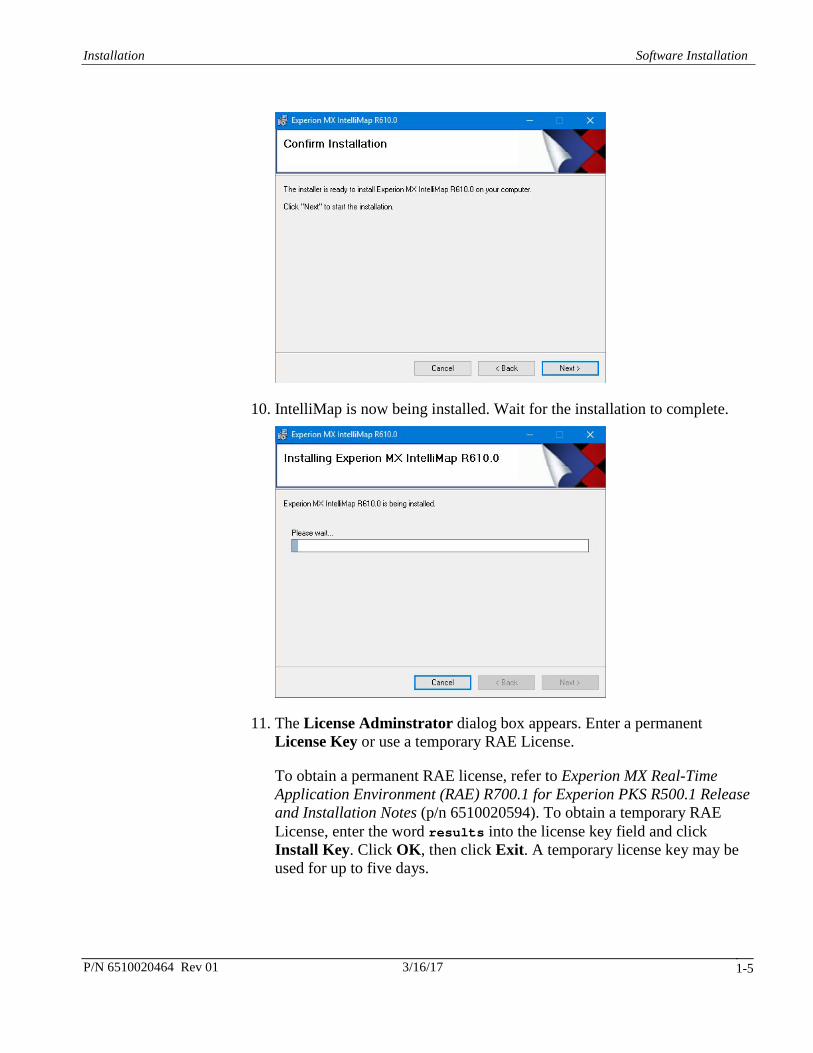
10. IntelliMap is now being installed. Wait for the installation to complete.
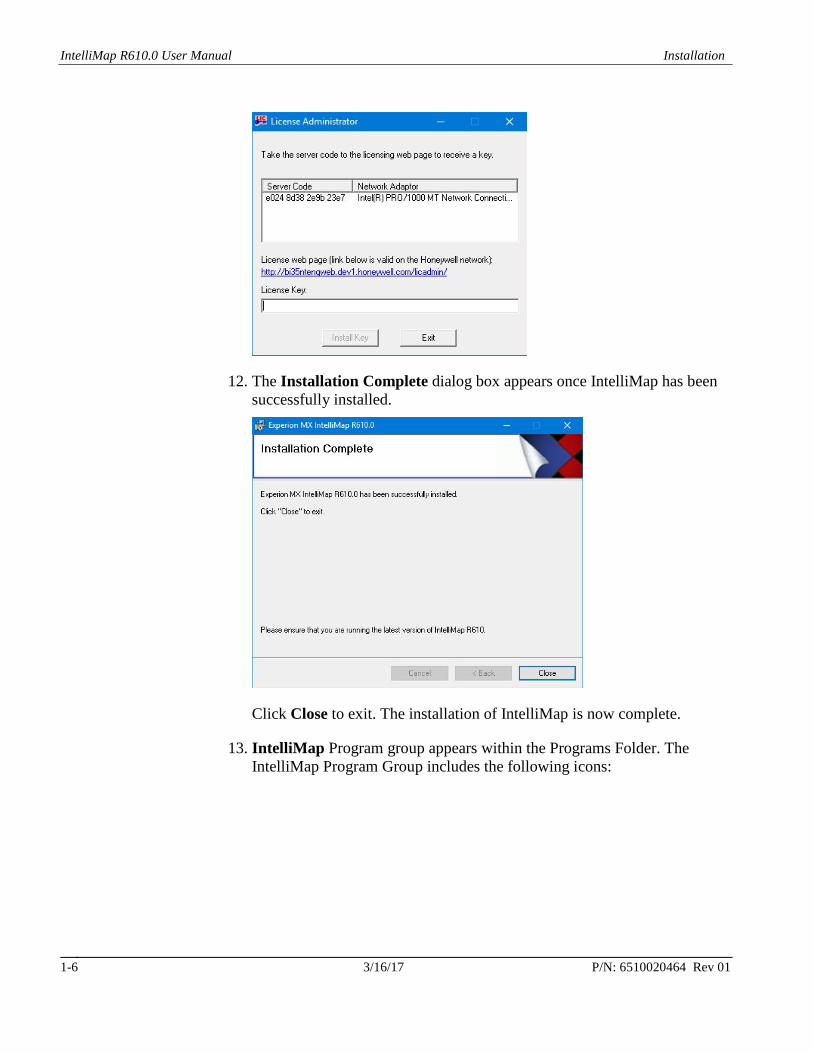
11. The License Adminstrator dialog box appears. Enter a permanent License Key or use a temporary RAE License.
To obtain a permanent RAE license, refer to Experion MX Real-Time Application Environment (RAE) R700.1 for Experion PKS R500.1 Release and Installation Notes (p/n 6510020594). To obtain a temporary RAE License, enter the word results into the license key field and click Install Key. Click OK, then click Exit. A temporary license key may be used for up to five days.
IntelliMap R610.0 User Manual Installation
3/16/17 P/N: 6510020464 Rev 01 1-6
12. The Installation Complete dialog box appears once IntelliMap has been successfully installed.
Click Close to exit. The installation of IntelliMap is now complete.
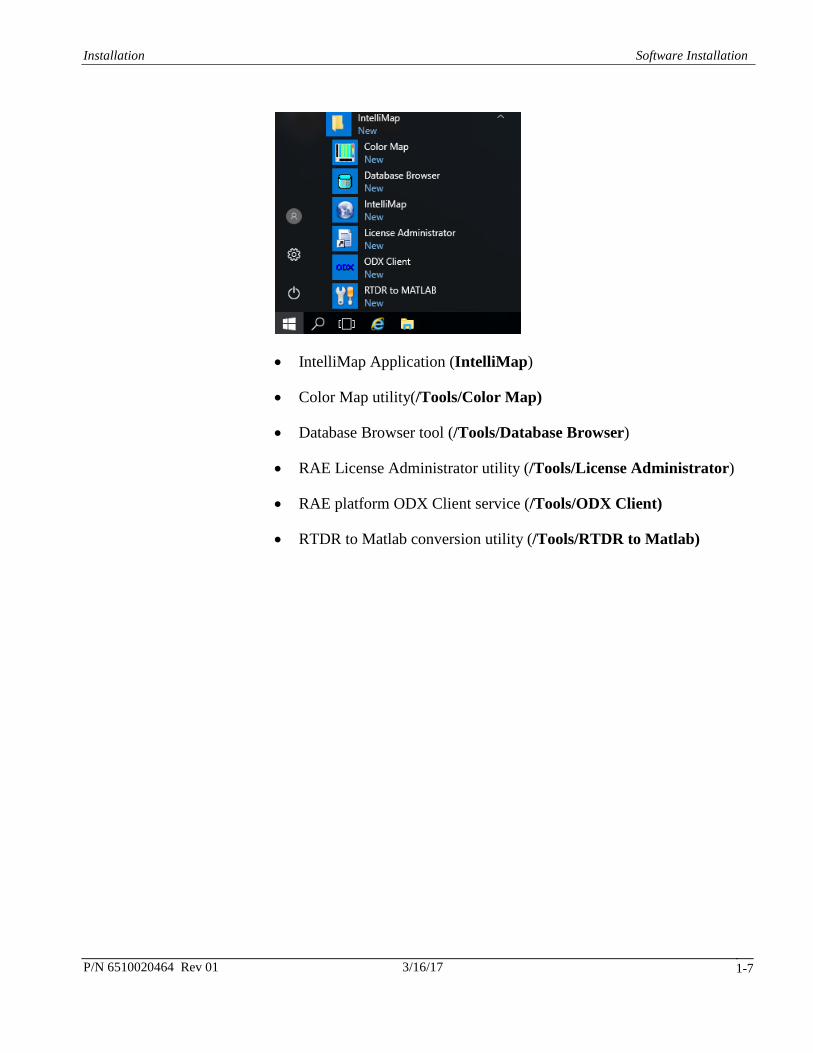
13. IntelliMap Program group appears within the Programs Folder. The IntelliMap Program Group includes the following icons:
Installation Software Installation
P/N 6510020464 Rev 01 3/16/17 1-7
• IntelliMap Application (IntelliMap)
• Color Map utility(/Tools/Color Map)
• Database Browser tool (/Tools/Database Browser)
• RAE License Administrator utility (/Tools/License Administrator)
• RAE platform ODX Client service (/Tools/ODX Client)
• RTDR to Matlab conversion utility (/Tools/RTDR to Matlab)


P/N 6510020464 Rev 01 3/16/17 2-1
2. Startup
This chapter describes the IntelliMap application startup utility.
2.1. Before Starting the Application Before starting IntelliMap for the first time, confirm that a valid network connection exists between the IntelliMap station and Experion MX QCS or Experion MX CDOpen server. Make sure that the proper host name is entered in the Hosts file in the C:\Windows\system32\drivers\etc\ directory. Use a text editor such as Notepad to open this file. Check the contents of the host file for an entry of the Experion MX system’s host name and its associated IP Address. The host name MUST be exactly the same as the one entered in the IP Address/Host Name section of the IntelliMap Startup utility.
e.g. 164.178.59.119 host
If the host entry is not found in the Hosts file, type one in and save the file.
Only a user with Windows Administrator privileges can modify the Hosts file.
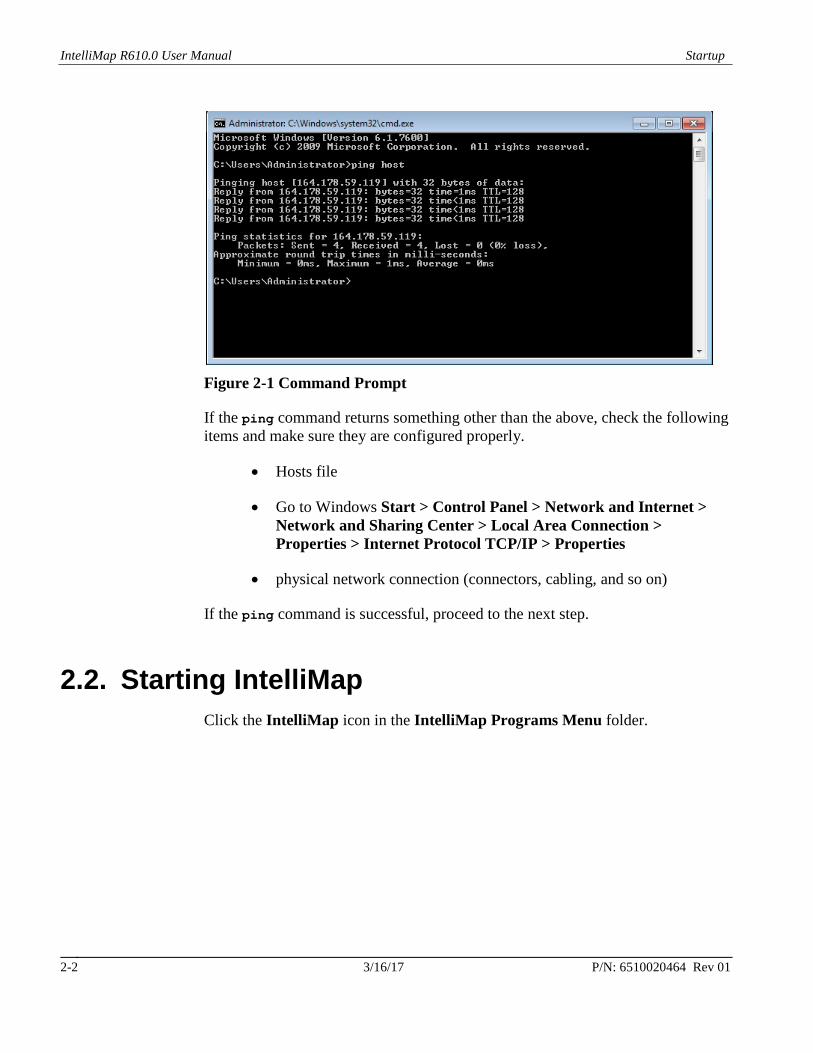
To test whether there is valid network connection between the IntelliMap station and the QCS Host station, open a command prompt by clicking the Command Prompt folder in the Programs menu. At the command prompt, issue the command:
ping host
The response to the command resembles the following if a valid network connection exists between the IntelliMap station and the QCS Host station.
IntelliMap R610.0 User Manual Startup
3/16/17 P/N: 6510020464 Rev 01 2-2
Figure 2-1 Command Prompt
If the ping command returns something other than the above, check the following items and make sure they are configured properly.
• Hosts file
• Go to Windows Start > Control Panel > Network and Internet > Network and Sharing Center > Local Area Connection > Properties > Internet Protocol TCP/IP > Properties
• physical network connection (connectors, cabling, and so on)
If the ping command is successful, proceed to the next step.
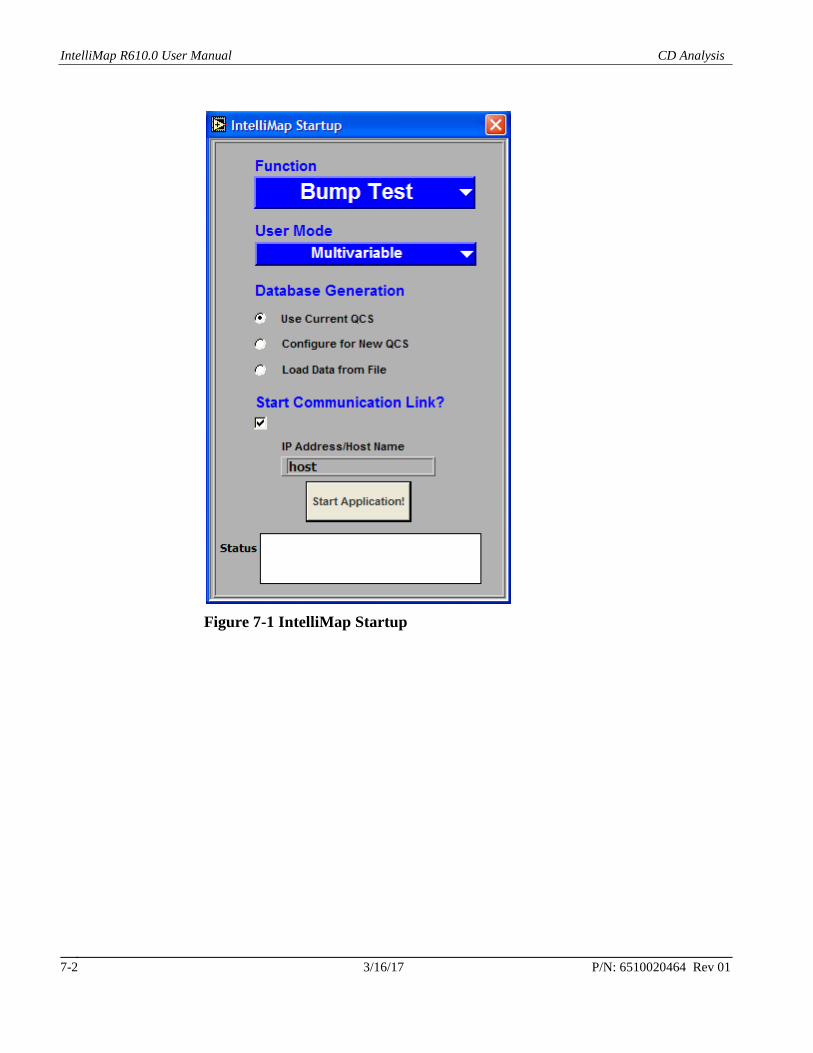
2.2. Starting IntelliMap Click the IntelliMap icon in the IntelliMap Programs Menu folder.

Startup Starting IntelliMap
P/N 6510020464 Rev 01 3/16/17 2-3
Figure 2-2 appears:
Figure 2-2 IntelliMap Startup
From the Function pull-down menu select one of these three options:
• Bump Test to perform a complete bump test, process model identification and traditional controller tuning session, or
• Multivariable Tuner to perform a multivariable controller tuning session, or
• CD Analysis to perform a data analysis session for performance evaluation
From the User Mode pull-down menu select one of these three options:
• Traditional mode is only available when the Bump Test option is selected and allows you to perform a bump test, identify the process model and tune the traditional controller that is running under the current (active) control scenario. Traditional mode is best suited for commissioning and maintaining traditional control for systems that are configured with default (Traditional CD Control) scenario only.
• Multivariable mode allows you to perform a bump test, identify the multivariable process model and tune the traditional controller that is
IntelliMap R610.0 User Manual Startup
3/16/17 P/N: 6510020464 Rev 01 2-4
associated with the bumped actuator for all configured control scenarios. Multivariable mode is the best choice for commissioning and maintaining both traditional and multivariable controls on a scenario-by-scenario basis.
• Expert mode is only available when the Bump Test or Multivariable Tuner options are selected and provides you with the ability to evaluate new traditional controller configurations or the ability to explicitly change the process model used by the Multivariable Tuner . The Expert mode is dedicated to the advanced user interested in exploring traditional controller configurations or process models other than those already configured in the CD control system.
From the Database Generation list select one of these three options:
• Use Current QCS to connect to a database configured in a previous session. This option preserves all the data stored in the database by a previous application session.
• Configure for New QCS to automatically build a database based on the configuration information provided by the QCS. This option is used when connecting for the first time to the QCS and requires the Start Communication Link? option checked.
• Load Data from File to generate a database based on a data file previously saved from IntelliMap.
In the IP Address/Host Name entry field enter either the IP Address (e.g. 164.178.59.119), Host Name as defined in the Hosts file (e.g. host) or the computer network name (e.g. qcs1234).
Press Start Application! to launch the selected application. The application startup status is shown in the Status indicator field.
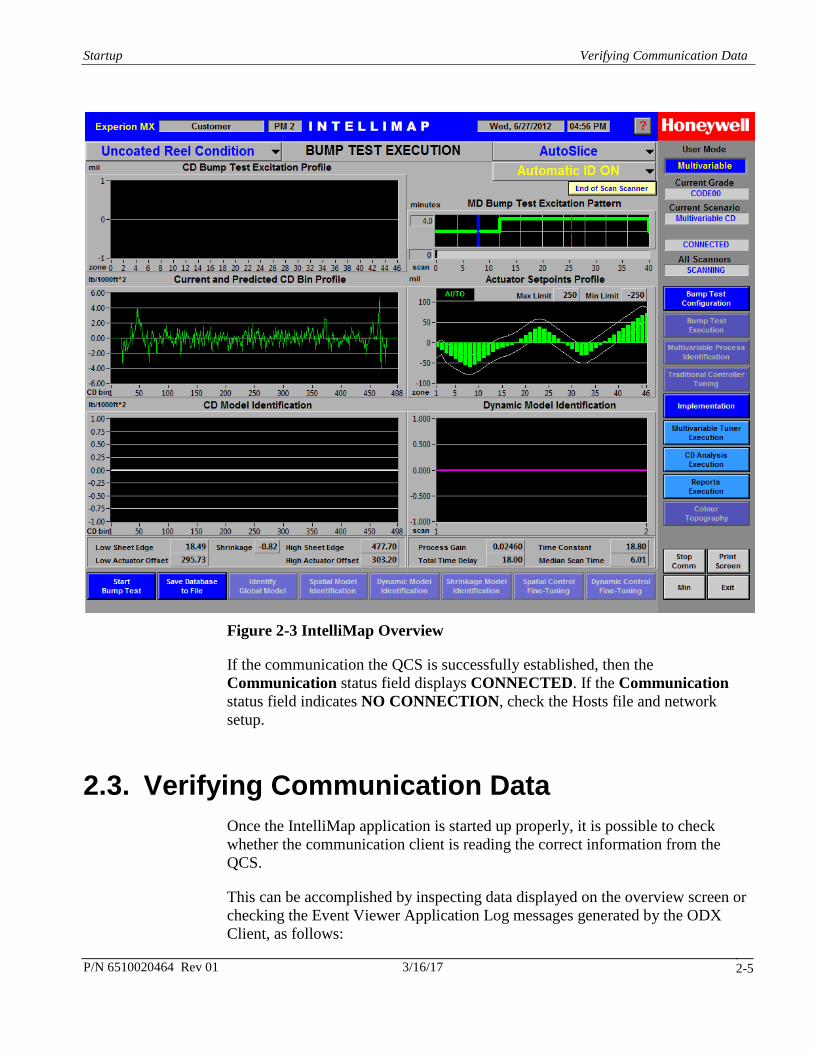
When IntelliMap application finishes loading, the IntelliMap Overview screen appears as shown in Figure 2-3.
Startup Verifying Communication Data
P/N 6510020464 Rev 01 3/16/17 2-5
Figure 2-3 IntelliMap Overview
If the communication the QCS is successfully established, then the Communication status field displays CONNECTED. If the Communication status field indicates NO CONNECTION, check the Hosts file and network setup.
2.3. Verifying Communication Data Once the IntelliMap application is started up properly, it is possible to check whether the communication client is reading the correct information from the QCS.
This can be accomplished by inspecting data displayed on the overview screen or checking the Event Viewer Application Log messages generated by the ODX Client, as follows:

IntelliMap R610.0 User Manual Startup
3/16/17 P/N: 6510020464 Rev 01 2-6
Go to Start > Control Panel > System and Security > Administrative Tools > Event Viewer > Windows Logs > Application
On the Bump Test Execution Screen, the CD bin measurement profile with the average removed are displayed on the Current and Predicted CD Bin Profile graph. Likewise, the actuator setpoints are displayed on the Actuator Setpoints Profile graph along with the current actuator mode (MANUAL, AUTO, or CASCADE).
Using the Actuator and Measurement selectors, verify that all actuator and measurement profiles are read correctly from the QCS.
The measurement profiles are only read from the QCS at the end of a scan. Therefore, if the scanner is not scanning initially, there is no profile on the Current and Predicted CD Bin Profile graph.

P/N 6510020464 Rev 01 3/16/17 3-1
3. Bump Test, Alignment and Model Identification
This chapter details the activities required to perform a bump test, calculate alignment and identify the CD process model.
This chapter assumes that you have already installed and started IntelliMap.
There are two main steps to be followed in a typical alignment and model identification session required to align and tune your CD control system:
• Configuring a Bump Test: This includes setting up a bump test pattern.
• Executing a Bump Test: to initiate a bump test, then to calculate the alignment and to identify process model parameters - these operations are each executed with single command buttons.
These two steps are accessed through the vertical navigation buttons labeled as Bump Test Configuration and Bump Test Execution that are available on the right hand-side of the IntelliMap Overview screen (see Figure 2-3 ) .
3.1. Configuring a Bump Test The first step in aligning and setting the correct spatial and dynamic model into your CD control system is to configure a sensible bump test that provides you with data from which you can identify a complete CD process model (alignment, shrinkage profile, spatial and dynamic model).
On the Vertical Panel at the right hand side of the overview screen, press Bump Test Configuration. This opens a new screen, shown in Figure 3-1, from which a bump test may be set up.

IntelliMap R610.0 User Manual Bump Test, Alignment and Model Identification
3/16/17 P/N: 6510020464 Rev 01 3-2
Figure 3-1 Bump Test Configuration
1. Select an Actuator to bump by moving the yellow cross-hair cursor in the CD Bump Excitation Profile.
2. Enter a value in the Amplitude to Apply box.
3. Press Apply New Bump. This creates a preview of the actuator bump in the CD Bump Excitation Profile.
4. Check the predicted effect (in white) of the bumped actuator in the Current and Predicted CD Bin Profiles plot at the top of the screen. As a general rule, you get better results with large bumps. This prediction is based on the current tuning read from the CD controller. If the current tuning is far from accurate (for example at commissioning), then this prediction also isn’t accurate. In the Multivariable or Expert modes you are able to use the Measurement profile selector to see the predicted effect of the selected Actuator beam on multiple sheet properties.

Bump Test, Alignment and Model Identification Bump Test, Alignment and Model Identification
P/N 6510020464 Rev 01 3/16/17 3-3
5. More bumps may be generated one-at-a-time in this fashion, or you can automatically generate more bumps. To automatically generate bumps, use the 2-Sided option.
6. The cross-hair cursor must be on a previously defined bump. Then press Auto Generate to generate a family of actuators to bump. The CD Bump Interval is defaulted at 10, and can be specified as desired.
7. For low gain or difficult to identify CD processes it is recommended to explore the advanced bump option for generating CD sinusoidal bump. Press Generate Sinusoidal Bumps to bring up a dialog box that allows you to specify the Amplitude, Period, Phase, Number of Cycles and the Offset of a sinusoidal CD bump profile.
8. You can evaluate the effect of the proposed bumps by again inspecting the Current and Predicted CD Bin Profiles plot.
9. The duration of the bump test is mainly controlled through setting the Baseline and Rise Time bump test timing parameters. You set the Rise Time so the process reaches steady state during the bump test. If you are unsure of the time required, then configure a large number of scans.
10. In addition to allowing you to anticipate the effects of a bump test on various measurement profiles, for multiple scanner systems the Measurement selector allows you to choose the scanner that defines the scanning intervals to determine duration of bump test timing parameters. In Multivariable and Expert modes this defaults to the slower scanner frame. The total estimated bump test duration is indicated in minutes in the indicator to the left of the MD Bump Test Excitation Pattern graph.
11. You can set the MD Bump Test Excitation Pattern to be I, II, III, or IV, in the order of increasing complexity. The more complicated MD bump pattern provides you with better model identification, but the bump test takes longer to run.
12. Once you are satisfied with the appearance of the Bump Test, then press Bump Test Execution on the Vertical Panel to return to Bump Test Execution screen where you launch and monitor your bump test.
3.2. Executing a Bump Test This section assumes that you have successfully configured a Bump Test (see Section 3.1). The steps to follow are performed from the Bump Test Execution screen shown in Figure 3-2.
IntelliMap R610.0 User Manual Bump Test, Alignment and Model Identification
3/16/17 P/N: 6510020464 Rev 01 3-4
Figure 3-2 Bump Test Execution
1. Take your CD Control system off control by putting the actuators into AUTO mode. This is done at the operator station (not from IntelliMap). Wait a few minutes for the process to settle.
2. Press Start Bump Test in the lower leftmost corner of the screen.
3. When the Start Bump Test? dialog box appears, click OK.
4. Wait for the Bump Test to finish. Its progress may be monitored by the red progress bar located under the MD Bump Test Excitation Pattern in the upper-right portion of your screen.
5. The Bump Test may be stopped at any time by pressing Stop Bump Test in the lower leftmost corner of the screen. However, if stopped too early as

Bump Test, Alignment and Model Identification Bump Test, Alignment and Model Identification
P/N 6510020464 Rev 01 3/16/17 3-5
indicated by the red vertical bar shown in the MD Bump Test Excitation Pattern graph, the alignment calculation and model identification algorithms doesn’t run.
6. Once the Bump Test has completed, you may put the CD Control system back into closed-loop control by putting the actuators back into CASCADE mode. This is done at the operator station (not from IntelliMap).
7. Calculate the alignment and identify the process model parameters. This happens automatically if the Automatic ID ON switch (upper right corner) was set.
8. You can otherwise calculate the alignment and identify the model by pressing Identify Global Model at the bottom of the screen.
9. Evaluate the success of the process model identification by inspecting the lower two plots CD Model Identification and Dynamic Model Identification. The smooth white lines indicate the identified model, and the more jagged pink lines indicate the measured process response. A successful model has the modeled response roughly matching the measured response. IntelliMap indicates on the upper-side of the screen one of the following two messages:
Identification OK – indicates that a valid model has been calculated
No Interaction – indicates that bumped actuator has no effect on the selected sheet property
10. In Multivariable or Expert mode you have the ability to use the Measurement selector available in the upper leftmost corner of your screen to see the model identification results for all sheet properties.
11. If you do not agree with the appearance of the IntelliMap model, then you may modify the model using the advanced identification options:
Spatial Model Identification allows modification of the alignment and CD response shape.
Dynamic Model Identification allows modification of the CD time response (gain, rise time, dead time and so on)
Shrinkage Model Identification allows modification of the alignment to accommodate nonlinear sheet shrinkage.
12. In addition to the advanced identification options, in the Multivariable or Expert modes you have access to an advanced screen that provides an

IntelliMap R610.0 User Manual Bump Test, Alignment and Model Identification
3/16/17 P/N: 6510020464 Rev 01 3-6
overview of the multivariable process identification results. Press the Multivariable Process Identification available in the Vertical Panel. The Multivariable Process Identification presents three graphs indicating the effect of the selected Actuator beam on three sheet properties at a time. For each scanner frame there is always one Measurement profile labeled as the Primary Measurement. The Primary Measurement is automatically selected by IntelliMap as being the sheet property that is most affected by the selected Actuator beam and consequently it is further used to determine the alignment relative to the scanner frames that belongs to.
13. The Multivariable Process Identification screen provides you with the ability to ignore the IntelliMap calculated model that relates an actuator beam to any non-primary measurement profile. This is equivalent to assuming that Gain of the identified model is equal to 0.0. In addition to this, in Expert mode you have the ability to enable a model that IntelliMap has determined as having No Interaction.
14. When you are satisfied with the appearance of the alignment and process model and you would like to tune your traditional controller, press Traditional Controller Tuning, available on the Vertical Panel located below the Process Model Identification button. If you are only interested in updating your Alignment or tune your Multivariable controller press Implementation located on the main panel on the Vertical Panel and proceed with instructions in Chapter 5, Implementing Alignment, Model, and Traditional Tuning Parameters .
3.3. Saving a Bump Test This section assumes that you have successfully executed a Bump Test (see Section 3.12). The steps to follow are performed from the Bump Test Execution screen shown in Figure 3-23.
1. When you are satisfied with the appearance of the bump test results, press Save Database to File button at the bottom of the Bump Test Execution screen shown above in Figure 3-2.
2. When the Please specify where to save the data file dialog box appears, click OK.

P/N 6510020464 Rev 01 3/16/17 4-1
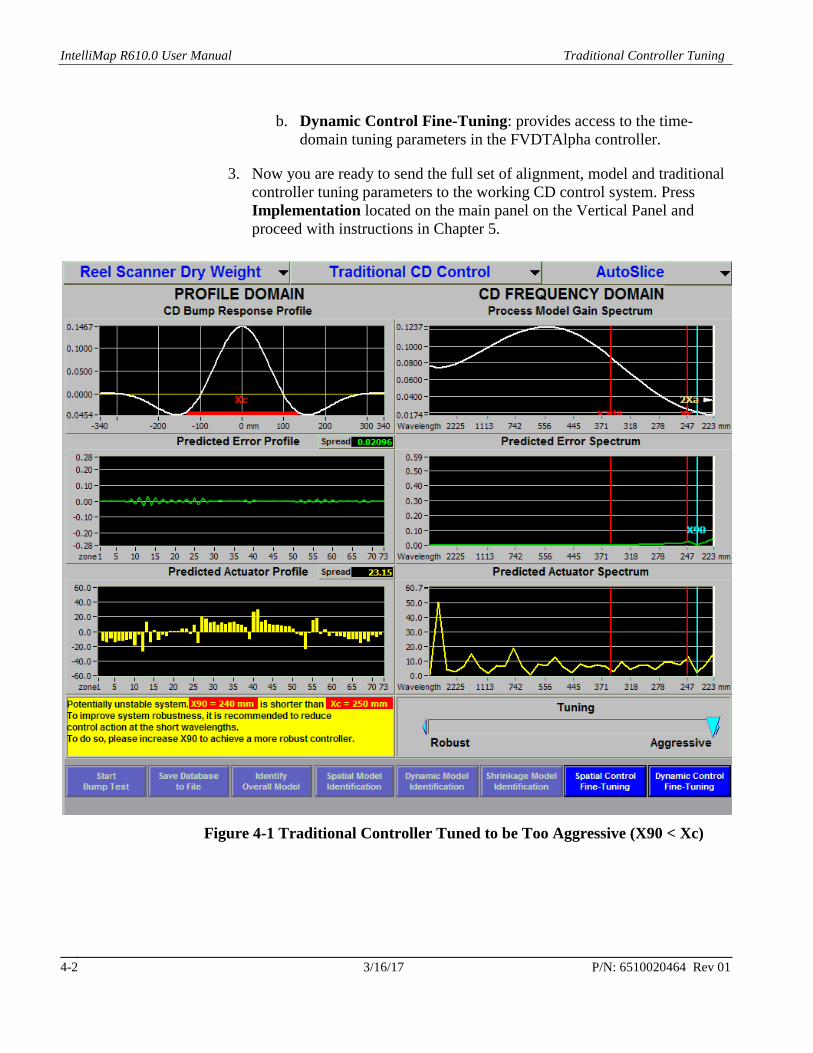
4. Traditional Controller Tuning
This chapter assumes that you have completed a Bump Test, calculated the Alignment and identified the Process Model as described in the previous chapter.
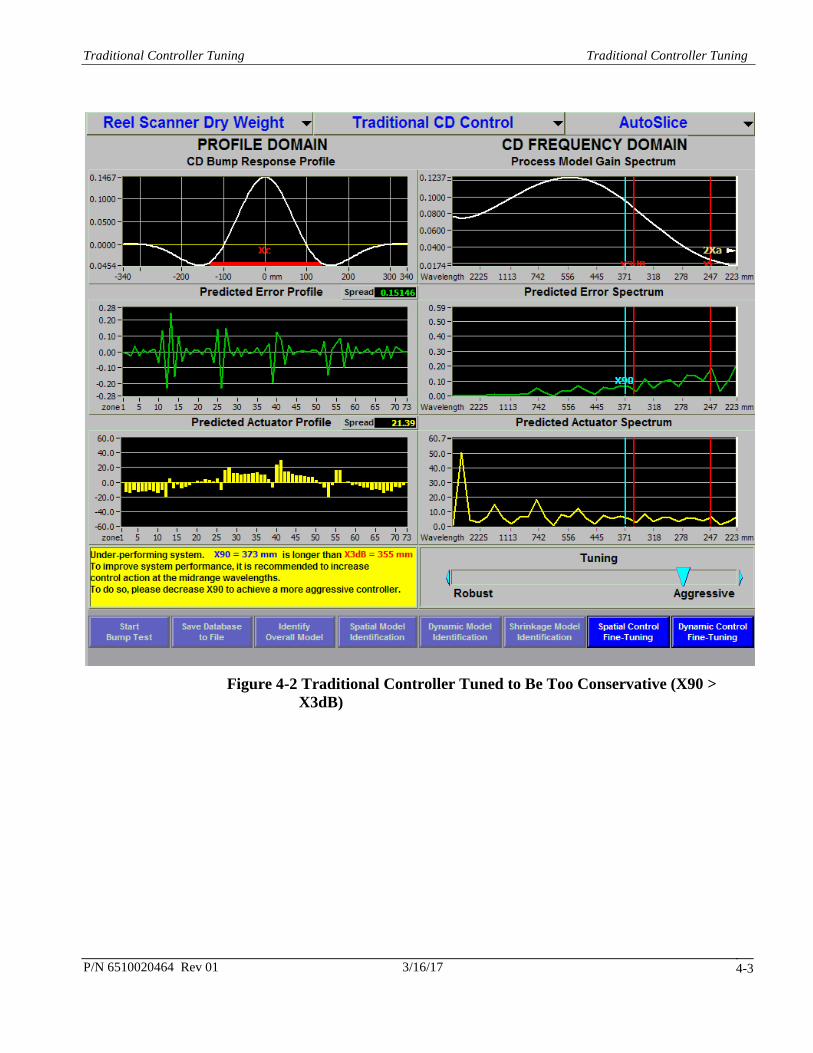
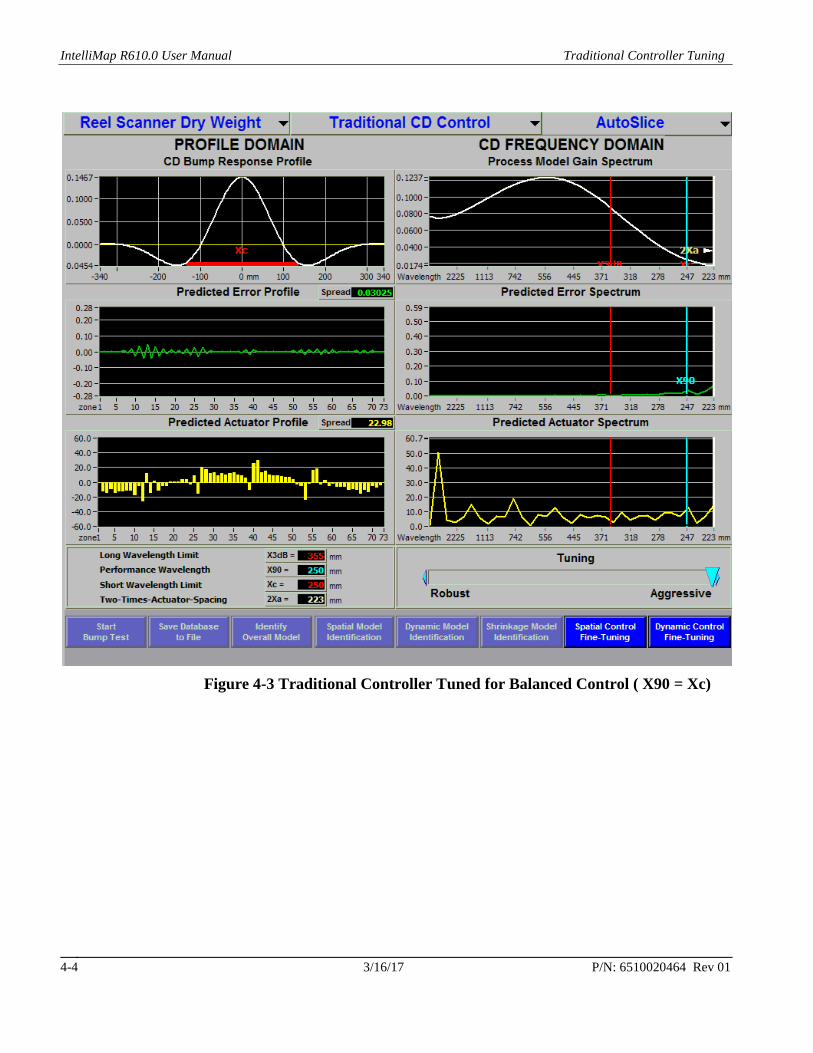
If you have identified a process model and opened the Traditional Controller Tuning screen, then IntelliMap has automatically computed a set of tuning parameters for the traditional controller that are designed to result in a balance between robust control and aggressive control. In general, robust control provides a conservative mode of operation for your traditional control system, and remains stable in spite of changes in the process. On the other hand, an aggressively tuned traditional controller works very hard to remove as much variation as possible from the paper sheet, and chase variability at the short CD wavelengths. Figure 4-1, Figure 4-2, and Figure 4-3 illustrate the three cases.
Sliding the slider bar towards the robust end of the scale results in a smoother Predicted Actuator Profile and less actuator activity at the mid-range wavelengths in the Predicted Actuator Spectrum. This also results in a more jagged Predicted Error Profile and more variability at the mid-range wavelengths in the Predicted Error Spectrum.
1. Slide the slider bar back and forth until you are satisfied with the appearance of the Predicted Error Profile and Predicted Actuator Profile. You can also accept the IntelliMap balanced tuning that has been generated automatically. In Multivariable mode you can use the Scenario selector available on the upper-side of the screen to tune all control scenarios. In the Expert mode, you have the ability to access the Measurement selector and explore new traditional control scenario configurations.
2. (Optional) If you would like access to more tuning parameters, or more information, you can open one of the advanced tuning screens:
a. Spatial Control Fine-Tuning: provides access to tuning parameters such as Anti Alias, Decoupling, and Actuator Setpoint Smoothing.
IntelliMap R610.0 User Manual Traditional Controller Tuning
3/16/17 P/N: 6510020464 Rev 01 4-2
b. Dynamic Control Fine-Tuning: provides access to the time-domain tuning parameters in the FVDTAlpha controller.
3. Now you are ready to send the full set of alignment, model and traditional controller tuning parameters to the working CD control system. Press Implementation located on the main panel on the Vertical Panel and proceed with instructions in Chapter 5.
Figure 4-1 Traditional Controller Tuned to be Too Aggressive (X90 < Xc)
Traditional Controller Tuning Traditional Controller Tuning
P/N 6510020464 Rev 01 3/16/17 4-3
Figure 4-2 Traditional Controller Tuned to Be Too Conservative (X90 >
X3dB)
IntelliMap R610.0 User Manual Traditional Controller Tuning
3/16/17 P/N: 6510020464 Rev 01 4-4
Figure 4-3 Traditional Controller Tuned for Balanced Control ( X90 = Xc)

P/N 6510020464 Rev 01 3/16/17 5-1
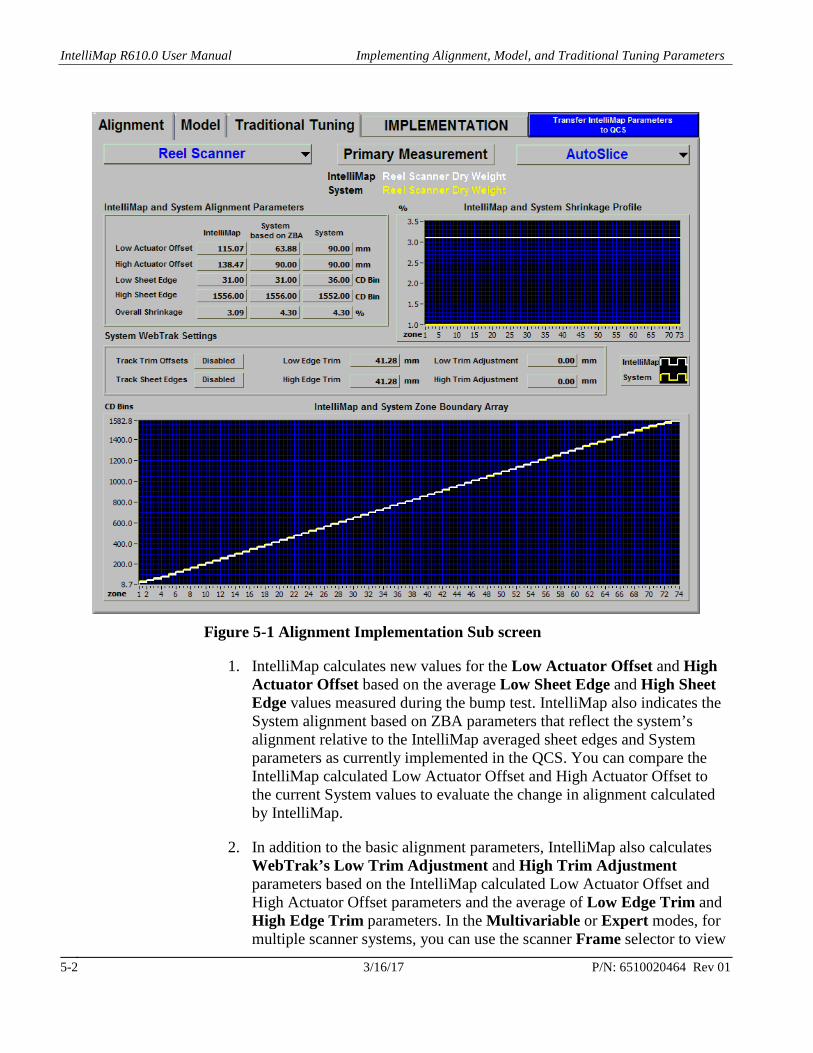
5. Implementing Alignment, Model, and Traditional Tuning Parameters
This chapter assumes that you have completed a Bump Test, calculated the Alignment, identified the Process Model, and tuned the Traditional Controller as described in the previous chapters. IntelliMap transfers the Low Actuator Offset, High Actuator Offset, Low Sheet Edge, High Sheet Edge, Shrinkage Profile, and Zone Boundary and updates WebTrak’s Low Trim Adjustment and High Trim Adjustment. As indicated in Figure 5-1, the Alignment Implementation sub screen presents both IntelliMap and System Alignment parameters for comparison.
IntelliMap R610.0 User Manual Implementing Alignment, Model, and Traditional Tuning Parameters
3/16/17 P/N: 6510020464 Rev 01 5-2
Figure 5-1 Alignment Implementation Sub screen
1. IntelliMap calculates new values for the Low Actuator Offset and High Actuator Offset based on the average Low Sheet Edge and High Sheet Edge values measured during the bump test. IntelliMap also indicates the System alignment based on ZBA parameters that reflect the system’s alignment relative to the IntelliMap averaged sheet edges and System parameters as currently implemented in the QCS. You can compare the IntelliMap calculated Low Actuator Offset and High Actuator Offset to the current System values to evaluate the change in alignment calculated by IntelliMap.
2. In addition to the basic alignment parameters, IntelliMap also calculates WebTrak’s Low Trim Adjustment and High Trim Adjustment parameters based on the IntelliMap calculated Low Actuator Offset and High Actuator Offset parameters and the average of Low Edge Trim and High Edge Trim parameters. In the Multivariable or Expert modes, for multiple scanner systems, you can use the scanner Frame selector to view
Implementing Alignment, Model, and Traditional Tuning Parameters Saving a Bump Test
P/N 6510020464 Rev 01 3/16/17 5-3
the Alignment parameters of the selected Actuator beam for all downstream scanner frames. You can also see IntelliMap’s calculated Primary Measurement for each scanner Frame.
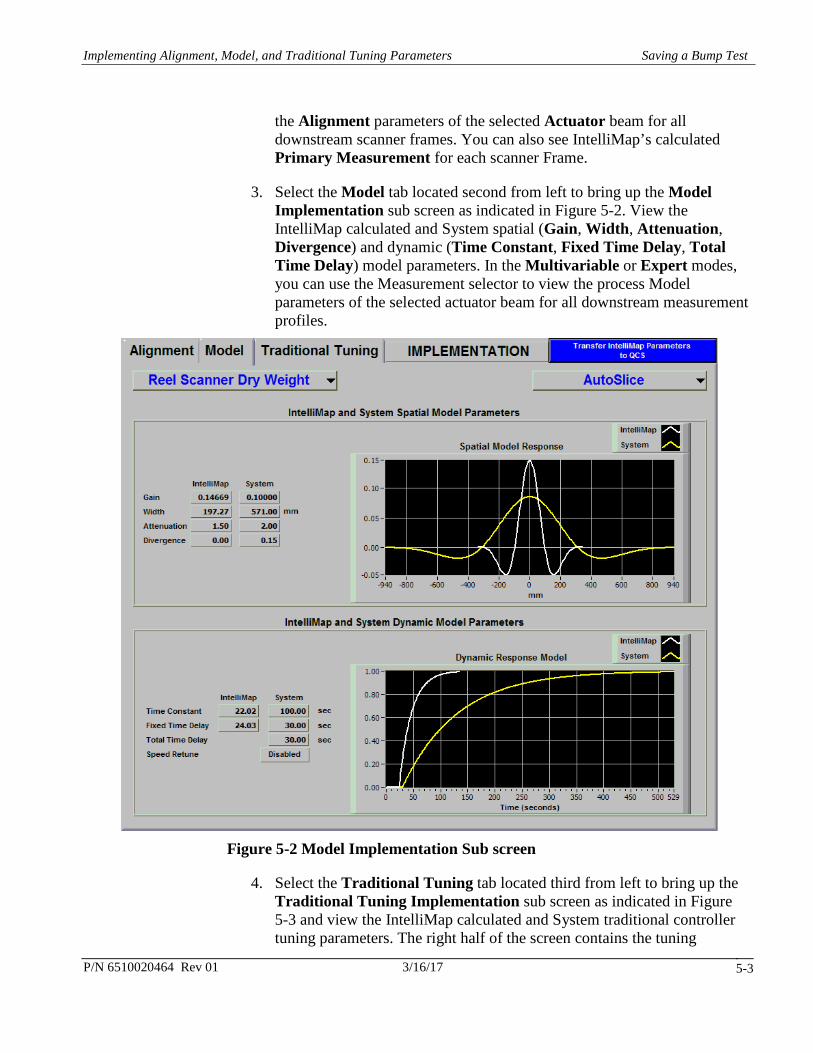
3. Select the Model tab located second from left to bring up the Model Implementation sub screen as indicated in Figure 5-2. View the IntelliMap calculated and System spatial (Gain, Width, Attenuation, Divergence) and dynamic (Time Constant, Fixed Time Delay, Total Time Delay) model parameters. In the Multivariable or Expert modes, you can use the Measurement selector to view the process Model parameters of the selected actuator beam for all downstream measurement profiles.
Figure 5-2 Model Implementation Sub screen
4. Select the Traditional Tuning tab located third from left to bring up the Traditional Tuning Implementation sub screen as indicated in Figure 5-3 and view the IntelliMap calculated and System traditional controller tuning parameters. The right half of the screen contains the tuning
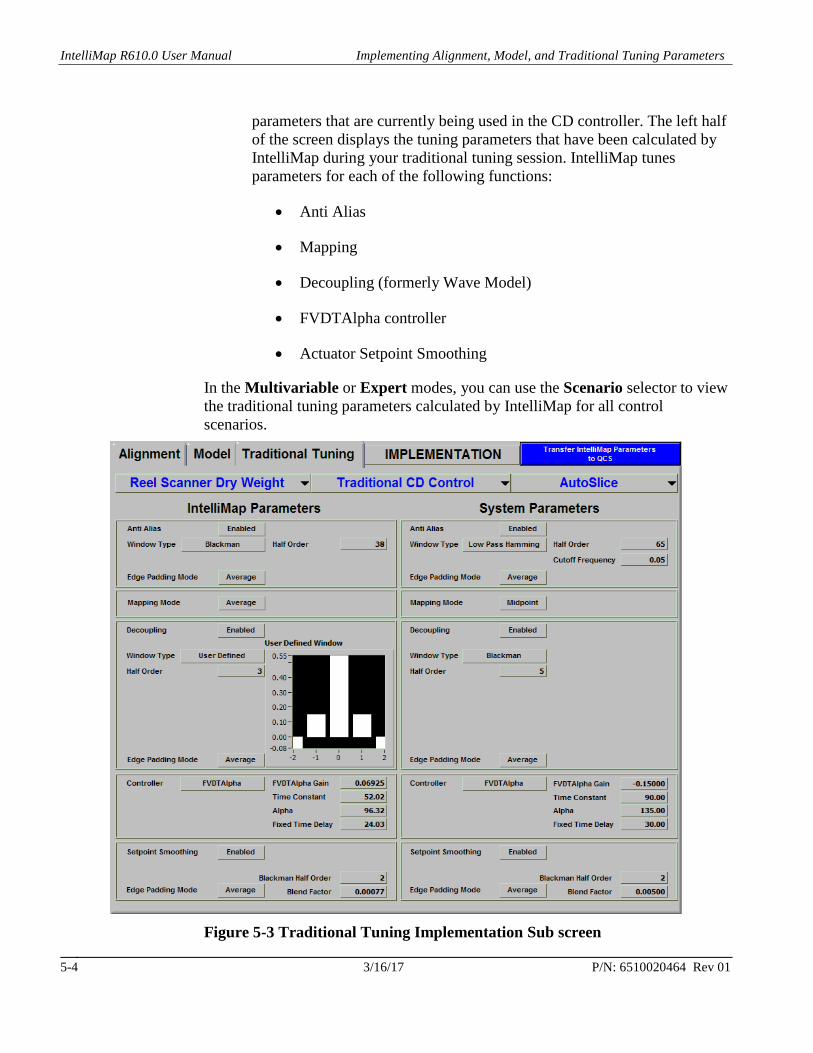
IntelliMap R610.0 User Manual Implementing Alignment, Model, and Traditional Tuning Parameters
3/16/17 P/N: 6510020464 Rev 01 5-4
parameters that are currently being used in the CD controller. The left half of the screen displays the tuning parameters that have been calculated by IntelliMap during your traditional tuning session. IntelliMap tunes parameters for each of the following functions:
• Anti Alias
• Mapping
• Decoupling (formerly Wave Model)
• FVDTAlpha controller
• Actuator Setpoint Smoothing
In the Multivariable or Expert modes, you can use the Scenario selector to view the traditional tuning parameters calculated by IntelliMap for all control scenarios.
Figure 5-3 Traditional Tuning Implementation Sub screen
Implementing Alignment, Model, and Traditional Tuning Parameters Saving a Bump Test
P/N 6510020464 Rev 01 3/16/17 5-5
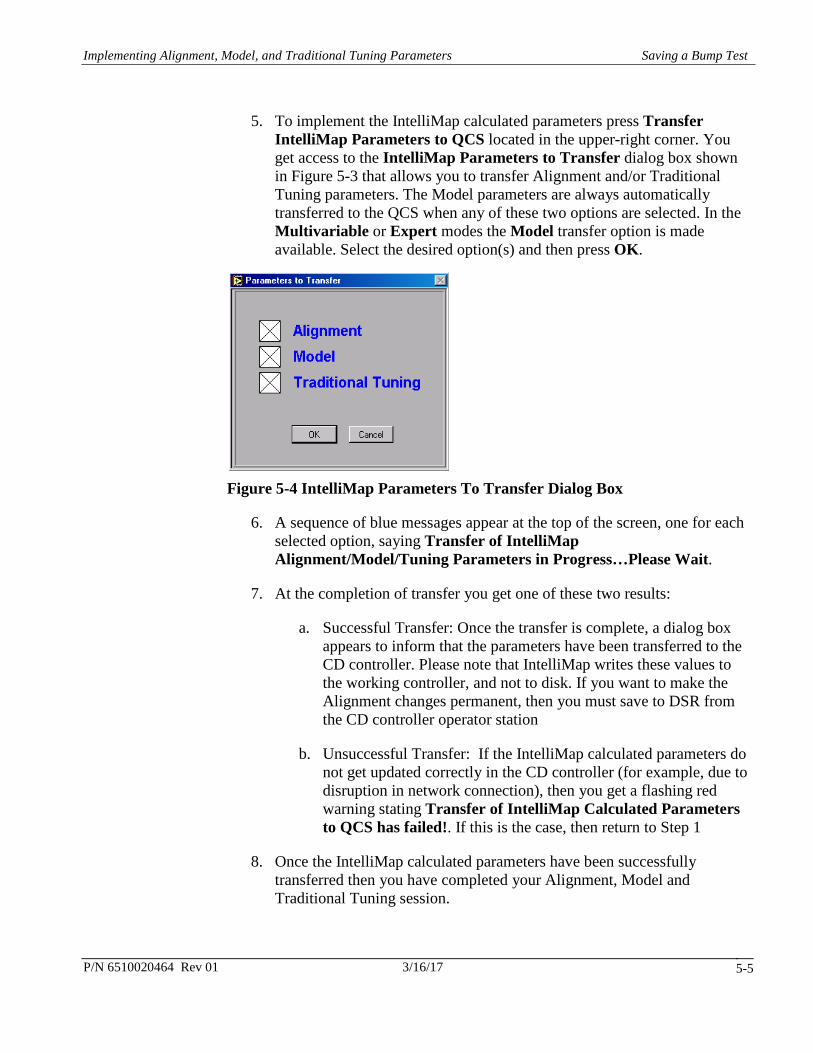
5. To implement the IntelliMap calculated parameters press Transfer IntelliMap Parameters to QCS located in the upper-right corner. You get access to the IntelliMap Parameters to Transfer dialog box shown in Figure 5-3 that allows you to transfer Alignment and/or Traditional Tuning parameters. The Model parameters are always automatically transferred to the QCS when any of these two options are selected. In the Multivariable or Expert modes the Model transfer option is made available. Select the desired option(s) and then press OK.
Figure 5-4 IntelliMap Parameters To Transfer Dialog Box
6. A sequence of blue messages appear at the top of the screen, one for each selected option, saying Transfer of IntelliMap Alignment/Model/Tuning Parameters in Progress…Please Wait.
7. At the completion of transfer you get one of these two results:
a. Successful Transfer: Once the transfer is complete, a dialog box appears to inform that the parameters have been transferred to the CD controller. Please note that IntelliMap writes these values to the working controller, and not to disk. If you want to make the Alignment changes permanent, then you must save to DSR from the CD controller operator station
b. Unsuccessful Transfer: If the IntelliMap calculated parameters do not get updated correctly in the CD controller (for example, due to disruption in network connection), then you get a flashing red warning stating Transfer of IntelliMap Calculated Parameters to QCS has failed!. If this is the case, then return to Step 1
8. Once the IntelliMap calculated parameters have been successfully transferred then you have completed your Alignment, Model and Traditional Tuning session.

IntelliMap R610.0 User Manual Implementing Alignment, Model, and Traditional Tuning Parameters
3/16/17 P/N: 6510020464 Rev 01 5-6
9. Once the alignment and traditional tuning parameters are transferred to the QCS successfully, you are ready to put the QCS in traditional control. Go to the CD Controls display on the QCS Server node and put the configured actuators in CASCADE mode.
10. If you are planning to tune your Multivariable controller press Multivariable Tuner Execution located on the main panel on the Vertical Panel underneath the Implementation button and proceed with instructions in Chapter 6, otherwise:
11. If you are planning to log data for evaluating your traditional CD controller performances then open the Bump Test Configuration screen and then proceed with instructions in Chapter 7 for setting a datalogging and analysis session.

P/N 6510020464 Rev 01 3/16/17 6-1
6. Multivariable Controller Tuning
This chapter assumes that you have completed a multivariable Bump Test, identified and implemented the multivariable Process Model, as described in the previous chapters. It also assumes that all control scenarios and cascade controls are configured in Experion MX CD Controls.
If you have identified all process models and launched the Multivariable Tuner for the first time, then IntelliMap has automatically calculated a set of multivariable tuning parameters for all multivariable control scenarios. The calculated set of tuning parameters is designed to apply equal emphasis among the controlled sheet properties, equal control contribution of CD actuator arrays, and a balanced approach between robust and aggressive control.
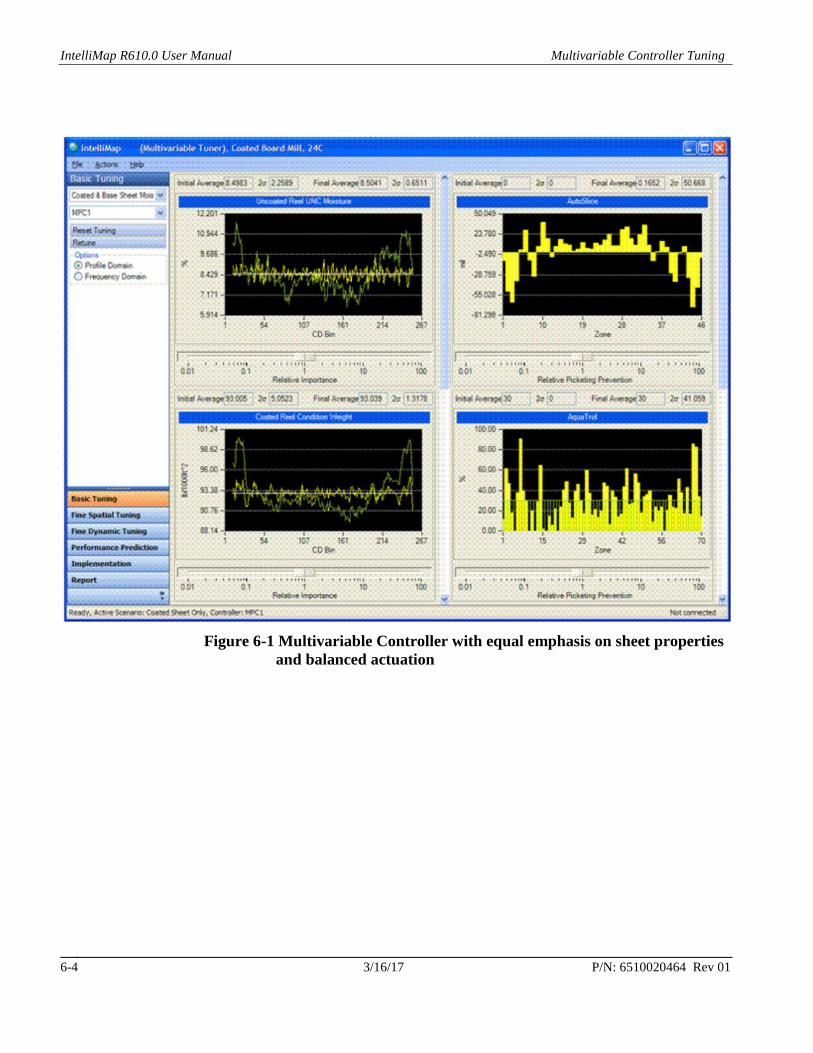
Figure 6-1 shows a balanced tuning of a CD multivariable controller for a coated board machine. Each controlled sheet property has its Relative Importance slider bar, and each actuator array has its Relative Picketing Prevention slider bar. Here relative means relative to other controlled properties or other actuator arrays.
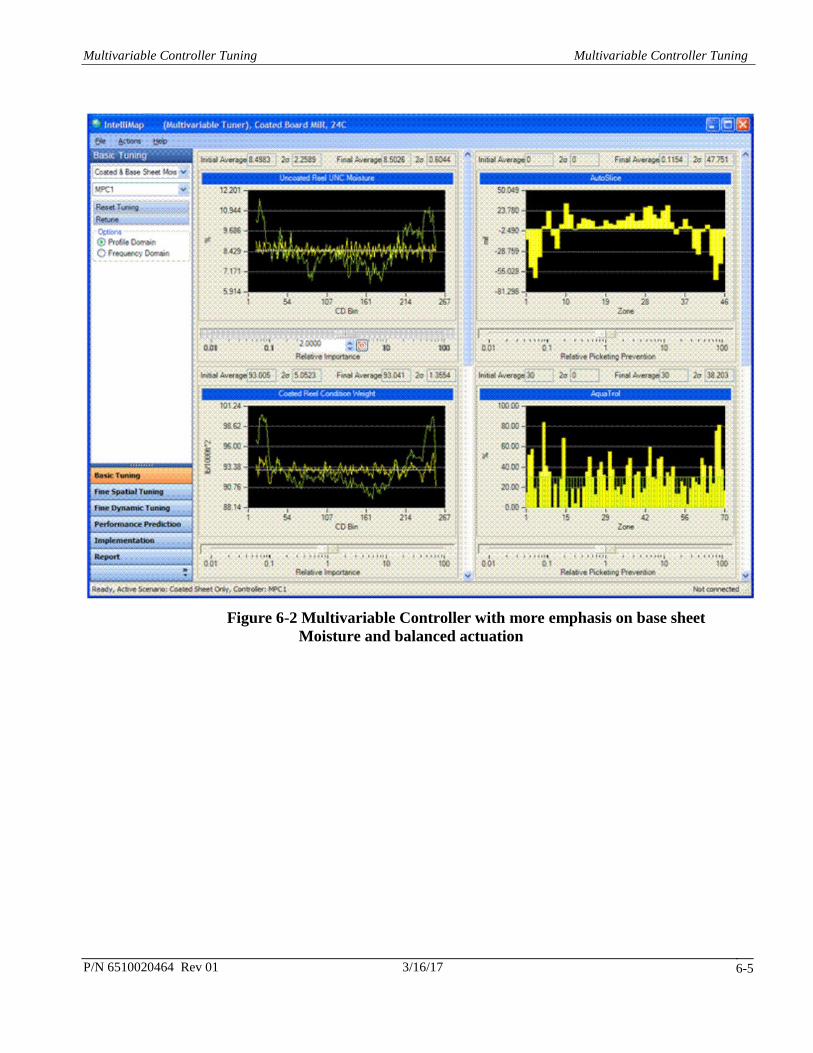
For example, if more emphasis is put on uncoated (base sheet) moisture (that is, sliding the Relative Importance slider bar of uncoated moisture to the right) then the CD multivariable controller will work harder to reduce the uncoated moisture 2-sigma spreads than coated sheet (conditioned) weight 2-sigma spreads. Figure 6-2 illustrates this case when the 2-sigma of uncoated moisture is reduced while 2-sigma of coated weight is increased.
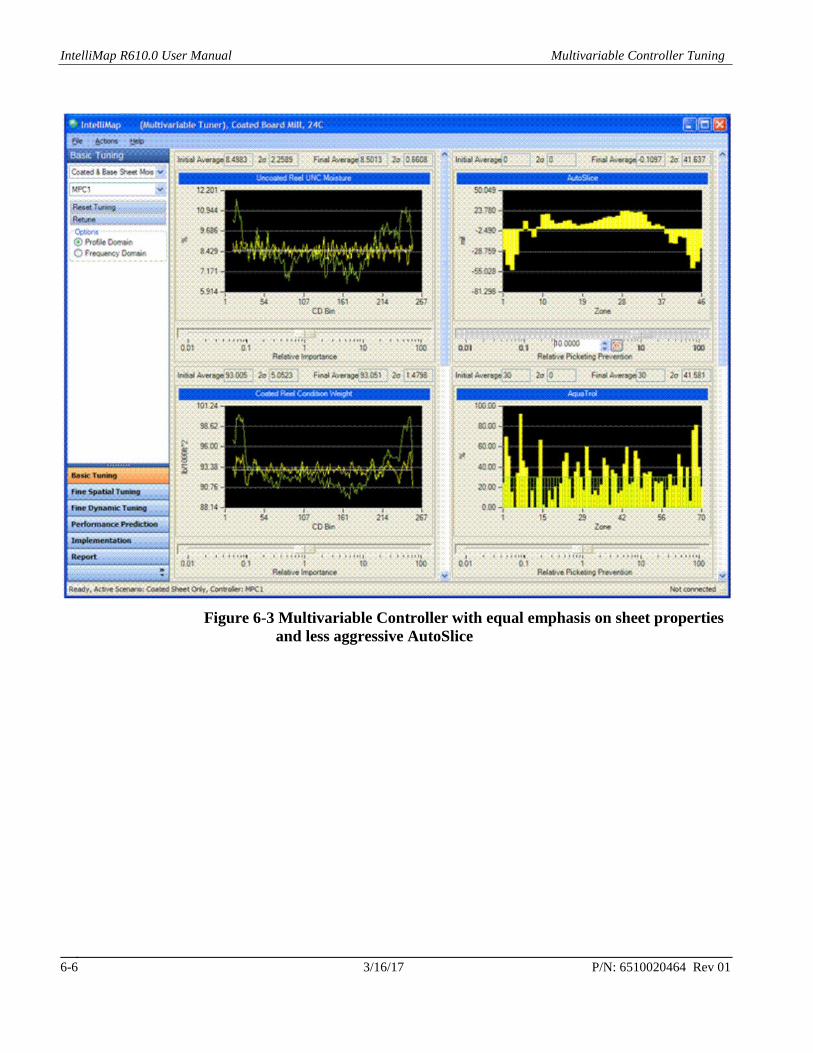
If we choose to let the AutoSlice work less aggressively, then we slide Relative Picketing Prevention slider bar to the right as shown in Figure 6-3.
In general, increasing the Relative Importance of a particular sheet property results in a smoother measurement profile and a more jagged setpoints profile of one or more actuator arrays, while increasing the Relative Picketing Prevention results in a smoother actuator setpoints profile and increased variability in one or more sheet properties .
IntelliMap R610.0 User Manual Multivariable Controller Tuning
3/16/17 P/N: 6510020464 Rev 01 6-2
Here is the summary of tuning the CD multivariable controller:
1. (Basic Tuning mode) Adjust the Relative Importance and Relative Picketing Prevention slider bars until you are satisfied with the appearance of the measurement profiles and actuator profiles (you may also tune the controller in the frequency domain by clicking the Frequency Domain option on the navigation panel). Or accept the IntelliMap balanced tuning that has been generated automatically.
2. (Optional) If you would like access to more tuning parameters, or more information, then you can open one of the advanced tuning screens (by clicking the corresponding screen name on the navigation panel):
a. Fine Spatial Tuning: provides access to spatial-domain fine-tuning sliders/knobs such as Spatial Robustness and Relative Energy Savings. You also can fine tune the controller using the Spatial Gain Function option.
b. Fine Dynamic Tuning: provides access to the time-domain fine-tuning sliders/knobs such as Recovery Speed and Relative Dynamic Robustness. You also can fine tune the controller using the Dynamic Gain Function option.
3. (Optional) You can obtain the summary of predicted performances by selecting Performance Prediction. This screen provides an overview of all of the initial and final profiles as well as some basic statistics. It is similar to the Actuator Overview and Measurement Overview screens available in Experion MX CD Controls and it can be used for comparing the predicted profiles with the actual ones.
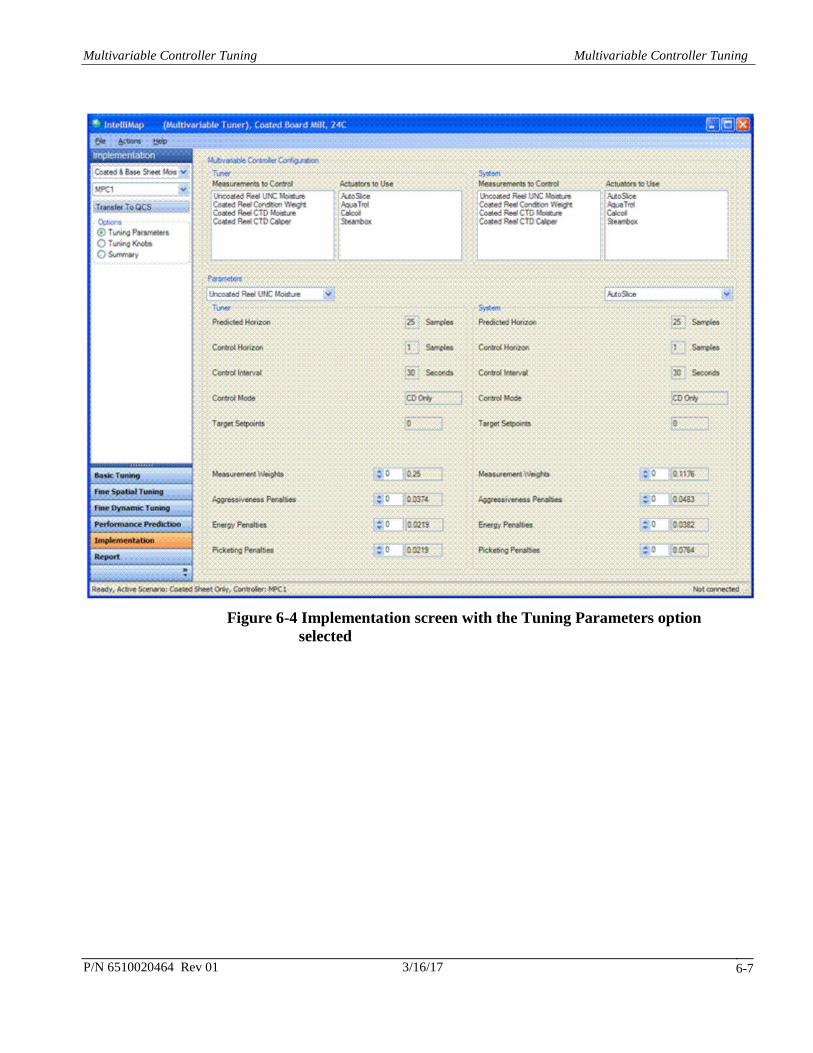
4. Select Implementation from the menu on the navigation. Now you are ready to transfer the full set of multivariable controller tuning parameters to the working CD control system. The left part of the screen shows the parameters on the tuner (IntelliMap) side and the right part shows the parameters on the system (Experion MX CD Controls) side as shown in Figure 6-4. To transfer the entire set of multivariable tuning parameters, press Transfer To QCS.
5. At the completion of transfer you get one of these two results:
a. Successful Transfer: Once the transfer is complete, a dialog box appears to inform that the parameters have been transferred to the multivariable CD controller. Please note that IntelliMap writes these values to the working controller, and not to disk. If you want to make the multivariable tuning changes permanent, then you must save to DSR from the Experion MX CD Controls station.

Multivariable Controller Tuning Multivariable Controller Tuning
P/N 6510020464 Rev 01 3/16/17 6-3
b. Unsuccessful Transfer: If the multivariable tuning parameters do not get updated correctly in the multivariable CD controller (for example, due to disruption in network connection), then you get a flashing red warning stating Transfer of IntelliMap Calculated Parameters to QCS has failed!. If this is the case, then you need to verify your network connection or inspect the multivariable CD controller status.
6. Once the multivariable tuning parameters are transferred to the QCS successfully, you are ready to put the QCS in multivariable control. Go to the CD Controls display on the QCS Server node and put CD actuators in CASCADE mode. Following a successful transfer a multivariable tuning report is automatically generated and available by pressing Report available in the navigation panel.
7. If you are planning to log data for evaluating your multivariable CD controller performances then select File, choose Exit and Run Bump Test, open the Bump Test Configuration screen, then proceed with instructions in CD Analysis.
If a set of multivariable tuning parameters has already been transferred into the QCS, then when a new connection is established IntelliMap will automatically retrieve the positions of the tuning sliders/knobs, otherwise all tuning sliders/knobs will be at default location, which is equal to 1 for all Relative Importance, Relative Picketing Prevention, and Relative Energy Savings, 10 for Spatial Robustness and 1.4 for the Recovery Speed.
IntelliMap R610.0 User Manual Multivariable Controller Tuning
3/16/17 P/N: 6510020464 Rev 01 6-4
Figure 6-1 Multivariable Controller with equal emphasis on sheet properties
and balanced actuation
Multivariable Controller Tuning Multivariable Controller Tuning
P/N 6510020464 Rev 01 3/16/17 6-5
Figure 6-2 Multivariable Controller with more emphasis on base sheet
Moisture and balanced actuation
IntelliMap R610.0 User Manual Multivariable Controller Tuning
3/16/17 P/N: 6510020464 Rev 01 6-6
Figure 6-3 Multivariable Controller with equal emphasis on sheet properties
and less aggressive AutoSlice
Multivariable Controller Tuning Multivariable Controller Tuning
P/N 6510020464 Rev 01 3/16/17 6-7
Figure 6-4 Implementation screen with the Tuning Parameters option
selected


P/N 6510020464 Rev 01 3/16/17 7-1
7. CD Analysis
The CD Analysis function is an extension to IntelliMap to provide analysis of cross direction (CD) profile data that has been collected with IntelliMap. It can be used to analyze steady state profile data. It has similar functionality to the Matlab™ based CD Toolbox (it uses some of core functions of the CD Toolbox in .dll format), but CD Analysis does not support legacy systems, so if there is any logged file that has been logged by CD Datalogger, IntelliMap 3.x or earlier versions, CD Analysis cannot be used.
7.1. Getting Started The CD Analysis installation is a part of IntelliMap installation and can work with two types of data sets:
• Data logged by the Bump Test function with the Data Logging option selected for the MD Bump Type pull-down menu available on the Bump Test Configuration screen.
• Data saved from the Bump Test function through Save Database to File button available on the Bump Test Execution screen.
You can start the program in three ways:
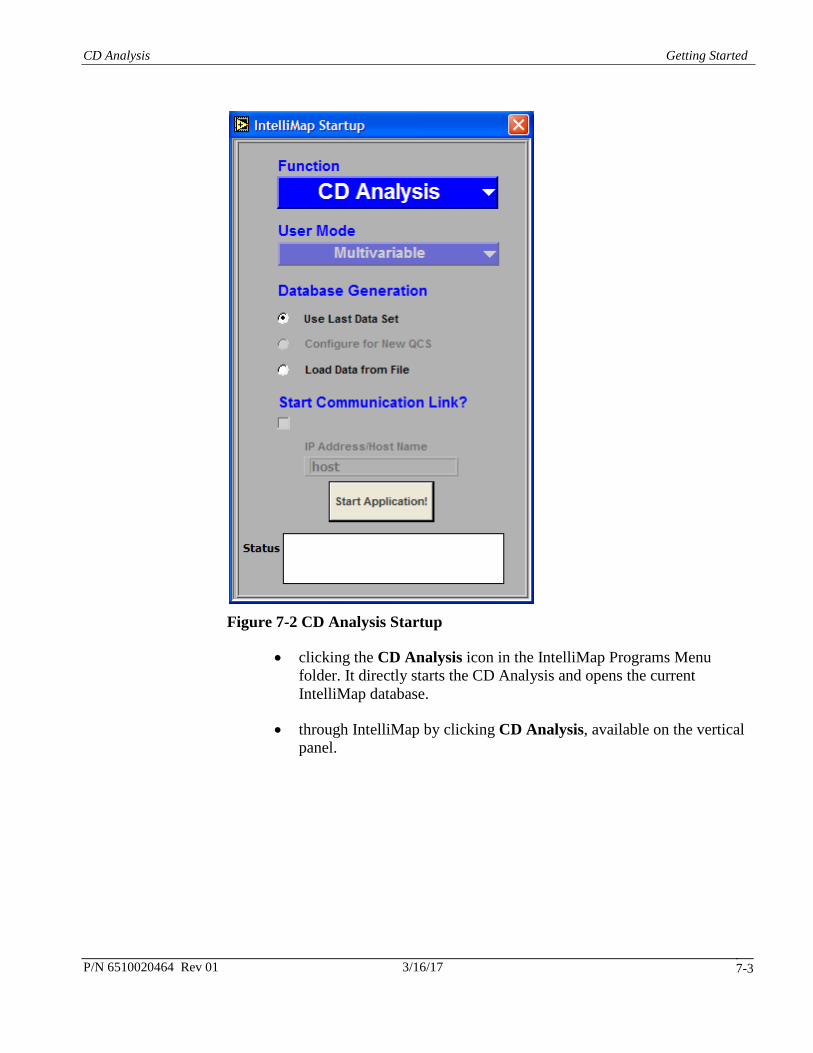
• through the IntelliMap startup. Click the IntelliMap icon in the IntelliMap Programs Menu folder and the dialog box shown in Figure 7-1 appears. Click the Function drop-down box and select CD Analysis as shown in Figure 7-2. There are two choices for database generation, Use Last Data Set and Load Data from File. The first option uses the current IntelliMap database, the second option allows you to open an IntelliMap datalog file and map it to the IntelliMap database.
IntelliMap R610.0 User Manual CD Analysis
3/16/17 P/N: 6510020464 Rev 01 7-2
Figure 7-1 IntelliMap Startup
CD Analysis Getting Started
P/N 6510020464 Rev 01 3/16/17 7-3
Figure 7-2 CD Analysis Startup
• clicking the CD Analysis icon in the IntelliMap Programs Menu folder. It directly starts the CD Analysis and opens the current IntelliMap database.
• through IntelliMap by clicking CD Analysis, available on the vertical panel.
IntelliMap R610.0 User Manual CD Analysis
3/16/17 P/N: 6510020464 Rev 01 7-4
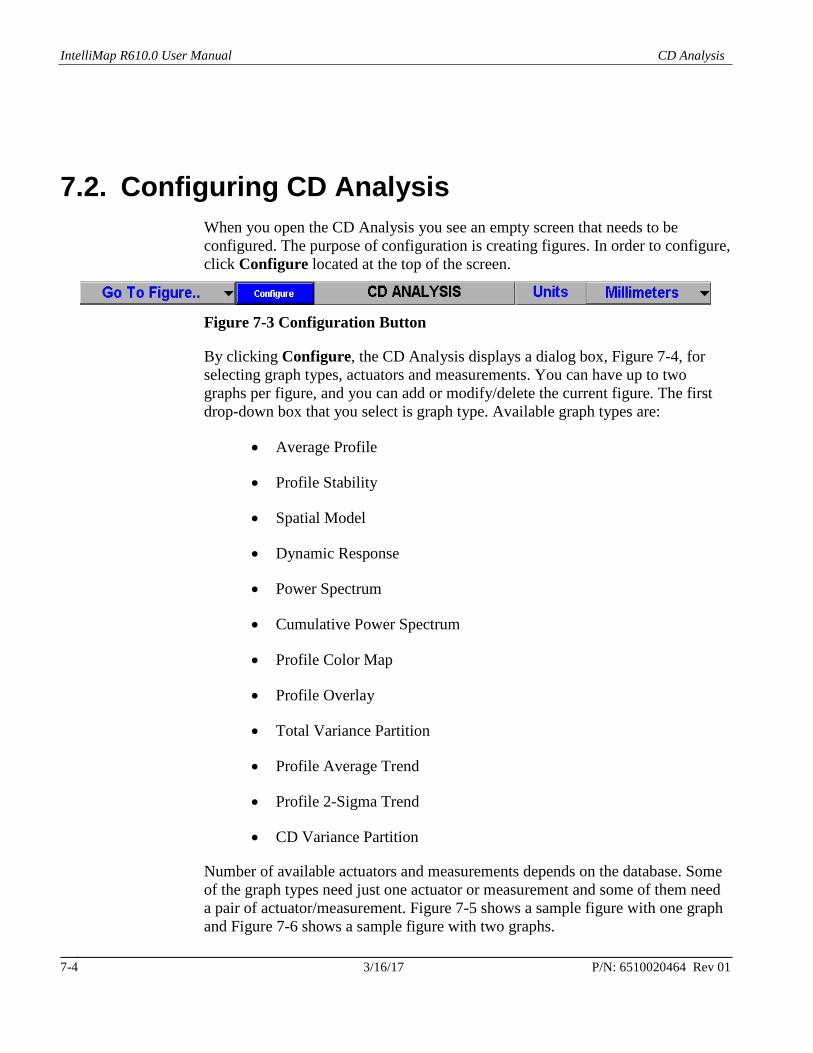
7.2. Configuring CD Analysis When you open the CD Analysis you see an empty screen that needs to be configured. The purpose of configuration is creating figures. In order to configure, click Configure located at the top of the screen.
Figure 7-3 Configuration Button
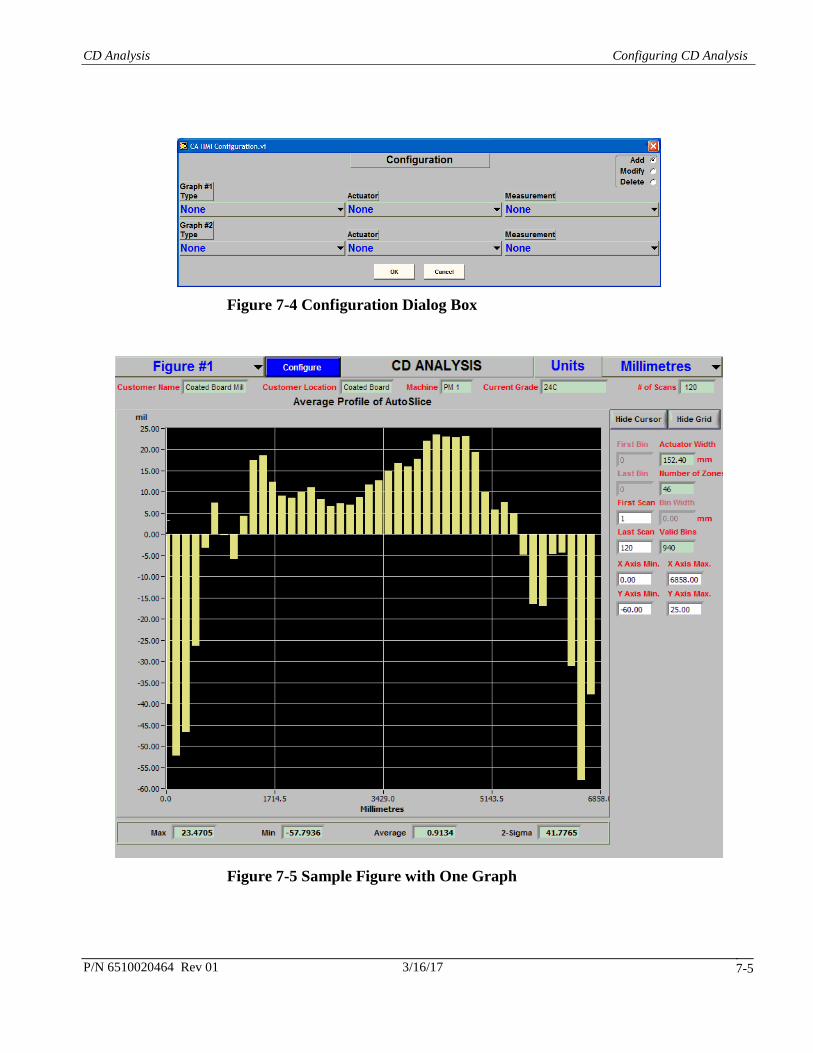
By clicking Configure, the CD Analysis displays a dialog box, Figure 7-4, for selecting graph types, actuators and measurements. You can have up to two graphs per figure, and you can add or modify/delete the current figure. The first drop-down box that you select is graph type. Available graph types are:
• Average Profile
• Profile Stability
• Spatial Model
• Dynamic Response
• Power Spectrum
• Cumulative Power Spectrum
• Profile Color Map
• Profile Overlay
• Total Variance Partition
• Profile Average Trend
• Profile 2-Sigma Trend
• CD Variance Partition
Number of available actuators and measurements depends on the database. Some of the graph types need just one actuator or measurement and some of them need a pair of actuator/measurement. Figure 7-5 shows a sample figure with one graph and Figure 7-6 shows a sample figure with two graphs.
CD Analysis Configuring CD Analysis
P/N 6510020464 Rev 01 3/16/17 7-5
Figure 7-4 Configuration Dialog Box
Figure 7-5 Sample Figure with One Graph
IntelliMap R610.0 User Manual CD Analysis
3/16/17 P/N: 6510020464 Rev 01 7-6
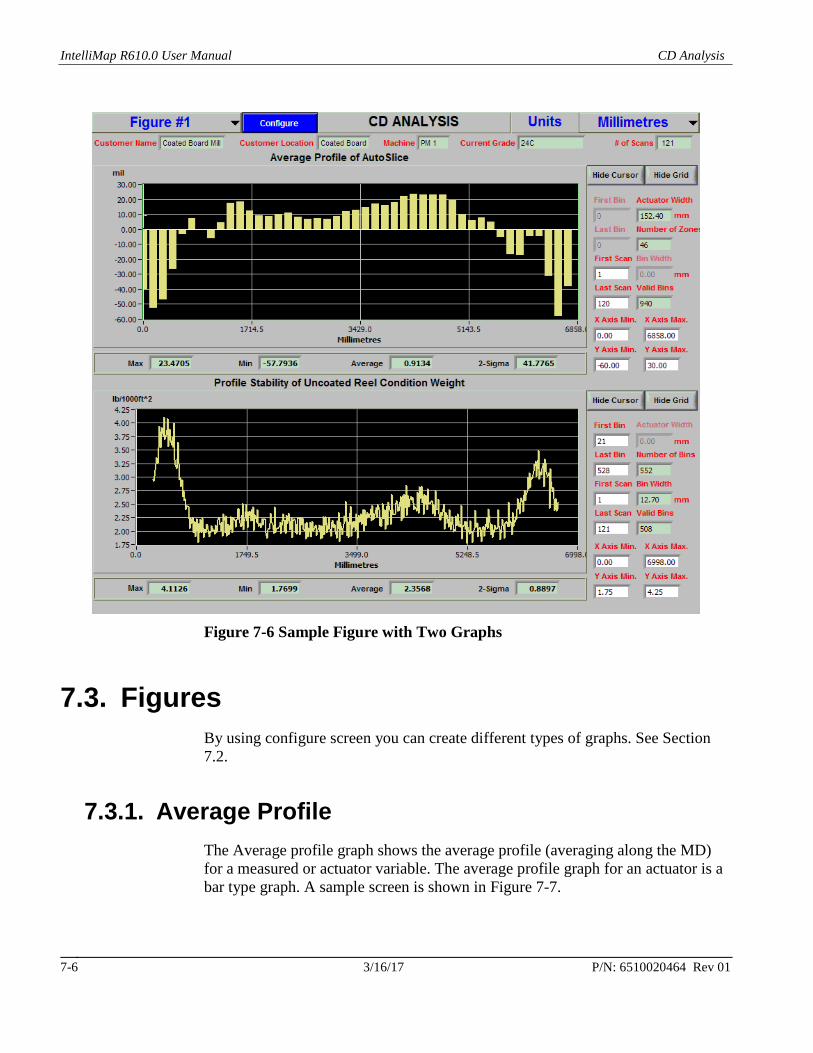
Figure 7-6 Sample Figure with Two Graphs
7.3. Figures By using configure screen you can create different types of graphs. See Section 7.2.
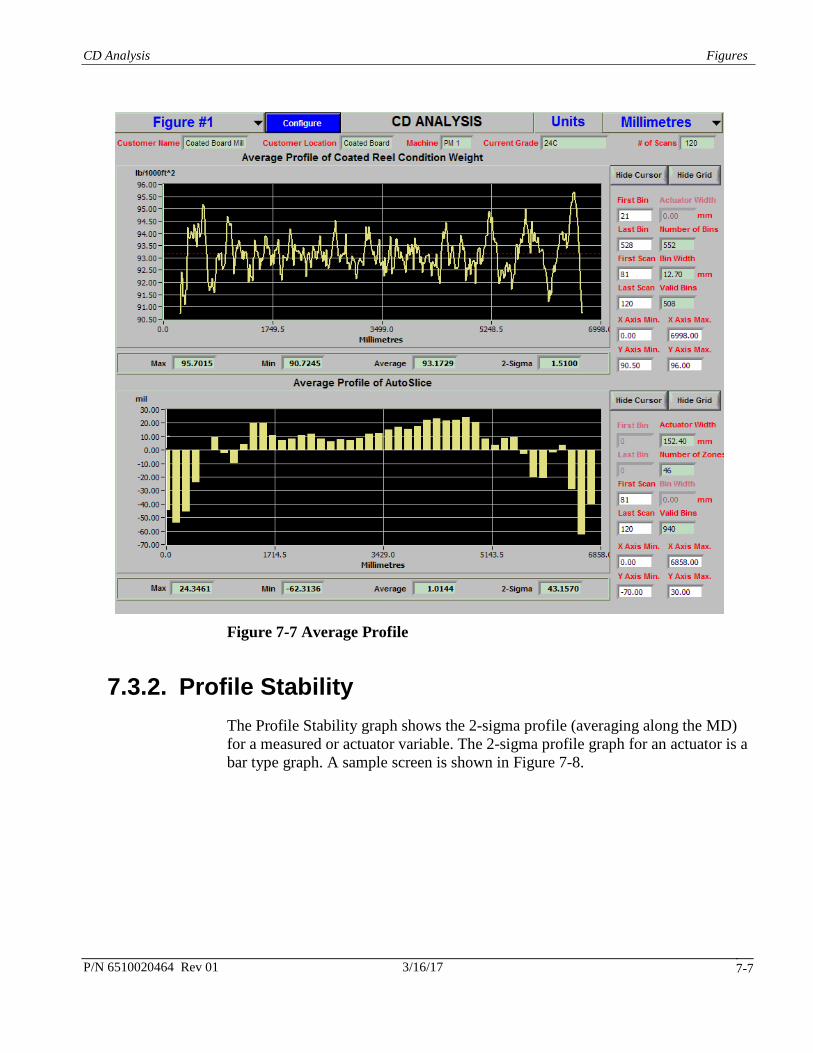
7.3.1. Average Profile The Average profile graph shows the average profile (averaging along the MD) for a measured or actuator variable. The average profile graph for an actuator is a bar type graph. A sample screen is shown in Figure 7-7.
CD Analysis Figures
P/N 6510020464 Rev 01 3/16/17 7-7
Figure 7-7 Average Profile
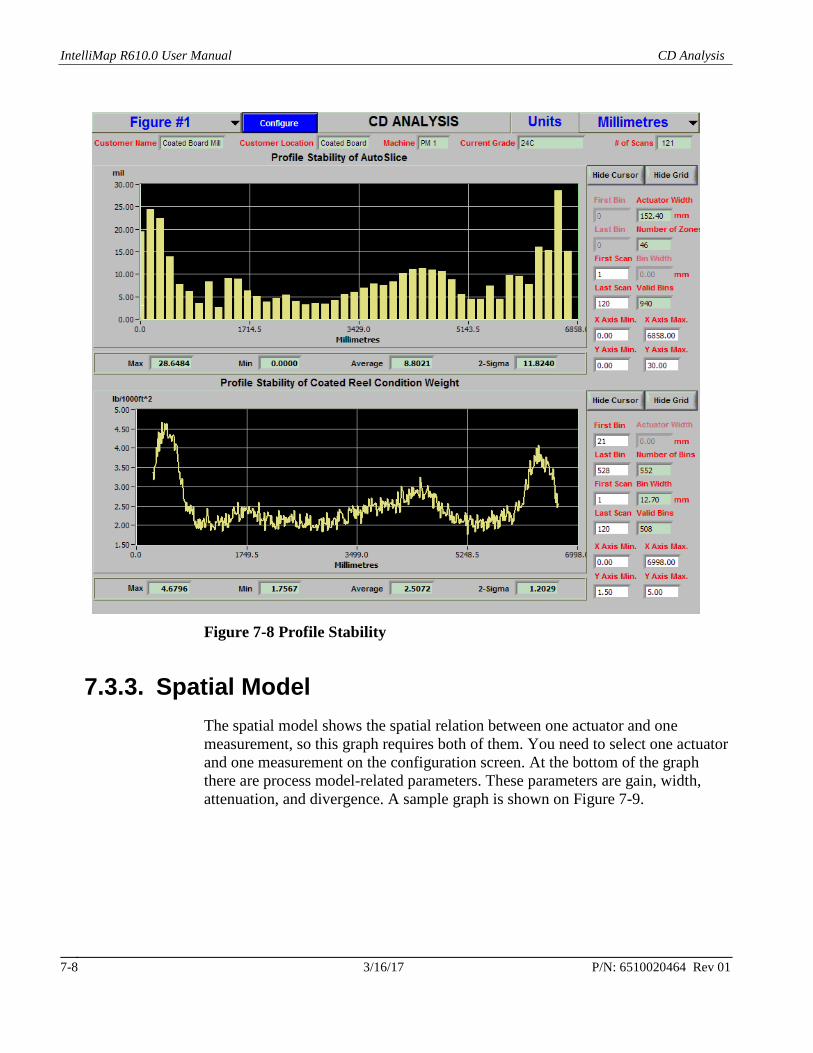
7.3.2. Profile Stability The Profile Stability graph shows the 2-sigma profile (averaging along the MD) for a measured or actuator variable. The 2-sigma profile graph for an actuator is a bar type graph. A sample screen is shown in Figure 7-8.
IntelliMap R610.0 User Manual CD Analysis
3/16/17 P/N: 6510020464 Rev 01 7-8
Figure 7-8 Profile Stability
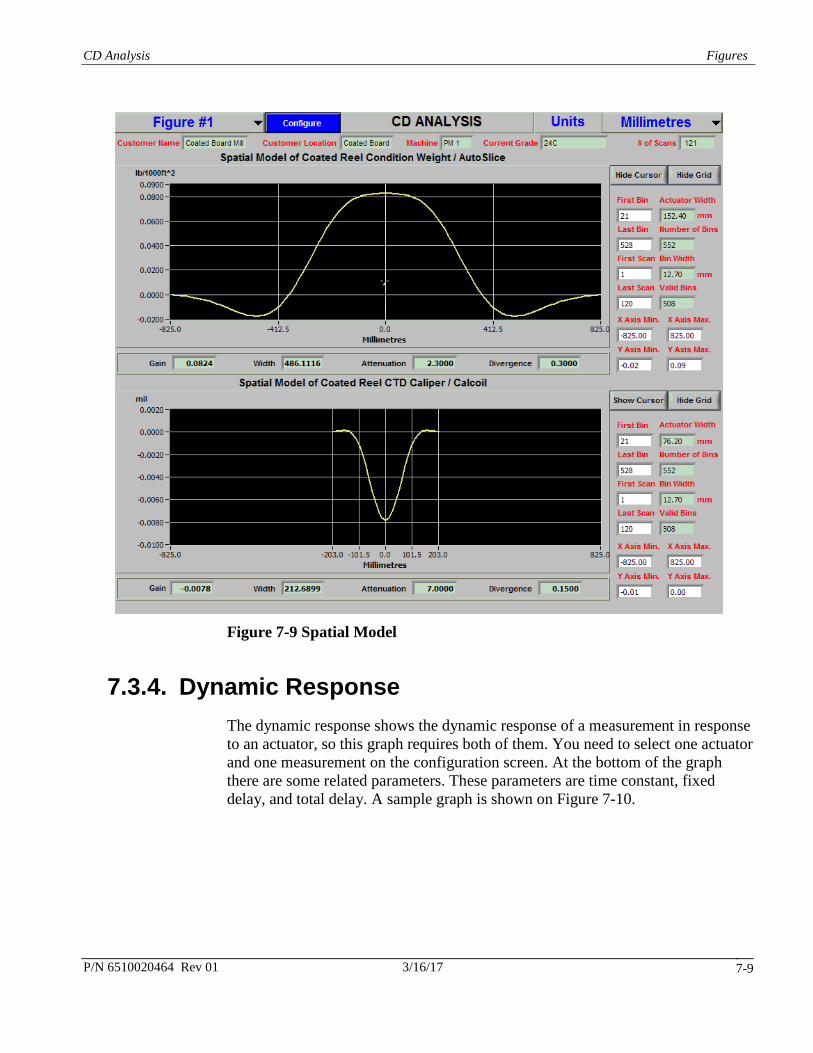
7.3.3. Spatial Model The spatial model shows the spatial relation between one actuator and one measurement, so this graph requires both of them. You need to select one actuator and one measurement on the configuration screen. At the bottom of the graph there are process model-related parameters. These parameters are gain, width, attenuation, and divergence. A sample graph is shown on Figure 7-9.
CD Analysis Figures
P/N 6510020464 Rev 01 3/16/17 7-9
Figure 7-9 Spatial Model
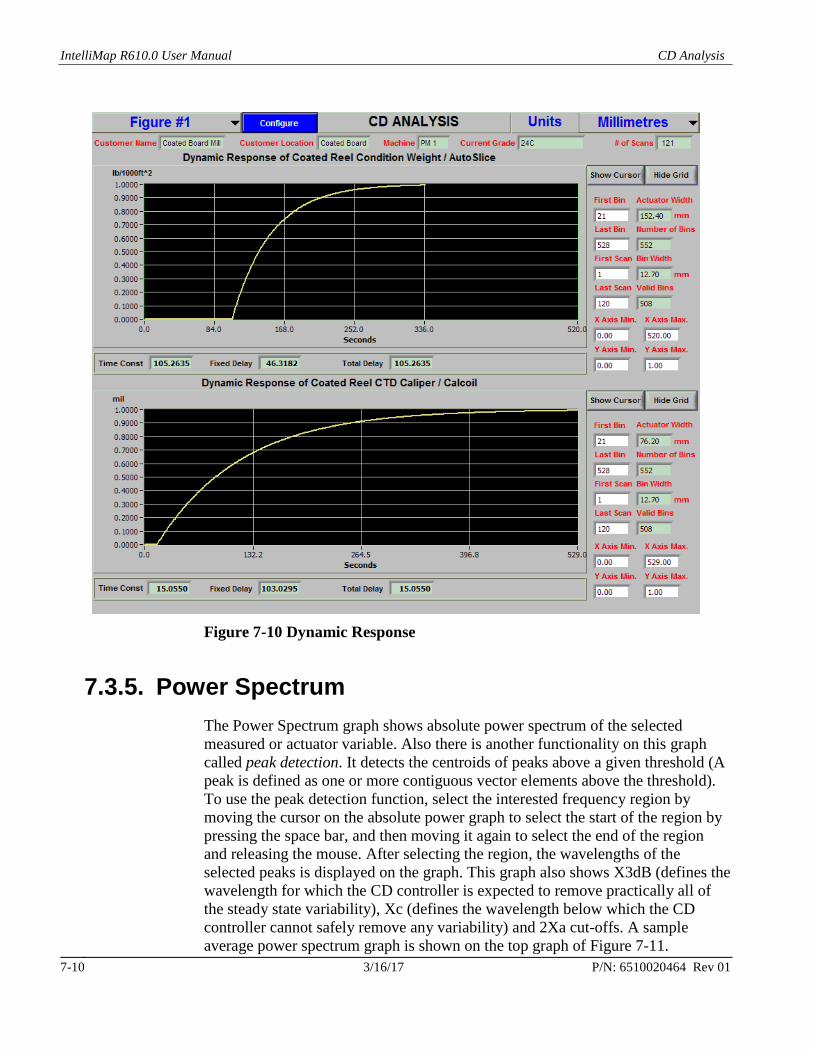
7.3.4. Dynamic Response The dynamic response shows the dynamic response of a measurement in response to an actuator, so this graph requires both of them. You need to select one actuator and one measurement on the configuration screen. At the bottom of the graph there are some related parameters. These parameters are time constant, fixed delay, and total delay. A sample graph is shown on Figure 7-10.
IntelliMap R610.0 User Manual CD Analysis
3/16/17 P/N: 6510020464 Rev 01 7-10
Figure 7-10 Dynamic Response
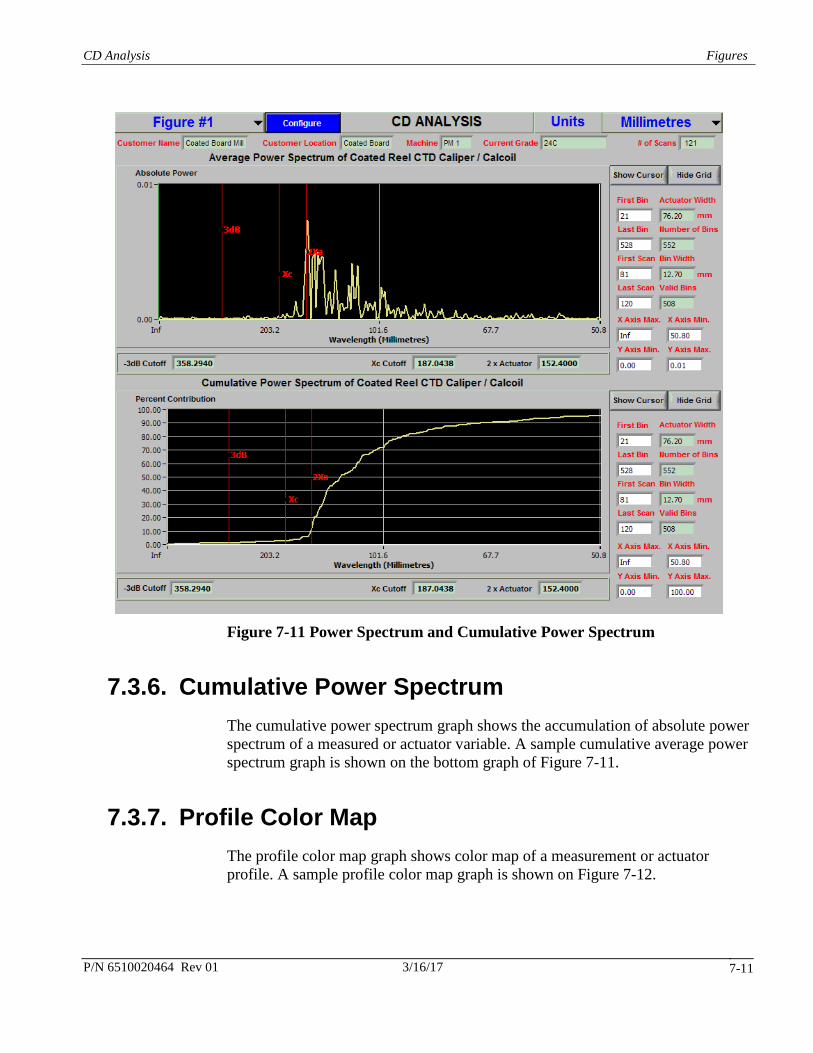
7.3.5. Power Spectrum The Power Spectrum graph shows absolute power spectrum of the selected measured or actuator variable. Also there is another functionality on this graph called peak detection. It detects the centroids of peaks above a given threshold (A peak is defined as one or more contiguous vector elements above the threshold). To use the peak detection function, select the interested frequency region by moving the cursor on the absolute power graph to select the start of the region by pressing the space bar, and then moving it again to select the end of the region and releasing the mouse. After selecting the region, the wavelengths of the selected peaks is displayed on the graph. This graph also shows X3dB (defines the wavelength for which the CD controller is expected to remove practically all of the steady state variability), Xc (defines the wavelength below which the CD controller cannot safely remove any variability) and 2Xa cut-offs. A sample average power spectrum graph is shown on the top graph of Figure 7-11.
CD Analysis Figures
P/N 6510020464 Rev 01 3/16/17 7-11
Figure 7-11 Power Spectrum and Cumulative Power Spectrum
7.3.6. Cumulative Power Spectrum The cumulative power spectrum graph shows the accumulation of absolute power spectrum of a measured or actuator variable. A sample cumulative average power spectrum graph is shown on the bottom graph of Figure 7-11.
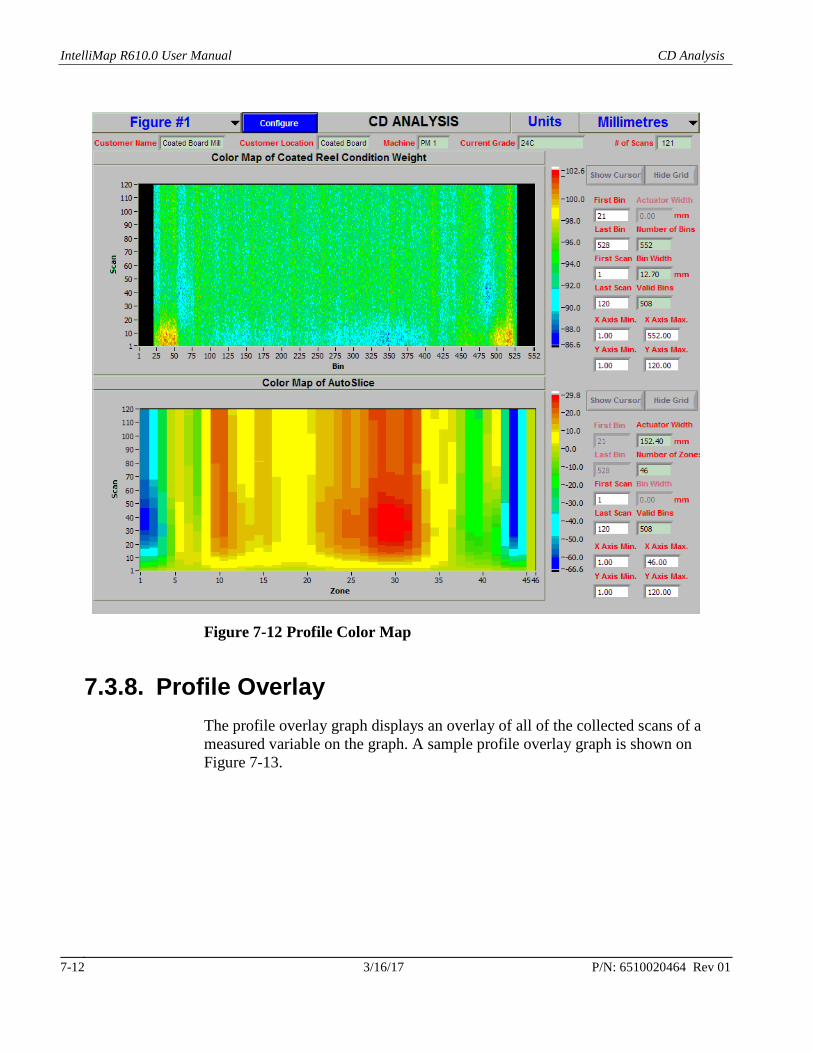
7.3.7. Profile Color Map The profile color map graph shows color map of a measurement or actuator profile. A sample profile color map graph is shown on Figure 7-12.
IntelliMap R610.0 User Manual CD Analysis
3/16/17 P/N: 6510020464 Rev 01 7-12
Figure 7-12 Profile Color Map
7.3.8. Profile Overlay The profile overlay graph displays an overlay of all of the collected scans of a measured variable on the graph. A sample profile overlay graph is shown on Figure 7-13.

CD Analysis Figures
P/N 6510020464 Rev 01 3/16/17 7-13
Figure 7-13 Profile Overlay
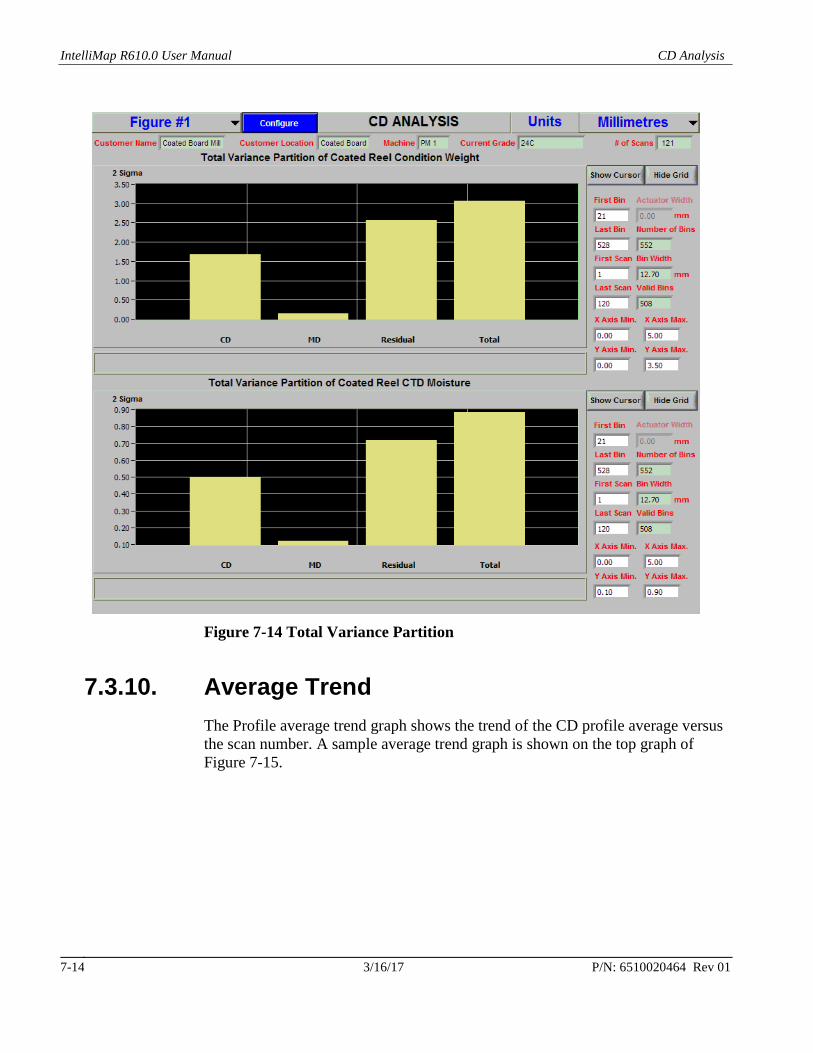
7.3.9. Total Variance Partition The Profile variance partition graph shows 2-sigma of CD error, MD error and two-dimensional error (or total error) as well as 2 sigma residual where:
2Re
222sdMDCDTotal σσσσ ++=
A sample profile color map graph is shown in Figure 7-14.
IntelliMap R610.0 User Manual CD Analysis
3/16/17 P/N: 6510020464 Rev 01 7-14
Figure 7-14 Total Variance Partition
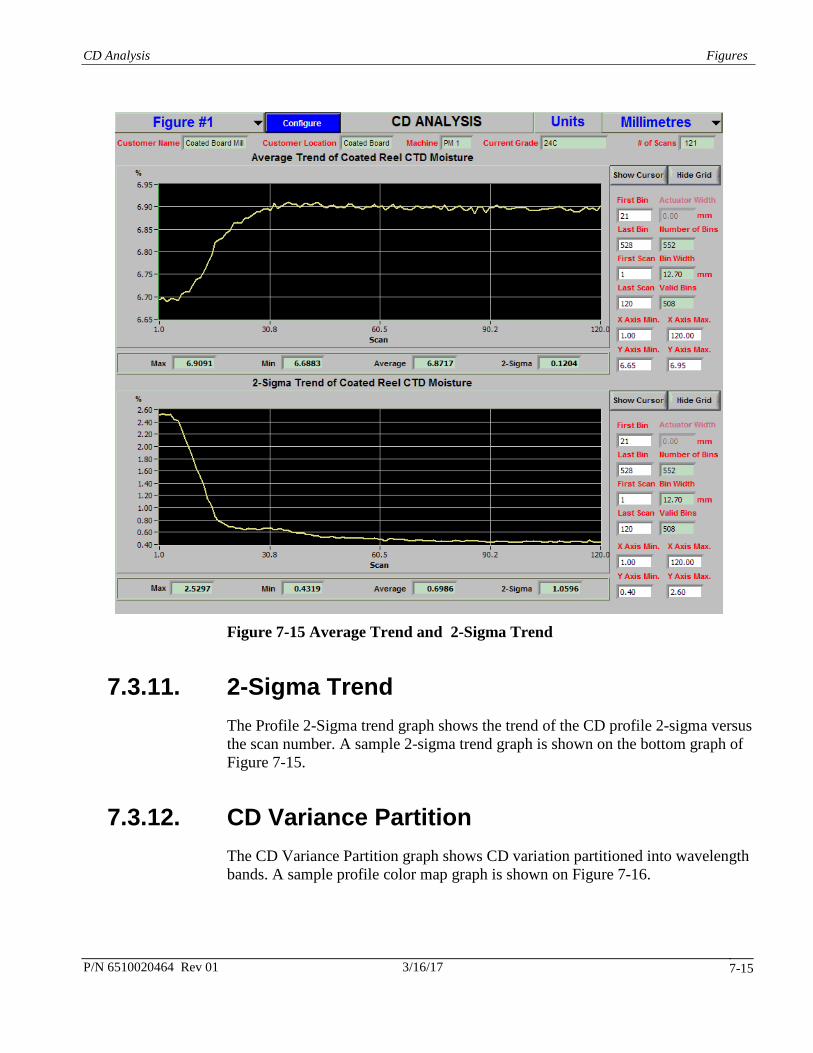
7.3.10. Average Trend The Profile average trend graph shows the trend of the CD profile average versus the scan number. A sample average trend graph is shown on the top graph of Figure 7-15.
CD Analysis Figures
P/N 6510020464 Rev 01 3/16/17 7-15
Figure 7-15 Average Trend and 2-Sigma Trend
7.3.11. 2-Sigma Trend The Profile 2-Sigma trend graph shows the trend of the CD profile 2-sigma versus the scan number. A sample 2-sigma trend graph is shown on the bottom graph of Figure 7-15.
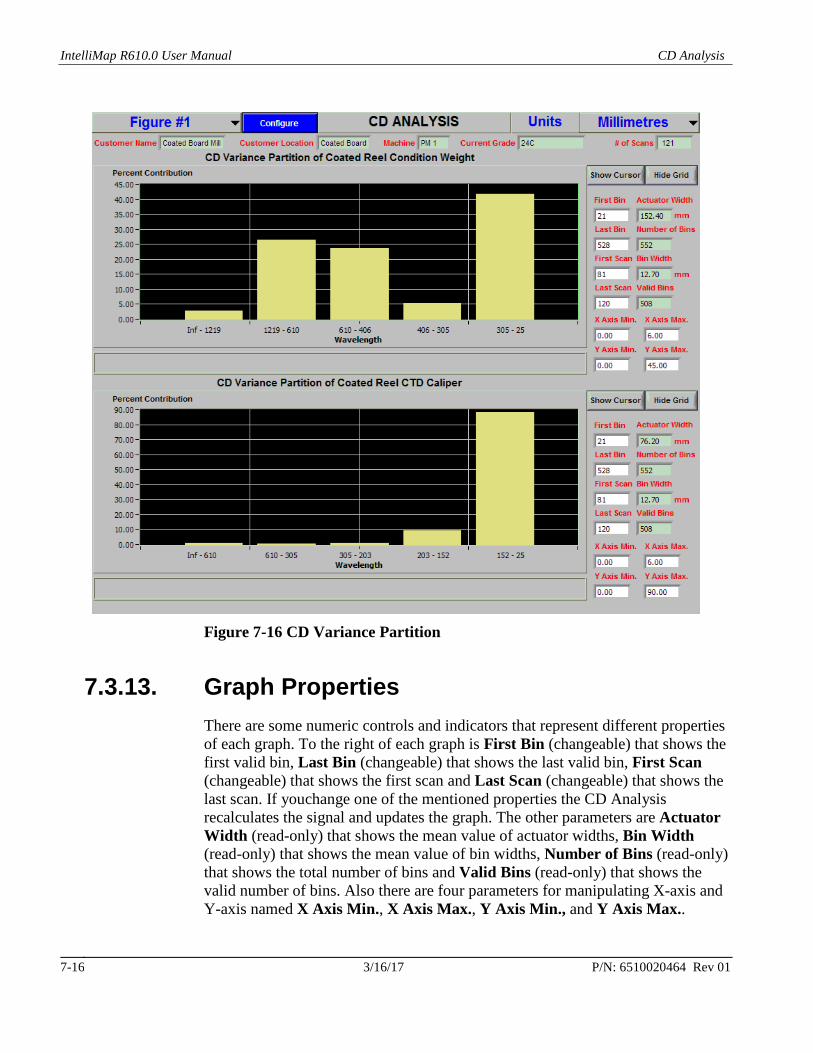
7.3.12. CD Variance Partition The CD Variance Partition graph shows CD variation partitioned into wavelength bands. A sample profile color map graph is shown on Figure 7-16.
IntelliMap R610.0 User Manual CD Analysis
3/16/17 P/N: 6510020464 Rev 01 7-16
Figure 7-16 CD Variance Partition
7.3.13. Graph Properties There are some numeric controls and indicators that represent different properties of each graph. To the right of each graph is First Bin (changeable) that shows the first valid bin, Last Bin (changeable) that shows the last valid bin, First Scan (changeable) that shows the first scan and Last Scan (changeable) that shows the last scan. If youchange one of the mentioned properties the CD Analysis recalculates the signal and updates the graph. The other parameters are Actuator Width (read-only) that shows the mean value of actuator widths, Bin Width (read-only) that shows the mean value of bin widths, Number of Bins (read-only) that shows the total number of bins and Valid Bins (read-only) that shows the valid number of bins. Also there are four parameters for manipulating X-axis and Y-axis named X Axis Min., X Axis Max., Y Axis Min., and Y Axis Max..
CD Analysis Action Panel
P/N 6510020464 Rev 01 3/16/17 7-17
Show Cursor on the right side of each graph hides or shows the cursor (this button also can be used to bring the cursor to the center of the graph). The Hide Grid button next to it hides or shows grids.
At the top of the Screen is the Units drop-down box. You can change the X-axis unit for the both graphs. The available options are Millimeters, Centimeters, Inches and Bins/Zones.
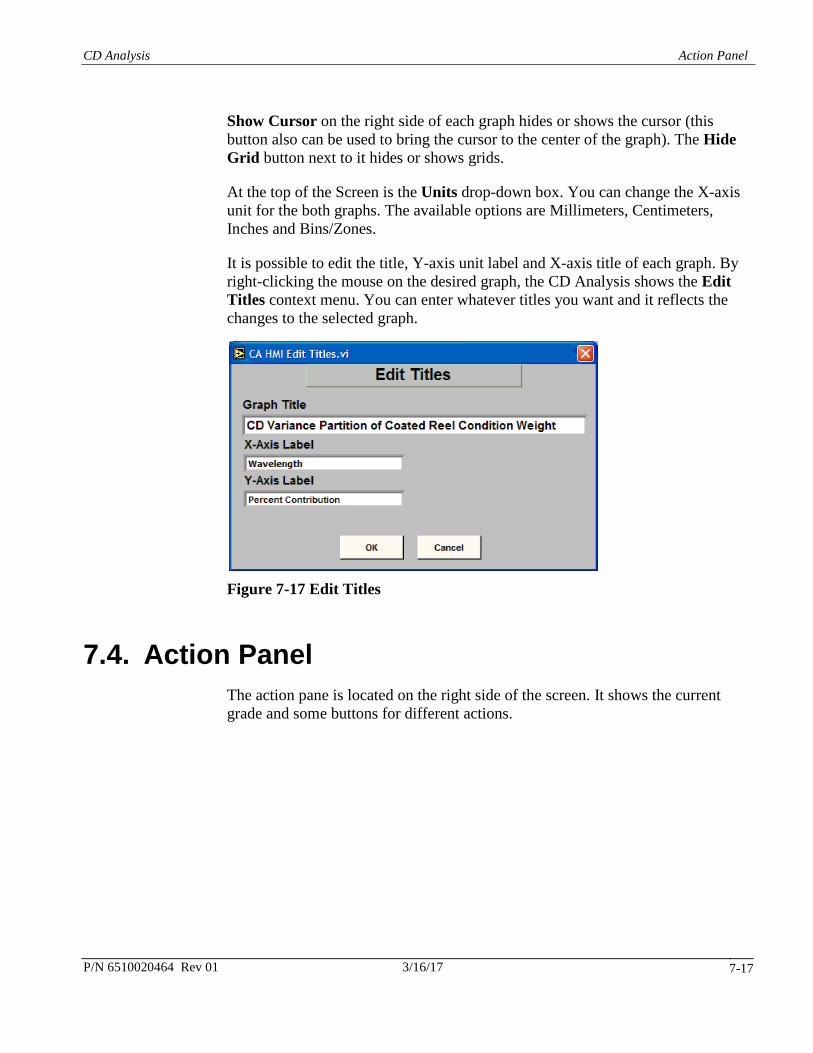
It is possible to edit the title, Y-axis unit label and X-axis title of each graph. By right-clicking the mouse on the desired graph, the CD Analysis shows the Edit Titles context menu. You can enter whatever titles you want and it reflects the changes to the selected graph.
Figure 7-17 Edit Titles
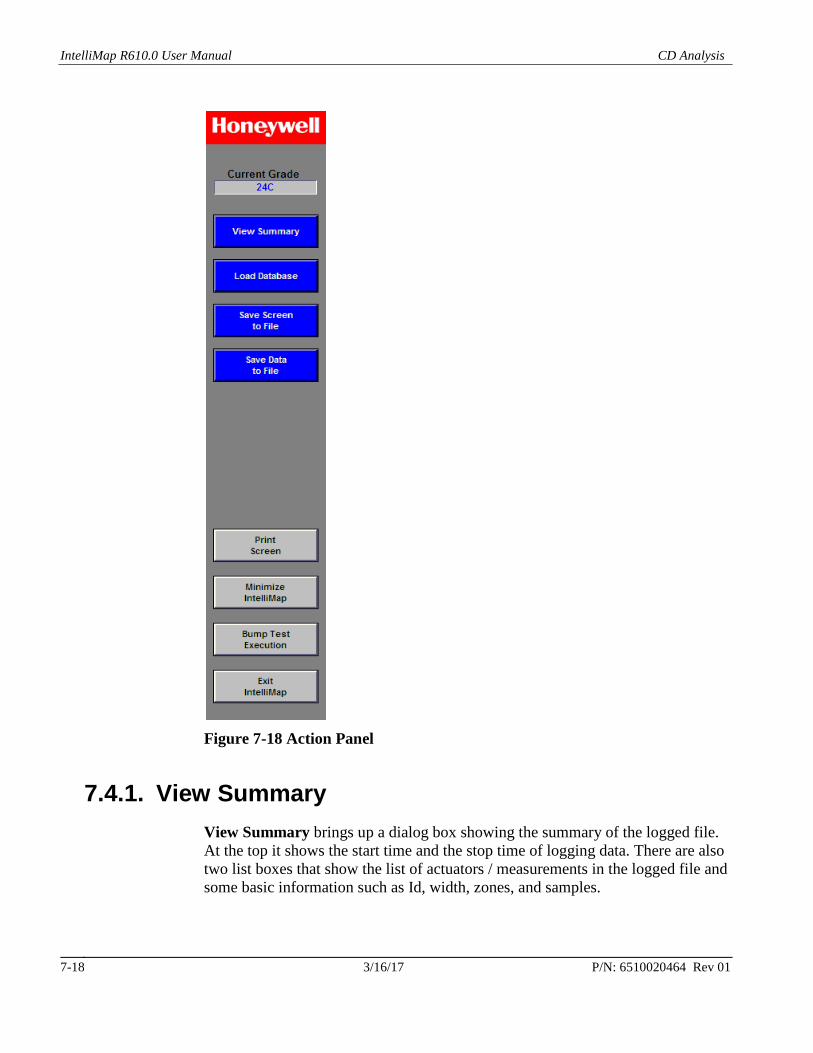
7.4. Action Panel The action pane is located on the right side of the screen. It shows the current grade and some buttons for different actions.
IntelliMap R610.0 User Manual CD Analysis
3/16/17 P/N: 6510020464 Rev 01 7-18
Figure 7-18 Action Panel
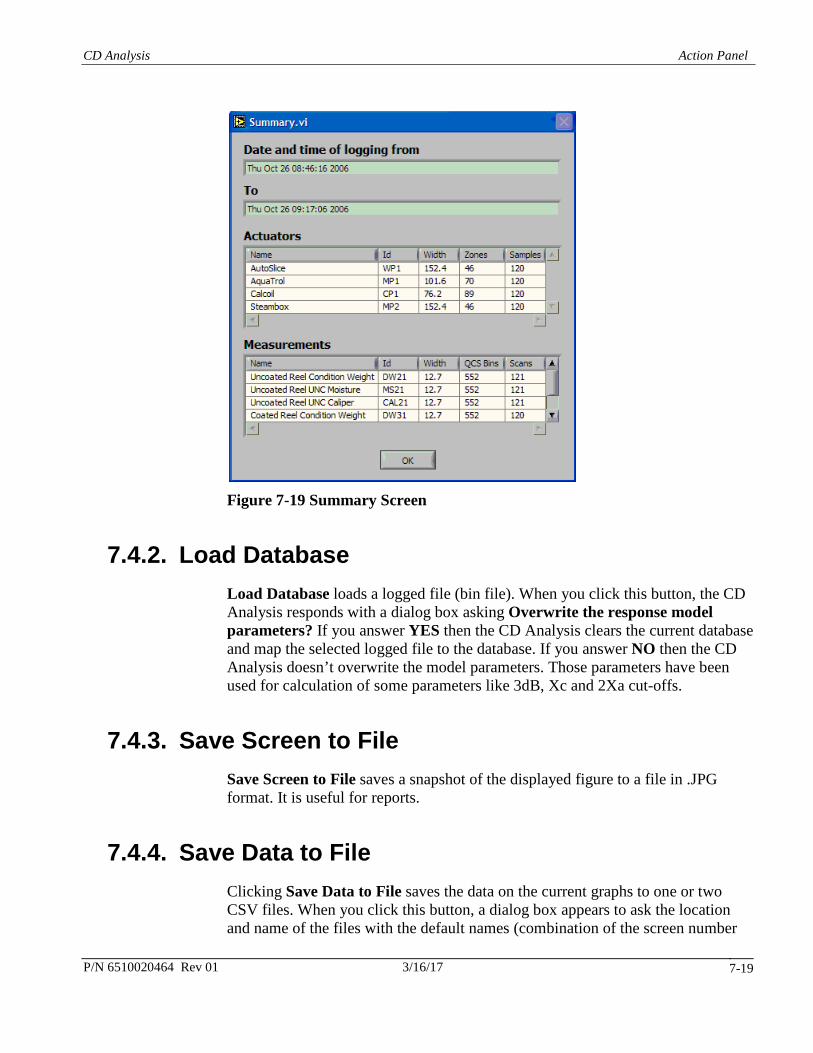
7.4.1. View Summary View Summary brings up a dialog box showing the summary of the logged file. At the top it shows the start time and the stop time of logging data. There are also two list boxes that show the list of actuators / measurements in the logged file and some basic information such as Id, width, zones, and samples.
CD Analysis Action Panel
P/N 6510020464 Rev 01 3/16/17 7-19
Figure 7-19 Summary Screen
7.4.2. Load Database Load Database loads a logged file (bin file). When you click this button, the CD Analysis responds with a dialog box asking Overwrite the response model parameters? If you answer YES then the CD Analysis clears the current database and map the selected logged file to the database. If you answer NO then the CD Analysis doesn’t overwrite the model parameters. Those parameters have been used for calculation of some parameters like 3dB, Xc and 2Xa cut-offs.
7.4.3. Save Screen to File Save Screen to File saves a snapshot of the displayed figure to a file in .JPG format. It is useful for reports.
7.4.4. Save Data to File Clicking Save Data to File saves the data on the current graphs to one or two CSV files. When you click this button, a dialog box appears to ask the location and name of the files with the default names (combination of the screen number
IntelliMap R610.0 User Manual CD Analysis
3/16/17 P/N: 6510020464 Rev 01 7-20
and the graph title). The format of the file is CSV and it starts with the dimensions of the array (dim1, dim2, dim3) and the rest of the file is the array data.
7.4.5. Print Screen Print Screen works as same in CD Analysis as it does in IntelliMap. A dialog box appears to ask if you want to copy the screen to the default printer and/or the clipboard.
7.4.6. Minimize IntelliMap Minimize IntelliMap minimizes the CD Analysis. If you click the CD Analysis on the task bar then the CD Analysis is restored.
7.4.7. Bump Test Execution Bump Test Execution closes the CD Analysis and starts IntelliMap traditional tuning and the bump test program.
7.4.8. Exit IntelliMap Exit IntelliMap closes the IntelliMap session.
P/N 6510020464 Rev 01 3/16/17 8-1
8. Reports
Reports is a reporting software package for IntelliMap. It creates different types of reports (snapshot, snapshot summary, transfer and comparison report) for alignment, model, and tuning. A created report is shown in the report viewer, which is a sub screen of IntelliMap. From the report viewer, reports can be exported to different applications such as Microsoft® Word, Microsoft Excel, Adobe® Acrobat , or in rich text format for viewing with any text editor.
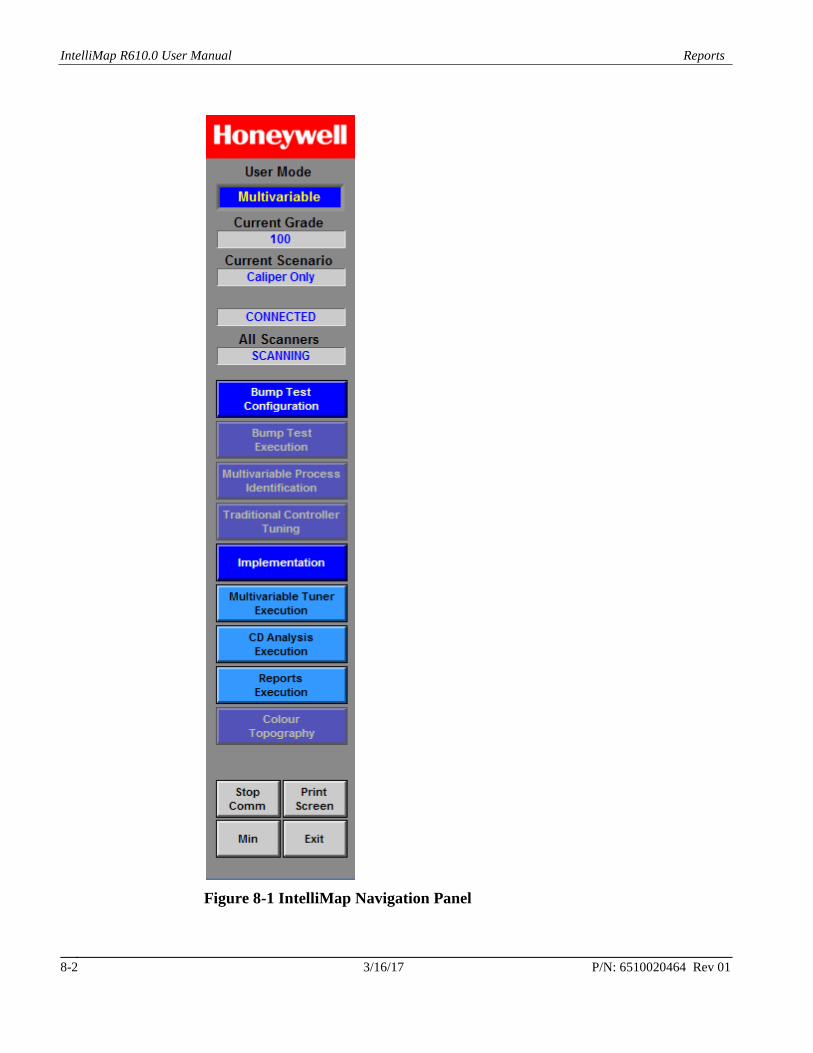
8.1. Getting Started The Reports package installation is a part of the IntelliMap installation and it installs necessary files and libraries. By clicking Reports Execution on the IntelliMap Navigation panel shown in Figure 8-1, IntelliMap shows the IntelliMap Reports sub screen (see Figure 8-2). Different parts of the IntelliMap Reports are report tabs, report viewer, report switching buttons and report action buttons.
IntelliMap R610.0 User Manual Reports
3/16/17 P/N: 6510020464 Rev 01 8-2
Figure 8-1 IntelliMap Navigation Panel
Reports Getting Started
P/N 6510020464 Rev 01 3/16/17 8-3
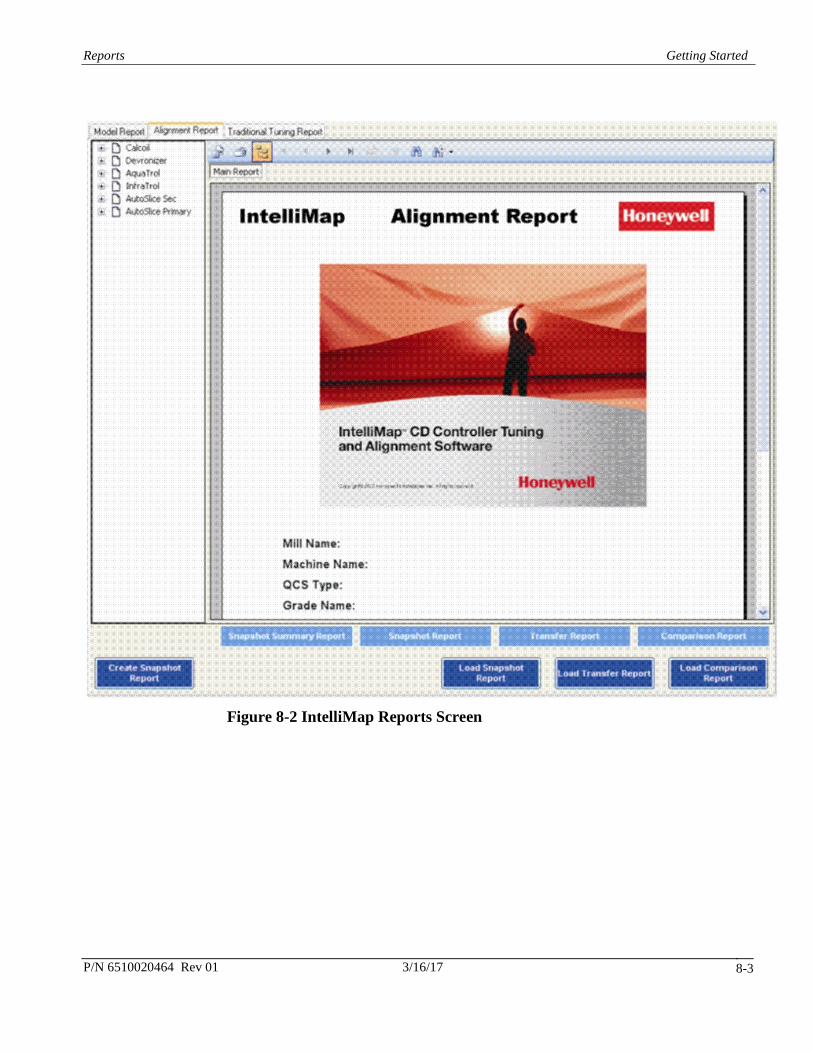
Figure 8-2 IntelliMap Reports Screen

IntelliMap R610.0 User Manual Reports
3/16/17 P/N: 6510020464 Rev 01 8-4
When you open the IntelliMap Reports it shows an empty screen. The starting point is the report action buttons.
8.2. Report Types You can load or create four different types of reports:
• snapshot
• snapshot summary
• transfer
• comparison
Snapshot Reports: On the left side of report action buttons bar there is a button called Create Snapshot Report. When you click this button, a dialog box appears for an optional keyword for the report file, then IntelliMap takes the snapshot of current system data (could be model / tuning / alignment / multivariable data based on the report tab selection) and saves it to a report file. The name and the location of the report files are a combination of Mill Name, Machine Name, date and time, the optional keyword you have entered and the location that IntelliMap has been installed.
Snapshot Summary Reports: Summary reports are helpful when you want to create a summary report for multivariable data represented in a numerical format. Press the Snapshot Summary Report button to display the main report.
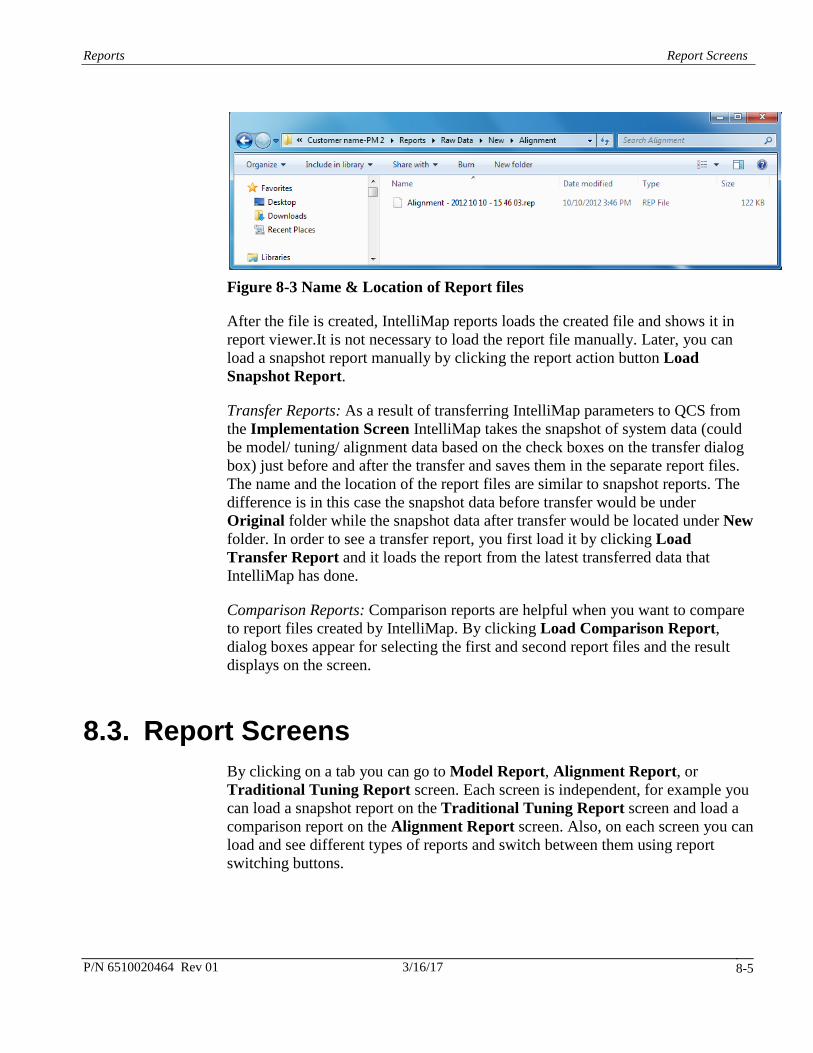
For example, if the IntelliMap installation directory is C:\Program Files (x86)\Honeywell\IntelliMap\, the mill name is Customer name and the machine name is PM 2 then the location of snapshot report (for Alignment data) is C:\ProgramData\Honeywell\IntelliMap\Customer name-PM 2\Reports\Raw Data\New\Alignment. The name of the report file is (for Alignment data) <Optional Keyword> Alignment - <Date> –< Time>.rep. For example, it is Alignment - 2012 10 10 - 15 46 03.rep in Figure 8-3).
Reports Report Screens
P/N 6510020464 Rev 01 3/16/17 8-5
Figure 8-3 Name & Location of Report files
After the file is created, IntelliMap reports loads the created file and shows it in report viewer.It is not necessary to load the report file manually. Later, you can load a snapshot report manually by clicking the report action button Load Snapshot Report.
Transfer Reports: As a result of transferring IntelliMap parameters to QCS from the Implementation Screen IntelliMap takes the snapshot of system data (could be model/ tuning/ alignment data based on the check boxes on the transfer dialog box) just before and after the transfer and saves them in the separate report files. The name and the location of the report files are similar to snapshot reports. The difference is in this case the snapshot data before transfer would be under Original folder while the snapshot data after transfer would be located under New folder. In order to see a transfer report, you first load it by clicking Load Transfer Report and it loads the report from the latest transferred data that IntelliMap has done.
Comparison Reports: Comparison reports are helpful when you want to compare to report files created by IntelliMap. By clicking Load Comparison Report, dialog boxes appear for selecting the first and second report files and the result displays on the screen.
8.3. Report Screens By clicking on a tab you can go to Model Report, Alignment Report, or Traditional Tuning Report screen. Each screen is independent, for example you can load a snapshot report on the Traditional Tuning Report screen and load a comparison report on the Alignment Report screen. Also, on each screen you can load and see different types of reports and switch between them using report switching buttons.

IntelliMap R610.0 User Manual Reports
3/16/17 P/N: 6510020464 Rev 01 8-6
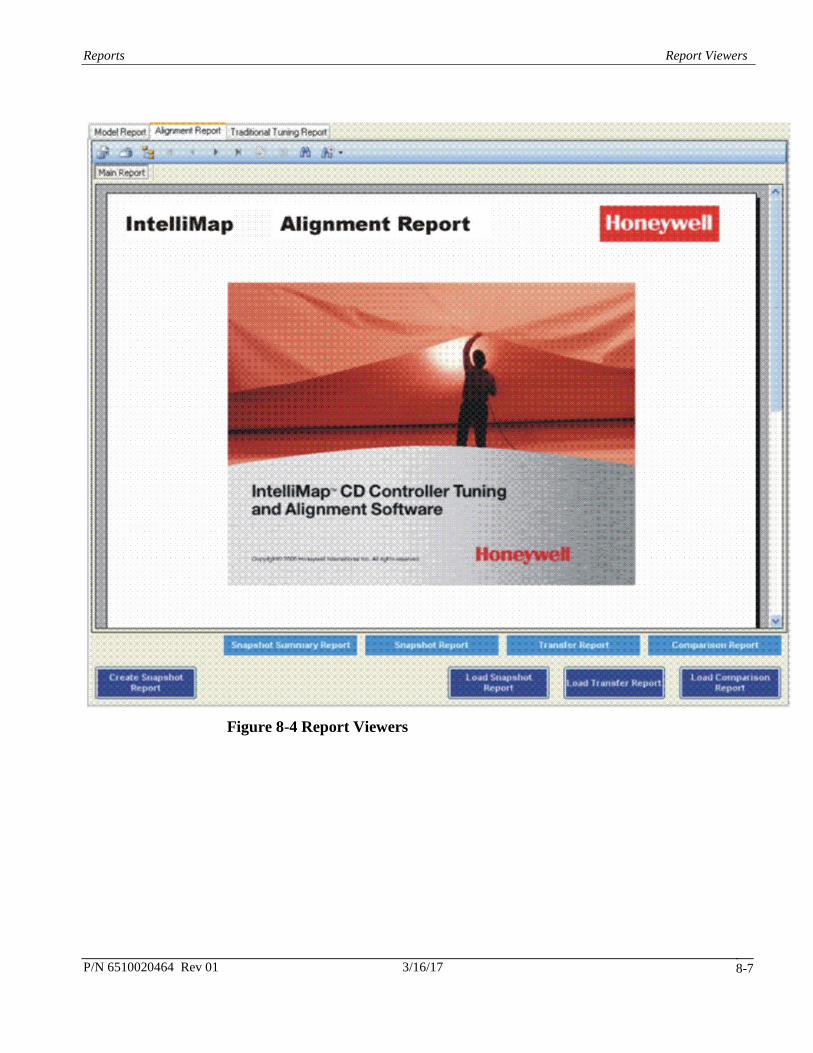
8.4. Report Viewers For each screen and for each report type there is a report viewer (see Figure 8-4). A report viewer has three components:
• tree view
• toolbar
• main report window
Reports Report Viewers
P/N 6510020464 Rev 01 3/16/17 8-7
Figure 8-4 Report Viewers

IntelliMap R610.0 User Manual Reports
3/16/17 P/N: 6510020464 Rev 01 8-8
Tree view shows the valid combinations of actuator – measurement (or frame) based on the type the report. The tree view can be used for navigation, for example you can click the specific actuator and in response the IntelliMap Reports shows the relevant page on the main report window.
The toolbar has ten components.
Table 8-1 Reports View Toolbar Components
Shows the first page of the report
Shows the previous page of the report
Shows the next page of the report.
Shows the last page of the report
Shows a dialog box for a desired page number and then shows that page of the report
Prints the report
Exports the report to different types of applications such as Microsoft Word, Microsoft Excel, Adobe Acrobat, or in rich text format to be viewed by any text editor
Shows or Hides Tree View
Zooms in or out on a selected part of the report
Searches text in the report
The Main Report Window displays the content of the report.

P/N 6510020464 Rev 01 3/16/17 9-1
9. Glossary
Bin (or Measurement Bin)
A unit representing an element in a measurement profile at the scanner resolution.
CD Cross Direction Used to refer to those properties of a process measurement or control device that is determined by its position along a line that runs across the paper machine. The Cross Direction is transverse to the MD (Machine Direction) that relates to a position along the length of the paper machine.
CD Bin A unit representing an element in a measurement profile at the CD bin resolution.
CD Bin Resolution A user-defined resolution, usually lower than the scanner resolution, which all measurement profiles are mapped down to after the profiles have been verified and before they are processed further in Experion MX CD Controls.
CDMV Experion MX CD Controls Multivariable Controller Experion MX The name for Honeywell’s latest QCS system. Experion MX CD
Controls is one of the applications for it. QCS Quality Control System
A computer system that manages the quality of the paper produced. RAE Real-Time Application Environment RTDR Real-Time Data Repository

P/N 6510020464 Rev 01 3/16/17 9-1
Index
Alignment Implementation, 5-1 Bump Test, 3-3, 3-6 Bump Test Excitation Pattern, 3-4 Bump Test, Alignment and Model
Identification, 3-1 CD Analysis
Figures 2-Sigma Trend, 7-15 Average Profile, 7-6 Average Trend, 7-14 CD Variance Partition, 7-15 Cumulative Power Spectrum, 7-11 Dynamic Response, 7-9 Graph Properties, 7-16 Power Spectrum, 7-10 Profile Color Map, 7-11 Profile Overlay, 7-12 Profile Stability, 7-7 Spatial Model, 7-8 Total Variance Partition, 7-13
Figures, 7-6 Getting Started, 7-1
CD Bump Interval, 3-3 CD Model Identification, 3-5 CD process model, v, 3-1 Configuring a Bump Test, 3-1 Configuring CD Analysis, 7-4 Current and Predicted CD Bin Profiles, 3-2 Dynamic Control Fine-Tuning, 4-2 Dynamic Model Identification, 3-5 Executing a Bump Test, 3-1 High Actuator Offset, 5-1, 5-2
High Edge Trim, 5-2 High Sheet Edge, 5-1, 5-2 High Trim Adjustment, 5-1, 5-2 Installation, 1-1
Before Starting, 1-1 Hardware Requirements, 1-1 Software Requirements, 1-2
IntelliMap R610.0 Program group, 1-6 IntelliMap Reports
Getting Started, 8-1 Report Screens, 8-5 Report Types, 8-4 Report Viewers, 8-6
Low Actuator Offset, 5-1, 5-2 Low Edge Trim, 5-2 Low Sheet Edge, 5-1, 5-2 Low Trim Adjustment, 5-1, 5-2 MD Bump Test Excitation Pattern, 3-3, 3-5 Measurement profile selector, 3-2 Model transfer option, 5-5 Modes
AUTO Mode, 3-4 CASCADE Mode, 3-5 Expert Mode, 2-4, 3-2, 3-3, 3-5, 4-1, 5-2, 5-4,
5-5 Multivariable Mode, 2-3, 4-1 Traditional Mode, 2-3
Multivariable CD process model identification, v
Multivariable Controller Tuning, 6-1 How to, 6-2
Multivariable Process Identification, 3-6

3/16/17 P/N: 6510020464 Rev 01 9-2
Predicted Actuator Profile, 4-1 Predicted Actuator Spectrum, 4-1 Predicted Error Profile, 4-1 Predicted Error Spectrum, 4-1, 6-1 Proper Host Name, 2-1 RAE License Key, 1-5 Sheet Edges, 5-2 Shrinkage Model Identification, 3-5 Shrinkage Profile, 5-1 Software Installation, 1-2
Spatial Control Fine-Tuning, 4-1 Spatial Model Identification, 3-5 Starting IntelliMap, 2-2 Startup, 2-1
Before Starting, 2-1 Starting IntelliMap, 2-2 Verifying Communication Data, 2-5
TCP, 2-2 Valid Network Connection Test, 2-1 Zone Boundary, 5-1