Embed Size (px)
Citation preview

1
Experiments with channel denudation and sediment transport
measurement
Dr. N.L. Dongre.
Potholes are fascinating features in the Denwa River of the Pachmarhi which one layer of the basalt Complex
transgresses its footwall and forms a basin-shaped depression. A less severe disturbance is a roll. Generally,
rolls are local changes of dip and strike, which seldom disrupt the geomorphologic process significantly, but
provide some insight into the understanding of potholes. A potholed layer may be developed within the
pothole, although it is in a modified form when compared to its regional characteristics.
Abstract: Natural Bedrock Rivers flow in self-formed channels and form diverse denudational morphologies.
The parameters that collectively define channel morphology (e.g. width, slope, bed roughness, bedrock exposure,
sediment size distribution) all influence river incision rates and dynamically adjust in poorly understood ways to
imposed fluid and sediment fluxes. To explore the mechanics of river incision, laboratory experiments were
conducted in which the complexities of natural bedrock channels were reduced to a homogenous brittle substrate
(sand and cement), a single sediment size primarily transported as bedload, a single denudation mechanism
(abrasion) and sediment-starved transport conditions. It was found that patterns of denudation both create and
are sensitive functions of the evolving bed topography because of feedbacks between the turbulent flow field,
sediment transport and bottom roughness. Abrasion only occurs where sediment impacts the bed, and so positive _____________________________________________________________________________________________________________________
Dr. N.L. Dongre.
Jaypee Nagar Rewa (M.P.) 486450

2
feedback occurs between the sediment preferentially drawn to topographic lows by gravity and the further
denudation of these lows. However, the spatial focusing of denudation results in tortuous flow paths and
denudational forms (inner channels, scoops, potholes), which dissipate flow energy. This energy dissipation is a
negative feedback that reduces sediment transport capacity, inhibiting further incision and ultimately leading to
channel morphologies adjusted to just transport the imposed sediment load.
Keywords: bedrock channel; denudation; sediment transport; laboratory flume; Pachmarhi.
Motivation
Tectonics and isostasy combine to create positive topography that is eroded and sculpted by
surface processes. River networks propagate signals of base level change upstream through incision or
aggradation and also move eroded material downstream through sediment transport, making landscapes
particularly sensitive to river channel dynamics. Denudation in bedrock channels can respond to changes
on human timescales. Anthropogenic effects (e.g. mining, logging, grazing, dam construction and
removal, road building) and natural stochastic events (e.g. wildfires, landslides, debris flows) can
significantly change short-term sediment fluxes (Roering and Gerber, 2005) and have in some cases
increased bedrock denudation rates (James, 2004; Stock et al., 2005), affecting riparian habitats and the
structural integrity of dams, levees, roads and bridges. At orogenic timescales, a more quantitative
understanding of denudation processes is needed to understand the coupling among tectonics, topography
and climate, and to rationally interpret signals of external forcing (climate, tectonics) from landscapes
(see, e.g., Willett, 1999; Whipple and Tucker, 2002; Hancock and Anderson, 2002; Whipple, 2004).
A variety of models have been proposed to predict the dynamics of river channel denudation into
bedrock (see, e.g., Howard and Kerby, 1983; Howard et al., 1994; Sklar and Dietrich, 1998, 2004;
Whipple and Tucker, 1999, 2002; Stark and Stark, 2001), but data needed to evaluate aspects of
competing models is rare (van der Beek and Bishop, 2003; Tomkin et al., 2003; Whipple, 2004).
Numerical simulations of landscape evolution demonstrate that the details of various bedrock channel
denudation models can significantly affect simulated landscape behavior (Whipple and Tucker, 2002;
Gasparini et al., 2006). Channels that incise into bedrock must also transport the sediment load imposed
from upstream because otherwise the channel bed will aggrade. Large shear stress thresholds must be
overcome to move boulders and other coarse sediment typically found in bedrock channels, and a large
volume of sediment must be transported through the channel network to erode an entire landscape.
Therefore, it is unclear at present whether the factor limiting the ability of bedrock channels to vertically
incise tends to be the ability of denudation processes to physically remove pieces of bedrock (detachment-
limited end member model, DL) or to transport the sediment supply (transport-limited end member, TL),
and what criteria would allow this interpretation to be made (Howard, 1998; Whipple and Tucker, 2002).
Directly linking transport and denudation, Sklar and Dietrich (1998, 2004) proposed a physically
based bedrock incision model for abrasion by saltating bedload. In the 'saltation-abrasion model', having
too little sediment inhibits denudation because few clasts impact the bed (the 'tools effect'), but having too
much sediment causes deposition, shielding the bed and also inhibiting denudation (the 'cover effect'). For
given flow conditions the highest denudation rate occurs at the balance point between minimum bed
cover and maximum bed impacts. Sklar and Dietrich (2001) validated the tools and cover concepts by
experimentally abrading flat rock disks. The saltation-abrasion model suggests that the rate of channel
incision into bedrock is always influenced by both bedrock detachment and sediment transport, and
therefore that neither transport-limited nor detachment-limited conditions can be entirely met when the
channel is incising. In the saltation-abrasion model, TL conditions correspond to complete bed cover with
incision rate going to zero. The DL end-member does not directly correspond to any part of the saltation-
abrasion model, although low sediment supply and strong bedrock emphasize detachment controls.
Another interesting and counterintuitive prediction of the saltation-abrasion model is that at high transport
stages �/�� ≫ 1, where � is basal shear stress and �� is the critical shear stress necessary to initiate
sediment motion), denudation rate decreases with increasing shear stress because saltation hop lengths
increase more rapidly than particle impact velocities.

3
The experimental design was inspired by some predictions and limitations of the saltation-
abrasion model. The saltation-abrasion model incorporates flow and sediment transport physics that are
satisfyingly quantitative, but this physical rigor comes at the price of several simplifying model
assumptions (e.g. planar channel bed, single sediment size) that are rarely met in natural channels. In
these experiments it is evaluated that the planar bed assumption by observing denudational feedbacks that
create bed roughness and that in turn influence denudation rates. It is focused on understanding the tool-
starved end of parameter space (where sediment flux �� is significantly smaller than transport capacity ��) because (1) tool-starved conditions naturally lead to the development of rough bed topography, (2)
saltation-abrasion model predictions are arguably furthest from either transport-limited or detachment-
limited model behaviors in this range and (3) Sklar and Dietrich (2002) and Davis et al. (2005) explore
the behavior of sediment cover effects closer to transport-limited conditions in similar flume experiments.
It is also demonstrated that at least some sculpted denudational forms (Richardson and Carling, 2005) are
robust morphologies that naturally develop in flume settings as well as in the field.
Regardless of whether a river is dominantly alluvial or dominantly bedrock, many feedbacks exist
between channel morphology and denudational and depositional processes that limit the ability to predict
channel response (see, e.g., Wohl, 1993, 1998; Dietrich et al., 2003; Jerolmack and Mohrig, 2005). Many
properties of channel morphology and bed state can adjust to imposed conditions, including flow width
and depth (for a given discharge), slope, bed roughness, bedrock exposure and sediment size (Leopold
and Maddock, 1953; Stark and Stark, 2001; Montgomery and Gran, 2001; Stark, 2006). The functional
relationships between these variables are poorly understood, and yet they govern the internal dynamics of
fluvial channels. For example, what are the positive and negative feedbacks that set the roughness of
eroded bedrock channels, and how does this roughness influence channel slope or width? Field data
demonstrate that correlations between channel width and slope can significantly influence calculated
parameters such as the reach-averaged bed shear stress (Finnegan et al., 2005), and yet causality between
variables remains elusive.
While possible feedbacks in the dynamics of bedrock channel incision remain largely unexplored,
many prior studies have interpreted the significance of elegant denudational forms (e.g. potholes, flutes,
scallops, inner channels) that develop during channel incision into bedrock or cohesive sediment
(Alexander, 1932; Wohl, 1993; Zen and Prestegaard, 1994; Wohl et al., 1999; Springer and Wohl, 2002).
Richardson and Carling (2005) propose a classification scheme for fluvially sculpted bedrock forms.
Experimental work has been done to understand the flow and sediment conditions that create
denudational morphologies. Of particular relevance, Allen (1971) quantitatively explored feedbacks
between stable vortices and particular denudational forms (including flutes, scallops and longitudinal
grooves) formed in cohesive mud and rock. Longitudinal grooves and inner channels with undulating
walls were the primary denudational morphologies formed by sand abrasion into a cohesive substrate by
Shepherd and Schumm (1974) and Wohl and Ikeda (1997). In the latter study denudational morphology
changed with bed slope, demonstrating that the formation of sculpted forms does not require substrate
heterogeneity, but can also develop simply from the internal dynamics of bedrock channel erosion. The
influence of this smaller-scale fluvial sculpting on flow and denudation in the channel as a whole is
poorly understood.
As will be shown, denudational morphologies formed in the experiments bear a strong
geometric resemblance to a variety of sculpted forms observed in many natural bedrock channels
(Richardson and Carling, 2005), including incised ephemeral streams in the Pachmarhi, India. The
experimental flume conditions are a good analog to this field site because (1) the Sandstone bedrock is
homogeneous and un fractured but weak, similar to the experimental substrate, (2) abrasion is clearly the
dominant denudation mechanism in the Sandstone and (3) the natural channels with comparable
denudational forms tend to be small and sediment starved with extensive bedrock exposure. In the
present work, it is studied that feedbacks between denudation rate, sediment transport and denudational
morphology using laboratory flume data. It is explored, at least conceptually, what feedbacks and what
level of complexity should be incorporated into channel incision models to better recreate the morphology
and dynamic behavior of channel incision.

4
Methods
A series of laboratory flume experiments were conducted using sediment transported in turbulent
flow to abrade brittle synthetic 'bedrock' at the Jaypee Laboratory Rewa (JPLR). The experiments focused
on sediment-starved conditions expected from theory (Sklar and Dietrich, 2004) to exhibit less rapid
denudation at higher transport stages. Following Wohl and Ikeda (1997), and Joel et al (2006) bed slope
was the main variable that was changed; sediment flux and water flux were primarily held constant.
An adjustable slope was used, non-recirculation flume ~5 m long and 40 cm wide. The erodible
substrate ('bedrock') was a 15:1 by weight mixture of sand and Portland cement (type I/II), mixed in a
cement mixer and allowed to cure in the flume. Due to time constraints the concrete mixtures were only
allowed to cure for approximately 5 days before starting each experiment. Concrete strength increases
rapidly at first and most strength is achieved after approximately 28 days. Based on typical logarithmic
concrete curing curves (e.g. Nelson, 2003), it was estimated that after 5 days the concrete reached roughly
75 per cent of its 28 day compressive strength. Following curing each experiment was completed within
~2 days; the strength may have increased by as much as 5-10 per cent over this time period. The control
of concrete strength within and between runs is relatively poor and would benefit from independent
measurements of material properties during the experiments. A new concrete mix was made for each
experiment. Although weak, the sand and cement 'bedrock' failed by brittle fracturing. In contrast, the
damp cohesive clay and sand mixtures eroded by Shepherd and Schumm (1974) and Wohl and Ikeda
(1997) probably failed by plastic shearing, making them less ideal bedrock analogues. Studies of the
abrasion of brittle materials (such as glass plates) by micro-fracturing due to particle impacts find that to
first order the rate of denudation should scale inversely with the square of tensile strength (discussed by
Sklar and Dietrich, 1998, 2004). Sklar and Dietrich (2001) showed that the scaling between laboratory
abrasion rates and tensile strength is consistent between natural lithologies and sand/cement mixtures
such as ours, justifying its use as an analog material in denudation experiments.
Five separate flume experiments were conducted overall; here it is primarily report that the data
from three plane-bed experiments with bed slopes of 2, 5 and 10 per cent, which were the third, second
and fourth runs conducted respectively. The first experiment was intentionally an exploratory run using
different sediment sizes and fluxes; the initial bed topography (mean slope 5%) was sculpted by hand into
a non-uniform surface with several prominent bulges. The next three experiments which is focused on all
started with planar bed surfaces. Finally, the bed topography of the fifth flume run was molded with a
series of small vertical flume-spanning steps (mean slope 10%). Overall, the first and last experiments
showed the same basic feedbacks between denudation and bed topography as the initially planar-bed runs.
A sediment feeder (Tecweigh CR12) distributed fine gravel (D50 = 2-50 mm; D10 = 1-68 mm; D90
= 3.76 mm) at the upstream end of the flume primarily at 68 g/s (245 kg/hr). Sediment fell onto a diffuser
to spread it approximately uniformly across the flume width. Water discharge was primarily held constant
at 45 L/s, and was continuously monitored at a V-notch weir downstream of the flume. The end of the
flume was elevated above the floor, and water jetted off unobstructed. At the downstream flume end the
concrete substrate was molded into a vertical step, which eroded down gradually during the experiment.
In this manner, baselevel was not fixed artificially but adjusted itself with erosion. Water did not
accelerate much as it approached the drop-off at the flume end because flow was supercritical. Because of
denudation the flume slope down the axis of the eroded inner channel increased slightly during the flume
runs, although bed roughness also increased significantly. Average water velocity was calculated at the
beginning of each experiment from flow depth, width and discharge. There is no local velocity
measurements as the experiments progressed, so spatial and temporal deviations from the mean sediment
and water flow rates were only qualitatively observed.
Flow was supercritical (Table I) with Froude numbers �� from ~1-4 to ~2.5 with increasing
flume slope and constant discharge. It is acknowledged that this range is higher than is likely common in
natural channels, even at flood stage, although Tinkler and Parrish (1998) report field measurements of Fr
around 1-7-1-9 for flow along a 40 m reach during a moderate flood in a natural river. They conclude that
near-critical, critical and supercritical flows are likely common during floods and that subcritical flow is
probably rare along the channel thalweg. Grant (1997) argues that natural channel morphology may adjust

5
to attain �� ~ 1 on average, although this may commonly occur with spatial transitions back and forth
between subcritical and supercritical flow. The most appropriate natural comparison to our
Table I. Summary of initial experimental flow and sediment transport conditions at the beginning of each
experiment. There is no velocity measurements once denudational topography developed. A flume width of
40 cm with a rectangular cross section was used in calculations. Flow depth was measured at the beginning of
the 5 and 10 per cent slope experiments when the bed was planar, and mean velocity was calculated from this
and the discharge, continuously monitored at a weir. Flow depth was inadvertently not measured at 2 per
cent slope, and so a flow depth was calculated for this experiment using a range of Manning's � values
suggested by Manning's � values calculated from the other experimental runs. Mean shear stress and
sediment transport capacity were calculated using the depth-slope product (including hydraulic radius, width
0-4 m), sediment flux � = 0-068 kg/s, no dimensional critical shear stress ��∗ = 0-03 and the bed load sediment
transport equation given by Fernandez Luque and van Beek (1976, presented by Sklar and Dietrich, 2004)
Mean slope 2 per cent 5 per cent 10 per cent
Manning's N 0.18-0.02, estimated 0.019 0.021
Flow depth, cm 8-9, calculated 6.8 (6-7) 5.7
Mean velocity, calculated, m/s 1.3-1.2 1.6 1.9
Froude number 1.3-1.5 1.9 2.5 �, Pa, calculated 12 25 44 �∗ calculated 0.32 0.68 1.2
Trans. stage, �∗/�∗� 11 23 39 ��, trans. cap, kg/s 0.42 1.4 3.4 � /�� 0.16 0-048 0.020
high �� experiments may be over steps and steep reaches where bedrock is most exposed and abrasion
(where applicable) most clearly a rate limiting process. Shepherd and Schumm (1974) report �� between
0-66 and 1-02 for their denudation experiments, while Wohl and Ikeda (1997) reached �� between 1-1
and 1-6. Denudational morphologies and the formation of inner channels in their experiments were
similar to ours, suggesting �� sensitivity may be minor. Future work should explore the sensitivity of the
results to Fr; it is possible that standing waves, hydraulic jumps and changes in shear stress associated
with transitions about �� ~ 1 could be significant in focusing erosion.
Surface topography of the eroding bed was quantitatively measured from photographs taken with
a Nikon D100 digital camera oriented 45 degrees from a vertical line laser (Figure 1). The oblique images
were corrected for perspective distortion and the red laser lines that defined cross-stream topographic
swaths were automatically extracted using Matlab image processing techniques (Kovesi, 2000). It is
estimated that the uncertainty on the elevation measured at each location to be ±1 mm at 95 per cent
certainty (two standard deviations). It was profiled that a 3 m long, 30 cm wide stretch of the flume at a
downstream spacing of 3 cm and cross-stream spacing of 0-25 mm. The narrow tortuous grooves that
developed caused significant data dropouts due to obstructed views of the line laser. The amount of
denudation in a given time step is known by differencing sequential topographic maps. Complete
experiments lasted 79 hours of run time, with surface topography measured at intervals between 30 and
60 minutes (Table II).

6
Figure 1. (a) Denudational morphology during the 10 per cent slope experiment, looking upstream. The
trapezoidal photograph shape of the picture is a correction for oblique distortion. The two bright lines are
from red vertical sheet lasers, which are extracted to give quantitative measurements of cross-section
topography. Flume width 40 cm. (b) This small natural inner channel incised into Sandstone in the
Pachmarhi Mountains has a similar morphology. Field of view ~ 1-5 m.
Table II. Water discharge and sediment flux of each sequential timestep for which topography was measured.
In order to roughly compare timesteps with different sediment fluxes, it was calculated, what the 'effective'
timestep duration at 68g/s sediment flux would be by assuming a linear relationship between sediment flux
and erosion. For example, � = 122 g/s for 30 minutes corresponds to (122/68) × 30 = 54 minutes effective run
time. In the 5 per cent slope experiment the initial two time periods at low water discharge were not included
in the effective timestep calculations, as the bed aggraded with negligible erosion. Most timesteps are directly
comparable. Note that denudation rate (cm/hr) is plotted in Figure 4, rather than denudation depth (cm)
given here. Mean denudation in each timestep was calculated over a flume width of 30 cm. Inner channel
denudation was calculated over a 1 cm wide swath chosen by eye in each timestep to follow the developing
and migrating inner channel
Timeste
p
Duration
(min)
�� �/ � �/ interface
width (cm)
denudation
depth (cm)
mean
denudation
depth (cm)
2% slope
1 40 43 68 0.10 0.12 0.26
2 50 43 68 0.20 0.16 0.46
3 50 43 68 0.31 0.I6 0.46
4 50 43 68 0-42 0.14 0.49
5 40 43 68 0.46 0.08 0.32
6 40 43 68 0.53 0.10 0.44
7 60 43 68 0.64 0.15 0.67
8 60 43 68 0.74 0.12 0.56
5% slope
5 7-5 68
14 7-5 122
30 43 122
1,
effective
54 43 68 0.40 0.37 1.28
2 30 43 68 0.64 0.21 1.12

7
3 30 43 68 0.85 0.18 1.25
4 30 43 68 1.02 0.16 0.93
5 30 43 68 1.I5 0.12 0.65
6 30 43 68 1.26 0.12 0.59
7 60 43 68 1.40 0.23 0.78
8 60 43 68 1.54 0.19 0.88
9 60 43 68 1.80 0.16 0.88
10a 30 43 122
10b 2-5 43 14
10c 2 43 27
10d 1-5 43 41
10e 2 43 54
10f 2 43 68
10g 2.5 43 81
10h 1 43 95
10,
effective
64 43 68 1.98 0.15 0.76
10%
slope
Ia 4 43 122
Ib 37 43 68
1,
effective
44 43 68 0.16 0.24 0.45
2 45 43 68 0.39 0.25 0.91
3 43 43 68 0.64 0.23 1.07
4 45 43 68 0.89 0.24 1.25
5 45 43 68 1.06 0.22 0.94
6 45 43 68 1.25 0.16 0.96
7 45 43 68 1.43 0.14 0.98
8 45 43 68 1.61 0.13 0.90
9 45 43 68 1.75 0.12 0.89
10 45 43 68 1.96 0.12 0.98
As Figure 1 indicates, the flume bed did not remain planar but eroded to form significant topography. It
was characterized the rough topography at a given timestep as an 'interface width' w, a metric used to
quantify changes in average surface roughness (Barabasi and Stanley, 1995):
� �, � = √1� ∑[ℎ �, � − ℎ̃ � ]��=
where � is time, i is a spatial index, � is the total number of measurements, h is the surface height at a
given location and time and the overbar represents a spatial average. Note that � is simply the standard
deviation of surface elevations at a given timestep, making it an intuitive measure of how much elevation
varies about the mean elevation. To compare different experiments it was subtracted the initial,
approximately planar surface of each experiment from sequential eroded surfaces so that w starts at zero
when comparing different experiments.
Results
Figure 2(a)-(d) shows cumulative denudation depth in several sequential timesteps starting with a
plane bed at 10 per cent slope. As the bed topography evolved it was observed that corresponding changes

8
in the spatial distribution of transported sediment. Sediment entered the channel, uniformly distributed
across the width, ~50 cm upstream of the upstream end of the topography map. In the initial timestep
(2(a), 44 min run time) denudation was broadly distributed across the width of the plane bed channel.
Sediment was similarly distributed across the channel width and moved as energetic bedload. By the
second timestep (2(b), 90 min), a gently sinuous incised groove with semi-periodic lows approximately
25-40 cm apart ran most of the downstream length of the flume. Bedload became focused in these
topographic lows, presumably due to gravity, flow convergence and higher flow velocities. For the
remaining ~6 hours of the flume run, denudation was primarily focused in this inner channel (2(c), 2(d))
because of the positive feedback between the evolving topography and sediment channelization. Most
sediment hugged the inner channel bed, although local suspension occurred in stable turbulent eddies. No
deposition was observed. At 10 per cent slope a single incised inner channel formed (2(d)), whereas at 5
per cent slope (2(e)) a dominant inner channel developed but with more secondary transport pathways and
local lows. Incision progressed more slowly at 2 per cent slope (2(f)); when the run was stopped an inner
channel had developed in the downstream half of the flume, but denudation was distributed relatively
broadly over the flume width. Later timesteps at 2 per cent slope looked similar to earlier, less incised
timesteps at both 5 and 10 per cent slope.
By the end of the experiments at 5 and 10 per cent slope, the tortuous inner channels had
undulating walls (Wohl, 1998; Wohl et al., 1999) and tight lateral bends including dramatic undercuts. In
addition to inner channels scoops were seen, wall undulations and potholes that morphologically match
those seen in many natural bedrock channels, particularly in the Pachmarhi Mountains, (Figures 1 and 3).
The geometric similarity between a variety of field and flume sculpted forms suggests that the laboratory
experiments are reasonable recreations of at least some aspects of natural channel abrasion. Figure 3(a),
(b) compares flume and field inner channels. Note the local highs and lows in bed elevation along the
inner channel. Figure 3(c) shows denudation around an initial bulbous mound molded into the flume bed
of the first (exploratory) flume run. Water flowed over the top of the mound; the bed-hugging sediment
bifurcated around the mound, following the horseshoe flow vortex and preferentially eroding the bottom
and sides. Figure 3(d) shows similar geometry of a trough presumably sculpted by a horseshoe vortex
around a protrusion in a Pachmarhi Mountains channel. Arrows point to two of seven bolts that are
currently used to monitor denudation (Johnsonet al., 2005).
Potholes in both natural channels and the experiments often have spiral grooves down the sides
(Alexander, 1932; Zen and Prestegaard, 1994; Wohl, 1993; Hancock et al., 1998; Whipple et al., 2000;
Springer and Wohl, 2002; Springer et al., 2005). Figure 3(e), (f) shows two views from above of a 5-6 cm
diameter flume pothole. By the timestep shown the pothole had eroded to the flume bottom. Note the
spiral grooves down the inside. In comparison, Figure 3(g) shows a natural pothole with similar incised
inlet and outlet grooves. Figure 3(h) shows a ~2 m diameter natural pothole with spiral grooves down the
inside. In the experiments, potholes were eroded by sediment that entered as bedload but then became
locally suspended by the upward-directed flow exiting the pothole. No static sediment accumulated in
potholes. Potholes formed in the 10 per cent slope experiment but not at 5 or 2 per cent slopes. Once
formed, potholes were denudational ly significant: in one timestep, the approximate denudation rate at
the bottom of one pothole (diameter 5-6 cm, eroded depth 7 cm in <45 minutes) was 50 times larger than
the flume average, or ~1/5 of the measured volume eroded from the rest of the flume.
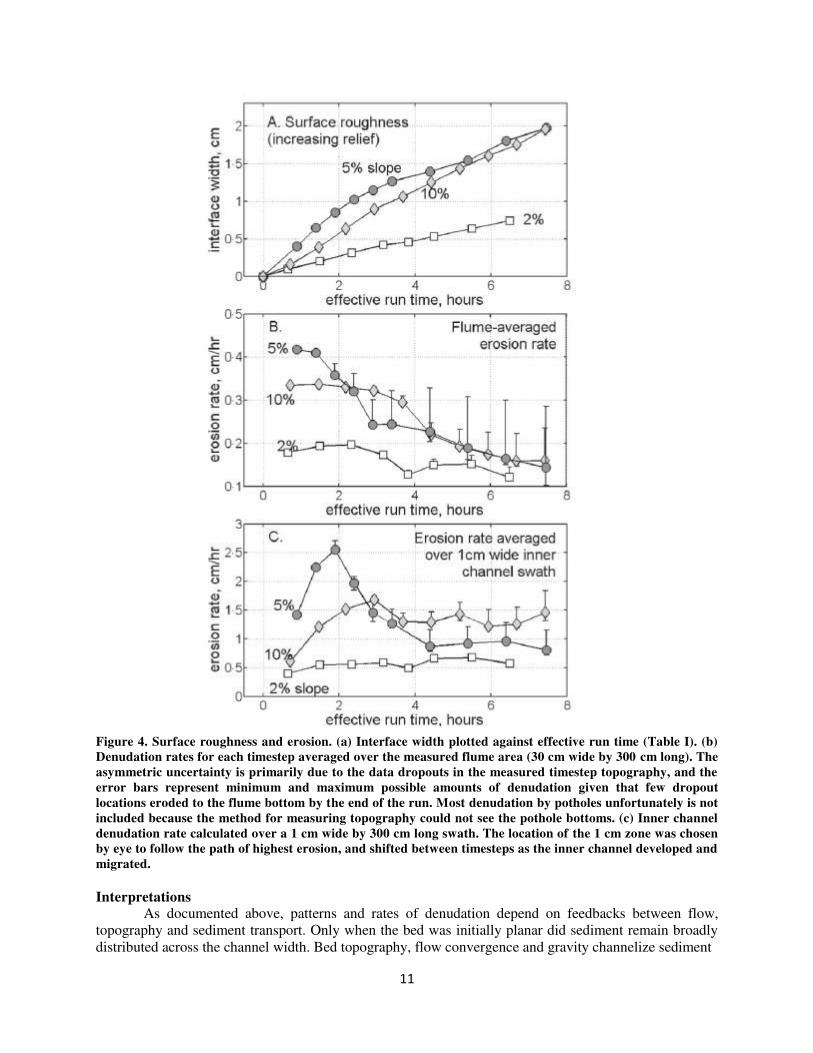
Denudation rates progressed differently at 2, 5 and 10 per cent slopes. Figure 4(a) shows that
interface width increases monotonically with run time, because the topographic lows erode while the
upper surface remains less incised. As relief and roughness increased from the starting plane-bed
condition, average flume-wide vertical denudation rates decreased (Figure 4(b)). However, when
denudation is averaged only over a 1 cm wide swath that follows the shifting zone of focused denudation
(the developing inner channel), a somewhat different picture emerges (Figure 4(c)): at 5 and 10 per cent
initial plane-bed slope, denudation rates in the first several timesteps increased in the zone of focused
denudation as sediment was

9
Figure 2. Cumulative denudation depth since beginning of experiment. See text for descriptions. Flow is from
bottom (0 cm) to top (250+ cm). Note differences in color-bar scaling between plots. Data dropouts are black
(no data). The middle 30 cm of the 40 cm flume width is shown. (a) 10 per cent slope, run time 44 minutes. (b)
10 per cent slope, 90 minutes total run time. (c), (d) 10 per cent slope, after 2-9 and 6-7 hours of total run time
respectively. (e) 5 per cent slope, 6-4 hours of run time. (f) 2 per cent slope, 6-5 hours of run time.
channelized by topography into a narrower and deeper zone. As focused incision continued the inner slot
narrowed, and denudation rates decreased and then stabilized in response to locally increasing sediment
flux and flow resistance.
Figure 5(a) shows the progression of denudation and variable bed topography in sequential
timesteps of a 10 per cent slope channel cross-section. Denudation is broadly distributed initially but
becomes focused in an inner channel. Local lows tend to preferentially erode faster. Figure 5(b) shows
that the eroding bottom topography at 10 per cent slope developed semi-periodic lows that migrated
downstream. The amplitude of the topography grows consistently during the experiment as focused
incision forms an inner channel. Note the overall downstream migration of areas with focused erosion.
The downstream migration rates of the topographic lows are approximately 2-5-4 cm/hr, somewhat faster
than the vertical incision rates (Figure 4(b), (c)).

10
Figure 3. Comparisons of denudational features formed in flume and field. All the field photographs are
channels and canyons draining the Pachmarhi Mountains that have incised into the relatively weak but
unfractured Sandstone. (a) Oblique view looking downstream at the end of the 10 per cent slope flume
experiment. Compare with 2(d). Flume width 40 cm. (b) A natural inner channel formed. (c) View from
above of experimental denudation around a broad protrusion molded into the bed of the first flume run.
Flume width 40 cm. (d) Similar geometry of a trough in a Pachmarhi Mountains channel, initial condition
unknown. White patches are pulverized rock from drilling bolt holes for denudation monitoring. (e), (f) Two
views of a pothole formed in the fifth flume run in which the bed was molded to have vertical steps; the
pothole occurred where the bed was initially horizontal and planar. Pothole diameter 5-6 cm; overall bed
slope 10 per cent. (g) Field pothole (diameter ~ 60 cm) partially filled with sediment clasts. (h) Natural
pothole, diameter ~2 m. This pothole is from the cascade of potholes shown in Figure .
11
Figure 4. Surface roughness and erosion. (a) Interface width plotted against effective run time (Table I). (b)
Denudation rates for each timestep averaged over the measured flume area (30 cm wide by 300 cm long). The
asymmetric uncertainty is primarily due to the data dropouts in the measured timestep topography, and the
error bars represent minimum and maximum possible amounts of denudation given that few dropout
locations eroded to the flume bottom by the end of the run. Most denudation by potholes unfortunately is not
included because the method for measuring topography could not see the pothole bottoms. (c) Inner channel
denudation rate calculated over a 1 cm wide by 300 cm long swath. The location of the 1 cm zone was chosen
by eye to follow the path of highest erosion, and shifted between timesteps as the inner channel developed and
migrated.
Interpretations
As documented above, patterns and rates of denudation depend on feedbacks between flow,
topography and sediment transport. Only when the bed was initially planar did sediment remain broadly
distributed across the channel width. Bed topography, flow convergence and gravity channelize sediment

12
Figure 5. Measurements of sequential denudational topography at 10 per cent slope. (a) Sequential timesteps
for a single flume cross-section at approximately 204 cm in Figure 2(a)-(d). (b) Interface width (Equation (I))
at each flume cross section plotted against time. Shown here is the upstream half of the flume; downstream in
this experiment (10% slope) the inner channel became too incised to obtain accurate interface widths at every
cross section due to significant overhangs and undercuts. It is unsure of what sets the wavelength.
into interconnected and eroding local lows causing the local sediment flux to increase, while the local
sediment transport capacity decreases due to increased flow resistance in the developing inner channel.
Local denudation rate clearly depended on the local sediment flux. It was qualitatively interpreted that the
increase and then decrease in inner channel denudation rates (Figure 4(c)) to reflect first tools and then
cover effects (Sklar and Dietrich, 1998, 2004), with increasing and decreasing denudational efficiency as
the local ratio of sediment flux to transport capacity ��/�� increases. The saltation-abrasion model uses
width-averaged values of transport capacity and sediment flux. For a given discharge and sediment flux it
predicts a single denudation rate, in contrast to the observations (Figure 4(b), (c)). Slope and partial bed
cover are two degrees of freedom for channel response explicitly incorporated into the saltation-abrasion
model. However, the saltation-abrasion model assumes plane bed geometry, and so does not incorporate
the morphological degree of freedom that leads to significant denudation rate changes in these
experiments.
An intriguing prediction of the saltation-abrasion model is that denudation rates will drop at high
shear stresses (when all else is held equal, as in this experiments) because the modest increase in vertical
impact velocity with increasing shear stress does not compensate for the decreasing number of particle
impacts per area as the saltation hop length also increases. The initial rate of focused incision is greater at
5 per cent slope than at 10 per cent slope, which may be consistent with this hypothesis (Figure 4(b), (c)).
For the average sediment transport conditions calculated at the beginning of the experiments (Table I), the
saltation-abrasion model does predict higher denudation rates at 5 per cent slope than at 10 per cent slope,

13
but also predicts the highest denudation rates at 2 per cent slope, in contrast to the observations. This is
true whether or not suspension effects are included in the saltation-abrasion model calculations (Sklar and
Dietrich, 2004).
Topographic controls on flow and sediment transport
The decline in denudation rate at high shear stress predicted by the saltation-abrasion model may
not apply once significant bed topography has developed. It is interpreted that the developing bed
topography influenced flow, sediment transport and denudation in several ways. First, rough bed
topography changes the flow field. Evolving bed topography and channel morphology (slope, width etc.)
control the spatial and temporal distribution of local shear stress (see, e.g., Stark, 2006). The increased
roughness from sculpted forms is likely to reduce the local shear stress in the zone of active sediment
transport and erosion, due to increased form drag (Wohl and Ikeda, 1997; Wohl, 1998; Wohl et al., 1999).
This would reduce the sediment transport capacity of the local flow. It is emphasized that no
measurements of changes were made in flow resulting from rough topography; it was only only infered
this likely feedback between flow and topography.
Second, rough topography controls the spatial distribution of sediment transport. Patterns of
abrasion will not match patterns of shear stress because flow expends energy through friction on the
sidewalls but abrasion only occurs where sediment impacts the boundary. Sediment becomes focused in
local topographic lows because of lateral slope-dependent transport due to gravity. Initially in the
experiments the bed was nearly planar and so lateral transport was weak, but early timesteps still
demonstrate preferential denudation of lows, which gradually become interconnected by erosion.
Sediment is dominantly transported downstream, and so the local sediment flux depends on the upstream
bed topography and sediment transport field. The relationship between bed shear stress and denudation
rate is an explicit function of the sediment transport field, which is in turn mediated in complex ways by
the evolving bed topography. Additional feedbacks can also occur between denudation and sediment
transport; Davis et al. (2005) conducted similar flume experiments over a wider range of average ��/��
They found that higher relative supply produced less eroded roughness for initially planar beds, but had
the
opposite effect on initially rough beds because sediment deposited in the topographic lows and
denudation only attacked higher exposed points.
Third, rough topography controls the energetics of sediment impacts. Once developed, the
frequency of particle impacts will probably scale with various aspects of the bed topography rather than
with the saltation hop length as assumed in the saltation-abrasion model. For example, tight curves along
the tortuous inner channel (Figures 2(d), (e) and 3(a)) lead to spatial accelerations of both flow and
sediment, focusing abrasion on the outside walls of bends. The quasi-periodic topographic lows shown in
Figure 5 are another example of topographic control on sediment impacts. The downstream translation of
the local lows indicates preferential abrasion on upstream faces. Energetically, sediment grains will often
impact the boundary at velocities far exceeding the settling velocity, especially when incipiently
suspended. Visual observations suggest that the most denudational conditions in the experiments (e.g.
pothole formation) occurred when the sediment, primarily traveling as bedload, became incipiently
suspended by local turbulent flow conditions. In the 10 per cent slope experiment potholes formed
suddenly once the eroding topography created a vertically oriented stable vortex in the flow. In contrast,
at 5 per cent slope tortuous flow conditions in the inner channel led to complex patterns of three-
dimensional erosion, but never formed stable vertical vortices or potholes. It is suspected that at 10 per
cent slope a threshold had been exceeded due to local topography, flow and incipient sediment
suspension, allowing the potholes to form and greatly enhancing the local denudation rate, consistent with
field observations (Whipple, 2004; Barnes et al., 2004).
The saltation-abrasion model was intentionally constructed to represent bedload impacts only,
and so denudation decreases to zero in the model as sediment grains approach the threshold of
suspension. Previous studies have often inferred that the complex geometries and sharply eroded edges of
sculpted morphologies such as flutes and potholes require tight coupling between flow vorticity and

14
sediment transport, and therefore imply that suspended sediment rather than bedload is responsible for the
denudation (Alexander, 1932; Wohl et al., 1999; Whipple et al., 2000). While this interpretation is
probably correct, the suspension need only reflect local turbulent conditions, not width- or reach-averaged
values. If one were to calculate the mode of transport for different sediment size classes using width-
averaged parameters such as the mean shear stress, the smaller end of the bedload class would be most
likely to become incipiently suspended by local turbulence. A testable hypothesis is that impacts from
sediment incipiently suspended by stable flow vortices are the most erosive, i.e. remove the most material
per impact or per unit mass of sediment in that size class.
Transport-limited bed morphology
In the experiments, the channel apparently evolved towards a transport-limited bed morphology.
It was qualitatively tested that this hypothesis in the 5 per cent slope experiment: a small increase in
sediment feed rate led to rapid static alluviation of the inner channel, while a small decrease in sediment
feed rate led to renewed inner channel incision of an even narrower slot. The entire channel could
transport more sediment, so the entire channel is not at its transport capacity, but in the experiments the
fraction of channel actually transporting sediment (i.e. the inner channel) approached transport-limited
conditions rather quickly. Shepherd and Schumm (1974) and Wohl and Ikeda (1997) observed sediment
deposition in their experimentally eroded inner channels, suggesting that denudation in their experiments
also led to transport-limited conditions. Denudational bedforms and undulating canyon wall
morphologies dissipate flow energy (Wohl and Ikeda, 1997; Wohl, 1998; Wohl et al., 1999) and are
probably key components in reaching transport-limited conditions. In spite of suggestions of transport-
limited conditions in this experiments, denudation rate never went to zero in the inner channel (Figure
4(c)) as predicted by the saltation-abrasion model for ��/�� ~ 1. This may indicate that the
formulation of the cover effect is incomplete in the saltation-abrasion model. In the experiments, abrasion
may have continued intermittently under a coherent carpet of moving sediment, or intermittent suspension
and locally focused denudation in the tortuous inner channel may account for denudation rate not
dropping to zero and varying with flume slope.
The experiments suggest that sediment cover effects may become dominant at even lower ratios
of width-averaged sediment flux to sediment transport capacity ��/�� than the saltation-abrasion
model predicts. Sklar and Dietrich (2004, 2006) suggest that most incising channels may be in the cover-
dominated side of parameter space. Based on the feedbacks it was found, it is plausible that the first-order
behavior of a wide range of incising bedrock channels is even closer than they infer to the cover end-
member of the saltation-abrasion model where channels behave as transport limited, even in cases where
denudational morphologies are dramatic and channels appear sediment starved.
Inner channel formation and channel width controls
Inner channel formation can naturally result from the positive feedbacks it was described between
sediment transport, denudation and topography that focus local incision. Along a Pachmarhi bedrock
channel with variable denudational morphologies, Wohl (1993) documented that inner channel locations
correlated with higher channel gradients, consistent with the feedback proposed. In general, inner
channels may often indicate low sediment load relative to the width-averaged transport capacity of the
flow - i.e. sediment-starved conditions. Further study may allow flow and sediment transport conditions
to be constrained from specific denudational forms (Allen, 1971; Zen and Prestegaard, 1994; Richardson
and Carling, 2005).
Inner channel development also gives insight into width controls of bedrock channels - if incision
had continued indefinitely, all of the sediment and flow would eventually have been contained in the
narrow slot. Inner channel width in the experiments seemed to increase with increasing ��/�� although
focused undercutting and bed topography in the inner channel makes it hard to definitively pick out width
relations from these data. A testable hypothesis is that bedrock channel width is a dominant component of
the morphological adjustment towards transport-limited conditions ��/�� ~ 1). As such, width should
decrease with increasing slope if sediment flux remains the same (e.g. if it is limited by the supply from a

15
lower slope reach upstream) but shear stress and transport capacity increase, qualitatively consistent with
the slope-width scaling of Finnegan et al. (2005).
The experiments show that the evolving denudational morphology of the channel boundary can
significantly affect denudation rates. Acknowledging that channel adjustment involves more than just
vertical incision and slope changes, Stark and Stark (2001) lumped the dynamic factors that collectively
define channel morphology into a variable called channelization, which abstractly 'represents the ease
with which sediment can flux through a channel reach'. In their model, a local channel reach is
equilibrated when its slope and channelization value combine to just transport the local sediment flux.
The results are consistent with this approach. However, the channelization parameter does not define any
functional relationships between the relevant components of channel morphology. Understanding the
sediment flux and channel slope relations that lead to inner channel formation are a step in this direction.
Experimental idealizations and natural channel complexity
The idealized experiments intentionally neglect many complexities, including other denudation
processes (e.g. hydraulic plucking), higher sediment fluxes, a broad distribution of sediment sizes and a
wide distribution of flow magnitudes. These factors may explain a broader range of observable channel
morphologies in actively incising landscapes, but may also limit the strength of expression of the
proposed feedbacks in natural channels. The hope with this work is to document and understand basic
feedbacks between denudational topography and sediment transport under conditions where the feedbacks
are expressed most prominently (single constant discharge, sediment flux and sediment size). These same
feedbacks between channel morphology and denudation should still exist in all channels even if they are
sometimes overwhelmed by additional complexities and local conditions. For example, bedrock will
rarely if ever be able to erode quickly enough to reach a transport-limited morphology during floods,
although patterns of denudation will at least tend in that direction. Quick and complementary bed
adjustments can also occur by sediment entrainment and deposition. Natural channel morphology will
always represent an amalgamation of discharge and sediment transport magnitudes and durations.
The importance of variable flood discharge will be closely connected to the size distribution of
sediment available for transport into and through the channels. The largest floods are likely responsible
for transporting the coarsest sediment that becomes immobile at lower flows (e.g. Howard, 1998),
armoring the bed. Coarse sediment is often the dominant bed roughness element, rather than in situ
bedrock. In large, actively incising channels such as the Indus River (Hancock et al., 1998; Whipple et
al., 2000) boulders often erode in place, presumably until they are small enough to be transported in a
flood. Field observations of bedrock channels and canyons in many places (e.g., Wohl, 1992; Howard,
1998; Massong and Montgomery, 2000; Barnes et al., 2004; Johnson et al., 2005) show that inner
channels and entire 'bedrock' channels are often choked with coarse sediment, especially boulders. Sklar
and Dietrich (2002) conducted flume experiments with coarser sediment in channels close to transport
capacity, to explore transitions between bedrock exposure and sediment cover. In their experiments, an
inner groove began to incise where sediment transport was focused, but sediment then deposited in these
subtle topographic lows, showing that deposition is also sensitive to local topography. A wide distribution
of flood magnitudes and sediment sizes may spread denudation more broadly across the entire channel
width rather than focusing into a narrow inner channel as in the sediment-starved case.
Future experimentation should further explore details of the feedbacks is suggested here, focusing
on quantifying changes in local sediment flux and flow rate as the topography develops. In addition,
relations between developing bed roughness, denudation rate and slope should be explored further. It is
hesitant to push the comparisons between experiments too far in this preliminary data set because of
uncertainties including concrete strength between runs, topographic data dropouts in the inner channel
and exact flow conditions. Specific predictions of the saltation-abrasion model, such as decreases in
denudation rate explicitly tied to changes in saltation hop lengths, should be explored. Future
experimental work should also systematically explore parameter space with ranges of flow discharges,
relative sediment supply ��/�� sediment sizes and Froude numbers. There are hopes to address some
of these questions in ongoing flume experiments. The saltation-abrasion model explicitly incorporates

16
changes in bed cover in a physically reasonable way; more accurate models of incision will require a
better understanding and parameterization of additional internal dynamics (i.e. width, roughness, slope,
erosion) of fluvial channels.
Conclusions
When the transport capacity of flow in a channel is greater than the sediment load, the
nonuniform distribution of sediment impacts leads to no uniform abrasion. In this experiments, both the
mean and distribution of denudation rates change as the bed topography evolves, even with constant water
and sediment discharges. Bed topography is thus a degree of freedom for bedrock channel response that
mediates (1) the flow structure and local turbulent intensity, (2) the spatial distribution of sediment
impacts on the bed and (3) the rate and spatial distribution of fluvial erosion. Evidence was found to
support both tools and cover effects of abrasion by transported sediment, confirming the central
hypothesis of Sklar and Dietrich (1998, 2004), but in response to local sediment flux and shear stress, not
width- or reach-averaged values.
Bed topography is the dominant control on sediment impact location and intensity once
significant denudational relief develops. The relation between shear stress and denudation rate is non-
unique, and may vary significantly between different sculpted denudational morphologies. Potholes in
particular are extremely efficient erosive agents when they develop. Inner channels may indicate reach-
averaged sediment starved conditions (low ��/�� ) that lead to a spatial focusing of sediment transport
and erosion. While natural variability (e.g. a wide distribution of flood discharges and sediment sizes)
may obscure the expression of the proposed feedbacks in field settings, it is suggested that bedrock
channel roughness, often expressed as dramatic sculpted morphologies, tends to increase in amplitude
until enough turbulent energy is dissipated by form drag that the flow just transports the sediment load.
The experiments suggest that transport-limited conditions may sometimes occur even in sediment-starved
channels with negligible bed cover and dramatic, active denudational morphologies.
Reference
Alexander HS. 1932. Pothole erosion. Journal of Geology 40: 305-337.
Allen JRL. 1971. Transverse erosional marks of mud and rock: their physical basis and geological significance.
Sedimentary Geology 5: 165-385.
Barabasi AL, Stanley HE. 1995. Fractal Concepts in Surface Growth. Cambridge University Press: Cambridge.
Barnes CM, Sklar LS, Whipple KX, Johnson JP. 2004. Periodic spacing of channel-spanning potholes in Navajo
Sandstone, Henry Mountains Utah: implications for propagation of incision pulses across tributary
junctions. Eos Transactions AGU 85(47) Fall Meeting Supplement: Abstract H53C-1276.
Davis JR, Sklar LS, Demeter GI, Johnson JP, Whipple KX. 2005. The influence of bed roughness on partial
alleviation in an experimentalbedrock channel, Eos Transactions AGU 86(52) Fall Meeting Supplement:
Abstract H53D-0508.
Dietrich WE, Bellugi DG, Sklar LS, Stock JD, Heimsath AM, Roering JJ. 2003. Geomorphic transport laws for
predicting landscape form and dynamics. In Prediction in Geomorphology, Wilcock P, Iverson R (eds),
American Geophysical Union Geophysical Monograph 135:103-132.
Fernandez Luque R, van Beek R. 1976. Erosional and transport of bed-load sediment, Journal of Hydraulic Research
14: 127-144.
Finnegan NJ, Roe G, Montgomery DR, Hallet B. 2005. Controls on the channel width of rivers: implications for
modeling fluvial incision of bedrock. Geology 33: 229-232.
Gasparini NM, Bras RL, Whipple KX. 2006. Numerical modeling of non-steady-state river profile evolution using a
sediment-flux-dependent incision model. In Tectonics, Climate and Landscape Evolution, Willet SD,
Hovius N, Brandon MT, Fisher DM (eds), Geological Society of America Special Paper 398: 434.
Grant GE. 1997. Critical flow constrains flow hydraulics in mobile-bed streams: a new hypothesis. Water Resources
Research 33:349-358.
Hancock GS, Anderson RS. 2002. Numerical modeling of fluvial strath-terrace formation in response to oscillating
climate. Geological Society of America Bulletin 114: 1131-1142.
Hancock GS, Anderson RS, Whipple KX. 1998. Beyond power: bedrock river incision process and form. In Rivers

17
Over Rock: Fluvial Processes in Bedrock Channels, Tinkler K, Wohl EE (eds), American Geophysical
Union Geophysical Monograph 107: 35-60.
Howard AD. 1998. Long profile development of bedrock channels; interaction of weathering, mass wasting, bed
erosion, and sediment transport. In Rivers Over Rock: Fluvial Processes in Bedrock Channels, Tinkler K,
Wohl EE (eds), American Geophysical Union Geophysical Monograph 107: 237-260.
Howard AD, Dietrich WE, Seidl MA. 1994. Modeling fluvial erosion on regional to continental scales. Journal
of Geophysical Research-Solid Earth 99: 13 971-13 986.
Joel P. Johnson, Kelin X. Whipple 2006 Feedbacks between erosion and sediment transport in experi mentalbedrock
channels Wiley Inter Science (www.interscience.wiley.com) DOI: 10.1002/esp.1471
Howard AD, Kerby G. 1983. Channel changes in badlands. Geological Society of America Bulletin 94: 739-752.
James LA. 2004. Tailings fans and valley-spur cutoffs created by hydraulic mining. Earth Surface Processes and
Landforms 29: 869-882.
Jerolmack D, Mohrig D. 2005. Interactions between bed forms: topography, turbulence, and transport. Journal of
Geophysical Research -Earth Surface 110.
Johnson JP, Whipple KX, Sklar LS. 2005. Field monitoring of bedrock channel denudation and morphology. Eos
Transactions AGU 86(52) Fa llMeeting Supplement: Abstract H52A-01.
Kovesi PD. 2000. MATLAB and Octave Functions for Computer Vision and Image Processing. School of
Computer Science and Software Engineering, the University of Western Australia. http://www.csse.uwa
.edu.au / ~pk/research/matlabfns/ [2003].
Leopold LB, Maddock T. 1953. The Hydraulic Geometry of Stream Channels and Physiographic Implications, US
Geological SurveyProfessional Paper Report P 0252.
Massong TM, Montgomery DR. 2000. Influence of sediment supply, lithology, and wood debris on the distribution
of bedrock and alluvial channels. Geological Society of America Bulletin 112: 591-599.
Montgomery DR, Gran KB. 2001. Downstream variations in the width of bedrock channels. Water Resources
Research 37: 1841-1846.
Nelson PK. 2003. Handbook of Nondestructive and Innovative Testing Equipment for Concrete, final report.
Federal Highway Administration: Washington, DC.
Richardson K, Carling PA. 2005. A Typology of Sculpted Forms in Open Bedrock Channels, Geological Society of
America Special Paper 392.
Roering JJ, Gerber M. 2005. Fire and the evolution of steep, soil-mantled landscapes. Geology 33: 349-352.
Shepherd RG, Schumm SA. 1974. Experimental study of river incision. Geological Society of America Bulletin 85:
257-268.
Sklar L, Dietrich WE. 1998. River longitudinal profiles and bedrock incision models: stream power and the
influence of sediment supply.In Rivers Over Rock: Fluvial Processes in Bedrock Channels, Tinkler K,
Wohl EE (eds), American Geophysical Union GeophysicalMonograph 107.
Sklar LS, Dietrich WE. 2001. Sediment and rock strength controls on river incision into bedrock. Geology 29: 1087-
1090.
Sklar LS, Dietrich WE. 2002. Thresholds of alluviation in an experimental bedrock channel and controls on rates of
river incision intobedrock. Eos Transactions AGU 83(47) Fall Meeting Supplement: Abstract H12F-09.
Sklar LS, Dietrich WE. 2004. A mechanistic model for river incision into bedrock by saltating bed load. Water
Resources Research 40:W06301. DOI: 10.1029/2003WR002496
Sklar LS, Dietrich WE. 2006. The role of sediment in controlling steady-state bedrock channel slope: implications of
the saltation-abrasionincision model. Geomorphology 82: 58-83.
Springer GS, Tooth S, Wohl EE. 2005. Dynamics of pothole growth as defined by field data and geometrical
description. Journal ofGeophysical Research-Earth Surface 110: F04010. DOI: 10.1029/2005JF000321
Springer GS, Wohl EE. 2002. Empirical and theoretical investigations of sculpted forms in Buckeye Creek Cave,
West Virginia. Journal ofGeology 110: 469-481.
Stark CP. 2006. A self-regulating model of bedrock river channel geometry. Geophysical Research Letters 33:
L04402. DOI: 10.1029/2005GL023193
Stark CP, Stark GJ. 2001. A channelization model of landscape evolution. American Journal of Science 301: 486-
512.
Stock JD, Montgomery DR, Collins BD, Dietrich WE, Sklar L. 2005. Field measurements of incision rates
following bedrock exposure: implications for process controls on the long profiles of valleys cut by rivers
and debris flows. Geological Society of America Bulletin 117(1/2): 174-194.
Tinkler KJ, Parish, J. 1998. Recent adjustments to the long profile of Cooksville Creek, and urbanized bedrock

18
channel in Mississauga,Ontario. In Rivers Over Rock: Fluvial Processes in Bedrock Channels, Tinkler K,
Wohl EE (eds), American Geophysical Union Geophysical Monograph 107: 167-187.
Tomkin JH, Brandon MT, Pazzaglia FJ, Barbour JR, Willett SD. 2003. Quantitative testing of bedrock incision
models, Clearwater River,NW Washington State. Journal of Geophysical Research, 108 (B6): 2308. DOI:
10.1029/2001JB000862
Whipple KX. 2004. Bedrock rivers and the geomorphology of active orogens. Annual Review of Earth and
Planetary Sciences 32: 151-185.
Whipple KX, Hancock G, Anderson RS. 2000. River incision into bedrock: mechanics and relative efficacy of
plucking, abrasion, and cavitation. Geological Society of America Bulletin 112: 490-503.
Whipple KX, Tucker GE. 1999. Dynamics of the stream-power river incision model: implications for height limits
of mountain ranges,landscape response timescales, and research needs. Journal of Geophysical Research -
Solid Earth 104(B8): 17 661-17 674.
Whipple KX, Tucker GE. 2002. Implications of sediment-flux-dependent river incision models for landscape
evolution. Journal ofGeophysical Research-Solid Earth 107(B2): art. No. 2039.
Willett SD. 1999. Orogeny and orography: the effects of denudation on the structure of mountain belts. Journal of
Geophysical Research - SolidEarth 104(B12): 28 957-28 981.
Wohl EE. 1992. Bedrock benches and boulder bars: floods in the Burdekin Gorge of Australia. Geological Society
of America Bulletin 104: 770-778.
Wohl EE. 1993. Bedrock channel incision along Piccaninny Creek, Australia. Journal of Geology 101: 749-761.
Wohl EE. 1998. Bedrock channel morphology in relation to denudational processes. In Rivers over Rock; Fluvial
Processes in Bedrock Channels, Tinkler KJ, Wohl EE (eds), American Geophysical Union Geophysical
Monograph 107: 237-260.
Wohl EE, Ikeda H. 1997. Experimental simulation of channel incision into a cohesive substrate at varying gradients.
Geology 25: 295-298.
Wohl EE, Thompson DM, Miller AJ. 1999. Canyons with undulating walls. Geological Society of America Bulletin
111: 949-959.
Zen EA, Prestegaard KL. 1994. Possible hydraulic significance of 2 kinds of potholes - examples from the Paleo-
Potomac River. Geology 22: 47-50.