Embed Size (px)
Citation preview

1
Thermal Structure of the Patalkot Subduction zone
Dr. N.L. Dongre.
The featured photo is an ancient volcano/ring dike that is the Patalkot Mountain and a natural
phenomonon called Columnar jointing, when the flow of lava cools at an even rate and fractures forming
these perfect columns that seem chiseled to perfection. I found them while hiking along a ridge on the
Bald Knob Cut-off trail and a sign highlights the rare process. There is only a handful of locations on
earth where this has happened (125 Ma).
Abstract.
To assess the exact thermal structure of subduction zones is required for realising the nature of metamorphic
dehydration reactions, arc and intermediate depth seismicity. High resolution two-dimensional (2-D) models
have shown that the rheology of the mantle wedge express a critical role and establishes strong temperature
gradients in the slab. The reflection of three-dimensional (3-D) subduction zone geometry on thermal structure
is not yet well studied. A general presumption for 2-D models is that the cross-section is taken normal to the
strike of the trench with a corresponding velocity reduction in the case of oblique subduction and taken parallel
to velocity. A comparison between a full 3D Cartesian model with oblique subduction and selected 2D cross-
sections demonstrates that the trench-normal cross-section provides a better reproduction of the slab thermal
structure than the velocity-parallel cross-section. An exception is found in the case of a strongly curved trench,
in the Patalkot (Chhindwada) where strong 3-D flow in the mantle wedge is generated. Here it is shown that the
full 3-D model should be evaluated for a correct prediction of the slab thermal structure. The models exhibit
that the use of a dynamic slab and wedge, separated by a kinematic boundary, yields good results for describing
slab velocities in 3-D.
1 Introduction
Yet geological evidence indicates large-scale crustal shorting by thrust faulting in Pachmarhi mountain belts. Consequently, some subduction of continental crust have taken place, and in general,

2
geological evidence places only lower bounds on the amount of thrust displacement and therefore of subduction of lower crust. It is estimated that the total displacement on the major thrust faults in the Patalkot is atleast 100 km.
The Patalkot (Chhindwara, India) subducted area is spread over an area of 79 km2 at an
average depth of 1000-1100 meter from 22° 24’ to 22° 29’ North and 78° 43’ to 78° 58’ East. These are (horse-shoe shaped) subducted zone is surrounded by giant hill. (Fig 1, 2, 3).
One approach to model the thermal structure of the down-going lithosphere is to
kinematically project the slab into the mantle. While this is a clear simplification from models that
treat the slab as a dynamic entity (e.g., Zhong and Gurnis, 1995; Kincaid and Sacks, 1997; van Hunen
et al., 2002), this approach allows for the use of observed slab geometries (e.g., England et al., 2004;
Syracuse and Abers, 2006; Hayes et al., 2012, Bengstson, and van keken, 2012) and can take into
account geodetic and paleomagnetic data to accurately prescribe convergence velocities and plate
ages (e.g., DeMets et al., 1994; Muller et al., 2008). Early thermal models were based on a simple
advection-diffusion scheme for the slab with parameterized wedge coupling (Toksoz et al., 1971). The
dynamics of sub-duction zones is complicated by the structure of the mantle wedge, which is the
convecting portion of the mantle above the slab and below the overriding lithosphere (van Keken,
2003; Wiens et al., 2008). Entrainment of the mantle wedge by the subducting slab sets up a
cornerflow in the wedge which leads to very strong thermal boundary layers. Early models that took
into account the dynamics of the wedge often used a simplified is oviscous rheology for the wedge
(e.g. Davies and Stevenson, 1992; Peacock and Wang, 1999), with only few exceptions (Furukawa
and Uyeda, 1989). Only more recently the more appropriate temperature- and stress-dependent
properties of the wedge have been consistently taken into account, which causes a significant increase
in slab surface temperature compared to isoviscous models (van Kekenetal., 2001; Kelemenetal. 2003;
Conderetal. 2005). A detailed comparison between independent finite-difference and finite-element
methods showed that the results for thermal structure agreed well, but only if fairly high resolution (a
few kilometer grid spacing or less) is used (van Keken et al.,2008). There is some confidence that the recent generation of this type of kinematic-dynamic model
for subduction zones leads to reasonable and well-resolved thermal structures. Aside from the
benchmark comparison (van Keken et al., 2008), the temperature of the slab below a number of
subduction arcs predicted in a global suite of subduction models (Syracuse et al., 2008) agrees
remarkably well with fully independent geochemical estimates for slab surface temperatures (Plank et
al., 2009; Skora and Blundy, 2010; Cooper et al., 2012). In many models, 2-D cross-sections are still
commonly used. This is partly out of the implied understanding (or hope) that the thermal structure is
dominated by movement in the convergence direction, with little variations along strike, partly for
geometrical convenience and computational efficiency. (Bengstson, and van keken, 2012) This
raises some important questions. Can it be successfully used 2-D models to estimate the thermal
structure of 3-D subduction zones? What is the appropriate choice of cross-section through a
subduction zone in the case of oblique convergence, or in the case of strong trench curvature? When one attempts to model specific subduction zones, an important choice of location of the
cross-section has to be made. While this choice is clear in the case of normal convergence, it is not in
the case of oblique convergence. Consider the simple 3-D geometry in Fig. 4 it is assumed that the
slab is a straight plane dipping under angle �. The convergence velocity � has a horizontal angle 6
with the trench normal. Two cross-section choices seem obvious: (1) the cross-section parallel to
convergence velocity (in the direction of � , which causes a shallowing of the subducting plane to �')
and (2) the cross-section normal to the trench (using the real dip � but a reduced convergence
velocity ��). To date it has not been demonstrated which of these two options is the most appropriate. The choice of cross-section is even more complicated in the case of strongly curved subduction zones (Fig.1 and 5), such as the Patalkot subduction zones. Two-dimensional models for these geometries fail to account for 3-D flow in the wedge. Seismological observations of seismic anisotropy that show a dominance of trench-parallel shear-wave splitting in subduction zones, strongly suggest that 3-D flow, with a strong along-arc component, may be significant (for recent reviews see Long and Silver, 2008; Long and Becker, 2010). Three-dimensional flow is also indicated by geochemistry of arc lavas (e.g., Hoernle et al., 2008) and has been supported by dynamical models (Honda and Yoshida, 2005 ;) Kneller and van Keken, 2007, 2008; Jadamec and Billen, 2010, 2012; Stadler et al., 2010; Alisic etal., 2010).

3
Figure: 1. Survey of India toposheet – 55- J/15: Patalkot (nether lands) is a perfect name subducted
gorge-1000-1100 meter deep, hiding a gorge barely 80 kilometer in all but Patalkot really is a world away.
The Patalkot was created by meteorite impact. Detachment occurred in the form of rapid necking or
stretching and controlled by yielding of slab as stress exceed the plastic yield strength of the slab. The
position and maximum depth of the subducted area, variation in the subduction velocity with time reflect
changes in the dynamics since the surface tectonic motion was determined by the sinking velocity.The
changes in subduction velocity as a function of time. The slab sinked to a vertical dip. The curved
lithosphere cap supported by thick in compressible mantle. Subducted boundaries were resulted from the
gravitation body force (free subduction) have characteristic length and form arc- shaped dimpled
segment resulting from the competition between bending and stretching in edge buckling modes of thin
spherical shells.

4
Figure: 2. The Patalkot is tectonically dominated and dynamics of the lithosphere. However, the
curvature of this rock formation is nearly constant and inverse. A bending in the rock assumes either a
characteristic arcuate or straight geometry of ten with multiple segments separated by narrow syntaxial
curps.

5
Figure: 3. Despite their importance to tectonics, there is no consistent explanation for the shape or scaling
of these features purely geometric analogy between the shape of curvature of the subducted Patalkot and
bending strip of the dimple on a partly inverted thin spherical shell implies a direct relationship between
slab dip and the radius of the subduction arc. These radius of curvature of the arc is greater and steeper
the dip of the down going slab
Figure: 4. Oblique subduction model with straight trench. (a) Map view of incoming plate velocity. (b)
Full 3-D model. (c) 2-D cross-section of trench perpendicular flow. (d) 2-D cross-section parallel to
incoming plate velocity angle. The origin, O, and points A and B connect models (a-d). � Is the velocity
along the incoming plate direction at angle � to the trench. �� is the velocity perpendicular to the trench. � is the velocity in the z-direction (into the Earth). ��� the component of the velocity parallel to the
incoming plate direction on the slab surface. �� is the component of the trench normal component of the
velocity on the slab surface (trench normal). The trench dips from the surface at an angle �. The slab dip
parallel to the incoming plate velocity (�′) is less than the dip perpendicular to the trench (� . (Bengstson,
and van keken, 2012)
6
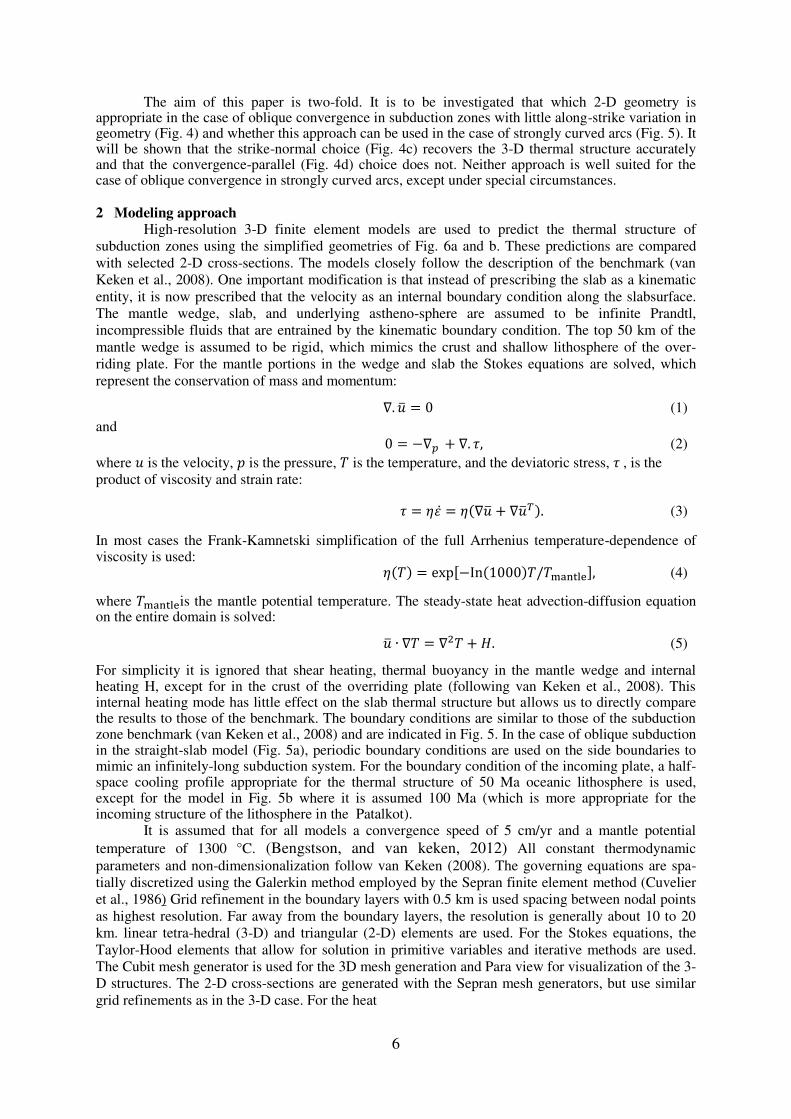
The aim of this paper is two-fold. It is to be investigated that which 2-D geometry is appropriate in the case of oblique convergence in subduction zones with little along-strike variation in geometry (Fig. 4) and whether this approach can be used in the case of strongly curved arcs (Fig. 5). It will be shown that the strike-normal choice (Fig. 4c) recovers the 3-D thermal structure accurately and that the convergence-parallel (Fig. 4d) choice does not. Neither approach is well suited for the case of oblique convergence in strongly curved arcs, except under special circumstances.
2 Modeling approach High-resolution 3-D finite element models are used to predict the thermal structure of
subduction zones using the simplified geometries of Fig. 6a and b. These predictions are compared
with selected 2-D cross-sections. The models closely follow the description of the benchmark (van
Keken et al., 2008). One important modification is that instead of prescribing the slab as a kinematic
entity, it is now prescribed that the velocity as an internal boundary condition along the slabsurface.
The mantle wedge, slab, and underlying astheno-sphere are assumed to be infinite Prandtl,
incompressible fluids that are entrained by the kinematic boundary condition. The top 50 km of the
mantle wedge is assumed to be rigid, which mimics the crust and shallow lithosphere of the over-
riding plate. For the mantle portions in the wedge and slab the Stokes equations are solved, which
represent the conservation of mass and momentum:
∇. �̅ = (1)
and
= −∇� + ∇. , (2)
where � is the velocity, � is the pressure, � is the temperature, and the deviatoric stress, , is the
product of viscosity and strain rate:
= �̇ = ∇�̅ + ∇�̅ . (3)
In most cases the Frank-Kamnetski simplification of the full Arrhenius temperature-dependence of viscosity is used: � = �xp[−In �/� a t e], (4)
where � a t eis the mantle potential temperature. The steady-state heat advection-diffusion equation on the entire domain is solved:
�̅ ∙ ∇� = ∇2� + �. (5)
For simplicity it is ignored that shear heating, thermal buoyancy in the mantle wedge and internal heating H, except for in the crust of the overriding plate (following van Keken et al., 2008). This internal heating mode has little effect on the slab thermal structure but allows us to directly compare the results to those of the benchmark. The boundary conditions are similar to those of the subduction zone benchmark (van Keken et al., 2008) and are indicated in Fig. 5. In the case of oblique subduction in the straight-slab model (Fig. 5a), periodic boundary conditions are used on the side boundaries to mimic an infinitely-long subduction system. For the boundary condition of the incoming plate, a half-space cooling profile appropriate for the thermal structure of 50 Ma oceanic lithosphere is used, except for the model in Fig. 5b where it is assumed 100 Ma (which is more appropriate for the incoming structure of the lithosphere in the Patalkot).
It is assumed that for all models a convergence speed of 5 cm/yr and a mantle potential
temperature of 1300 °C. (Bengstson, and van keken, 2012) All constant thermodynamic
parameters and non-dimensionalization follow van Keken (2008). The governing equations are spa-
tially discretized using the Galerkin method employed by the Sepran finite element method (Cuvelier
et al., 1986) Grid refinement in the boundary layers with 0.5 km is used spacing between nodal points
as highest resolution. Far away from the boundary layers, the resolution is generally about 10 to 20
km. linear tetra-hedral (3-D) and triangular (2-D) elements are used. For the Stokes equations, the
Taylor-Hood elements that allow for solution in primitive variables and iterative methods are used.
The Cubit mesh generator is used for the 3D mesh generation and Para view for visualization of the 3-
D structures. The 2-D cross-sections are generated with the Sepran mesh generators, but use similar
grid refinements as in the 3-D case. For the heat

7
Figure: 5. (a) Temperature and (b) velocity boundary conditions for three-dimensional geometries. The y-
component of velocity (��) is forced to zero in (b). (Bengstson, and van keken, 2012)
equation streamline upwinding is used. The resulting matrix-vector systems are solved iteratively
using the BiCGstab method (van der Vorst, 1992). Picard iteration is used to resolve the non-linearity
between the Stokes and heat equations.
3 Results
3.1 Subduction zone benchmark in 3-D
To validate the three-dimensional modeling, the geometry in Fig. 4a is used with normal
convergence. The resulting solution does not change in the along-strike direction, and it can be
directly compared the temperature predictions with the benchmark cases (van Keken et al., 2008). The
benchmark cases 1c (is viscous wedge theology with natural boundary conditions) is solved and 2a
(diffusion creep rheology in the wedge and natural boundary conditions). Grid refinement is used near
the corner point with smallest grid spacing ranging from 2 km to 0.5 km. The coarsest grid resolution
is 20 km. Maybe not surprisingly, the resulting temperature structure is nearly identical to that found
in the 2-D results. The main results (and convergence trend with increasing mesh resolution) follow
that in van Keken et al. (2008; their Fig. 6). For example, in the highest resolution model it is found
that a temperature at 60 km depth along the slab surface of 387 °C (compared to the benchmark's
"best estimate" of 388 °C in 2-D) for case 1c. For case 2a this value is 578 °C in 3-D (compared to the
"best estimate" of 583 °C in 2-D). The minor differences is ascribed to the fact that the 2-D meshes are
better balanced (and less coarse away from the boundary layers) and that it could be used finer
spacing in the 2-D benchmark. It is compared that the new approach of prescribing velocity along the slab surface (and
solving the Stokes equations in the slab) with the benchmark method of prescribing velocity throughout the slab. Minor differences were found in the isoviscous case, but no difference (to within a degree) with temperature-dependent viscosity. Clearly, the higher viscosity of the slab renders it as a nearly kinematic entity, causing the velocity to be similar to that of the kinematic case. The use of an internal boundary is useful in 3-D, where (except for the simple case of the straight slab) it becomes difficult to define the velocity inside the slab. In 2-D, this can be achieved by finding the point on the slab surface that is closest and taking the same velocity as in that slab point. (Bengstson, and van keken, 2012 This becomes significantly more difficult for a general 3-D slab surface. The use of a dynamic slab also resolves an important weakness of the kinematic-slab models: with a kinematic prescription the conservation of mass and momentum are not satisfied, except in the simplest cases. With the new approach using a dynamic slab, this weakness is removed.
3.2 Comparison 1: oblique subduction with straight trench
The first new model comparison addresses the question whether 2-D cross-sections should be
taken parallel to convergence (case "2-D parallel"; see red arrows in Fig. 4a, b and geometry in Fig.
4d) or normal to structure with reduced velocity (case "2-D normal"; Fig. 4c). The rectangular box of
Fig. 4b is used with dimensions of 80 km in , 1 km in y, and 1 km in (depth). The trench strike is in
y and the trench-normal velocity points to . Periodic boundary conditions are used on the planes with
constant y which allows for the short model dimension in y. The slab dip � = 45°. is the angle

8
Figure: 6. Predicted slab surface (left) and slab Moho (right) temperatures at selected depths for the
straight-slab model (Fig. 5a) and oblique convergence (� = 60°). The straight line indicates the 3-D
results. The method that chooses the 2-D cross-section normal to strike (red circles, "2-D normal")
matches the 3-D model to a high precision, whereas the model that has the cross-section parallel to
convergence velocity (blue triangles, "2-D parallel") significantly underestimates the temperature
distribution. (Bengstson, and van keken, 2012)
between the convergence velocity and .It is varied between ° (normal) and 60
° (strongly oblique).
In this case the Stokes equations are solved in the wedge only. The velocity in the slab has component
� = cos �
� = tan cos �. (6)
� = − sin �
This velocity field also forms the slab-side boundary condition for the wedge (with a 3 km long taper
in the wedge tip as in van Keken et al., 2008). In this case it is used the viscosity function (4) is used.
In the "2-D normal" geometry, the dip of the slab remains the same, but the effective velocity in the
slab surface should be reduced. In the "2-D parallel" geometry, the velocity is unchanged, but the slab
shallows. Fig. 6 shows the comparison between these 2-D approaches and the full 3-D model for the
largest obliquity by plotting the temperature in the slab surface (left) and that in the slab Moho (7 km
below the slab surface; right) at a number of depths. It is clear that "2-D normal" case, which is the
common choice of taking the cross-section normal to strike (e.g., Syracuse et al., 2010), is indeed
appropriate. Only very small differences (up to 2 °C) are used, whereas the "2-D parallel" results
significantly under predict the temperature with a largest difference of more than 100 °C. This is
pronounced throughout the top of the slab and not just at the interface itself. For smaller 6 the error in
"2-D parallel" becomes smaller; for all cases considered, the "2-D normal" results are, for practical
purposes, identical to the 3-D case. The effective shallowing of the slab in "2-D parallel" is the main
reason for the cooler predictions: the entrained flow cannot move into the wedge corner as efficiently
compared to the model with the larger dip and the boundary layers are effectively broadened.
3.3 Comparison 2: curved trench
In the second new comparison, it is investigated that the consequences of 3-D flow in models
with a curved trench and a normal or obliquely subducting plate (Fig.7a). This is relevant for models
for a Ptalkot arcs, including the subduction systems. For this comparison the geometry of a subduc-
tion zone is used with a curved trench from Kneller and van Keken (2007) which has some likeness to
the Patalkot subduction zone.
9
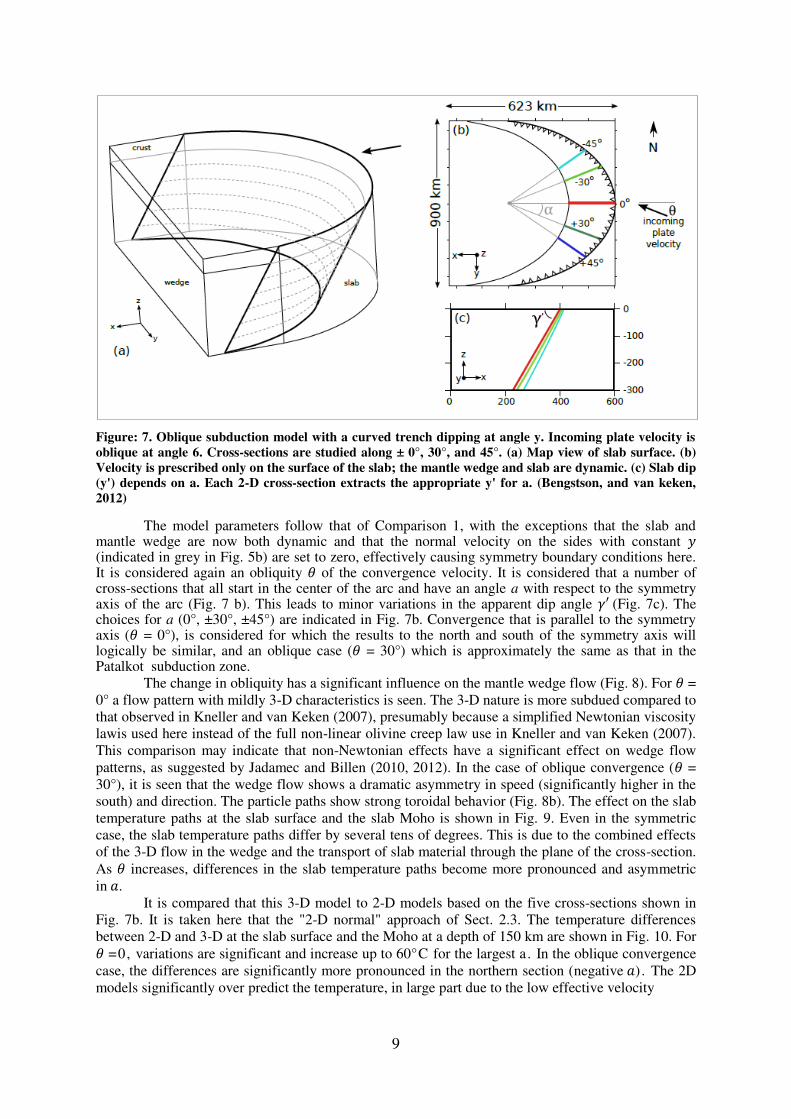
Figure: 7. Oblique subduction model with a curved trench dipping at angle y. Incoming plate velocity is
oblique at angle 6. Cross-sections are studied along ± 0°, 30°, and 45°. (a) Map view of slab surface. (b)
Velocity is prescribed only on the surface of the slab; the mantle wedge and slab are dynamic. (c) Slab dip
(y') depends on a. Each 2-D cross-section extracts the appropriate y' for a. (Bengstson, and van keken,
2012)
The model parameters follow that of Comparison 1, with the exceptions that the slab and mantle wedge are now both dynamic and that the normal velocity on the sides with constant (indicated in grey in Fig. 5b) are set to zero, effectively causing symmetry boundary conditions here. It is considered again an obliquity of the convergence velocity. It is considered that a number of cross-sections that all start in the center of the arc and have an angle a with respect to the symmetry axis of the arc (Fig. 7 b). This leads to minor variations in the apparent dip angle �′ (Fig. 7c). The choices for a (0°, ±30°, ±45°) are indicated in Fig. 7b. Convergence that is parallel to the symmetry axis ( = 0°), is considered for which the results to the north and south of the symmetry axis will logically be similar, and an oblique case ( = 30°) which is approximately the same as that in the Patalkot subduction zone.
The change in obliquity has a significant influence on the mantle wedge flow (Fig. 8). For =
0° a flow pattern with mildly 3-D characteristics is seen. The 3-D nature is more subdued compared to
that observed in Kneller and van Keken (2007), presumably because a simplified Newtonian viscosity
lawis used here instead of the full non-linear olivine creep law use in Kneller and van Keken (2007).
This comparison may indicate that non-Newtonian effects have a significant effect on wedge flow
patterns, as suggested by Jadamec and Billen (2010, 2012). In the case of oblique convergence ( =
30°), it is seen that the wedge flow shows a dramatic asymmetry in speed (significantly higher in the
south) and direction. The particle paths show strong toroidal behavior (Fig. 8b). The effect on the slab
temperature paths at the slab surface and the slab Moho is shown in Fig. 9. Even in the symmetric
case, the slab temperature paths differ by several tens of degrees. This is due to the combined effects
of the 3-D flow in the wedge and the transport of slab material through the plane of the cross-section.
As increases, differences in the slab temperature paths become more pronounced and asymmetric
in �.
It is compared that this 3-D model to 2-D models based on the five cross-sections shown in
Fig. 7b. It is taken here that the "2-D normal" approach of Sect. 2.3. The temperature differences
between 2-D and 3-D at the slab surface and the Moho at a depth of 150 km are shown in Fig. 10. For
=0, variations are significant and increase up to 60°C for the largest a. In the oblique convergence
case, the differences are significantly more pronounced in the northern section (negative �) . The 2D
models significantly over predict the temperature, in large part due to the low effective velocity

10
Figure: 8. Velocity in the mantle wedge for the curved trench with oblique subduction. Changing the
incoming plate velocity � from (a) 0° to (b) 30° drastically changes the flow pattern. The color scale
reflects speed in cm yr-1
. Streamlines are seeded from a small volume at the right hand boundary.
(Bengstson, and van keken, 2012)
Figure: 9. Temperatures on the slab (a, c) and on the Moho (b, d) for the curved trench with oblique
subduction. Temperatures along multiple cross-sections, ( is defined in Fig. 4), are plotted. (a)
Incoming plate velocity � = 0°. (b) Incoming plate velocity � = 30°. (Bengstson, and van keken, 2012)

11
Figure: 10. Differences between the two-dimensional (2-D) and three-dimensional (3-D) temperature
solutions for curved trench at a depth of 150 km (�T = −� − −�). Temperature differences are given
for a slab velocity angle of 0° (a, b) and 30° (c, d). Temperature differences are plotted directly on the slab
(a, c) and on the Moho (b, d). Note the difference in vertical axes between � = 0° and � = 30
°. (Bengstson,
and van keken, 2012)
(which is due to both the angle of the cross-section and the oblique convergence). In the 3-D case there is significant advection of slab material from outside of the plane, causing significantly lower temperatures.
The choice of a good cross-section for 2-D models is clearly more difficult with a curved trench. Only in the case of cross-sections that run sub parallel to the convergence direction (a ~ �) are the 2-D models reasonable. Two-dimensional models cannot accurately predict the thermal structure when the cross-section is under a significant angle from the convergence direction.
4 Discussion
Thermal models of subduction zones, which are important in the understanding of their
geophysical and geochemical structure and evolution, are still commonly based on 2-D modeling. It
was investigated to which extent the 2-D approach is reasonable. Based on the first comparison it is
argued that the common approach of taking the cross-section normal to strike with reduced velocity is
reasonable in the many arcs that have little along-strike variation. In the Patalkot arcs that show
significant curvature, it is predicted that only the cross-sections that run sub parallel to the flow may
be applicable. Models that take cross-sections under a large angle to convergence direction should be
treated with caution. Similarly, subduction zones that have oblique convergence and variations in the
thermal structure (e.g., due to age of the slab at the trench) or temporal variability in the input
parameters (e.g., Lee and King, 2010) should ideally be studied with full 3-D geometry.
There is limited geochemical evidence that can provide direct tests of the suggestion that the
slab surface temperature is more realistic in the 3-D model. The dominance of data is for the central
arc, for which it is predicted only small temperature variations. For the Patalkot, where the differences
between 2-D and 3-D model predictions are largest, only one study is aware of. Tollstrup and Gill
(2005) suggested from Hf isotope data that the slab surface should be above the wet sediment solidus,
but less than 705780 °C. The 2-D model predicts about 800 °C below the arc, which is reduced to
720-740 °C in the 3-D model, which is in better agreement with the geochemical constraints. It is not
studied that the flow around a slab edge in detail. This is relevant to Patalkot subduction zones.
Recent modeling has suggested that flow around slab edges may be significant (Kneller and van
Keken, 2008; Jadamec and Billen, 2010, 2012). Of particular interest are the very high velocities pre-

12
dicted for non-Newtonian flow around slab edges (Jadamec and Billen, 2010, 2012). In this case one
would expect a dramatic increase in slab surface temperatures, with significant changes in arc
geochemistry. Future work on determining realistic models for subduction zone thermal structure
needs to take these slab edge and rheological effects into account.
Aside from non-Newtonian effects, which was not addressed in this study, these model
comparisons should be extended with more realistic wedge descriptions, which include the roles of
buoyancy and low viscosity (Billen and Gurnis, 2001) that may lead to additional 3-D flow patterns
(e.g., Honda and Yoshida, 2005), dynamic erosion of the overriding plate (Currie and Hyndman,
2006; Arcay et al., 2007), mantle compressibility (Lee and King, 2009) and the effects of fluids and
melt on wedge rheology (e.g., Hirth and Kohlst-edt, 1996).
References
Abers, G. A., van Keken, P. E., Kneller, E. A., Ferris, A., and Stach-nik, J. C.: (2006) the thermal structure of
subduction zones constrained by seismic imaging: implications for slab dehydration and wedge flow,
Earth Planet. Sci. Lett., 241, 387-397.
Alisic, L., Gurnis, M., Stadler, C., Burstedde, C., Wilcox, L. D., and Ghattas, O.: (2010) Slab stress and strain
rate as constraints on global mantle flow, Geophys. Res. Lett., 37, L22308.
Arcay, D., Tric, E., and Doin, M.-P.: (2010) Slab surface temperature in subduction zones: influence of the
interplate decoupling depth and upper plate thinning processes, Earth Planet. Sci. Lett., 255,324-338.
Barcheck, G. C., Wiens, D. A., van Keken, P. E., and Hacker, B. A. (2012): The relationship of intermediate-
and deep-focus seismicity to hydration and dehydration of subducting slabs, Earth Planet. Sci., 349-
350, 153-160.
Bengtson A. K., Keken P. E. van, (2012) Three-dimensional thermal structure of subduction zones: effects of
obli quity and curvature Solid Earth, 3, 365–373, 2012 www.solid-earth.net/3/365/2012/ doi:10.5194
/se-3-365-2012
Billen, M. I. and Gurnis, M. (2001): A low viscosity wedge in subduction zones, Earth Planet. Sci. Lett., 193,
227-236,
Cagnioncle, A.-M., Parmentier, E. M., and Elkins-Tanton, L. T.( 2007): Effect of solid flow above a subducting
slab on water distribution and melting at convergent plate boundaries, J. Geophys. Res., 112, B09402.
Conder, J. A. (2005): A case for hot slab surface temperatures in numerical viscous flow models in subduction
zones with an improved fault zone parameterization, Phys. Earth Planet. Int., 149, 155-164.
Connolly, J. A. D. (1997): Devolatilization-generated fluid pressure and deformation-propagated fluid flow
during prograde region meta- morphism, J. Geophys. Res., 102, 18149-18173.
Cooper, L. B., Ruscitto, D. M., Plank, T., Wallace, P. J., Syracuse, E. M., and Manning, C. E. (2012): Global
Variations InH2O/Ce: 1. Slab surface temperatures beneath volcanic arcs, Geochem. Geophys.
Geosyst. 13.
Currie, C. A. and Hyndman, R. D. (2006): The thermal structure of subduction zone back arcs, J. Geophys. Res.,
111, B08404,
Cuvelier, C., Segal, A., and van Steenhoven, A. A. (1986): Finite element models and the Navier-Stokes
Equations, D. Reidel, Dordrecht, The Netherlands,.
Davies, J. H., and Stevenson, D. J. (1992): Physical model of source regionof subduction zone volcanics, J.
Geophys. Res., 97, 2037-2070,
DeMets, C., Gordon, R. G., Argus, D. F., and Stein, S. (1994): Effect ofrecent revisions to the geomagnetic
reversal time-scale on estimates of current plate motions, Geophys. Res. Lett., 21, 21912194.
England, P., Engdahl, R., and Thatcher, W. (2004): Systematic variation in the depths of slabs beneath arc
Volcanoes, Geophys. J. Int., 156,377-408.
Faccenda, M., Gerya, T. V., Menktelow, N. S., and Moresi, L. (2012): Fluid flow during slab unbending and
dehydration: implications for intermediate-depth seismicity, slab weakening and deep water recycling,
Geochem. Geophys. Geosyst., 13, Q01010,
Furukawa, Y. and Uyeda, S. (1989), Thermal state under the Tohoko arc with consideration of crustal heat
generation, Tectonophysics, 164, 175-187.
Hacker, B. R., Peacock, S. M., Abers, G. A., and Holloway, S. D. (2003): Subduction Factory 2: Are Interme
diate depth earthquakes in subducting slabs linked to metamorphic dehydration reactions? J. Geophys.
Res., 108, art. no. 2030,.
Hayes, G. P., Wald, D. J., and Johnson, R. L., (2012) Slab 1.0: A three-dimensional model of global subduction
zone geometries, J. Geophys. Res., 117, B01302,.
Hirschmann, M. M.( 2006): Water, melting and the deep Earth H2O cycle, Ann. Rev. Earth Planet. Sci., 34, 629-
653.
Hirth, G. and Kohlstedt, D. (1996): Water in the oceanic upper mantle: implications for rheology, melt

13
extraction, and the evolution of the lithosphere, Earth Planet. Sci. Lett., 144, 93-108.
Honda, S. and Yoshida, T. (2005): Effects of oblique subduction on the 3-D pattern of small-scale convection
Within the mantle wedge, Geophys. Res. Lett., 32, L13307.
Jadamec, M. A. and Billen: M. I (2010). Reconciling surface plate motions with rapid three-dimensional mantle
Flow around a slab edge, Nature, 465, 338-341.
Jadamec, M. A. and Billen, M. I. (2012): The role of rheology and slab shape on rapid mantle flow: three-
Dimensional numerical models of the Alaska slab edge, J. Geophys. Res., 117, B02304.
Kelemen, P. B., Parmentier E. M., Rilling, J., Mehl, L., and Hacker, B. R. (2003): Thermal convection in the
mantle wedge beneath subduction-related magmatic arcs, in: The Subduction Factory, edited by Eiler,
J., American Geophysical Union Monograph 138,293-311, American Geophysical Union, Washington,
D.C.,
Kimura, J. I., Hacker B. R., van Keken, P. E., Kawabata, H., Yoshida, T., and Stern, R. J. (2009): Arc Basalt
Simulator (ABS) ver. 2, a simulation for slab dehydration and fluid-fluxed mantle melting for arc
basalts: modeling scheme and application, Geochem. Geophys. Geosyst., 10, Q09004,.
Kimura, J. I., Kent, A. J. R., Rowe, M. C., Katakuse, M., Nakano, F., Hacker, B. R., van Keken, P. E., and Stern,
R. J. (2010): Origin of cross-chain geochemical variation in Quaternary lavas from the northern Izu arc:
a quantitative mass-balance approach on source and mantle wedge process identification, Geochem.
Geophys. Geosyst., 11, Q10011,.
Kincaid, C. and Sacks, I. S. (1997): Thermal and dynamical evolution of the upper mantle in subduction zones,
J. Geophys. Res., 102, 12295-12315.
Kirby, S. H., Engdahl, E. R., and Denlinger, R. (1996): Intermediate-depth intraslab earthquakes and arc
volcanism as physical expressions of crustal and uppermost mantle metamorphism in subduction slabs,
in "Subduction: Top to Bottom", Geophysical Monograph Series, 96, edited by; G. Bebout, 195-214,
American Geophysical Union, Washington, D.C.,.
Kneller, E. A. and van Keken, P. E. (2008): The effects of three-dimensional slab geometry on deformation in
the mantle wedge: implications for shear wave anisotropy, Geochem. Geophys. Geosyst., 9, Q01003,.
Lee, C. and King, S. D. (2009): Effect of mantle compressibility on the thermal and flow structures of
subduction zones, Geochem. Geophys. Geosyst., 10, Q01006,.
Lee, C. and King, S. D. (2010): Why are high-Mg# andesites widespread in the western Aleutians? A numerical
model approach, Geology, 38, 583-586,.
Long, M. D. and Silver, P. G. (2008): The subduction zone flow field from seismic anisotropy: a global view,
Science, 319, 315-318,.
Long, M. D. and Becker T. W. (2010): Mantle dynamics and anisotropy, Earth Planet. Sci. Lett., 297, 341-354,.
Muller, R. D., Sdrolias, M., Gaina, C., and Roest, W. R. (2008): Age, spreading rates, and spreading asymmetry
of the world's ocean crust, Geochem. Geophys. Geosyst., 9, Q04006,.
Parai, R. and Mukhopadhyay, S. (2012): How large is the subducted water flux? New constraints on mantle
regassing rates, Earth Planet.Sci. Lett., 317, 396-406,.
Peacock, S. M. and Wang, K.(1999): Seismic consequences of warm versus cool subduction metamorphism:
examples from southwest and northeast Japan, Science, 286, 937-939,.
Plank, T., Cooper, L. B., and Manning, C. E. (2009): Emerging geother-mometers for estimating slab surface
temperatures, Nat. Geosci.2, 611-615.
Skora, S. and Blundy, J.: High-pressure hydrous phase relations of radiolarian clay and implications for the
involvement of subducted sediment in arc magmatism, J. Petrol., 51, 2211-2243.
Stadler, G., Gurnis, M., Burstedde, C., Wilcos, L. C., Alisic, L., and Ghattas, O. (2010): The dynamics of plate
tectonics and mantle flow: from local to global scales, Science, 329, 1033-1038,.
Syracuse, E. M. and Abers, G. A.( 2006): Global compilation ofvariations in slab depth beneath arc volcanoes
and implications, Geochem. Geophys. Geosyst., 7, Q05017,.
Syracuse, E. M., van Keken, P. E., and Abers, G. A. (2010): The global range of subduction zone thermal
models, Phys. Earth Planet. Int., 183, 73-90,.
Toksoz, M., Minear, J., and Julian, B.( 1971): Temperature field and geophysical effects of a downgoing slab, J.
Geophys. Res., 76, 11131138.
Tolstrup, D. L. and Gill, J. B. (2005): Hafnium systematics of the Mariana arc: evidence for sediment melt and
residual phases, Geology, 33, 737-740,.
Turner, S., Caulfield, J., Turner, M., van Keken, P.E., Maury, R., Sandiford, M., and Prouteau, G. (2012):
Recent contributions of sediments and fluids to the mantle's volatile budget, Nat. Geosci., 5, 50-54.
van der Vorst, H. A.( 1992): Bi-CGSTAB: a fast and smoothly converging variant of Bi-CG for the solution of
non symmetric linear systems, SIAM J. Sci. Comput., 13, 631-644,.
van Hunen, J., van den Berg, A. P., and Vlaar, N. J.( 2002): On the role of subducting oceanic plateaus in the
development of shallow flat subduction, Tectonophysics, 352, 317-333.
van Keken, P. E., Kiefer, B., and Peacock, S. M.(2001): High resolution models of subduction zones:

14
implications for mineral dehydration reactions and the transport of water into the deep mantle,
Geochem. Geophys. Geosyst., 3, 1056,.
van Keken, P. E.( 2003): The structure and dynamics of the mantle wedge, Earth Planet. Sci. Lett., 215, 323-
338.
van Keken, P. E., Currie, C., King, S. D., Behn, M. D., Cagnioncle, A., He, J., Katz, R. F., Lin, S. C., Parme
ntier E. M., Spiegelman, M., and Wang, K. (2008): A community benchmark for subduction zone
modeling, Phys. Earth Planet. Int., 171, 187-197.
van Keken, P. E., Hacker, B. R., Syracuse, E. M., and Abers, G. A. (2011): Subduction factory 4: depth-
dependent flux of H2O from slabs worldwide, J. Geophys. Res., 116, B01401.
van Keken, P. E., Kita, S., and Nakajima, J.( 2012): Thermal structure and intermediate-depth seismicity in the
Tohoku-Hokkaido subduction zones, Solid Earth, 3, 355-364.
Wada, I. and Wang, K (2009). Common depth of slab-mantle decoupling: reconciling diversity and uniformity
of subduction zones, Geochem. Geophys. Geosyst., 10, Q10009.
Wada, I., Behn, M. D., and Shaw, A. M. (2012): Effects ofheterogeneous hydration in the incoming plate, slab
rehydration, and mantle wedge hydration on slab-derived H2O flux in subduction zones, Earth Planet.
Sci. Lett., 353-354,
Wiens, D. A., Conder, J. A., and Faul, U. H. (2008): The seismic structure and dynamics of the mantle wedge,
Annu. Rev. Earth Planet. Sci., 36, 421-455,
Zhong, S. J. and Gurnis, M. (1995): Mantle convection with plates and mobile, faulted plate margins, Science,
267, 838-843,