Embed Size (px)
Citation preview

Experimenting for Cities?
Gharad Bryan
July 1, 2015
Aim
I Try to make the case for experiments (RCTs) to understandappropriate policy for cities.
I Plan:I Outline some questions about development and cities.
I Discuss the kinds of experiments we can run.
I Give examples of experiments that address important questionsand illustrate modes of experimentation.

Why Do This?
1. Encourage a discussion about the extent to whichexperimentation can help.
2. Provide policy makers with ideas about how IGC economistscan help.
Some Facts and Theories about Cities
The Role of Experiments
Examples
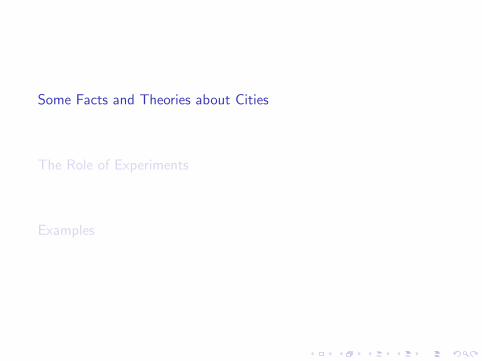
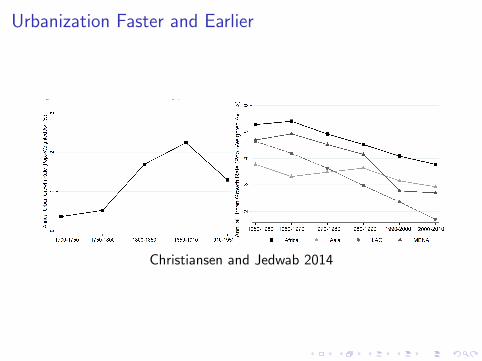
Urbanization Faster and Earlier
FIGURE 1: Urbanization and Economic Development, 1500-2010
Notes: We use data for 2,217 observations belonging to 159 countries for the following years: 1500(24), 1700 (18), 1800 (25), 1850 (23), 1870 (46), 1910 (70), 1950 (159), 1970 (159), 1980 (159),1990 (159), 2000 (159), and 2010 (159). The main sources for the urbanization rate (%) areBairoch (1988); Acemoglu, Johnson & Robinson (2002); Malanima & Volckart (2007); United Na-tions (2014); Jedwab & Moradi (2015). We use Maddison (2008); Bolt & van Zanden (2014) toobtain log per capita GDP (PPP, constant 1990 dollars). Together, the 159 countries account for 99%of the world population in 2010.
FIGURE 2: Urbanization and Economic Development Across Time: 1500,1950 and 2010
Notes: We use data for 342 observations belonging to 159 countries for the following years: 1500(24), 1950 (159) and 2010 (159). See the notes of Figure 1 for the list of sources used to reconstructthe data. 27
Gollin, Jedwab, Vollrath 2014
Urbanization Faster and Earlier
Figure 3: Urban Growth Rates for Industrial Europe, 1700-1950
Notes: This figure plots the average annual urban growth rate (%) for “Industrial Europe” in 1700-1950. Industrial Europeincludes the following Western European countries or regions, since we only have consistent historical data for 12 spatial units:United Kingdom (incl. England, Wales, Northern Ireland and Scotland), Ireland, France, Belgium, The Netherlands, Germany,Austria (incl. Hungary), Switzerland, Italy, Spain, Portugal and Scandinavia. Industrial Europe also includes the United States inour analysis, as one example of a Neo-European country. Averages are estimated using the population weights for the same year.See Data Appendix for data sources.
Figure 4: Urban Growth Rates for Four Developing Regions, 1950-2010
Notes: This figure plots the average annual urban growth rate (%) for selected periods for four groups of countries in 1950-2010:Africa (46 countries), Asia (30 countries), Latin America and the Caribbean LAC (26 countries) and Middle-East and North AfricaMENA (17 countries). Averages are estimated using the population weights for the same year. See Data Appendix for datasources.
23
Christiansen and Jedwab 2014
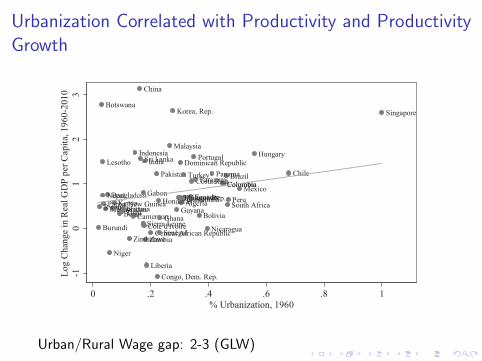
Urbanization Correlated with Productivity and ProductivityGrowthGlaeser A World of Cities 1159
AlgeriaBangladesh
Benin Bolivia
Botswana
Brazil
BurundiCameroon
Central African Republic
Chile
China
ColombiaColombia
Congo, Dem. Rep.
Congo, Rep.
Costa Rica
Cote d'Ivoire
Dominican Republic
EcuadorFijiGabon
Ghana
GuatemalaGuyana
Honduras
HungaryIndia
Indonesia
Kenya
Korea, Rep.
Lesotho
Liberia
Malawi
Malaysia
Mauritania
MexicoNepal
Nicaragua
Niger
Pakistan Panama
Papua New Guinea
Paraguay
PeruPhilippines
Portugal
Rwanda
SenegalSierra Leone
Singapore
South Africa
Sri Lanka
SudanTogo
Turkey
ZambiaZimbabwe
-10
12
3Lo
g C
hang
e in
Rea
l GD
P pe
r Cap
ita, 1
960-
2010
0 .2 .4 .6 .8 1% Urbanization, 1960
FIGURE 2. Relationship between initial urbanization and GDP growth. Source: World Bank.
below $5,000. Figure 1(a) shows the strong positive relationship for 1960, where thereare no really poor places with high levels of urbanization. Figure 1(b) shows the samerelationship for 2010. Not only has the overall level of urbanization increased, but thegrowth has been particularly dramatic in poor countries.
These graphs do not mean that the overall connection between urbanization andincome has declined, but rather that it has stayed roughly constant. If the logarithmof per capita GDP is regressed on urbanization, across all countries, the estimatedcoefficient is 4.75 (standard error of 0.32) in 1960 and 5.3 (standard error of 0.36)in 2010. Even among countries with per capita GDP levels below $5,000 (in 2012dollars), the estimated coefficient when the logarithm of per capita GDP is regressed onurbanization has been roughly constant, around 3.3 over the 50-year period. However,among poorer nations, the r-squared of that regression has dropped significantly, from0.58 to 0.33, reflecting the increasing number of extremely poor, urbanized nations.
Among poorer nations, there is also a link between initial urbanization and GDPgrowth. Figure 2 shows that among poorer countries, a 10% higher urbanization rate in1960 is associated with a 14% larger increase in per capita GDP over the next 50 years.I am not suggesting a causal relationship between urbanization and GDP growth, butthis robust correlation should make policy makers pause before embracing strategiesaimed at reducing city growth.
To provide a more concrete sense of poor but urbanized places, Table 1 liststhe eight nations in my sample where incomes are below $1,250, populations areover ten million, and urbanization is over one-third: the Democratic Republic of theCongo, Zimbabwe, Mali, Haiti, Pakistan, Senegal, the Cote D’Ivoire, and Cameroon.Haiti and Pakistan are the only two non-African countries. Every country has a one
Urban/Rural Wage gap: 2-3 (GLW)

Different Causes of Urbanization?Figure 3: Urbanization and Manufacturing and Services Separatelyfor Non-Resource-Exporting and Resource-Exporting Countries
Notes: This figure shows the relationship between the urbanization rate (%) and the share of manufacturing andservices in GDP (%) separately for 56 non-resource-exporting countries and 60 resource-exporting countries in2010 (see the footnote of figure 1). The solid line is a linear fit for the data. See Web Appendix for data sources.
Figure 4: Urbanization and Natural Resource Exportsfor Resource-Exporting Countries
Notes: This figure shows the relationship between the urbanization rate (%) in 2010 and the average share ofnatural resource exports in GDP (%) in 1960-2010 for 60 resource-exporting countries (see the footnote of figure1). The solid line is a linear fit for the data. See Web Appendix for data sources.
30
Gollin, Jedwab, Vollrath 2014
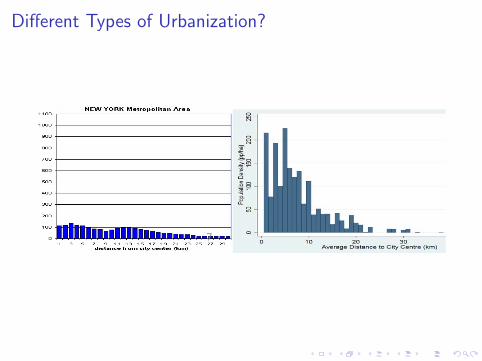
Different Types of Urbanization?
Urban form: residential density
7
Dar es Salaam 2002 2012
Nairobi 1989 1999
Includes Kibera
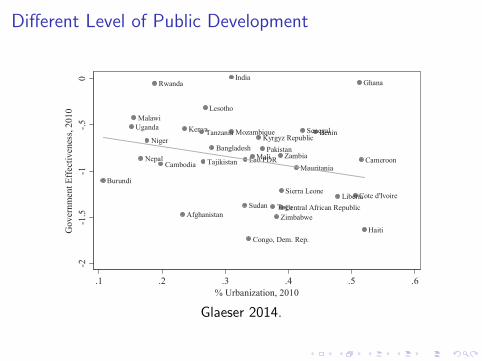
Different Level of Public DevelopmentGlaeser A World of Cities 1163
Afghanistan
Bangladesh
Benin
Burundi
CambodiaCameroon
Central African Republic
Congo, Dem. Rep.
Cote d'Ivoire
Ghana
Haiti
India
Kenya
Kyrgyz Republic
Lao PDR
Lesotho
Liberia
Malawi
Mali
Mauritania
Mozambique
Nepal
Niger
Pakistan
Rwanda
Senegal
Sierra Leone
Sudan
Tajikistan
Tanzania
Togo
Uganda
Zambia
Zimbabwe
-2-1
.5-1
-.5
0
Govern
ment
Eff
ecti
veness,
2010
.1 .2 .3 .4 .5 .6
% Urbanization, 2010
FIGURE 5. Relationship between government effectiveness and urbanization in 2010. Source: WorldBank.
Today’s poor but urbanized nations cannot rely on public sector competence. Theoverall correlation between government effectiveness and urbanization is significantlypositive, but only because richer countries have better governments. Among poorercountries, any positive correlation disappears entirely. Figure 5 shows the weaknegative correlation between 2010 government effectiveness and urbanization acrossthe 34 countries with per capita incomes under $1,500 and populations over twomillion. The poor-but-urbanized nations of Haiti and the Democratic Republic of theCongo have among the world’s lowest ratings of governmental effectiveness.
3. Understanding the Rise of Poor Mega-cities
I now turn to a positive model of urbanization, prosperity and openness. The model isin the spirit of Krugman (1991), but is particularly indebted to Matsuyama (1992) andGollin, Jedwab, and Vollrath (2013).2 The model’s main point is that urbanizationdepends on rural prosperity in closed economies, but in open economies, ruraldesperation will push farmers to the city. These results suggest that globalizationmay be responsible for the unprecedented emergence of mega-cities in poor countries,which can now feed themselves with imported grains.
I consider a single city in the middle of a one-dimensional land area that is 2 Nd unitslong. The total population split between farms and city equals N. The city occupies no
2. Unlike Matsuyama (1992), this paper is specifically about urbanization rather than industrialization,and unlike Gollin, Jedwab, and Vollrath (2013), urbanites here produce traded goods rather than services.
Glaeser 2014.
Questions and Observations
Questions:
1. Should rapid urbanisation continue?
2. Does density lead to productivity growth?
3. How to increase amenity and density?
Observation:
I Costs of getting it wrong are high.

Some Facts and Theories about Cities
The Role of Experiments
Examples

Why Experiments?
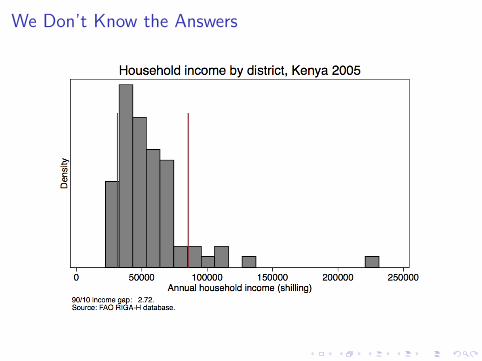
We Don’t Know the AnswersIncome distribution across space (Kenya)

We Don’t Know the AnswersIncome distribution across space (Kenya)

We Don’t Know the AnswersIncome distribution across space (Tanzania)
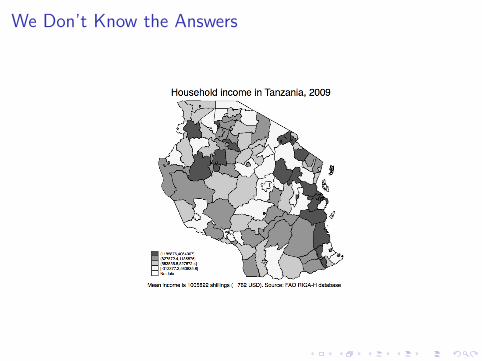
We Don’t Know the Answers
Income distribution across space (Tanzania)

We Can’t Predict the Outcomes
Predicted and Actual Fertilzer Use: Kenya
0"
20"
40"
60"
80"
100"
120"
planned" actual"
Duflo, Kremer and Robinson 2011

Its Natural
I How do you decide on the best route to work?
I How do you decide on the best pair of shoes?
I But, somehow we forget about this when we engage in policy.

Types of Experiments

Mechanisms versus Policy Ealuations
I Broken Windows Policing (BWP)I Broken windows imply ”no one cares”, leads to more crimeI So we should police small problems
I Two approaches to evaluate:I Policy Evaluation: RCT of BWP
I Direct policy relevance, expensive, perhaps infeasible.
I Mechanism Experiment: RCT of breaking widowsI No directly policy relevance, but useful, feasible and cheap.
An Approach
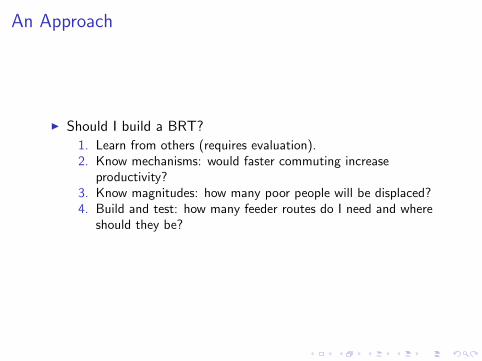
I Should I build a BRT?
1. Learn from others (requires evaluation).2. Know mechanisms: would faster commuting increase
productivity?3. Know magnitudes: how many poor people will be displaced?4. Build and test: how many feeder routes do I need and where
should they be?
Some Facts and Theories about Cities
The Role of Experiments
Examples
Question: Should we Encourate or Discourage Movement?
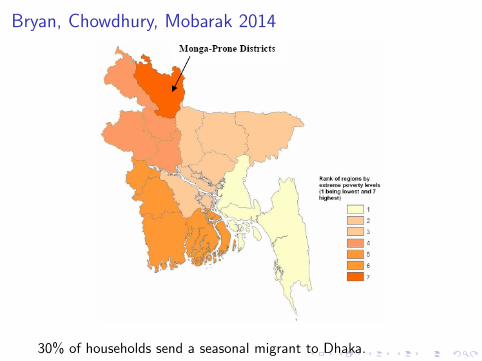
Bryan, Chowdhury, Mobarak 2014
30% of households send a seasonal migrant to Dhaka.

Possible Hypotheses
1. Migration allows people to increase their incomes, exploitingthe wage gap.
2. People of Rangpur are different, there may be gains todiscouraging migration.

How to we Distinguish?
I Experiment undertaken just before Monga 2008.
I 100 Villages in Lalmonirhat and Kurigram.I Four treatments:
I 16 control villages (304 hh);I 16 villages given information (304 hh);I 37 villages offered 600 Tk if they migrated (703 hh); andI 31 villages offered 600 Tk of credit if they migrated (589 hh).

Results: Migration Rate
0%#
10%#
20%#
30%#
40%#
50%#
60%#
70%#
Cash# Credit# info# control#
2008$Migra*on$Rate$
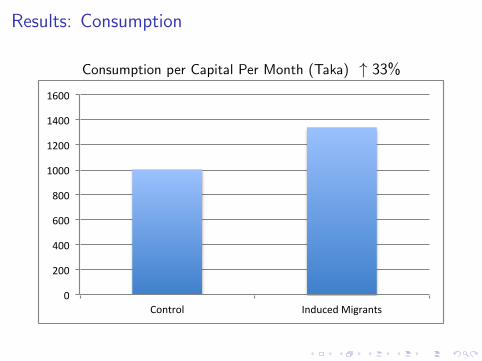
Results: Consumption
Consumption per Capital Per Month (Taka) ↑ 33%
0"
200"
400"
600"
800"
1000"
1200"
1400"
1600"
Control" Induced"Migrants"
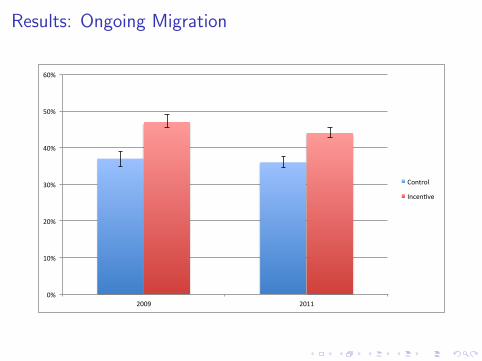
Results: Ongoing Migration
0%#
10%#
20%#
30%#
40%#
50%#
60%#
2009# 2011#
Control#
Incen4ve#

What do we learn?
I Migration restriction cannot be justified as helping migrants.
I Restriction must be based on large externalities
I Search for an optimal policy of encouragement!?
I An Example of a mechanism experiment.

Franklin 2015: Job Search in Addis
I Question:I Does commute cost hinder job search?
I DesignI 255 Individuals provided the cost of transport to the city if
they showed at a specific location.I 622 provided with no transport subsidy.
I Results:I Those that received the subsidy are 6% more likely to be
employed
I Sees a 6% rise in employment rates

What Do We Learn
I information Matters for Job search.
I Encouraging movement of information is valuable.
I Could we design a better policy?

Does Density Promote Innovation?

Theory
I Retail efficiency a large part of productivity:I Foster, Haltiwanger and Kirzan (2006)
I Density may help with the spread of ideas:I Easy for everyone to adopt Facebook in a city.I Easy for everyone to adopt Square in a city.
I But, hard to know if true:I Square targets the city.I People who live in cities are different.
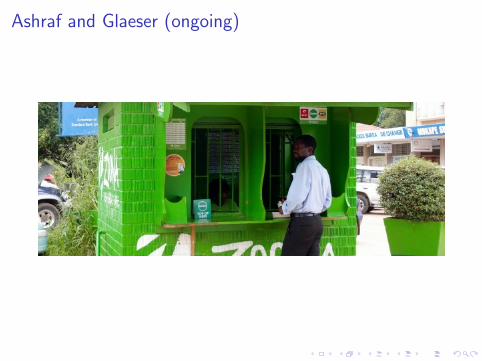
Ashraf and Glaeser (ongoing)

Experiment
1. Working with Zoona on Role out: Researchers know the plans
2. Random variation in geographic density of those given access.

What Can we Learn?
I Does density encourage the spread of new ideas.
I Is density relevant for encouraging productivity increase
I Proof of concept:I Can be applied to other technologies
How to Design Bus Rapid Transit?
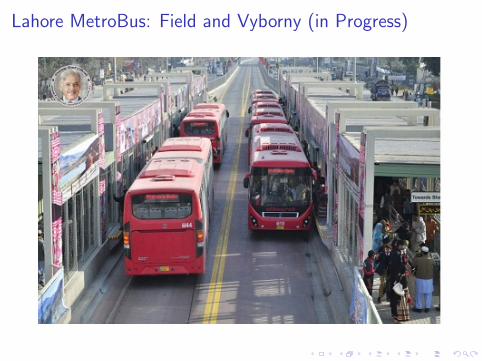
Lahore MetroBus: Field and Vyborny (in Progress)
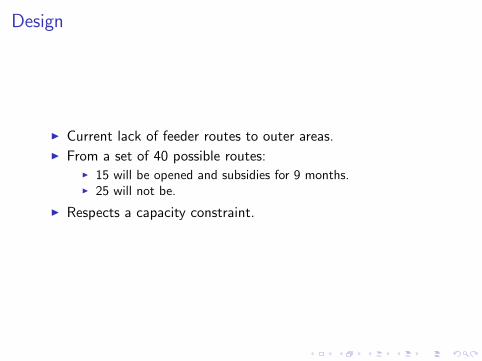
Design
I Current lack of feeder routes to outer areas.I From a set of 40 possible routes:
I 15 will be opened and subsidies for 9 months.I 25 will not be.
I Respects a capacity constraint.

What Can we Learn
I Policy evaluation:I Impact of having a feeder line on job outcomes, health, work
etc.
I Mechanism evaluation:I Impact of reducing movement costs.I Who benefits most from transportation access?

Dar Es Salaam Dart
I A QuestionI If rental prices rise along the Dart corridor, what will happen
to the poor?I Expected rent rise is about USD 20 per month.
I Experimental proposal:I Subsidies a years rent for 500 residents.I 500 control Residents
I What can we learn:I What happens to those who are forced to move?I Health, commute times, job prospects.

How should people be housed in Addis Ababa?

Questions about Housing
I Reasons to rehouse the poor:I Poor live in inadequate housing.I Housing is often in potentially high value areas.I Increase both amenity and density.
I Reasons to not rehouse the poor:I People live close to their jobsI People live in communitiesI Housing will be of low quality.I The poor will sell and housing subsidies will go to the rich.

AA Integrated Housing Development Program
Gebrehiwot, Franklin and Weldesilassie (In Progress)
I In 2015 about 100 000 housing units will be allocated toIndividuals.
I Falls well short of the 1 000 000 needed.I A fair way to allocate: Lottery among eligible applicants
I Creates a randomised controlled trial.I Those that do not win become a control group.
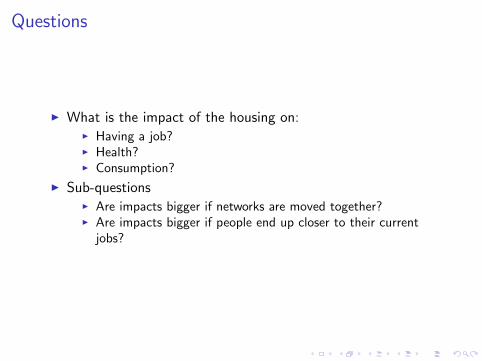
Questions
I What is the impact of the housing on:I Having a job?I Health?I Consumption?
I Sub-questionsI Are impacts bigger if networks are moved together?I Are impacts bigger if people end up closer to their current
jobs?
I A chance to learn from a large policy evaluation
I Results will be useful for other cities.
I In many cases randomisation is easy, as it is the onlyreasonable and ethical way to allocated goods in demand.

Conclusions
I Many more areas for possible experimentation:I Sanitation,I Taxation.I ...
I Hopefully we can learn what works.