Embed Size (px)
Citation preview
NASA
AVSCOMTechnical Memorandum 105729
Technical Report 92—C-013
Experimental Validation ofBoundary Element Methodsfor Noise Prediction
A.F. SeybertDepartment of Mechanical EngineeringUniversity of KentuckyLexington, Kentucky
and
Fred B. OswaldLewis Research CenterCleveland, Ohio
Prepared for theInter-Noise '92sponsored by the International Institute of Noise Control EngineeringToronto, Canada, July 20-22, 1992
SYSTEMS COMMANDNASAUS ARMYAVIATION
https://ntrs.nasa.gov/search.jsp?R=19930001778 2018-06-04T16:26:28+00:00Z

Experimental Validation of Boundary Element Methodsfor Noise Prediction
A. F. SeybertDepartment of Mechanical Engineering
University of Kentuckyand
Fred B. OswaldNASA Lewis Research Center
ABSTRACT
Experimental validation of methods to predict radiated noise is presented in thispaper. A combined finite element and boundary element model was used to predictthe vibration and noise of a rectangular box excited by a mechanical shaker. Thepredicted noise was compared to sound power measured by the acoustic intensitymethod. Inaccuracies in the finite element model shifted the resonancefrequencies by about 5 percent. The predicted and measured sound power levelsagree within about 2.5 dB. In a second experiment, measured vibration data wasused with a boundary element model to predict noise radiation from the top of anoperating gearbox. The predicted and measured sound power for the gearbox agreewithin about 3 dB.
INTRODUCTION
The prediction of noise in the design stage is important for building low-noisemachinery. In the past this was seldom done because the analysis techniqueslacked the necessary accuracy and detail. Except for the use of simple rules ofthumb, the designer's best guide was often years of experience and a largedatabase of old noise data. To shorten the time to bring a product to market,companies are now beginning to rely less on testing and more on analysis.However, the designer must have confidence in the analysis tools used.Confidence may be achieved in a variety of ways including comparison of predicteddata with test results. In this paper the acoustic boundary element (BE) methodis validated by comparing the predicted sound power of a test gearbox with thatmeasured using the sound intensity method. The vibration of the gearbox wasmeasured and used as input to the BE model.
An additional step in the prediction of noise occurs if the vibration ispredicted rather than measured using, for example, a finite element (FE) modelof the structure. In this paper a simple box-like structure was used to test thefeasibility of using a combined FE/BE model to predict both structural vibrationand radiated sound power.
PREDICTION OF NOISE OF TEST GEARBOX
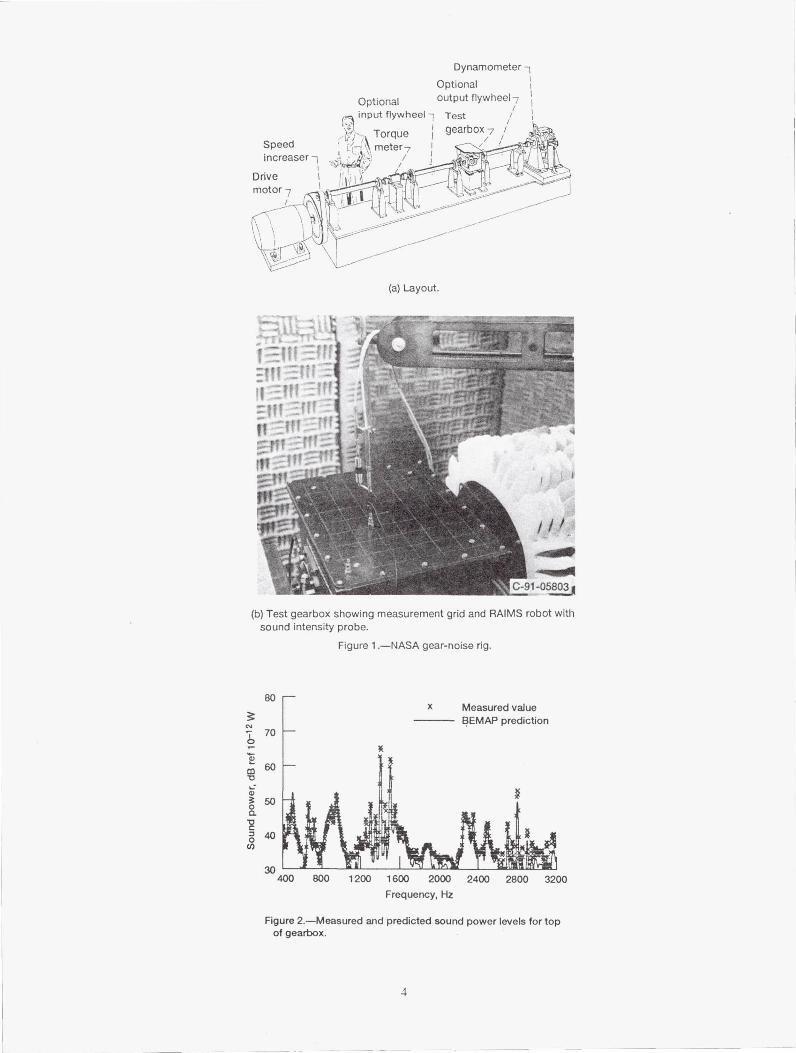
Figure 1 shows the NASA Lewis gear noise rig. The rig consists of asingle-mesh gearbox driven by a 150 Kw variable speed electric motor and loadedby an eddy-current dynamometer [1]. Figure lb shows the measurement of vibrationand sound intensity on the top surface of the gearbox. Also shown in this figureis the sound measuring apparatus. Only the top surface of the gearbox was usedto simplify and shorten the validation study. A pair of accelerometers was usedto measure vibration; one accelerometer was moved from point to point and thesecond accelerometer was fixed to maintain a constant phase datum.
The acceleration data were acquired by a two-channel spectrum analyzer,transferred to a desktop computer, and converted to real and imaginary componentsof velocity. These velocity components were used to produce an input file forthe BEMAP program [2]. For this work, a public-domain PC version of BEMAP wasused.

The vibration measurements were made on a rectangular grid of 7x9 points,as shown in Fig. lb. This grid was used in BEMAP to construct a boundary elementmesh of 48 linear elements; each element consisting of four nodes, one at eachcorner. Although BEMAP also contains the more efficient quadratic elements, thelinear quadrilateral element was selected because it matched the measurement gridon the top surface of the test gearbox. The rule of thumb for linear elementsis that the mesh size should not exceed one-quarter of a wavelength for thehighest frequency of interest. The nodal spacing was 38 mm; hence, the highestfrequency meeting this requirement strictly is 2250 Hz.
Figure 2 shows the comparison of the sound power measured using the soundintensity system in Fig lb [3] and that predicted from measured vibration usingBEMAP. The data in Fig. 2 were obtained for a running condition of 3000 rpm and68 Nm torque. Agreement is generally good throughout the frequency range, evenabove 2250 Hz, the limit suggested when using linear boundary elements.
A COMBINED FE/BE MODEL FOR NOISE PREDICTION
A box-like apparatus (Fig. 3) resembling the gearbox in Fig. 1 wasconstructed to evaluate the feasibility of using a combined FE/BE model for noiseprediction. The apparatus consisted of sides and bottom of 12.7 mm steel plateand a top surface of 1.6 mm aluminum plate [4].
Random excitation was applied to the apparatus in Fig. 3. The soundintensity was measured on a hemispherical surface over the apparatus which wasplaced on the floor of the laboratory. In addition, the force applied to the topsurface of the apparatus by the shaker was measured, and the measured sound powerwas normalized by this force for comparison to the predicted sound power basedon a unit force.
An FE model was constructed for only the top surface of the apparatus inFig. 3. The sides and bottom were not modeled as they were assumed to beperfectly rigid. The vibration level of the top surface was calculated for aunit input force using the ANSYS program. A software interface was used totransfer the FEM geometry and vibration data from ANSYS to BEMAP for theprediction of sound power per unit force. A BE model (Fig. 4) for the apparatuswas constructed using quadrilateral and triangular elements. The BE modelincluded the sides of the apparatus, even though the FE model did not. Thus, thethree-dimensional geometry of the apparatus was modeled, but any sound radiatedfrom the sides was neglected in the FE/BE model (i.e., in the BE model the nodeson the sides of the apparatus had zero velocity). Measurements showed that thevibration amplitude of the sides of the box was approximately 10 dB below thatof the top surface.
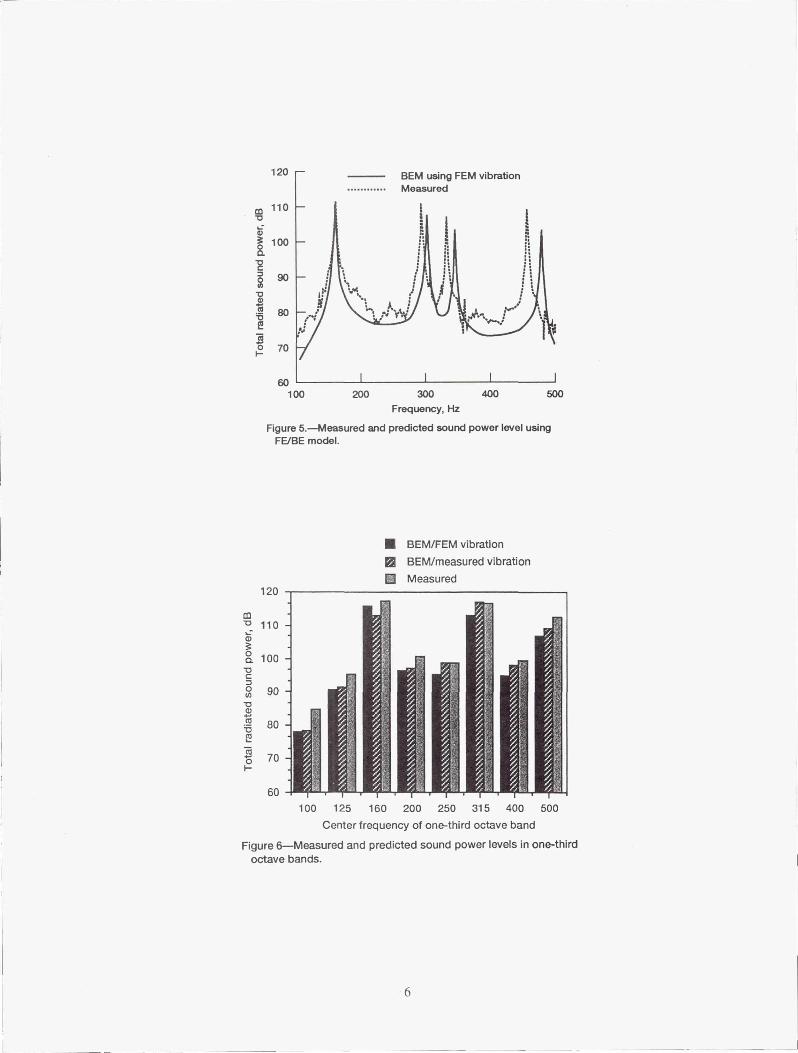
Figure 5 shows a comparison between the measured sound power and thatpredicted from the FE/BE model. Note the approximately 5 percent shift in theresonance frequencies due to the overly stiff FE model. Clamped boundaryconditions were assumed in the FE model of the top surface of the apparatus. Inthe actual apparatus the plate forming the top surface was restrained along itsperimeter by 12.7 mm square steel rods.
Figure 6 shows the measured and predicted sound power data from Fig. 4summed into one-third octave bands. Also shown in this figure is the sound powerpredicted from measured vibration. The measured vibration data were obtainedonly for the top of the apparatus in a manner similar to that described for thegearbox. The table below shows the overall linear and A-weighted sound powerlevels for the three spectra in Fig. 6.
A-weighted Linear
Measured 113.5 120.5
Predicted (measured vibration) 112.0 119.0
Predicted (FE vibration) 109.5 118.0
2
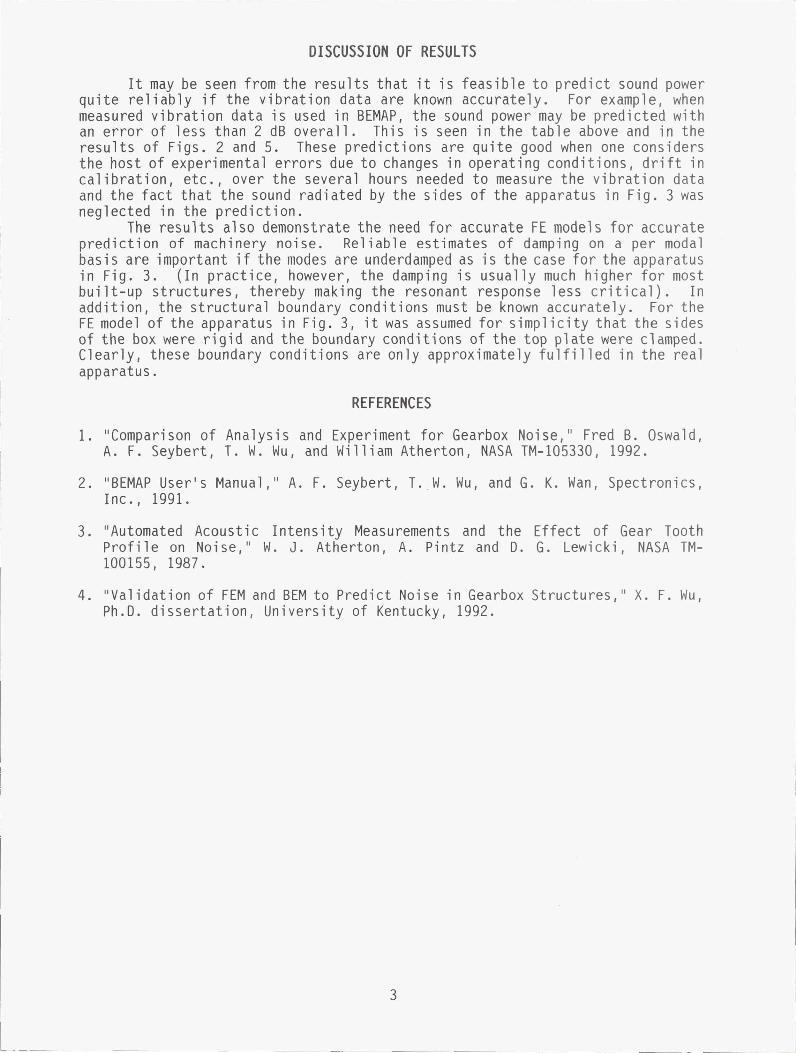
DISCUSSION OF RESULTS
It may be seen from the results that it is feasible to predict sound powerquite reliably if the vibration data are known accurately. For example, when
measured vibration data is used in BEMAP, the sound power may be predicted withan error of less than 2 dB overall. This is seen in the table above and in theresults of Figs. 2 and 5. These predictions are quite good when one considers
the host of experimental errors due to changes in operating conditions, drift in
calibration, etc., over the several hours needed to measure the vibration data
and the fact that the sound radiated by the sides of the apparatus in Fig. 3 was
neglected in the prediction.
The results also demonstrate the need for accurate FE models for accurateprediction of machinery noise. Reliable estimates of damping on a per modal
basis are important if the modes are underdamped as is the case for the apparatus
in Fig. 3. (In practice, however, the damping is usually much higher for most
built-up structures, thereby making the resonant response less critical). Inaddition, the structural boundary conditions must be known accurately. For theFE model of the apparatus in Fig. 3, it was assumed for simplicity that the sides
of the box were rigid and the boundary conditions of the top plate were clamped.Clearly, these boundary conditions are only approximately fulfilled in the real
apparatus.
REFERENCES
1. "Comparison of Analysis and Experiment for Gearbox Noise," Fred B. Oswald,A. F. Seybert, T. W. Wu, and William Atherton, NASA TM-105330, 1992.
2. "BEMAP User's Manual," A. F. Seybert, T. W. Wu, and G. K. Wan, Spectronics,
Inc., 1991.
3. "Automated Acoustic Intensity Measurements and the Effect of Gear ToothProfile on Noise," W. J. Atherton, A. Pintz and D. G. Lewicki, NASA TM-
100155, 1987.
4. "Validation of FEM and BEM to Predict Noise in Gearbox Structures," X. F. Wu,
Ph.D. dissertation, University of Kentucky, 1992.
3
f ^ItI ^^^i
^^-^rfr.^rrr
Y
C-91-058031
Dynamometer -1
Optional
Optional output flywheel-i
input flywheel Test
Torque gearbox 7 iSpeed 4 \ metersincreaser -Ii
Drivemotor?
(a) Layout.
(b) Test gearbox showing measurement grid and RAIMS robot withsound intensity probe.
Figure 1.—NASA gear-noise rig.
80
3N
b 70
m 60a
a 50a
0 40W
30 - —400 800 1200 1600 2000 2400 2800 3200
Frequency, Hz
Figure 2.—Measured and predicted sound power levels for topof gearbox.

Microphones
PersonalcomputerFlexible top plate r Accelerometer ^—+
MicrophoneImpedence AMPhead
Shaker
Stiff box
Power AMP
Signalgenerator
Charge AMP I I 1 Charge AMP
Spectral analyzer
Figure 3.—Apparatus to verity FEMBEM model.
Figure 4.—Boundary element meshfor apparatus in Fig. 3.
120 r BEM using FEM vibration......•••••• Measured
m 110 F–{a I i =
100
'•,
so
CO
70
so
100 200 300 400 500Frequency, Hz
Figure 5.—Measured and predicted sound power level usingFE/BE model.
E BEM/FEM vibration
® BEM/measured vibration
E3 Measured120
CO110
03a 100ac
N 90
CU 80
0 70
60
100 125 160 200 250 315 400 500
Center frequency of one-third octave band
Figure 6—Measured and predicted sound power levels in one-thirdoctave bands.
6
Form ApprovedREPORT DOCUMENTATION PAGE OMB No. 0704-0188
Public reporting burden for this collection of information is estimated toaverage 1 hour per response, including the time for reviewing instructions, searching existing data sources,gathering and maintaining the data needed, and completing and reviewing the collection of information. Send comments regarding this burden estimate or any other aspect of thiscollection of information, including suggestions for reducing this burden, to Washington Headquarters Services, Directorate for information Operations and Reports, 1215 JeffersonDavis Highway, Suite 1204, Arlington, VA 22202-4302, and to the Office of Management and Budget, Paperwork Reduction Project (0704-0188), Washington, DC 20503.
1. AGENCY USE ONLY (Leave blank) 2. REPORT DATE TYPE AND DATES COVEREDJIf Iv1992
7137REPO11`r
Technical Memorandum
4. TITLE AND SUBTITLE 5. FUNDING NUMBERS
Experimental Validation of Boundary Element
Methods for Noise Prediction
WU-505-63-366. AUTHOR(S)1L162211A47A
A.F. Seybert and Fred B. Oswald
7. PERFORMING ORGANIZATION NAME(S) AND ADDRESS(ES) 8. PERFORMING ORGANIZATIONREPORT NUMBER
National Aeronautics and Space Administration
Lewis Research Center E-7132Cleveland, Ohio 44135-3191
9. SPONSORING/MONITORING AGENCY NAMES(S) AND ADDRESS(ES) 10. SPONSORING/MONITORINGAGENCY REPORT NUMBER
National Aeronautics and Space Administration
Washington, D.C. 20546 -0001 NASA TM-105729
AVSCOM TR-92—C-013
11. SUPPLEMENTARY NOTES
Prepared for the Inter-Noise '92 sponsored by the International Institute of Noise Control Engineering, Toronto, Canada, July 20-22, 1992.
A.F. Seybert, Department of Mechanical Engineering, University of Kentucky, Lexington, Kentucky 40506, and Fred B. Oswald, NASA
Lewis Research Center, Cleveland, Ohio. Responsible person, Fred B. Oswald, (216) 433-3957.
12a. DISTRIBUTION/AVAILABILITY STATEMENT 12b. DISTRIBUTION CODE
Unclassified -Unlimited
Subject Category 37
13. ABSTRACT (Maximum 200 words)
Experimental validation of methods to predict radiated noise is presented in this paper. A combined finite element and
boundary element model was used to predict the vibration and noise of a rectangular box excited by a mechanical
shaker. The predicted noise was compared to sound power measured by the acoustic intensity method. Inaccuracies in
the finite element model shifted the resonance frequencies by about 5 percent. The predicted and measured sound
power levels agree within about 2.5 dB. In a second experiment, measured vibration data was used with a boundary
element model to predict noise radiation from the top of an operating gearbox. The predicted and measured sound
power for the gearbox agree within about 3 dB.
14. SUBJECT TERMS 15. NUMBER OF PAGES
Noise; Vibration; Acoustic intensity; Boundary element method; Finite element method 816. PRICE CODE
A0217. SECURITY CLASSIFICATION 18. SECURITY CLASSIFICATION 19. SECURITY CLASSIFICATION 20. LIMITATION OF ABSTRACT
OF REPORT OF THIS PAGE OF ABSTRACTUnclassified Unclassified Unclassified
NSN 7540-01-280-5500 Standard Form 298 (Rev. 2-89)Prescribed by ANSI Std. Z39-18298-102