Embed Size (px)
Citation preview
Experimental Tests of the Chiral Anomaly Magnetoresistancein the Dirac-Weyl Semimetals Na3Bi and GdPtBi
Sihang Liang,1 Jingjing Lin,1 Satya Kushwaha,2 Jie Xing,3 Ni Ni,3 R. J. Cava,2 and N. P. Ong1,*1Department of Physics, Princeton University, Princeton, New Jersey 08544, USA
2Department of Chemistry, Princeton University, Princeton, New Jersey 08544, USA3Department of Physics and Astronomy and California NanoSystems Institute,
University of California, Los Angeles, California 90095, USA
(Received 27 November 2017; revised manuscript received 7 June 2018; published 3 July 2018)
In the Dirac-Weyl semimetal, the chiral anomaly appears as an “axial” current arising from chargepumping between the lowest (chiral) Landau levels of the Weyl nodes, when an electric field is appliedparallel to a magnetic field B. Evidence for the chiral anomaly was obtained from the longitudinalmagnetoresistance (LMR) in Na3Bi and GdPtBi. However, current-jetting effects (focusing of the currentdensity J) have raised general concerns about LMR experiments. Here, we implement a litmus test thatallows the intrinsic LMR in Na3Bi and GdPtBi to be sharply distinguished from pure current-jetting effects(in pure Bi). Current jetting enhances J along the mid-line (spine) of the sample while decreasing it at theedge. We measure the distortion by comparing the local voltage drop at the spine (expressed as theresistance Rspine) with that at the edge (Redge). In Bi, Rspine sharply increases with B, but Redge decreases(jetting effects are dominant). However, in Na3Bi and GdPtBi, both Rspine and Redge decrease (jetting effectsare subdominant). A numerical simulation allows the jetting distortions to be removed entirely. We find thatthe intrinsic longitudinal resistivity ρxxðBÞ in Na3Bi decreases by a factor of 10.9 between B ¼ 0 and 10 T.A second litmus test is obtained from the parametric plot of the planar angular magnetoresistance. Theseresults considerably strengthen the evidence for the intrinsic nature of the chiral-anomaly-induced LMR.We briefly discuss how the squeeze test may be extended to test ZrTe5.
DOI: 10.1103/PhysRevX.8.031002 Subject Areas: Condensed Matter Physics,Topological Insulators
I. INTRODUCTION
In the past two decades, research on the Dirac states ingraphene and topological insulators has uncovered manynovel properties arising from their linear Dirac dispersion.In these materials, the Dirac states are confined to the two-dimensional (2D) plane. Interest in three-dimensional (3D)Dirac states may be traced to the even earlier prediction ofNielsen and Ninomiya (1983) [1] that the chiral anomalymay be observable in crystals (the space-time dimension3þ 1D needs to be even). The anomaly, which appears asa current in a longitudinal magnetic field B, arises from thebreaking of a fundamental, classical symmetry of masslessfermions—the chiral symmetry. Recent progress in topo-logical quantum matter has led to several systems that
feature protected 3D Dirac and Weyl states in thebulk [2,3].A crucial step in the search for 3D Dirac states was the
realization that inclusion of point group symmetry [withtime-reversal (TR) symmetry and inversion symmetry]allows Dirac nodes to be protected anywhere alongsymmetry axes, instead of being pinned to TR-invariantmomenta on the Brillouin zone surface [4,5]. Relaxationof this constraint led to the discovery of Na3Bi [6] andCd3As2, in which the two Dirac nodes are protected by C3
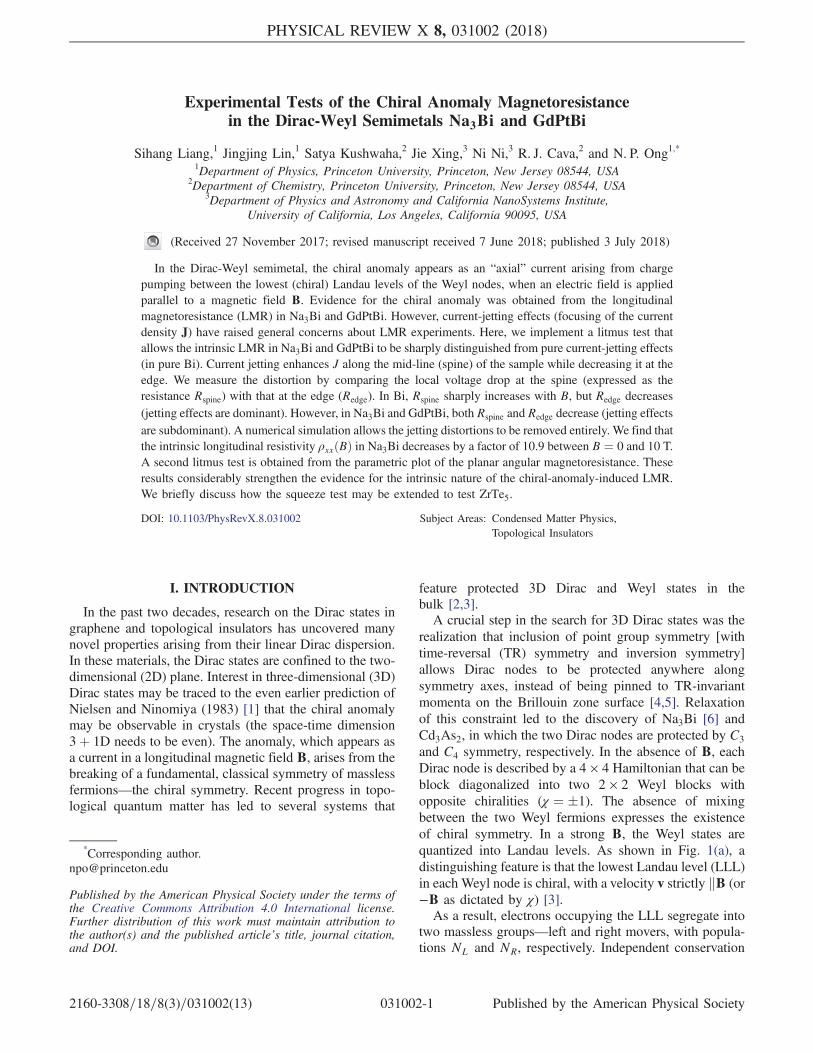
and C4 symmetry, respectively. In the absence of B, eachDirac node is described by a 4 × 4 Hamiltonian that can beblock diagonalized into two 2 × 2 Weyl blocks withopposite chiralities (χ ¼ �1). The absence of mixingbetween the two Weyl fermions expresses the existenceof chiral symmetry. In a strong B, the Weyl states arequantized into Landau levels. As shown in Fig. 1(a), adistinguishing feature is that the lowest Landau level (LLL)in each Weyl node is chiral, with a velocity v strictly kB (or−B as dictated by χ) [3].As a result, electrons occupying the LLL segregate into
two massless groups—left and right movers, with popula-tions NL and NR, respectively. Independent conservation
*Corresponding [email protected]
Published by the American Physical Society under the terms ofthe Creative Commons Attribution 4.0 International license.Further distribution of this work must maintain attribution tothe author(s) and the published article’s title, journal citation,and DOI.
PHYSICAL REVIEW X 8, 031002 (2018)
2160-3308=18=8(3)=031002(13) 031002-1 Published by the American Physical Society
of NL and NR implies that the chiral charge density ρ5 ¼ðNL − NRÞ=V is conserved, just like the total chargedensity ρtot ¼ ðNL þ NRÞ=V (V is the sample volume).However, application of an electric field EkB breaks thechiral symmetry by inducing mixing between the left- andright-moving branches [Fig. 1(a)] (for a pedagogical dis-cussion, see Ref. [7]). A consequence is that conservationof ρ5 is violated by a quantity A called the anomaly term,viz. ∇ · J5 þ ∂tρ
5 ¼ eA, where J5 is the axial currentdensity. [From the density of states in the LLL and therate of change ∂kz=∂t induced by E, we obtain A ¼ðe2=4π2ℏ2ÞE ·B.] The presence of J5 is detected as a large,negative, longitudinal magnetoresistance (LMR). Thisconstitutes the chiral anomaly. (The anomaly first appearedin the theory of π-meson decay [8,9]. See Refs. [10,11].)The conditions for observing the anomaly in Dirac semi-metals were discussed, e.g., in Refs. [3,12–15].In 2015, Xiong et al. reported the observation of a
fivefold to sixfold suppression of the LMR in Na3Bi,identified with the chiral anomaly [16]. A year later,Hirschberger et al. [17] observed the chiral anomaly,including its thermoelectric signature in the half-HeuslerGdPtBi. Although the low-lying states in GdPtBi are notDirac-like in zero B, the application of a Zeeman fieldsplits both conduction and valence bands to produceprotected crossings that define Weyl nodes. With BkE, afivefold LMR was observed with a profile very similar tothat in Na3Bi. In both Na3Bi and GdPtBi, the carriermobility is relatively low (3000 and 2000 cm2=Vs at 2 K,respectively).There have also been several reports of negative LMR
observed in the Weyl semimetals TaAs, NbP, and analogs[18–21]. However, the weakness of their LMR signals
(50–100 times weaker than in Na3Bi) and their fragilitywith respect to the placement of contacts, together withthe high mobilities of the Weyl semimetals (150 000 to200 000 cm2=Vs), have raised concerns about current-jetting artifacts [20,21]. As a consequence, there is consid-erable confusion and uncertainties about LMR experiments,in general, and the LMR reported in the Weyl semimetals, inparticular. The concerns seem to have spread to Na3Biand GdPtBi as well, notwithstanding their much largerLMR signal.There is good reason for the uncertainties. Among the
resistivity matrix elements, measurements of the longi-tudinal resistivity ρxx (for Bkx) are the most vulnerable toinhomogeneous flow caused by current jetting. Even whenthe LMR signal in a sample is mostly intrinsic, the chiralanomaly produces an intrinsic conductivity anisotropy u,which unavoidably produces inhomogeneous current dis-tributions that distort the observed LMR profile. Given theprominent role of LMR in chiral-anomaly investigations, itis highly desirable to understand these effects at a quanti-tative level and to develop a procedure that removes thedistortions.A major difference between the large LMR systems
Na3Bi and GdPtBi, on the one hand, and the Weyl semi-metals, on the other, is their carrier densities. Because thedensity is low in both Na3Bi (1 × 1017 cm−3) and inGdPtBi (1.5 × 1017 cm−3), the field BQ required to forcethe chemical potential ζ into the LLL is only 5–6 T. Bycontrast, BQ is 7–40 T in the Weyl semimetals. As shown inFig. 1(a), the physics underlying the anomaly involves theoccupation of chiral, massless states. Occupation of thehigher LLs (when B < BQ) leads to strong suppression ofthe anomaly [17]. Moreover, as discussed below, LMRmeasurements involve a competition between the anomalymechanism (“the quantum effect”) and classical current-jetting effects, which onset at a second field scale Bcyc.The relative magnitudes of these field scales dictate whicheffect dominates.Here, we report a series of experiments designed to
separate intrinsic from extrinsic effects in LMR experi-ments. Focusing of the current density JðrÞ into a beamstrongly reduces its value at the edges of a sample. Asshown in Sec. II, the effects of current jetting can be neatlyfactored into a quantity Ly (line integral of Jx), which canbe measured by local voltage contact pairs. By comparinglocal voltage drops at the maximum and minimum of theprofile of J, we devise a litmus test that sharply distin-guishes the two chiral-anomaly semimetals from the caseof pure Bi (Sec. III). Adopting a quantitative treatment(Sec. IV), we show how the intrinsic ρxxðBÞ can be derivedfrom the local voltage results. Applying this technique toNa3Bi, we obtain the intrinsic profiles of ρxxðBÞ and theanisotropy, with current-jetting distortions removed. Thedegree of distortion at each B value becomes plainlyevident. The competition between the quantum and
(a)
(c)
(b)
FIG. 1. (a) The Landau spectrum of Weyl fermions. In a fieldBkx, the lowest Landau levels are chiral with velocity v either kBor −B. Application ofEkB transfers charge between them, whichincreases the left-moving population NL at the expense of theright-moving population NR (the bold blue and red curvesindicate occupations of the LLs). Panel (b) shows a pair ofvoltage contacts (blue dots) placed on the line joining the currentcontacts (white circles). A second pair (yellow) is placed along anedge. Panel (c) is a schematic drawing of the intensity map of Jx(with dark regions being the most intense) when current-jettingeffects are pronounced. The profile of Jx vs y (with x at thedashed line) is sketched on the right.
SIHANG LIANG et al. PHYS. REV. X 8, 031002 (2018)
031002-2
classical effects is described in Sec. V. To look beyondNa3Bi and GdPtBi, we discuss how the tests can beextended using focused ion beam techniques to testZrTe5, which grows as a narrow ribbon. The Weylsemimetals, e.g., TaAs, require availability of ultrathinfilms. The planar angular magnetoresistance (Sec. VI)provides a second litmus test—one that is visually directwhen displayed as a parametric plot (Sec. VII). In Sec. VIII,we summarize our results.
II. THE SQUEEZE TEST
Current jetting refers to the focusing of the currentdensity JðrÞ into a narrow beam kB arising from the field-induced anisotropy u of the conductivity (the drift ofcarriers transverse to B is suppressed relative to thelongitudinal drift). To maximize the gradient of J alongthe y axis, we select platelike samples with L,w ≫ t, wherew, L, and t are the width, length, and thickness, respectively[Fig. 1(b)]. The x and y axes are aligned with the edges andBkx. As sketched in Fig. 1(c), the profile of Jx vs y isstrongly peaked at the center of the sample and suppressedtowards the edges. In the squeeze test, we measure thevoltage difference across a pair of contacts (blue dots)along the line joining the current contacts (which we callthe spine), as well as that across a pair on the edge (yellowdots). To accentuate current-jetting effects, we keep thecurrent contact diameters dc small (dc ≪ w) and place themon the top face of the sample wherever possible. (Thesqueeze test cannot be applied to needlelike crystals.)
A. Sample preparation
We provide details on the preparation of Na3Bi, whichis by far the most difficult of the three materials to workwith. Na3Bi crystallizes to form hexagonal platelets withthe broad face normal to (001). The crystals investigatedhere were grown under the same conditions as the samplesused in Xiong et al. [16]; they have carrier densities1 × 1017 cm−3 and BQ in the range 5–6 T. These crystalsshould be distinguished from an earlier batch [22] that havemuch higher carrier densities (3–6 × 1019 cm−3) for whichwe estimate BQ ∼ 100 T. No evidence for negative LMRwas obtained in the highly doped crystals [22].Because of the high Na content, crystals exposed to
ambient air undergo complete oxidation in about 5 s.The stainless growth tubes containing the crystals wereopened in an argon glovebox equipped with a stereoscopicmicroscope, and all sample preparation and mounting wereperformed within the glovebox. The crystals have theductility of a soft metal. Using a sharp razor, we cleavedthe bulk crystal into platelets 1 × 1 mm2 on a side withthickness 100 μm. Current and voltage contacts werepainted on using silver paint (Dupont 4922N). A majordifficulty was achieving low-resistance contacts on the topface (for measuring Rspine). After much experimentation,
we found it expedient to remove a thin layer of oxide bylightly sanding with fine emery paper (within the glove-box). The sample was then placed inside a capsule made ofG10 epoxy. After sealing the lid with STYCASTepoxy, thecapsule was transferred to the cryostat.We contrast two cases. In case 1, the anisotropy u ¼
σxx=σyy increases in a longitudinal field B because thetransverse conductivity σyy decreases steeply (as a result ofcyclotronic motion), while σxx is unchanged in B. WithBkx, the two-band model gives the resistivity matrix
ρðBÞ ¼� ½σe þ σh�−1 0
0 ½σeΔeþ σh
Δh�−1
�ð1Þ
(we suppress the z component for simplicity). The zero-Bconductivities of the electron and hole pockets are givenby σe ¼ neμe and σh ¼ peμh, with n and p the electronand hole densities, respectively, and e the elemental charge.Note that μe and μh are the mobilities in the electronand hole pockets, respectively, and Δe ¼ ð1þ μ2eB2Þ andΔh ¼ ð1þ μ2hB
2Þ. With Bkx, the off-diagonal elementsvanish. In case 1, we assume that σe and σh remainconstant. Hence, the observed resistivity ρxx is unchangedin B. However, the transverse conductivity σyy decreases(as 1=B2 in high B). The anisotropy arises solely from thesuppression of the conduction transverse to B by thecyclotron motion of both species of carriers.Case 2 is the chiral anomaly regime in the Dirac
semimetal. Charge pumping between Landau levels(LLs) of opposite chirality leads to an axial current thatcauses σxx to increase with B. Simultaneously, the 1Dnature of the LL dispersion suppresses the transverseconductivity σyy. Hence, the increase in u derives equallyfrom the opposite trends in σxx and σyy.Denoting field-induced changes by Δ, we have
Case 1∶ Δu > 0 ⇔ Δσxx ∼ 0;Δσyy < 0; ð2Þ
Case 2∶ Δu > 0 ⇔ Δσxx > 0;Δσyy < 0: ð3Þ
In the test, the voltage drops Vspine and Vedge are given by
VedgeðBÞ ¼ −ρxxðBÞZ
l
0
Jxðx; w=2;BÞdx≡ ρxxLe; ð4Þ
VspineðBÞ ¼ −ρxxðBÞZ
l
0
Jxðx; 0;BÞdx≡ ρxxLs; ð5Þ
where LeðBÞ and LsðBÞ are the line integrals of Jx alongthe edge and spine, respectively (l is the spacing betweenvoltage contacts). The intrinsic B dependence [expressed inρxxðBÞ] has been cleanly separated from the extrinsic Bdependence of LeðBÞ and LaðBÞ, which arises from currentfocusing effects.
EXPERIMENTAL TESTS OF THE CHIRAL ANOMALY … PHYS. REV. X 8, 031002 (2018)
031002-3
The area under the curve of Jx vs y is conserved, i.e.,
Zw=2
w=2Jxðx; y;BÞdy ¼ I; ð6Þ
with I the applied current. At B ¼ 0, we may take J to beuniform with the magnitude J0 ¼ I=ðwtÞ. The line integralreduces to L0 ¼ J0l. In finite B, focusing of the currentbeam implies that the current density is maximum alongthe spine and minimum at the edge, i.e., Jxðx; 0;BÞ >Jxðx; w=2;BÞ. Moreover, Eq. (6) implies that Jxðx; 0;BÞ >J0 > Jxðx; w=2;BÞ. Hence, the line integrals satisfy theinequalities
LsðBÞ > L0 > LeðBÞ: ð7Þ
If both σe and σh are B independent, as in case 1, we havefrom Eqs. (4), (5), and (8),
VspineðBÞ > V0 > VedgeðBÞ; ð8Þ
where V0 is the voltage drop across both pairs at B ¼ 0.Clearly, Vspine increases monotonically with B, while Vedge
decreases. Physically, focusing the current density alongthe spine increases the local E field there. Current con-servation then requires Jx to be proportionately suppressedalong the edges. Measuring Vedge alone yields a negativeLMR that is spurious.In case 2, however, ρxx decreases intrinsically with B
because of the chiral anomaly, while Ls increases.Competition between the two trends is explicitly seen inthe profile of Vspine vs B. As shown below, in Na3Bi andGdPtBi, the intrinsic decrease in ρxx dominates, so bothVspine and Vedge decrease with B. We remark that, fromEq. (8), Vspine always lies above Vedge. Moreover, when therate of increase in Ls begins to exceed (in the absolutesense) the rate of decrease in ρxx at sufficiently large B, thecurve of VspineðBÞ can display a broad minimum abovewhich Vspine increases.Hence, if both Vspine and Vedge are observed to decrease
with increasing B, the squeeze test provides positiveconfirmation that the observed LMR is intrinsic. Theirfield profiles bracket the intrinsic behavior of ρxx.Conversely, if intrinsic LMR is absent (i.e., σxx isunchanged), Vspine and Vedge display opposite trends (themarginal case when the intrinsic LMR is weak is discussedin Sec. IV).We remark that the current-jetting effects cannot be
eliminated by using very small samples (e.g., using nano-lithography). As long as we remain in the classical transportregime, the equations determining the functional form ofJðx; yÞ in strong B are scale invariant. Because intrinsiclength scales (e.g., the magnetic length lB or the skin depthδs) are absent in classical dc transport, the same flowpattern is obtained on either mm or micron-length scales.
III. RESULTS OF SQUEEZE TEST
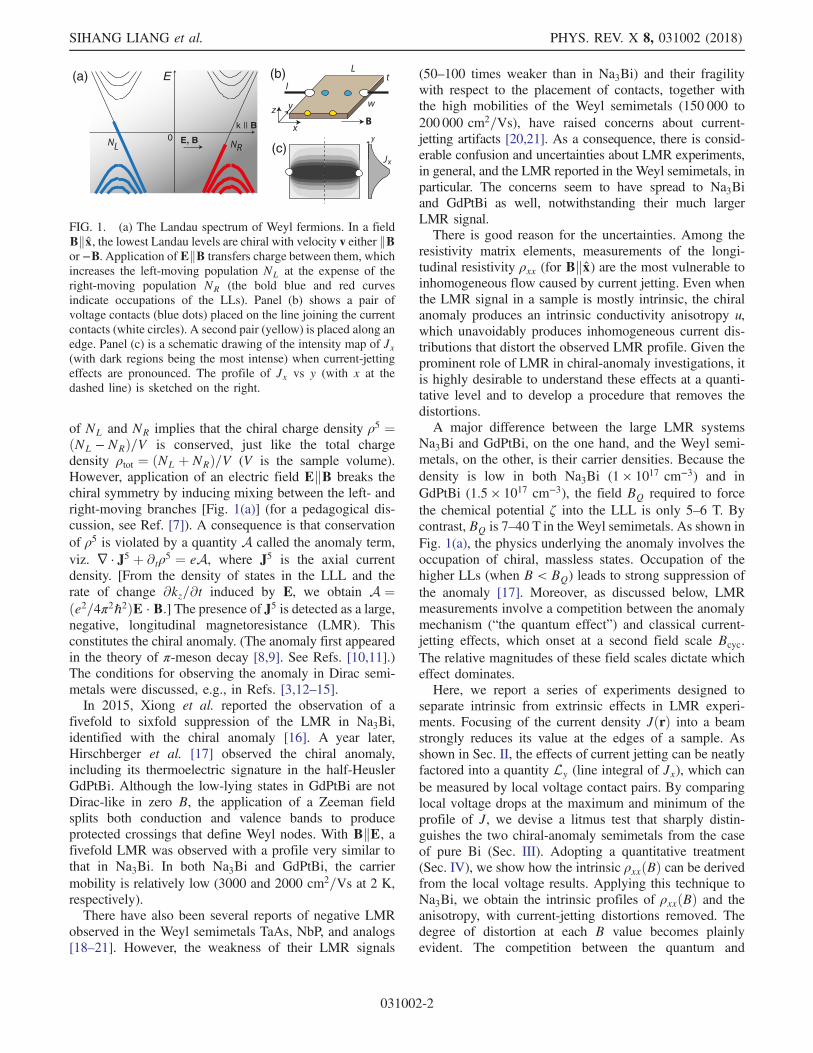
The results of applying the squeeze test on the threesystems are summarized in Fig. 2. In panels (a) and (b), weshow the voltage drops Vedge and Vspine measured in purebismuth (sample B1). The signals are expressed as theeffective resistances
Redge ¼ ρxxðBÞ:LeðBÞ=I; ð9Þ
Rspine ¼ ρxxðBÞ:LsðBÞ=I: ð10Þ
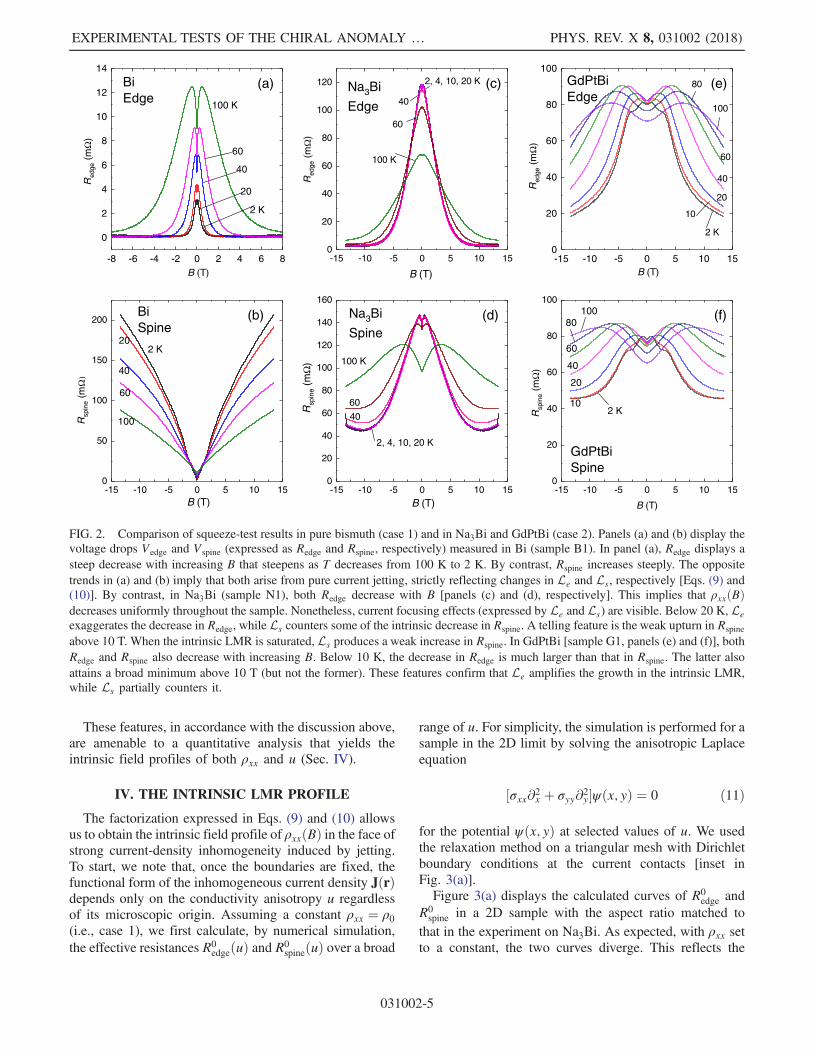
The steep decrease in Redge [panel (a)] illustrates how anapparent but spurious LMR can easily appear when themobility is very high (in Bi, μe exceeds 106 cm2=Vs at4 K). Comparison of Redge and Rspine measured simulta-neously shows that they have opposite trends vs B. As σeand σh are obviously B independent in Bi, ρxx is also Bindependent. By Eqs. (9) and (10), the changes arise solelyfrom Le and Ls. Hence, Figs. 2(a) and 2(b) verifyexperimentally that Vedge and Vspine display the predictedlarge variations of opposite signs when current jetting is thesole mechanism present (see simulations in Sec. IV).Next, we consider Na3Bi. In this sample (N1), Redge
below 20 K decreases by a factor of 50 between B ¼ 0 and10 T [Fig. 2(c)]. This is an order of magnitude larger thanobserved in Ref. [16]. The increase arises from theenhanced current focusing effect in the present contactplacement utilizing small current contacts attached to thebroad face of the crystal, as well as a larger u. In spite ofthe enhanced jetting, Rspine shows a pronounced decrease incontrast to the case for Bi. The intrinsic decrease in ρxxdominates the increase in Ls throughout [see Eq. (10)].Hence, we conclude that there exists a large intrinsic,negative LMR that forces Rspine to decrease, despite thefocusing of JðrÞ along the ridge. Further evidence for thecompeting scenario comes from the weak minimum at 10 Tin the curves below 40 K in Fig. 2(d). As anticipated above,in large B, ρxx approaches a constant because of thesaturation chiral-anomaly term. However, Ls continuesto increase because the transverse conductance worsens.Consequently, Rspine goes through a minimum beforeincreasing. This is seen in Rspine but absent in Redge.A feature that we currently do not understand is the large
V-shaped cusp in weak B. At 100 K, the cusp is prominentin Vspine but absent in Vedge.In Figs. 2(e) and 2(f), we show the field profiles of Redge
and Rspine measured in GdPtBi (sample G1). Again, as inNa3Bi, the anomaly-induced decrease in ρxx dominates theincrease in Ls, and Rspine is observed to decrease inincreasing B. The relative decrease in Redge is larger thanthat in Rspine. Further, Rspine below 10 K shows the onset ofa broad minimum above 10 T [Fig. 2(f)], whereas Redge
continues to fall.
SIHANG LIANG et al. PHYS. REV. X 8, 031002 (2018)
031002-4
These features, in accordance with the discussion above,are amenable to a quantitative analysis that yields theintrinsic field profiles of both ρxx and u (Sec. IV).
IV. THE INTRINSIC LMR PROFILE
The factorization expressed in Eqs. (9) and (10) allowsus to obtain the intrinsic field profile of ρxxðBÞ in the face ofstrong current-density inhomogeneity induced by jetting.To start, we note that, once the boundaries are fixed, thefunctional form of the inhomogeneous current density JðrÞdepends only on the conductivity anisotropy u regardlessof its microscopic origin. Assuming a constant ρxx ¼ ρ0(i.e., case 1), we first calculate, by numerical simulation,the effective resistances R0
edgeðuÞ and R0spineðuÞ over a broad
range of u. For simplicity, the simulation is performed for asample in the 2D limit by solving the anisotropic Laplaceequation
½σxx∂2x þ σyy∂2
y�ψðx; yÞ ¼ 0 ð11Þ
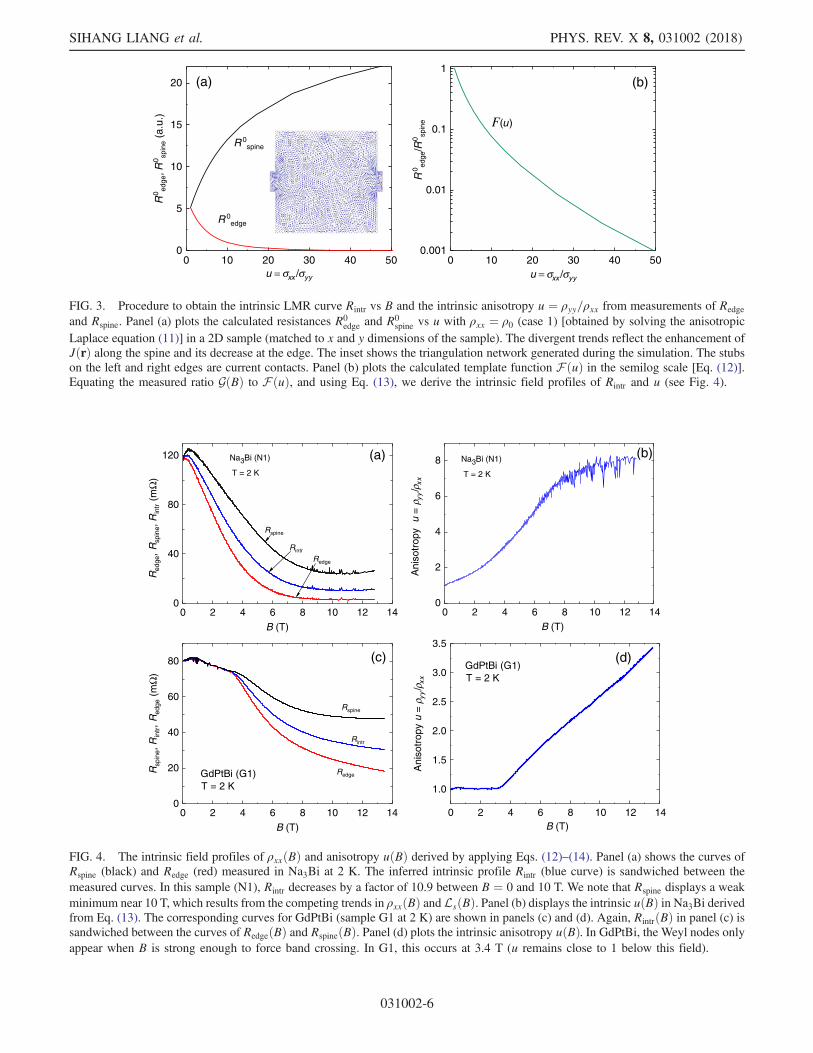
for the potential ψðx; yÞ at selected values of u. We usedthe relaxation method on a triangular mesh with Dirichletboundary conditions at the current contacts [inset inFig. 3(a)].Figure 3(a) displays the calculated curves of R0
edge andR0spine in a 2D sample with the aspect ratio matched to
that in the experiment on Na3Bi. As expected, with ρxx setto a constant, the two curves diverge. This reflects the
-15 -10 -5 0 5 10 150
50
100
150
200
-8 -6 -4 -2 0 2 4 6 8
0
2
4
6
8
10
12
14
-15 -10 -5 0 5 10 150
20
40
60
80
100
120
-15 -10 -5 0 5 10 150
20
40
60
80
100
120
140
160
-15 -10 -5 0 5 10 150
20
40
60
80
100
-15 -10 -5 0 5 10 150
20
40
60
80
100BiSpine
(b)
2 K20
40
60
Rsp
ine
(mΩ
)
100
2 K
20
40
60
Red
ge(m
Ω)
B (T)
100 K
BiEdge
(a)
Red
ge(m
Ω)
(c)
100 K
60
B (T)
2, 4, 10, 20 K
40Na3Bi
Edge
Na3Bi
Spine(d)
100 K
60
40
2, 4, 10, 20 K
Rsp
ine
(mΩ
)
B (T)B (T)
(e)
100
80
60
40
Red
ge(m
Ω)
B (T)
2 K
10
20
GdPtBiEdge
GdPtBiSpine
(f)10080
60
40
20
10
Rsp
ine
(mΩ
)
B (T)
2 K
FIG. 2. Comparison of squeeze-test results in pure bismuth (case 1) and in Na3Bi and GdPtBi (case 2). Panels (a) and (b) display thevoltage drops Vedge and Vspine (expressed as Redge and Rspine, respectively) measured in Bi (sample B1). In panel (a), Redge displays asteep decrease with increasing B that steepens as T decreases from 100 K to 2 K. By contrast, Rspine increases steeply. The oppositetrends in (a) and (b) imply that both arise from pure current jetting, strictly reflecting changes in Le and Ls, respectively [Eqs. (9) and(10)]. By contrast, in Na3Bi (sample N1), both Redge decrease with B [panels (c) and (d), respectively]. This implies that ρxxðBÞdecreases uniformly throughout the sample. Nonetheless, current focusing effects (expressed by Le and Ls) are visible. Below 20 K, Leexaggerates the decrease in Redge, while Ls counters some of the intrinsic decrease in Rspine. A telling feature is the weak upturn in Rspine
above 10 T. When the intrinsic LMR is saturated, Ls produces a weak increase in Rspine. In GdPtBi [sample G1, panels (e) and (f)], bothRedge and Rspine also decrease with increasing B. Below 10 K, the decrease in Redge is much larger than that in Rspine. The latter alsoattains a broad minimum above 10 T (but not the former). These features confirm that Le amplifies the growth in the intrinsic LMR,while Ls partially counters it.
EXPERIMENTAL TESTS OF THE CHIRAL ANOMALY … PHYS. REV. X 8, 031002 (2018)
031002-5
0 10 20 30 40
(a) (b)
500
5
10
15
20
0 10 20 30 40 500.001
0.01
0.1
1
R 0spine
R0 ed
ge,R
0 spin
e(a
.u.)
u = σxx /σyy
R 0edge
R0 ed
ge/R
0 spin
e
u = σxx /σyy
F(u)
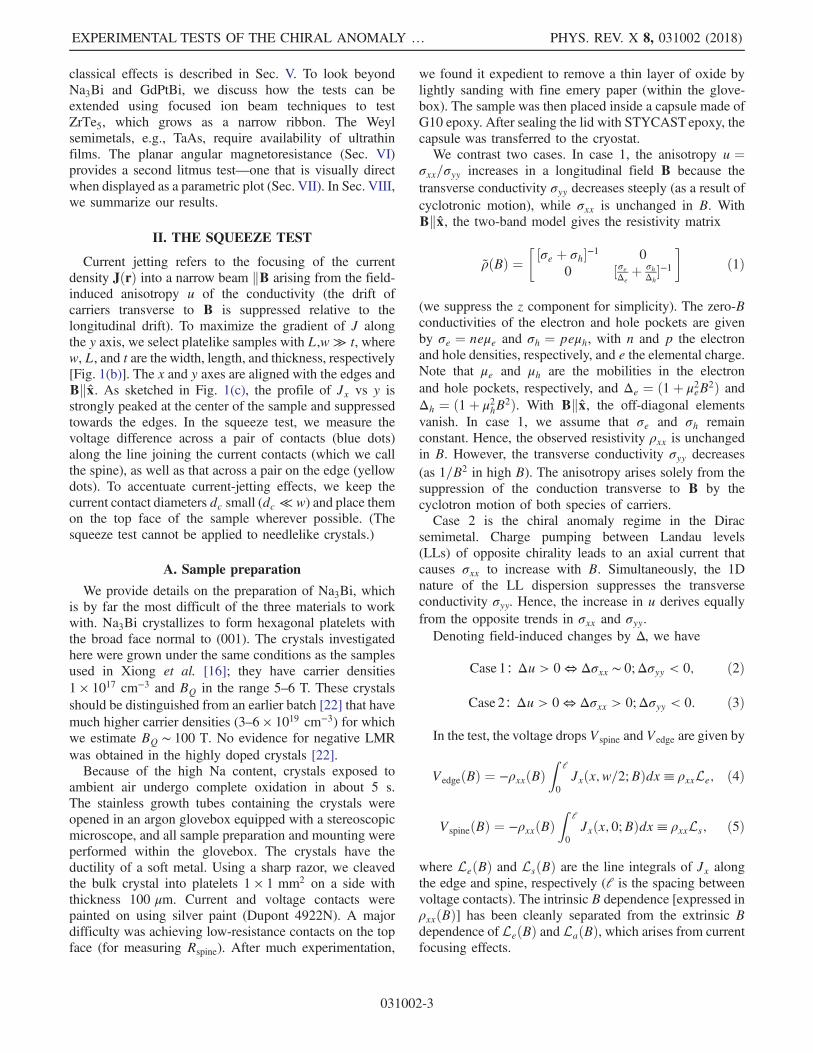
FIG. 3. Procedure to obtain the intrinsic LMR curve Rintr vs B and the intrinsic anisotropy u ¼ ρyy=ρxx from measurements of Redge
and Rspine. Panel (a) plots the calculated resistances R0edge and R0
spine vs u with ρxx ¼ ρ0 (case 1) [obtained by solving the anisotropicLaplace equation (11)] in a 2D sample (matched to x and y dimensions of the sample). The divergent trends reflect the enhancement ofJðrÞ along the spine and its decrease at the edge. The inset shows the triangulation network generated during the simulation. The stubson the left and right edges are current contacts. Panel (b) plots the calculated template function F ðuÞ in the semilog scale [Eq. (12)].Equating the measured ratio GðBÞ to F ðuÞ, and using Eq. (13), we derive the intrinsic field profiles of Rintr and u (see Fig. 4).
0 2 4 6 8 10 12 140
40
80
120
0 2 4 6 8 10 12 140
2
4
6
8
0 2 4 6 8 10 12 140
20
40
60
80
0 2 4 6 8 10 12 14
1.0
1.5
2.0
2.5
3.0
3.5
(a)Na3Bi (N1)
T = 2 K
Rintr
Redge
Red
ge,R
spin
e,R
intr
(mΩ
)
B (T)
Rspine
Na3Bi (N1)
T = 2 K
(b)
Ani
sotr
opy
u=
B (T)
(c)
Redge
Rintr
Rsp
ine,
Rin
tr,R
edge
(mΩ
)
B (T)
Rspine
GdPtBi (G1)T = 2 K
(d)
Ani
sotr
opy
u=
ρρ
yy/
xx
ρρ
yy/
xx
B (T)
GdPtBi (G1)T = 2 K
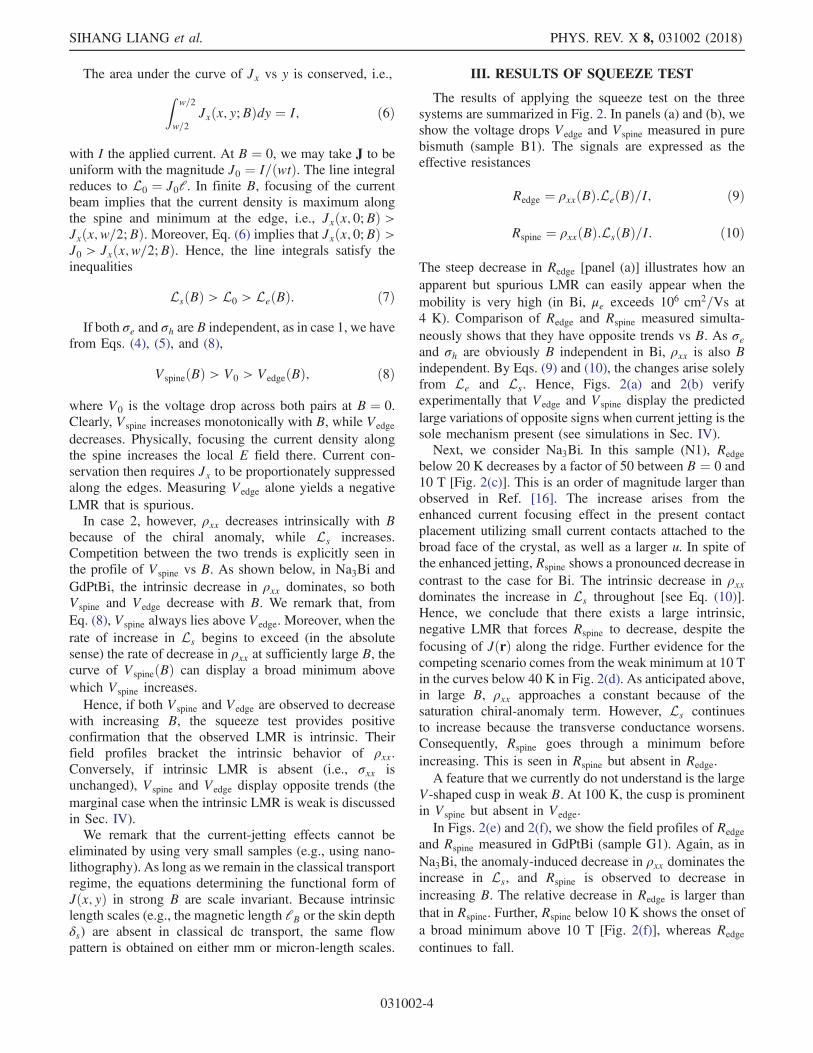
FIG. 4. The intrinsic field profiles of ρxxðBÞ and anisotropy uðBÞ derived by applying Eqs. (12)–(14). Panel (a) shows the curves ofRspine (black) and Redge (red) measured in Na3Bi at 2 K. The inferred intrinsic profile Rintr (blue curve) is sandwiched between themeasured curves. In this sample (N1), Rintr decreases by a factor of 10.9 between B ¼ 0 and 10 T. We note that Rspine displays a weakminimum near 10 T, which results from the competing trends in ρxxðBÞ andLsðBÞ. Panel (b) displays the intrinsic uðBÞ in Na3Bi derivedfrom Eq. (13). The corresponding curves for GdPtBi (sample G1 at 2 K) are shown in panels (c) and (d). Again, RintrðBÞ in panel (c) issandwiched between the curves of RedgeðBÞ and RspineðBÞ. Panel (d) plots the intrinsic anisotropy uðBÞ. In GdPtBi, the Weyl nodes onlyappear when B is strong enough to force band crossing. In G1, this occurs at 3.4 T (u remains close to 1 below this field).
SIHANG LIANG et al. PHYS. REV. X 8, 031002 (2018)
031002-6
simultaneous enhancement of the E field along the spineand its steep decrease at the edge caused by pure currentjetting.From the calculated resistances, we form the ratio
F ðuÞ ¼ R0edge=R
0spine ¼ Le=Ls: ð12Þ
The template curve F ðuÞ, which depends only on u, isplotted in semilog scale in Fig. 3(b).Turning to the values of RedgeðBÞ and RspineðBÞmeasured
in Na3Bi at the field B, we form the ratio GðBÞ ¼Redge=Rspine ¼ Le=Ls. Although G is implicitly a functionof u, it is experimentally determined as a function of B(how u varies with B is not yet known). We remark thatGðBÞ and F ðuÞ represent the same physical quantityexpressed as functions of different variables. To find u,we equate GðBÞ to F ðuÞ in the template curve. This processleads to the equation
uðBÞ ¼ F−1(GðBÞ); ð13Þ
from which we determine u given B. Finally, because R0edge
and R0spine are known from the simulation, we obtain the
intrinsic profile of ρxx as a function of B using the relations
ρxxðBÞ ¼RedgeðBÞR0edgeðuÞ
ρ0 ¼RspineðBÞR0spineðuÞ
ρ0: ð14Þ
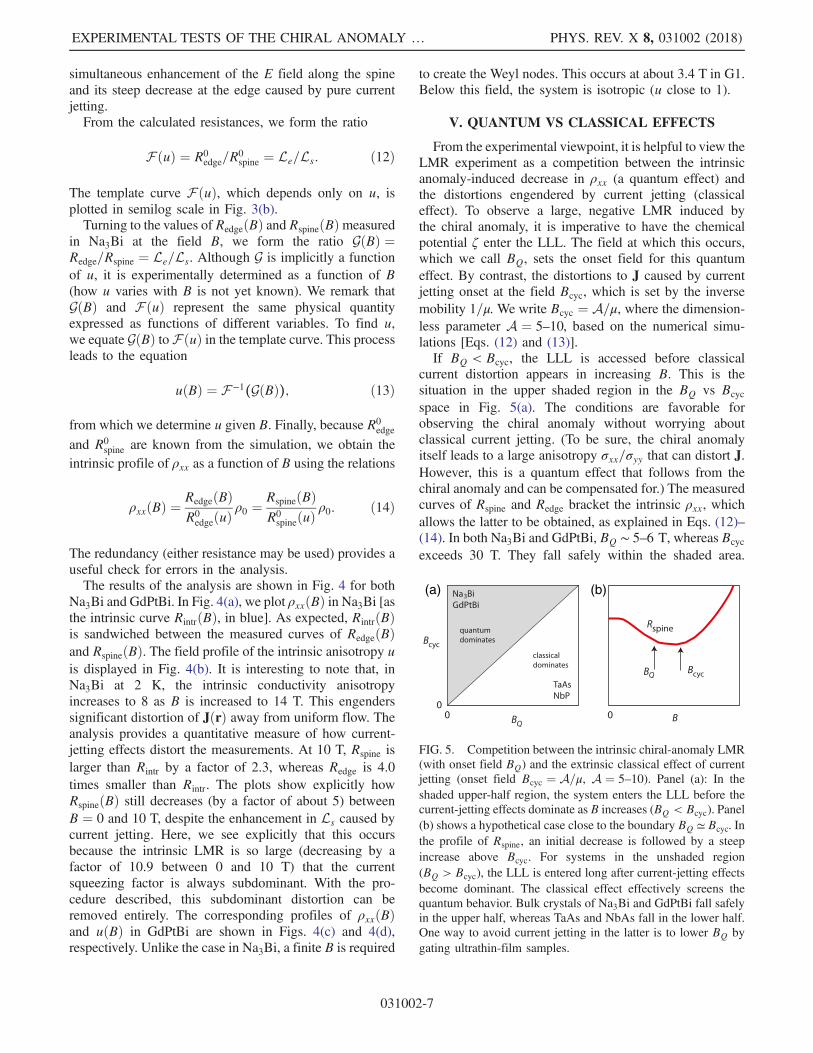
The redundancy (either resistance may be used) provides auseful check for errors in the analysis.The results of the analysis are shown in Fig. 4 for both
Na3Bi and GdPtBi. In Fig. 4(a), we plot ρxxðBÞ in Na3Bi [asthe intrinsic curve RintrðBÞ, in blue]. As expected, RintrðBÞis sandwiched between the measured curves of RedgeðBÞand RspineðBÞ. The field profile of the intrinsic anisotropy uis displayed in Fig. 4(b). It is interesting to note that, inNa3Bi at 2 K, the intrinsic conductivity anisotropyincreases to 8 as B is increased to 14 T. This engenderssignificant distortion of JðrÞ away from uniform flow. Theanalysis provides a quantitative measure of how current-jetting effects distort the measurements. At 10 T, Rspine islarger than Rintr by a factor of 2.3, whereas Redge is 4.0times smaller than Rintr. The plots show explicitly howRspineðBÞ still decreases (by a factor of about 5) betweenB ¼ 0 and 10 T, despite the enhancement in Ls caused bycurrent jetting. Here, we see explicitly that this occursbecause the intrinsic LMR is so large (decreasing by afactor of 10.9 between 0 and 10 T) that the currentsqueezing factor is always subdominant. With the pro-cedure described, this subdominant distortion can beremoved entirely. The corresponding profiles of ρxxðBÞand uðBÞ in GdPtBi are shown in Figs. 4(c) and 4(d),respectively. Unlike the case in Na3Bi, a finite B is required
to create the Weyl nodes. This occurs at about 3.4 T in G1.Below this field, the system is isotropic (u close to 1).
V. QUANTUM VS CLASSICAL EFFECTS
From the experimental viewpoint, it is helpful to view theLMR experiment as a competition between the intrinsicanomaly-induced decrease in ρxx (a quantum effect) andthe distortions engendered by current jetting (classicaleffect). To observe a large, negative LMR induced bythe chiral anomaly, it is imperative to have the chemicalpotential ζ enter the LLL. The field at which this occurs,which we call BQ, sets the onset field for this quantumeffect. By contrast, the distortions to J caused by currentjetting onset at the field Bcyc, which is set by the inversemobility 1=μ. We write Bcyc ¼ A=μ, where the dimension-less parameter A ¼ 5–10, based on the numerical simu-lations [Eqs. (12) and (13)].If BQ < Bcyc, the LLL is accessed before classical
current distortion appears in increasing B. This is thesituation in the upper shaded region in the BQ vs Bcyc
space in Fig. 5(a). The conditions are favorable forobserving the chiral anomaly without worrying aboutclassical current jetting. (To be sure, the chiral anomalyitself leads to a large anisotropy σxx=σyy that can distort J.However, this is a quantum effect that follows from thechiral anomaly and can be compensated for.) The measuredcurves of Rspine and Redge bracket the intrinsic ρxx, whichallows the latter to be obtained, as explained in Eqs. (12)–(14). In both Na3Bi and GdPtBi, BQ ∼ 5–6 T, whereas Bcyc
exceeds 30 T. They fall safely within the shaded area.
(a) (b)
FIG. 5. Competition between the intrinsic chiral-anomaly LMR(with onset field BQ) and the extrinsic classical effect of currentjetting (onset field Bcyc ¼ A=μ, A ¼ 5–10). Panel (a): In theshaded upper-half region, the system enters the LLL before thecurrent-jetting effects dominate as B increases (BQ < Bcyc). Panel(b) shows a hypothetical case close to the boundary BQ ≃ Bcyc. Inthe profile of Rspine, an initial decrease is followed by a steepincrease above Bcyc. For systems in the unshaded region(BQ > Bcyc), the LLL is entered long after current-jetting effectsbecome dominant. The classical effect effectively screens thequantum behavior. Bulk crystals of Na3Bi and GdPtBi fall safelyin the upper half, whereas TaAs and NbAs fall in the lower half.One way to avoid current jetting in the latter is to lower BQ bygating ultrathin-film samples.
EXPERIMENTAL TESTS OF THE CHIRAL ANOMALY … PHYS. REV. X 8, 031002 (2018)
031002-7
As BQ approaches Bcyc [the diagonal boundary in Fig. 5(a)],classical current jetting becomes increasingly problematical.In Fig. 5(b), the schematic curve illustrates the trend of howthe quantum behavior can be swamped by the onset ofcurrent jetting.Finally, if BQ ≫ Bcyc, classical distortion effects onset
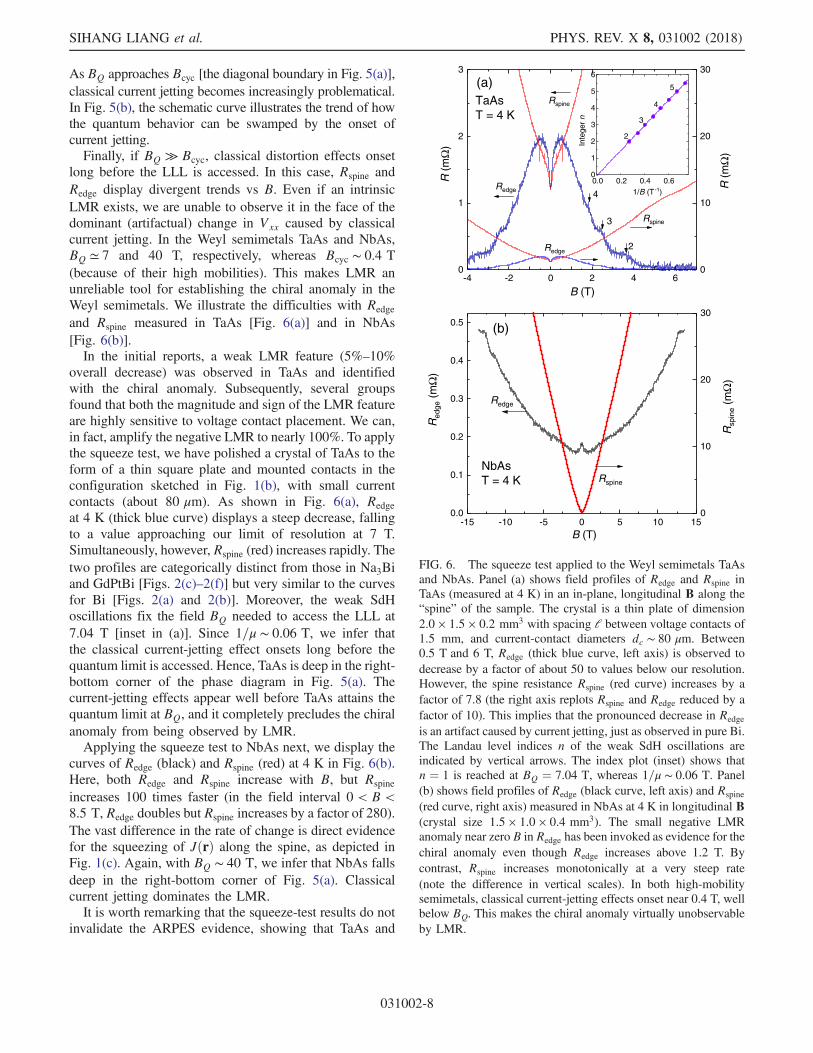
long before the LLL is accessed. In this case, Rspine andRedge display divergent trends vs B. Even if an intrinsicLMR exists, we are unable to observe it in the face of thedominant (artifactual) change in Vxx caused by classicalcurrent jetting. In the Weyl semimetals TaAs and NbAs,BQ ≃ 7 and 40 T, respectively, whereas Bcyc ∼ 0.4 T(because of their high mobilities). This makes LMR anunreliable tool for establishing the chiral anomaly in theWeyl semimetals. We illustrate the difficulties with Redge
and Rspine measured in TaAs [Fig. 6(a)] and in NbAs[Fig. 6(b)].In the initial reports, a weak LMR feature (5%–10%
overall decrease) was observed in TaAs and identifiedwith the chiral anomaly. Subsequently, several groupsfound that both the magnitude and sign of the LMR featureare highly sensitive to voltage contact placement. We can,in fact, amplify the negative LMR to nearly 100%. To applythe squeeze test, we have polished a crystal of TaAs to theform of a thin square plate and mounted contacts in theconfiguration sketched in Fig. 1(b), with small currentcontacts (about 80 μm). As shown in Fig. 6(a), Redgeat 4 K (thick blue curve) displays a steep decrease, fallingto a value approaching our limit of resolution at 7 T.Simultaneously, however, Rspine (red) increases rapidly. Thetwo profiles are categorically distinct from those in Na3Biand GdPtBi [Figs. 2(c)–2(f)] but very similar to the curvesfor Bi [Figs. 2(a) and 2(b)]. Moreover, the weak SdHoscillations fix the field BQ needed to access the LLL at7.04 T [inset in (a)]. Since 1=μ ∼ 0.06 T, we infer thatthe classical current-jetting effect onsets long before thequantum limit is accessed. Hence, TaAs is deep in the right-bottom corner of the phase diagram in Fig. 5(a). Thecurrent-jetting effects appear well before TaAs attains thequantum limit at BQ, and it completely precludes the chiralanomaly from being observed by LMR.Applying the squeeze test to NbAs next, we display the
curves of Redge (black) and Rspine (red) at 4 K in Fig. 6(b).Here, both Redge and Rspine increase with B, but Rspine
increases 100 times faster (in the field interval 0 < B <8.5 T, Redge doubles but Rspine increases by a factor of 280).The vast difference in the rate of change is direct evidencefor the squeezing of JðrÞ along the spine, as depicted inFig. 1(c). Again, with BQ ∼ 40 T, we infer that NbAs fallsdeep in the right-bottom corner of Fig. 5(a). Classicalcurrent jetting dominates the LMR.It is worth remarking that the squeeze-test results do not
invalidate the ARPES evidence, showing that TaAs and
0
1
2
3
-4 -2 0 2 4 60
10
20
30
0.0 0.2 0.4 0.60
1
2
3
4
5
6
-15 -10 -5 0 5 10 150.0
0.1
0.2
0.3
0.4
0.5
0
10
20
30
Redge
4
Rspine
Rspine
R(m
Ω)
Redge
3
2
R(m
Ω)
B (T)
B (T)
TaAsT = 4 K
(a) 5
4
3
Inte
ger
n
1/B (T-1)
2
Red
ge(m
Ω)
Rspine
Redge
(b)
Rsp
ine
(mΩ
)
NbAsT = 4 K
FIG. 6. The squeeze test applied to the Weyl semimetals TaAsand NbAs. Panel (a) shows field profiles of Redge and Rspine inTaAs (measured at 4 K) in an in-plane, longitudinal B along the“spine” of the sample. The crystal is a thin plate of dimension2.0 × 1.5 × 0.2 mm3 with spacing l between voltage contacts of1.5 mm, and current-contact diameters dc ∼ 80 μm. Between0.5 T and 6 T, Redge (thick blue curve, left axis) is observed todecrease by a factor of about 50 to values below our resolution.However, the spine resistance Rspine (red curve) increases by afactor of 7.8 (the right axis replots Rspine and Redge reduced by afactor of 10). This implies that the pronounced decrease in Redge
is an artifact caused by current jetting, just as observed in pure Bi.The Landau level indices n of the weak SdH oscillations areindicated by vertical arrows. The index plot (inset) shows thatn ¼ 1 is reached at BQ ¼ 7.04 T, whereas 1=μ ∼ 0.06 T. Panel(b) shows field profiles of Redge (black curve, left axis) and Rspine
(red curve, right axis) measured in NbAs at 4 K in longitudinal B(crystal size 1.5 × 1.0 × 0.4 mm3). The small negative LMRanomaly near zero B in Redge has been invoked as evidence for thechiral anomaly even though Redge increases above 1.2 T. Bycontrast, Rspine increases monotonically at a very steep rate(note the difference in vertical scales). In both high-mobilitysemimetals, classical current-jetting effects onset near 0.4 T, wellbelow BQ. This makes the chiral anomaly virtually unobservableby LMR.
SIHANG LIANG et al. PHYS. REV. X 8, 031002 (2018)
031002-8
NbAs are Weyl semimetals. Rather, they demonstrate thatthe negative LMR results reported to date in the Weylsemimetals fall deep in the regime where classical current-jetting effects dominate.Figure 5(a) suggests a way to avoid the screening effect
of current jetting for the Weyl semimetals. By growingultrathin films, one may use gating to lower ζ towards zeroin the Weyl nodes. This allows the LLL to be accessed at amuch lower BQ. Simultaneously, the increased surfacescattering of the carriers will reduce μ (hence increaseBcyc). By allowing the quantum effect to onset before theclassical effect becomes dominant, both trends shift the“operating point” towards the shaded region BQ < Bcyc.The ability to tune BQ by gating will enable more tests formapping out the current density distribution. The squeezetest is actually easier to implement using thin-film samples.Because several groups worldwide are attempting to growthin-film TaAs and NbAs, the prospects for the Weylsemimetals seem quite encouraging.A fourth candidate for the chiral anomaly is ZrTe5
[23,24], which displays a moderately large negativeLMR signal (ρxx decreases by 35%). A very recent experi-ment [24] has detected a (true) planar Hall effect when thechiral anomaly appears. This implies the simultaneousappearance of a large Berry curvature in applied B.However, currently available bulk crystals have a narrowribbonlike morphology unsuited for the squeeze test (aplatelike shape is optimal). However, using focused ionbeam (FIB) techniques, we may envisage sculpting theribbons into thin plates. Microlithography techniques canthen be harnessed to deposit voltage contacts for measuringRspine and Redge. We are not aware of any technical barrierthat would preclude applying the squeeze test on platelikecrystals tens of μm on a side. The field profiles of Rspine andRedge may then be compared as reported here in both Na3Biand GdPtBi. The FIB technique can be applied to futurechiral-anomaly candidate materials that do not readily growas large crystals.
VI. PLANAR ANGULAR MAGNETORESISTANCE
As shown in Eqs. (2) and (3), the growth of theanisotropy u arises differently in cases 1 and 2. Thedifference leaves a strong imprint on the planar angularmagnetoresistance (AMR), which we describe here. In anAMR experiment, B is rotated within the x-y plane, whilethe longitudinal and transverse voltages are recorded. AMRexperiments have been used to investigate the resistivityanisotropy produced by the magnetization M in ferromag-netic thin films. Recently, Burkov [25] has suggestedthat AMR measurements may be used to probe the chiralanomaly.The sample geometry is as defined above but now with
broad current contacts and a pair of standard Hall contactsspaced along y [see inset in Fig. 7(b)]. The lab frame (x and
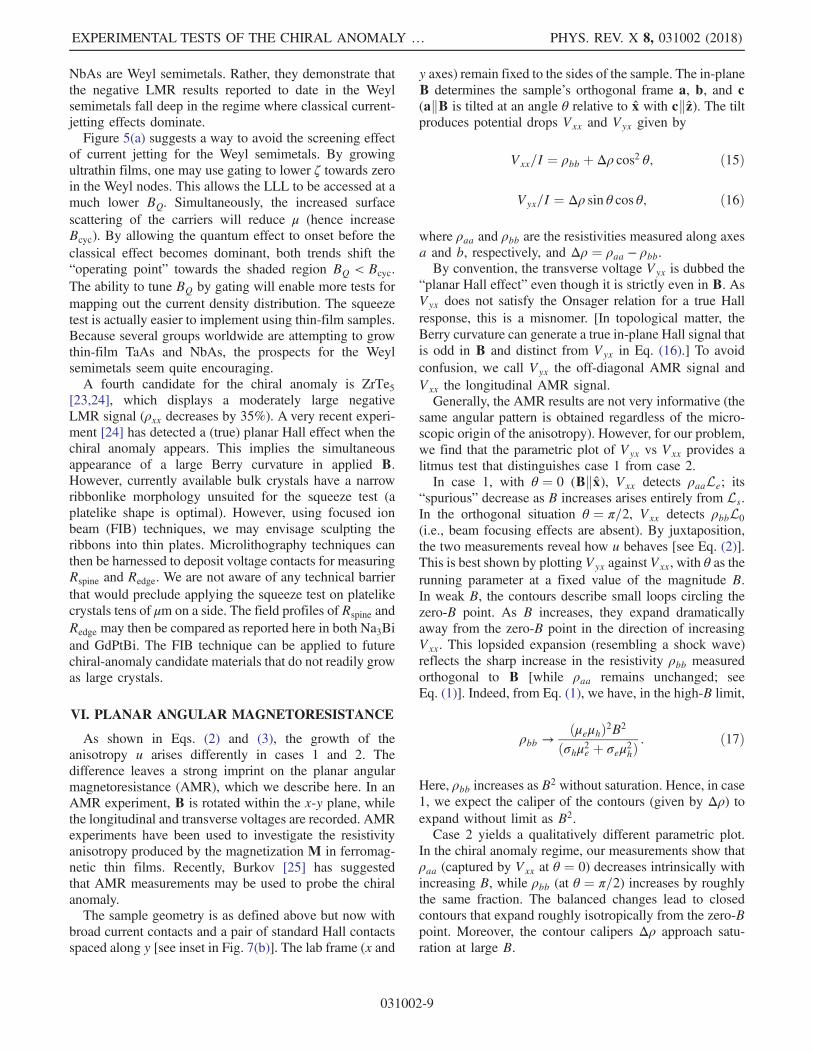
y axes) remain fixed to the sides of the sample. The in-planeB determines the sample’s orthogonal frame a, b, and c(akB is tilted at an angle θ relative to x with ckz). The tiltproduces potential drops Vxx and Vyx given by
Vxx=I ¼ ρbb þ Δρ cos2 θ; ð15Þ
Vyx=I ¼ Δρ sin θ cos θ; ð16Þ
where ρaa and ρbb are the resistivities measured along axesa and b, respectively, and Δρ ¼ ρaa − ρbb.By convention, the transverse voltage Vyx is dubbed the
“planar Hall effect” even though it is strictly even in B. AsVyx does not satisfy the Onsager relation for a true Hallresponse, this is a misnomer. [In topological matter, theBerry curvature can generate a true in-plane Hall signal thatis odd in B and distinct from Vyx in Eq. (16).] To avoidconfusion, we call Vyx the off-diagonal AMR signal andVxx the longitudinal AMR signal.Generally, the AMR results are not very informative (the
same angular pattern is obtained regardless of the micro-scopic origin of the anisotropy). However, for our problem,we find that the parametric plot of Vyx vs Vxx provides alitmus test that distinguishes case 1 from case 2.In case 1, with θ ¼ 0 (Bkx), Vxx detects ρaaLe; its
“spurious” decrease as B increases arises entirely from Ls.In the orthogonal situation θ ¼ π=2, Vxx detects ρbbL0
(i.e., beam focusing effects are absent). By juxtaposition,the two measurements reveal how u behaves [see Eq. (2)].This is best shown by plotting Vyx against Vxx, with θ as therunning parameter at a fixed value of the magnitude B.In weak B, the contours describe small loops circling thezero-B point. As B increases, they expand dramaticallyaway from the zero-B point in the direction of increasingVxx. This lopsided expansion (resembling a shock wave)reflects the sharp increase in the resistivity ρbb measuredorthogonal to B [while ρaa remains unchanged; seeEq. (1)]. Indeed, from Eq. (1), we have, in the high-B limit,
ρbb →ðμeμhÞ2B2
ðσhμ2e þ σeμ2hÞ: ð17Þ
Here, ρbb increases as B2 without saturation. Hence, in case1, we expect the caliper of the contours (given by Δρ) toexpand without limit as B2.Case 2 yields a qualitatively different parametric plot.
In the chiral anomaly regime, our measurements show thatρaa (captured by Vxx at θ ¼ 0) decreases intrinsically withincreasing B, while ρbb (at θ ¼ π=2) increases by roughlythe same fraction. The balanced changes lead to closedcontours that expand roughly isotropically from the zero-Bpoint. Moreover, the contour calipers Δρ approach satu-ration at large B.
EXPERIMENTAL TESTS OF THE CHIRAL ANOMALY … PHYS. REV. X 8, 031002 (2018)
031002-9
VII. PARAMETRIC PLOTS
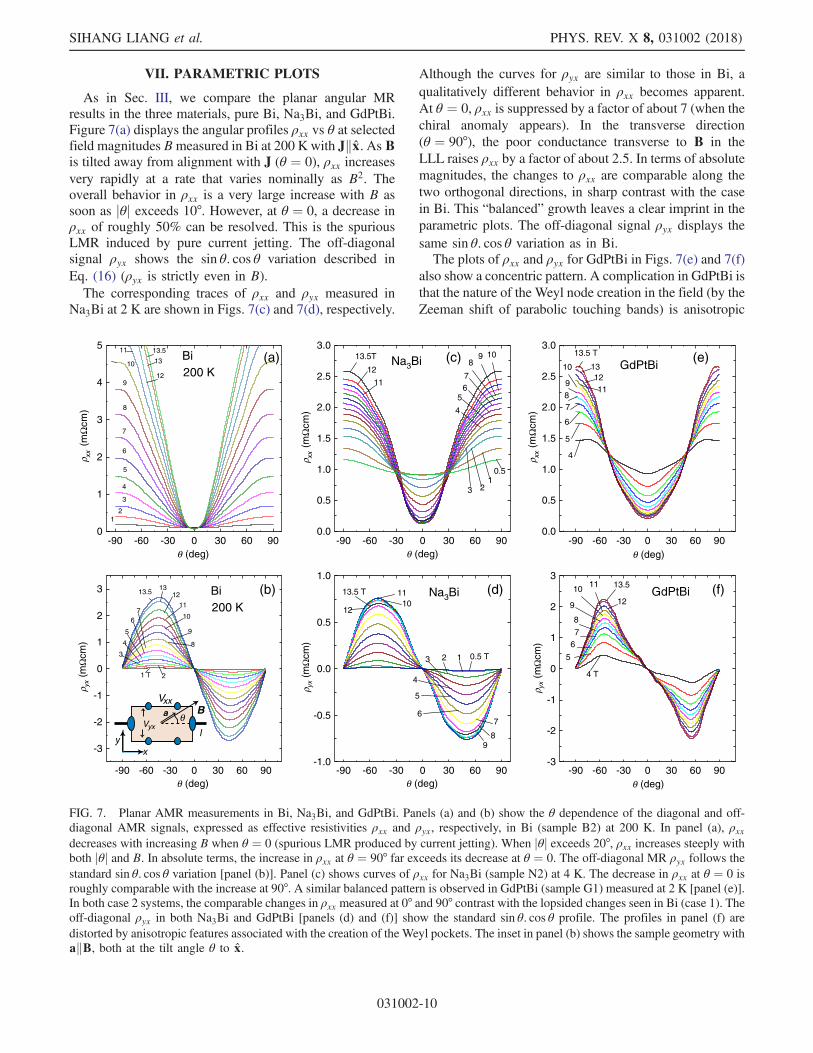
As in Sec. III, we compare the planar angular MRresults in the three materials, pure Bi, Na3Bi, and GdPtBi.Figure 7(a) displays the angular profiles ρxx vs θ at selectedfield magnitudes Bmeasured in Bi at 200 K with Jkx. AsBis tilted away from alignment with J (θ ¼ 0), ρxx increasesvery rapidly at a rate that varies nominally as B2. Theoverall behavior in ρxx is a very large increase with B assoon as jθj exceeds 10°. However, at θ ¼ 0, a decrease inρxx of roughly 50% can be resolved. This is the spuriousLMR induced by pure current jetting. The off-diagonalsignal ρyx shows the sin θ: cos θ variation described inEq. (16) (ρyx is strictly even in B).The corresponding traces of ρxx and ρyx measured in
Na3Bi at 2 K are shown in Figs. 7(c) and 7(d), respectively.
Although the curves for ρyx are similar to those in Bi, aqualitatively different behavior in ρxx becomes apparent.At θ ¼ 0, ρxx is suppressed by a factor of about 7 (when thechiral anomaly appears). In the transverse direction(θ ¼ 90°), the poor conductance transverse to B in theLLL raises ρxx by a factor of about 2.5. In terms of absolutemagnitudes, the changes to ρxx are comparable along thetwo orthogonal directions, in sharp contrast with the casein Bi. This “balanced” growth leaves a clear imprint in theparametric plots. The off-diagonal signal ρyx displays thesame sin θ: cos θ variation as in Bi.The plots of ρxx and ρyx for GdPtBi in Figs. 7(e) and 7(f)
also show a concentric pattern. A complication in GdPtBi isthat the nature of the Weyl node creation in the field (by theZeeman shift of parabolic touching bands) is anisotropic
-90 -60 -30 0 30 60 900
1
2
3
4
5
-90 -60 -30 0 30 60 90
-3
-2
-1
0
1
2
3
-90 -60 -30 0 30 60 900.0
0.5
1.0
1.5
2.0
2.5
3.0
-90 -60 -30 0 30 60 90-1.0
-0.5
0.0
0.5
1.0
-90 -60 -30 0 30 60 900.0
0.5
1.0
1.5
2.0
2.5
3.0
-90 -60 -30 0 30 60 90-3
-2
-1
0
1
2
3
13.5
13
12
11
10
9
8
7
6
5
4
3
21
xx(m
Ωcm
)
Bi200 K
(a)
(b)13.513
12
11
10
9
8
76
5
4
3
2(mΩ
cm)
1 T
Bi200 K
(c)
0.51
23
4
567
89 10
11
12
13.5T
(mΩ
c m)
θ (deg) θ (deg)θ
ρ xxρ xxρρ
(deg)
θ (deg) θ (deg)θ (deg)
Na3Bi
(d)Na3Bi
0.5 T123
4
5
67
89
1011
12
(mΩ
cm)
13.5 T
(e)13.5 T
131211
10
9
87
6
5
(mΩ
cm)
4
GdPtBi
(f)13.5
12
1110
9
8
76
5
yxρ yx
ρ yx
(mΩ
cm)
4 T
GdPtBi
θB
Vxx
Vyx
a
FIG. 7. Planar AMR measurements in Bi, Na3Bi, and GdPtBi. Panels (a) and (b) show the θ dependence of the diagonal and off-diagonal AMR signals, expressed as effective resistivities ρxx and ρyx, respectively, in Bi (sample B2) at 200 K. In panel (a), ρxxdecreases with increasing B when θ ¼ 0 (spurious LMR produced by current jetting). When jθj exceeds 20°, ρxx increases steeply withboth jθj and B. In absolute terms, the increase in ρxx at θ ¼ 90° far exceeds its decrease at θ ¼ 0. The off-diagonal MR ρyx follows thestandard sin θ: cos θ variation [panel (b)]. Panel (c) shows curves of ρxx for Na3Bi (sample N2) at 4 K. The decrease in ρxx at θ ¼ 0 isroughly comparable with the increase at 90°. A similar balanced pattern is observed in GdPtBi (sample G1) measured at 2 K [panel (e)].In both case 2 systems, the comparable changes in ρxx measured at 0° and 90° contrast with the lopsided changes seen in Bi (case 1). Theoff-diagonal ρyx in both Na3Bi and GdPtBi [panels (d) and (f)] show the standard sin θ: cos θ profile. The profiles in panel (f) aredistorted by anisotropic features associated with the creation of the Weyl pockets. The inset in panel (b) shows the sample geometry withakB, both at the tilt angle θ to x.
SIHANG LIANG et al. PHYS. REV. X 8, 031002 (2018)
031002-10
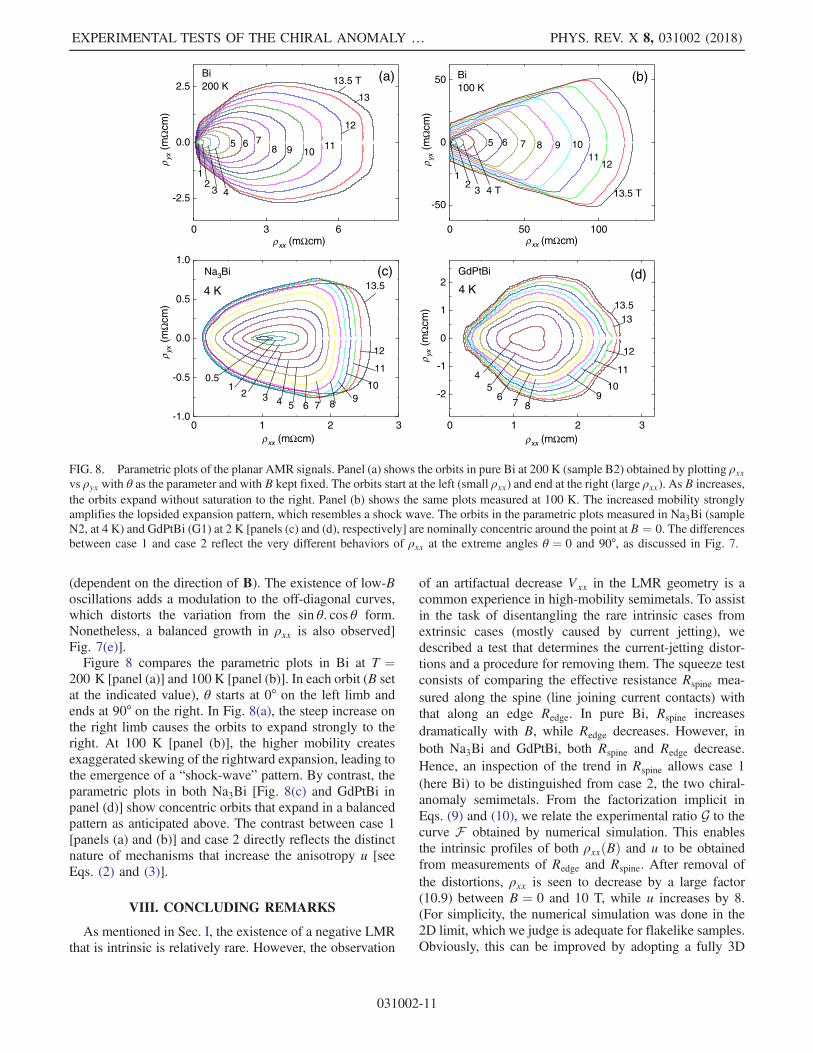
(dependent on the direction of B). The existence of low-Boscillations adds a modulation to the off-diagonal curves,which distorts the variation from the sin θ: cos θ form.Nonetheless, a balanced growth in ρxx is also observed]Fig. 7(e)].Figure 8 compares the parametric plots in Bi at T ¼
200 K [panel (a)] and 100 K [panel (b)]. In each orbit (B setat the indicated value), θ starts at 0° on the left limb andends at 90° on the right. In Fig. 8(a), the steep increase onthe right limb causes the orbits to expand strongly to theright. At 100 K [panel (b)], the higher mobility createsexaggerated skewing of the rightward expansion, leading tothe emergence of a “shock-wave” pattern. By contrast, theparametric plots in both Na3Bi [Fig. 8(c) and GdPtBi inpanel (d)] show concentric orbits that expand in a balancedpattern as anticipated above. The contrast between case 1[panels (a) and (b)] and case 2 directly reflects the distinctnature of mechanisms that increase the anisotropy u [seeEqs. (2) and (3)].
VIII. CONCLUDING REMARKS
As mentioned in Sec. I, the existence of a negative LMRthat is intrinsic is relatively rare. However, the observation
of an artifactual decrease Vxx in the LMR geometry is acommon experience in high-mobility semimetals. To assistin the task of disentangling the rare intrinsic cases fromextrinsic cases (mostly caused by current jetting), wedescribed a test that determines the current-jetting distor-tions and a procedure for removing them. The squeeze testconsists of comparing the effective resistance Rspine mea-sured along the spine (line joining current contacts) withthat along an edge Redge. In pure Bi, Rspine increasesdramatically with B, while Redge decreases. However, inboth Na3Bi and GdPtBi, both Rspine and Redge decrease.Hence, an inspection of the trend in Rspine allows case 1(here Bi) to be distinguished from case 2, the two chiral-anomaly semimetals. From the factorization implicit inEqs. (9) and (10), we relate the experimental ratio G to thecurve F obtained by numerical simulation. This enablesthe intrinsic profiles of both ρxxðBÞ and u to be obtainedfrom measurements of Redge and Rspine. After removal ofthe distortions, ρxx is seen to decrease by a large factor(10.9) between B ¼ 0 and 10 T, while u increases by 8.(For simplicity, the numerical simulation was done in the2D limit, which we judge is adequate for flakelike samples.Obviously, this can be improved by adopting a fully 3D
0 3 6
-2.5
0.0
2.5
0 50 100
-50
0
50
0 1 2 3-1.0
-0.5
0.0
0.5
1.0
0 1 2 3
-2
-1
0
1
2
12
3 4
5 6 78 9 10
11
12
13
(mΩ
cm)
(mΩcm)
Bi200 K 13.5 T (a) (b)
12
3 4 T
5 6 7 8 9 1011
12
(mΩ
cm)
(mΩcm)
Bi100 K
13.5 T
(c)
986 754321
0.510
11
12
(mΩ
cm)
ρxx
ρxx ρxx
ρxx
ρ yxρ yxρ yx ρ yx
(mΩcm)
Na3Bi13.54 K
(d)4 K
13.5
45
67 8
910
11
12
(mΩ
cm)
(mΩcm)
GdPtBi
13
FIG. 8. Parametric plots of the planar AMR signals. Panel (a) shows the orbits in pure Bi at 200 K (sample B2) obtained by plotting ρxxvs ρyx with θ as the parameter and with B kept fixed. The orbits start at the left (small ρxx) and end at the right (large ρxx). As B increases,the orbits expand without saturation to the right. Panel (b) shows the same plots measured at 100 K. The increased mobility stronglyamplifies the lopsided expansion pattern, which resembles a shock wave. The orbits in the parametric plots measured in Na3Bi (sampleN2, at 4 K) and GdPtBi (G1) at 2 K [panels (c) and (d), respectively] are nominally concentric around the point at B ¼ 0. The differencesbetween case 1 and case 2 reflect the very different behaviors of ρxx at the extreme angles θ ¼ 0 and 90°, as discussed in Fig. 7.
EXPERIMENTAL TESTS OF THE CHIRAL ANOMALY … PHYS. REV. X 8, 031002 (2018)
031002-11
simulation.) The yes or no nature of the test based oninspection of Rspine, bolstered by the quantitative analysisthat removes the subdominant corrections, adds consider-able confidence that the chiral-anomaly LMR profiles inNa3Bi and GdPtBi are intrinsic. Moreover, the subdomi-nant distortion factors arising from current jetting can beeffectively removed.In Sec. V, we described LMR experiments as a com-
petition between the intrinsic quantum effect arising fromthe chiral anomaly and the classical effects of currentjetting. The former describes a phenomenon intrinsic tomassless chiral fermions. To see it in full force, the appliedB should exceed BQ, the field needed to move ζ into theLLL. This point seems worth emphasizing because inmany reports the claimed anomaly seems to appear inweak fields, B ≪ BQ. The experimental concern is thatonce current jetting appears (at the field scale Bcyc), itinevitably engenders a dominant, negative LMR profile thatis extrinsic in origin. The divergent field profiles of Rspine
and Redge provide a strong warning that the LMR profile isthen highly unlikely to be intrinsic.Looking ahead, we discussed in Sec. V how the classical
screening effect from current jetting may be avoided byusing ultrathin, gateable films of the Weyl semimetals,which may become available in the near future. For thefourth class of chiral anomaly semimetal ZrTe5 [23,24], wepropose using a focused ion beam to sculpt platelikesamples that are 10 μm on a side, and applying micro-lithography to attach contacts for the squeeze test.
ACKNOWLEDGMENTS
The research was supported by the U.S. Army ResearchOffice (Grant No. W911NF-16-1-0116) and a MURI awardfor topological insulators (No. AROW911NF-12-1-0461).N. P. O. acknowledges support from the Gordon and BettyMoore Foundation’s Emergent Phenomena in QuantumSystems Initiative through Grant No. GBMF4539. Thegrowth and characterization of crystals were performed byS. K. and R. J. C., with support from the National ScienceFoundation (NSF MRSEC Grant No. DMR 1420541).Work at UCLA was supported by the U.S. Department ofEnergy (DOE), Office of Basic Energy Sciences, AwardNo. DE-SC0011978.
[1] H. B. Nielsen and M. Ninomiya, The Adler-Bell-JackiwAnomaly and Weyl Fermions in a Crystal, Phys. Lett. B 130,389 (1983).
[2] S. M. Young, S. Zaheer, J. C. Y. Teo, C. L. Kane, E. J. Mele,and A. M. Rappe, Dirac Semimetal in Three Dimensions,Phys. Rev. Lett. 108, 140405 (2012).
[3] X. G. Wan, A. M. Turner, A. Vishwanath, and S. Y.Savrasov, Topological Semimetal and Fermi-Arc Surface
States in the Electronic Structure of Pyrochlore Iridates,Phys. Rev. B 83, 205101 (2011).
[4] C. Fang, M. J. Gilbert, X. Dai, and B. A. Bernevig, Multi-Weyl Topological Semimetals Stabilized by Point GroupSymmetry, Phys. Rev. Lett. 108, 266802 (2012).
[5] B.-J. Yang and N. Nagaosa, Classification of Stable Three-Dimensional Dirac Semimetals with Nontrivial Topology,Nat. Commun. 5, 4898 (2014).
[6] Z. J. Wang, Y. Sun, X. Q. Chen, C. Franchini, G. Xu,H. M. Weng, X. Dai, and Z. Fang, Dirac Semimetal andTopological Phase Transitions in A3Bi (A ¼ Na, K, Rb),Phys. Rev. B 85, 195320 (2012).
[7] Classical Theory of Gauge Fields, edited by V. Rubakov(Princeton University Press, Princeton, NJ, 2002), Chaps. 15and 17.
[8] S. L. Adler, Axial-Vector Vertex in Spinor Electrodynamics,Phys. Rev. 177, 2426 (1969).
[9] J. S. Bell and R. Jackiw, A PCAC Puzzle: πo → γγ in theσ-Model, Nuovo Cimento 60A, 47 (1969).
[10] Introduction to Quantum Field Theory, edited by M. E.Peskin and D. V. Schroeder (Westview Press, Boulder,Colorado, 1995), Chap. 19.
[11] Anomalies in Quantum Field Theory, edited by Reinhold A.Bertlmann (Clarendon Press, Oxford, 2011).
[12] K.-Y. Yang, Y.-M. Lu, and Y. Ran, Quantum Hall Effects ina Weyl Semimetal: Possible Application in PyrochloreIridates, Phys. Rev. B 84, 075129 (2011).
[13] D. T. Son and B. Z. Spivak, Chiral Anomaly and ClassicalNegative Magnetoresistance of Weyl Metals, Phys. Rev. B88, 104412 (2013).
[14] S. A. Parameswaran, T. Grover, D. A. Abanin, D. A. Pesin,and A. Vishwanath, Probing the Chiral Anomaly withNonlocal Transport in Three-Dimensional TopologicalSemimetals, Phys. Rev. X 4, 031035 (2014).
[15] A. A. Burkov, Negative Longitudinal Magnetoresistancein Dirac and Weyl Metals, Phys. Rev. B 91, 245157 (2015).
[16] J. Xiong, S. K. Kushwaha, T. Liang, J. W. Krizan, M.Hirschberger, W. Wang, R. J. Cava, and N. P. Ong, Evidencefor the Chiral Anomaly in the Dirac Semimetal Na3Bi,Science 350, 413 (2015).
[17] M. Hirschberger, S. Kushwaha, Z. Wang, Q. Gibson, S.Liang, C. A. Belvin, B. A. Bernevig, R. J. Cava, and N. P.Ong, The Chiral Anomaly and Thermopower of WeylFermions in the Half-Heusler GdPtBi, Nat. Mater. 15,1161 (2016).
[18] X. Huang, L. Zhao, Y. Long, P. Wang, D. Chen, Z. Yang, H.Liang, M. Xue, H. Weng, Z. Fang, X. Dai, and G. Chen,Observation of the Chiral-Anomaly-Induced Negative Mag-netoresistance in 3D Weyl Semimetal TaAs, Phys. Rev. X 5,031023 (2015).
[19] C.-L. Zhang et al., Signatures of the Adler-Bell-JackiwChiral Anomaly in a Weyl Fermion Semimetal, Nat.Commun. 7, 10735 (2016).
[20] R. D. dos Reis, M. O. Ajeesh, N. Kumar, F. Arnold, C.Shekhar, M. Naumann, M. Schmidt, M. Nicklas, and E.Hassinger, On the Search for the Chiral Anomaly in WeylSemimetals: The Negative Longitudinal Magnetoresistance,New J. Phys. 18, 085006 (2016).
[21] Y. Li, Z. Wang, P. Li, X. Yang, Z. Shen, F. Sheng, X. Li, Y.Lu, Y. Zheng, and Z.-A. Xu, Negative Magnetoresistance in
SIHANG LIANG et al. PHYS. REV. X 8, 031002 (2018)
031002-12
Weyl Semimetals NbAs and NbP: Intrinsic Chiral Anomalyand Extrinsic Effects, Front. Phys. 12, 127205 (2017).
[22] J. Xiong, S. Kushwaha, J. Krizan, T. Liang, R. J. Cava, andN. P. Ong, Anomalous Conductivity Tensor in the DiracSemimetal Na3Bi, Europhys. Lett. 114, 27002 (2016).
[23] Q. Li, D. E. Kharzeev, C. Zhang, Y. Huang, I. Pletikosić,A. V. Fedorov, R. D. Zhong, J. A. Schneeloch, G. D. Gu,
and T. Valla, Chiral Magnetic Effect in ZrTe5, Nat. Phys. 12,550 (2016).
[24] T. Liang et al., Anomalous Hall Effect in ZrTe5, Nat. Phys.14, 451 (2018)..
[25] A. A. Burkov, Giant Planar Hall Effect in TopologicalMetals, Phys. Rev. B 96, 041110 (2017).
EXPERIMENTAL TESTS OF THE CHIRAL ANOMALY … PHYS. REV. X 8, 031002 (2018)
031002-13