Embed Size (px)
Citation preview

Dr. Arnaud Diffo Kaze, Research Associate, FSTC
Released on 30/11/2016 in Luxembourg
EXPER IMENTAL TEST ING
OF THE “ACT IVMOT ION ” PLATE
By
Dr. Arnaud Diffo Kaze
Contributors :
Pr. Stefan Maas, University of Luxembourg
Pr. Dietrich Pape, University Clinic of Saarland
BIOMECHANICAL COMPARATIVE STUDY OF 6 DIFFERENTS OSTEOSYNTHESIS SYSTEMS
FOR VALGISATION HIGH TIBIAL OSTEOTOMY: EXPERIMENTAL TESTS

Dr. Arnaud Diffo Kaze, Research Associate, FSTC
Content
1. INTRODUCTION 3
2. METHODS 4
3. STATIC LOADING TO FAILURE 8
4. FATIGUE LOADING TO FAILURE 11
5. COMPARISON WITH THE PREVIOUS PERFORMED TESTS 28
6. CONCLUSION 36
7. REFERENCES 38

Dr. Arnaud Diffo Kaze, Research Associate, FSTC
1. Introduction
The aim of the present study was to test and to compare mechanical static and fatigue
strength of the size 2 osteotomy plate “Activmotion” (Figure 1) of the company Newclip
Technics (Haute-Goulaine, France) with five other implants for the treatment of medial knee
joint osteoarthritis using a testing procedure that was already previously defined, used and
published (Maas, Diffo Kaze, Dueck, & Pape, 2013; Diffo Kaze, et al., 2015; Diffo Kaze A. ,
2016). These other comparative implants are the Contour Lock plate, the iBalance implant,
the PEEKPower plate of Arthrex (Munich, Germany), the TomoFix small stature (TomoFix
sm) and the TomoFix standard (TomoFix std) plates of Synthes Gmbh (Oberdorf,
Switzerland) (Figure 2).
Figure 1: Size 2 Activmotion plate
The tested specimens are plate and artificial bone constructs, subjected to static and cyclic
testing to failure as described in (Maas, Diffo Kaze, Dueck, & Pape, 2013; Diffo Kaze, et al.,
2015; Diffo Kaze A. , 2016).
1

Dr. Arnaud Diffo Kaze, Research Associate, FSTC
A B
C D E
Figure 2: (A) Contour Lock HTO plate, (B) TomoFix small stature plate (TomoFix sm) , (C) TomoFix
Standard plate (TomoFix std), (D) PEEKPower plate and (E) iBalance implant.
2. Methods
Six large-size fourth generation composite analogue tibia bone models (Sawbones, Pacific
Research Laboratories, Inc., Vashon, WA) were used for the tests. Opening wedge proximal
medial osteotomies were performed on each of the composite bones in the same way by an
experienced surgeon, according to standard techniques of the plate. The same standardized
procedure as by the last performed osteotomy tests (Maas, Diffo Kaze, Dueck, & Pape,
2013; Diffo Kaze, et al., 2015; Diffo Kaze A. , 2016) has been used to prepare the
specimens.
For the static tests, the specimens were subjected to a quasi-static compression
displacement-controlled single loading to failure at a speed of 0.1 mm/s, while the dynamic
tests, according to Figure 3, consisted in load-controlled cyclical fatigue testing, with
stepwise compression sinusoidal (frequency = 5Hz) loading where the force amplitude of
each step was kept constant with feed-back control of the force signal within the hydraulic
2

Dr. Arnaud Diffo Kaze, Research Associate, FSTC
machine. The lower compressive force limit of each load step was kept constant at 160 N.
Starting from 800 N for the first step the upper compressive force limit was increased
stepwise by 160 N after N=20000 cycles if no failure occurred. This testing procedure is
similar to the standardized testing protocol for hip joints (ISO 7206-4, 1989; ISO 7206-6,
1992; ISO 7206-8, 1995).
Figure 3: Scheme of the applied vertical sinusoidal force loading (load-controlled) After N=20.000 cycles the upper force is increased stepwise by 160 N until failure. The loading frequency was constant and set to 5 Hz.
A total of 6 specimens were used as indicated in Table 1.
Table 1: Specimen subdivision depending on the performed test
3
Dr. Arnaud Diffo Kaze, Research Associate, FSTC
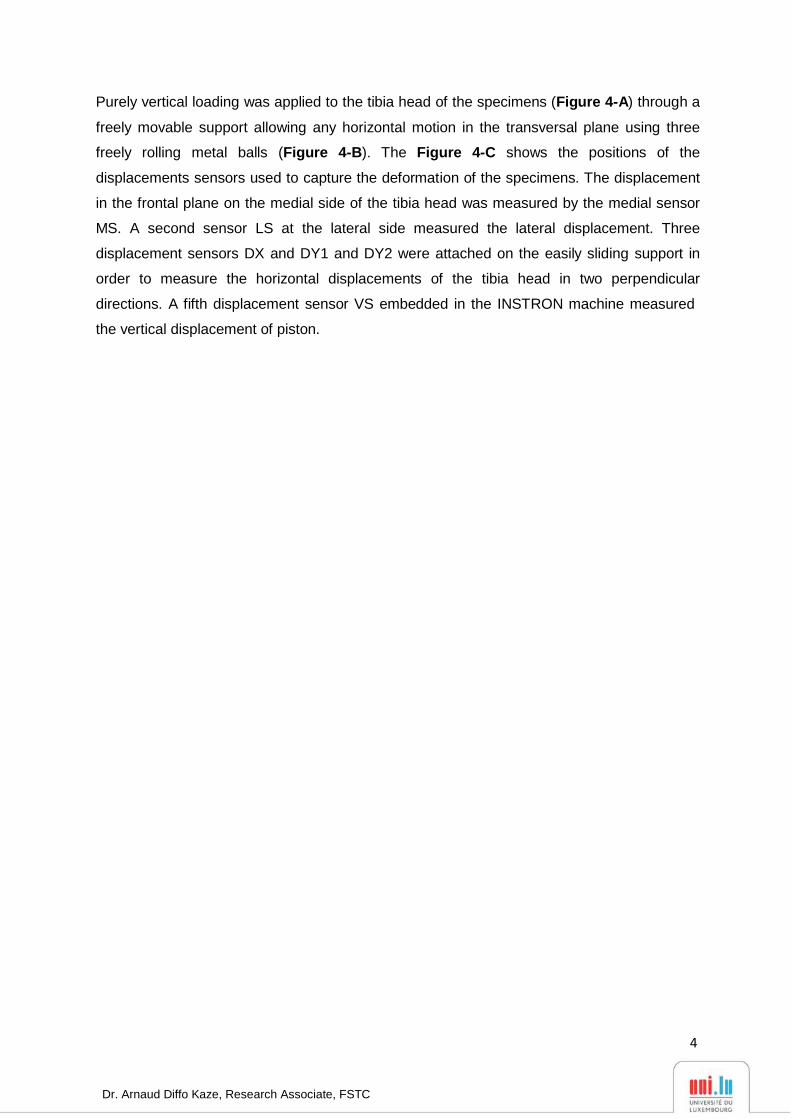
Purely vertical loading was applied to the tibia head of the specimens (Figure 4-A) through a
freely movable support allowing any horizontal motion in the transversal plane using three
freely rolling metal balls (Figure 4-B). The Figure 4-C shows the positions of the
displacements sensors used to capture the deformation of the specimens. The displacement
in the frontal plane on the medial side of the tibia head was measured by the medial sensor
MS. A second sensor LS at the lateral side measured the lateral displacement. Three
displacement sensors DX and DY1 and DY2 were attached on the easily sliding support in
order to measure the horizontal displacements of the tibia head in two perpendicular
directions. A fifth displacement sensor VS embedded in the INSTRON machine measured
the vertical displacement of piston.
4

Dr. Arnaud Diffo Kaze, Research Associate, FSTC
DY1 DY2
DX VS
LS MS
A
B C
Figure 4: (A) Specimen before mounting to hydraulic press. (B) Low friction sliding support to apply purely vertical forces. (C) Specimen under test: The lateral and the medial sensor (LS and MS) register the relative lateral and medial vertical displacements from the tibial head, while VS measured its vertical displacement. The sensors DX, DY1 and DY2 register the horizontal displacements of the tibial head; along the transverse axis for the first and the sagittal axis for the latter.
The Table 2 summarizes the failure criteria that have been considered within this study. This
criteria were already used by Pape et al (Pape, D.; Lorbach, O.; Schmitz, C.; Busch, L. C.;
Van Giffen, N.; Seil, R.; Kohn, D. M., 2010). The failure type 3 allows quantifying the wobble
degree or the stability of the sample during the cyclic testing (Maas, Diffo Kaze, Dueck, &
Pape, 2013; Diffo Kaze, et al., 2015; Diffo Kaze A. , 2016).
5

Dr. Arnaud Diffo Kaze, Research Associate, FSTC
Activmotion 1
Ultimate rupture
Table 2: Used failure types and their defining criteria (Maas, Diffo Kaze, Dueck, & Pape, 2013; Diffo Kaze,
et al., 2015; Diffo Kaze A. , 2016).
3. Static loading to failure
The following pictures (Figure 5 and Figure 6) show the characteristic curves (force versus
registered displacements) for the specimens Activmotion 1 and 2 obtained from the static
tests.
Figure 5: First static test results (Activmotion 1)
6

Dr. Arnaud Diffo Kaze, Research Associate, FSTC
Activmotion 2
Ultimate rupture
Crack formation
Figure 6: Second static test results (Activmotion 2)
The specimens Activmotion 1 and 2 failed by fracture of the contralateral cortical bone
(Figure 7 and Figure 8). The ultimate fracture in the case of Activmotion 2 was preceded by
cracks formation (Figure 6).
Figure 7: Fracture of the lateral cortical (Activmotion 1)
7

Dr. Arnaud Diffo Kaze, Research Associate, FSTC
Figure 8: Fracture of the lateral cortical (Activmotion 2)
No defects of the plates or screws were observed.
The Table 3 summarizes the crack loads at which cracks eventually occurs prior to the
ultimate ruptures of the specimen, the ultimate loads and the corresponding displacements.
The ultimate load was 8900 N that corresponded to the ultimate medial and lateral
displacements 1.3 mm and 2.5 mm respectively. For the Activmotion 2 the crack load was
3700 N, followed by an ultimate load of 7500 N, which corresponded to an ultimate medial
displacement of 2.1 mm and lateral displacement of 5.1 mm.
Specimen Crack load / Ultimate load [N] Medial displ. at crack- & ultimate load
[mm]
Lateral displ. at crack- & ultimate
load [mm]
Activmotion 1 -/8900 Mean
- /8200
SD±
- /700
- / 1.3 Mean
- /1.7
SD±
- /0.4
- / 2.5 Mean
- / 3.8
SD±
- / 1.3 Activmotion 2 3700/7500 0.7 / 2.1 1.6 / 5.1
Table 3: Static tests summary: displacements (displ.) and their corresponding damage loads
By considering the direction of the applied load as positive, that means the descending
vertical direction, hence the medial displacements (MS) are negative and the lateral
displacements are positive (Figure 9). The lateral displacement are greater than the medial
8

Dr. Arnaud Diffo Kaze, Research Associate, FSTC
displacements, hence the tibial plateau of the specimens, Activmotion 1 and 2, rotated
during the static loading.
Figure 9: Definition of the positive displacement direction. The lateral displacement dL was positive and of greater magnitude than the medial displacement dM that was count negative. The angle α represents the valgus-malrotation of the tibia head and is calculated by mean of the difference ��� − ���
4. Fatigue loading to failure
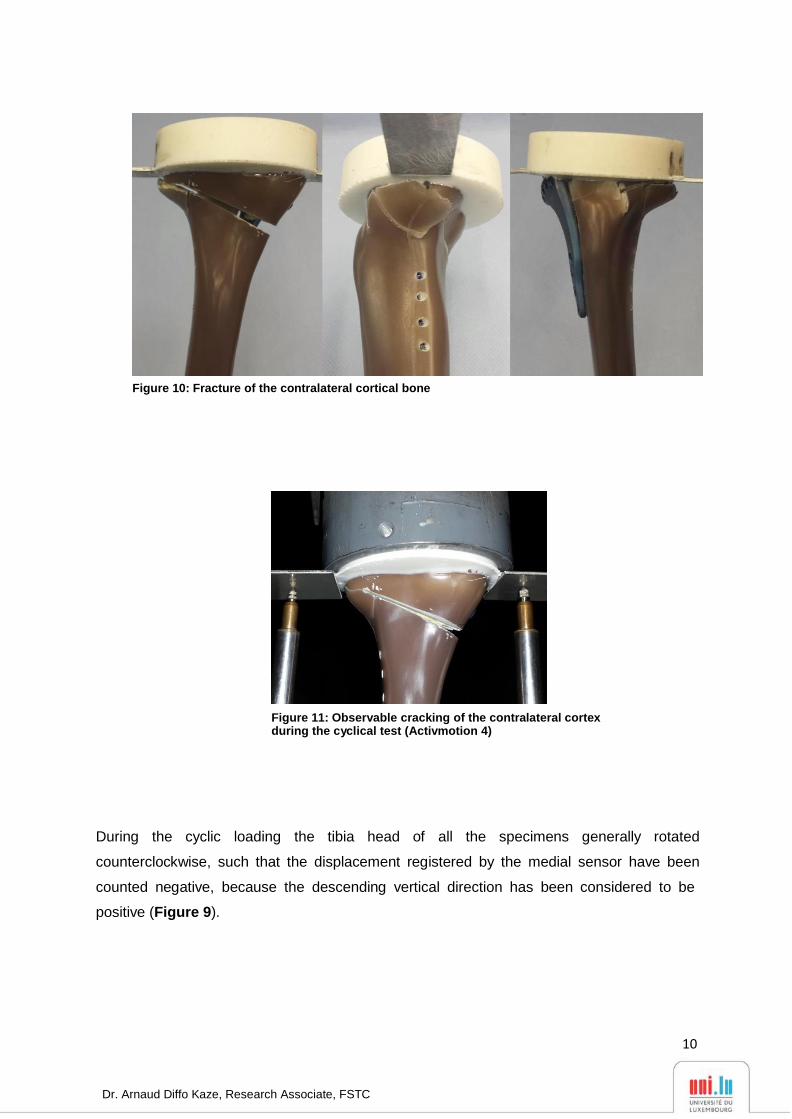
The fracture of the specimens subjected to cyclical tests occurred in the region of the
contralateral cortex (Figure 10), as for the static tests. If cracks occurred prior to the final
failure of the specimens, they were generally not observable, except in the case of the
specimen Activmotion 4 (Figure 11), where the crack formation was visible. The plates and
screws remained undamaged during the cyclical testing.
9
Dr. Arnaud Diffo Kaze, Research Associate, FSTC
Figure 10: Fracture of the contralateral cortical bone
Figure 11: Observable cracking of the contralateral cortex during the cyclical test (Activmotion 4)
During the cyclic loading the tibia head of all the specimens generally rotated
counterclockwise, such that the displacement registered by the medial sensor have been
counted negative, because the descending vertical direction has been considered to be
positive (Figure 9).
10

Dr. Arnaud Diffo Kaze, Research Associate, FSTC
4.1. Time histories of the applied forces and the vertical, lateral and medial displacements of the specimens
The following plots (from Figure 12 to Figure 15) show the time evolution of the applied
force and the registered vertical, the medial and the lateral displacements for all the
specimen that have been subjected to the load controlled fatigue tests.
The fracture of the contralateral cortex of the specimen Activmotion 3 occurred at the
beginning of load step 10 (LS 10) (Figure 12). For the specimen Activmotion 4, the fracture
of the contralateral cortex occurred by the end of load step 10. It was preceded by an
observable crack formation, which started during the load step 9 and grew to complete
fracture at the end of LS 10 (Figure 13).
Applied load (Activmotion 3)
Vertical Sensor (Activmotion 3)
Lateral Sensor (Activmotion 3)
Fracture of the
contralateral
cortex
Medial Sensor (Activmotion 3)
LS1
LS2
LS3
LS4
LS5 LS6
LS7 LS8 LS9
LS10
Figure 12: Activmotion 3: Time histories of the applied load, the vertical, the medial and lateral displacements
11

Dr. Arnaud Diffo Kaze, Research Associate, FSTC
Applied load (Activmotion 4)
Vertical Sensor (Activmotion 4)
Lateral Sensor (Activmotion 4)
Fracture of the
contralateral cortex
Observable crack
formation
Medial Sensor (Activmotion 4)
LS1
LS2 LS3
LS4 LS5
LS6 LS7 LS8
LS9
LS10
Figure 13: Activmotion 4: Time histories of the applied load, the vertical, the medial and lateral displacements
12

Dr. Arnaud Diffo Kaze, Research Associate, FSTC
In the cases of specimens Activmotion 5 and 6, an abrupt fracture of the contralateral cortex
occurred during the load step 6 and was not preceded by observable cracking (Figure 14
and Figure 15)
Applied load (Activmotion 5)
Vertical Sensor (Activmotion 5)
LS6
LS4 LS5
LS2 LS3
LS1
Lateral Sensor (Activmotion 5)
Fracture of the
contralateral cortex
Medial Sensor (Activmotion 5)
LS1 LS2 LS5
LS3 LS6
LS4
Figure 14: Activmotion 5: Time histories of the applied load, the vertical, the medial and lateral displacements
13

Dr. Arnaud Diffo Kaze, Research Associate, FSTC
Applied load (Activmotion 6)
Vertical Sensor (Activmotion 6)
Fracture of the
contralateral cortex
Lateral Sensor (Activmotion 6)
Medial Sensor (Activmotion 6)
LS1
LS2 LS3
LS4 LS5 LS6
Figure 15: Activmotion 6: Time histories of the applied load, the vertical, the medial and lateral displacements
14

Dr. Arnaud Diffo Kaze, Research Associate, FSTC
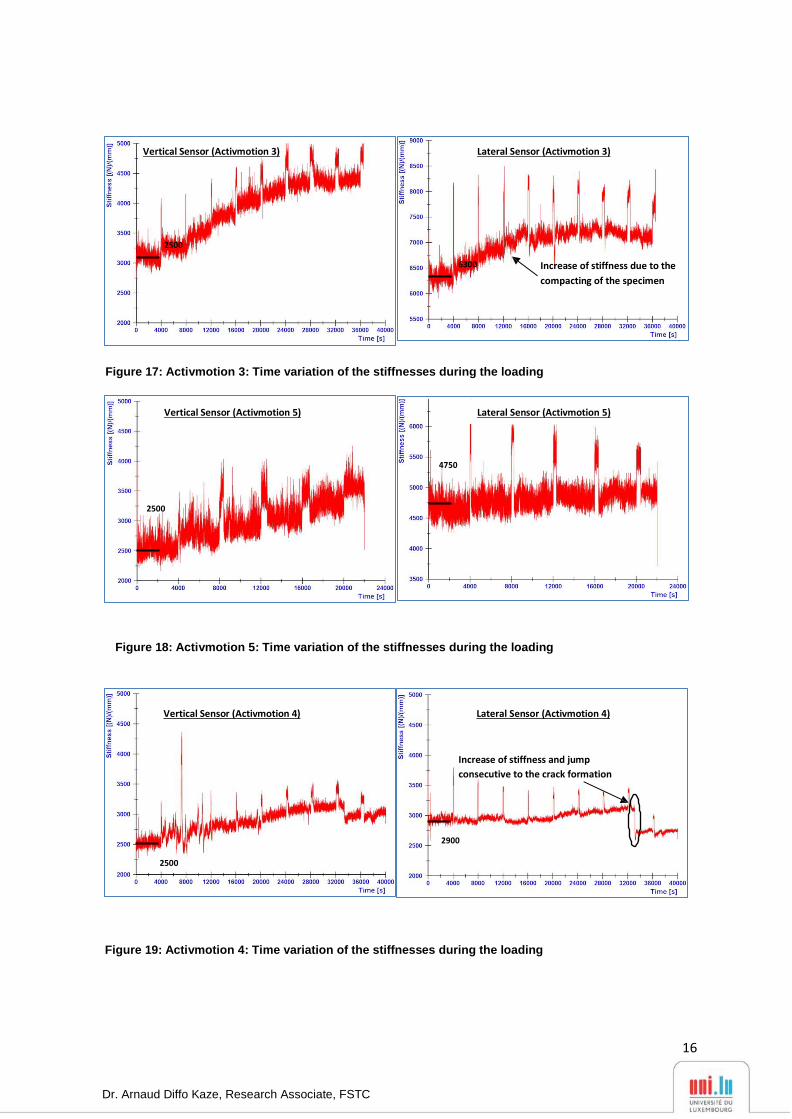
4.2. Dynamic stiffness
The different “dynamic stiffnesses” of the specimens (vertical, medial and lateral) have been
calculated as the ratio of peak to peak force ∆F to the measured peak to peak displacement
∆X in the same period T (Figure 16).
Figure 16: Definition of ΔF and ΔX to calculate the
dynamic stiffness for the cyclic fatigue to failure tests
The dynamic stiffness is an additional parameter that could be used to check the failure of
the specimen. It normally increases when the specimens is compacting and becoming stiffer
under the applied loads, and decreases when damages are occurring in the specimen.
The plots from Figure 17 to Figure 20 show the dynamic stiffnesses obtained for the vertical
and the lateral displacements for all the specimens that have been subjected to the load
controlled fatigue tests. The medial side is not of interest as much as the lateral side,
because the failure occurred in the contralateral cortex and the behavior of the medial side is
governed by the plate.
15
Dr. Arnaud Diffo Kaze, Research Associate, FSTC
Vertical Sensor (Activmotion 3) Lateral Sensor (Activmotion 3)
2500
6300
Increase of stiffness due to the
compacting of the specimen
Figure 17: Activmotion 3: Time variation of the stiffnesses during the loading
Vertical Sensor (Activmotion 5) Lateral Sensor (Activmotion 5)
4750
2500
Figure 18: Activmotion 5: Time variation of the stiffnesses during the loading
Vertical Sensor (Activmotion 4) Lateral Sensor (Activmotion 4)
Increase of stiffness and jump
consecutive to the crack formation
2900
2500
Figure 19: Activmotion 4: Time variation of the stiffnesses during the loading
16

Dr. Arnaud Diffo Kaze, Research Associate, FSTC
Vertical Sensor (Activmotion 6) Lateral Sensor (Activmotion 6)
5100
3100
Increase of stiffness and decrease until the failure
Figure 20: Activmotion 6: Time variation of the stiffnesses during the loading
The values of these different stiffness’s, right at the beginning of the first loading step are
indicated in Table 4.
Specimens
Activmotion 3
Activmotion 4
Activmotion 5
Activmotion 6
Vertical Stiffness (N/mm)
2500
2500
2500
3100
Lateral Stiffness (N/mm)
6300
2900
4750
5100
Table 4: Values of the vertical and lateral stiffnesses of the different specimens subjected to the cyclical tests
4.3. Plastic Deformation and plastic deflection (loss of correction)
The permanent plastic deformation has been estimated here as the irrecoverable
displacement from the start of the tests at the minimal force of 160 N, considered as nearly
zero force. Hence the permanent plastic deformations could be measured online during the
cyclic tests at any time (Figure 21), for example before failure (UPB) and additionally after the
gross failure, i.e. the collapse of the lateral cortex (UPA) in general (Maas, Diffo Kaze, Dueck,
& Pape, 2013; Diffo Kaze, et al., 2015; Diffo Kaze A. , 2016).
17

Dr. Arnaud Diffo Kaze, Research Associate, FSTC
Upper limit
Lower limit
Figure 21: Plastic deformation before and after failure: UPB and UPA
The permanent plastic deflection of the tibia plateau leads to a permanent plastic deflection
angle and was calculated as the resulting permanent plastic displacements on the medial
and the lateral sides in the specimens’ frontal plane, at a given time (Figure 9). According to
these definitions and the denominations indicated in Figure 9, the deflection angle (in
radians) was defined and could be calculated at any time as
α= dL-dM
. D
According to the definitions of the permanent plastic deformations the failure type 1 occurs
when
d
D |dLp-dMp| > 2 mm ,
i.e. if αp > 0.024 rad or 1.4°, with αp , dLp and dMp being the permanent plastic deflection
angle, permanent plastic lateral displacement and permanent plastic medial displacement,
respectively.
Due to the abrupt fracture of the specimens during the cyclical testing and the fact that the
cracking observed in the case of Activmotion 4 has not been considered as a failure, the
permanent plastic displacements have been determined only before failure, as indicated in
the following pictures (from Figure 22 to Figure 25).
18

Dr. Arnaud Diffo Kaze, Research Associate, FSTC
Lateral Sensor (Activmotion 3) Medial Sensor (Activmotion 3)
���𝒑 = −�, �� 𝒎𝒎
LS1
LS2
LS3
���𝒑 = �, � 𝒎𝒎
LS4
LS5
LS6
LS7 LS8 LS9
LS10
Figure 22: Activmotion 3: Determination of the permanent plastic lateral displacement (dLp) and medial displacement (dMp). The medial displacement is counted negatively.
Lateral Sensor (Activmotion 4) Medial Sensor (Activmotion 4)
���𝒑 = � 𝒎𝒎
���𝒑
= �, �� 𝒎𝒎
Figure 23: Activmotion 4: Determination of the permanent plastic lateral displacement (dLp) and medial displacement (dMp)
Lateral Sensor (Activmotion 5) Medial Sensor (Activmotion 5)
���𝒑
= � 𝒎𝒎
���𝒑 = �, �� 𝒎𝒎
LS1 LS2
LS3 LS4
LS5
LS6
Figure 24: Activmotion 5: Determination of the permanent plastic lateral displacement (dLp) and medial displacement (dMp)
19

Dr. Arnaud Diffo Kaze, Research Associate, FSTC
Lateral Sensor (Activmotion 6) Medial Sensor (Activmotion 6)
dL𝒑 = 0.13 𝒎𝒎
LS1
LS2
LS3
dM𝒑 = 0 𝒎𝒎
LS4 LS5 LS6
Figure 25: Activmotion 6: Determination of the permanent plastic lateral displacement (dLp) and medial displacement (dMp)
The Table 5 gives the medial and lateral permanent plastic displacements, the permanent
plastic deflections and the permanent deflection angles before the failure (collapse of the
contralateral cortex).
Activmotion 3 Activmotion 4 Activmotion 5 Activmotion 6
Medial (mm)
Lateral (mm)
-0,04
0,1
0
0,32
0
0,03
0
0,13
Before failure Deflection (mm) 0,14 0,32 0,03 0,13
Angle (rad) 0.001 0.003 0.0003 0.001
Angle (Degree) 0,07 0,15 0,014 0,06
Table 5: Plastic deformations of the specimens. Values are rounded to the last decimal
The Figure 26 recapitulates the permanent deflection angles obtained before the failure. No
value is higher than 1,4 degrees; this means that the failure type 1 did not occur for the
specimens subjected to the cyclical tests.
20

Dr. Arnaud Diffo Kaze, Research Associate, FSTC
De
fle
ctio
n a
ngl
e α
(°
)
0,16
0,14
Permanent plastic deformation
Before failure
0,12
0,10
0,08
0,06
0,04
0,02
0,00
Figure 26: Permanent plastic deflection angle before the failure
4.4. Hysteresis curves: applied force versus displacements
The hysteresis curves are used in order to check the failure type 3 (Table 2). This is done by
plotting the force versus the displacement. In cases of nonlinear systems, the plot is ideally
an elliptical curve with a slope proportional to the stiffness of the system and an enclosed
area proportional to the damping of the system, which is being tested. The width of the
hysteresis curve represents the maximal displacement range; it increases if the specimen
becomes unstable and starts to wobble.
The registered displacements are too noisy, hence the plots of the force versus the
displacement are not hysteresis curves in the most cases, as shown for example in the
pictures from Figure 27 to Figure 29, except for the lateral displacements of the specimens
Activmotion 4 (Figure 30) and Activmotion 6 (Figure 31), for which it has been possible to
determine the maximal width of the hysteresis curve, hence checking failure type 3.
21

Dr. Arnaud Diffo Kaze, Research Associate, FSTC
Lateral Sensor (Activmotion 3)
Figure 27: Activmotion 3: Curves force versus lateral displacement
Vertical Sensor (Activmotion 4)
Figure 28: Activmotion 4: Curves force versus vertical displacement
22

Dr. Arnaud Diffo Kaze, Research Associate, FSTC
Medial Sensor (Activmotion 6)
Figure 29: Activmotion 6: Curves force versus medial displacement
Lateral Sensor (Activmotion 4)
1250 N 0,07 mm
Figure 30: Activmotion 4: Curves force versus lateral displacement. The maximal displacement range is 0,07 mm
23

Dr. Arnaud Diffo Kaze, Research Associate, FSTC
0,03
mm
Lateral Sensor (Activmotion 6)
780 N
Figure 31: Activmotion 6: Curves force versus lateral displacement. The maximal displacement range is 0,03 mm
The maximal displacement within hysteresis loops, which has been graphically determined
(0.03 mm and 0.07 mm) as showed in Figure 30 and Figure 31 are all smaller than 0,5 mm.
therefore the failure type 3 did not occur for all the specimens tested.
4.5. Summary of the fatigue failure tests
The following Table 6 gives a summary of the values of the number of cycles of the
completely performed load steps, the maximal force before the final fracture of the
specimens, and the lateral and the vertical stiffnesses of the specimens at the beginning of
the first load step.
24

Dr. Arnaud Diffo Kaze, Research Associate, FSTC
Specimen
Load step (LS) / Maximal load [N]
Vertical Stiffness
K [N/mm]
Lateral Stiffness
K [N/mm]
Number of cycles
Activmotion 3 LS10 / 2240 2500 Mean:2650
SD±:260
6300 Mean:4763
SD±:1219
> 180 000 Mean:> 140 000
SD±:40 000
Activmotion 4 LS10 / 2240 2500 2900 > 180 000
Activmotion 5 LS6 / 1600 2500 4750 > 100 000
Activmotion 6 LS6 / 1600 3100 5100 > 100 000
V L
Table 6: Summary of fatigue failure tests (all values before collapse of the specimen): max. load, vertical
& lateral stiffness and number of cycles.
25

Dr. Arnaud Diffo Kaze, Research Associate, FSTC
5. Comparison with the previous performed tests
Experimental biomechanical studies (Maas, Diffo Kaze, Dueck, & Pape, 2013; Diffo Kaze, et
al., 2015) were already performed on other plates (Figure 2) using the same materials and
methods that have been used to perform the static and the cyclical tests of the present study
of the size 2 Activmotion plate (Figure 1). Hence the results obtained from all these studies
are comparable. The specimens are grouped and subdivided as indicated in Table 7.
Table 7: Specimen grouping and assignment, depending on used implants and the performed test
5.1. Static loading to failure
The results of the static tests performed on the Activmotion (Table 3) are summarized
together with the results of the previous studies in Table 8. The static lateral stiffness is
calculated as the ratio of the applied load to the lateral displacement. The highest average
ultimate load, at which the specimens collapsed during the single loading to failure test, is
8.2 kN and obtained for the group 6 (Activmotion). The specimens Contour Lock 1 and 2
showed the largest average lateral displacement (4.1 mm) at fracture of the lateral cortex.
The group iBalance showed the highest lateral stiffness at ultimate load (3.1 kN/mm).
The average displacement on the medial compared to the lateral side was always smaller for
all implant types. The determined valgus-malrotation of the tibial head was greater or equal
to the fixed limit of 1.4° of the permanent deflection angle for all implants, except for the
iBalance and Activmotion specimens, which showed the mean values 0.9 ° and 1°
respectively. The group TomoFix std showed the maximal valgus-malrotation at collapse
time of the contralateral cortex (2.8 °).
26

Dr. Arnaud Diffo Kaze, Research Associate, FSTC
The overall observation from the static tests is high strength values with small deformations
for the Activmotion plate compared to the other implants.
Table 8: Static tests summary: Displacements, valgus-malrotation of the tibia head and their corresponding crack and ultimate loads, including mean values and standard deviations (SD). The values of the first 5 groups are retrieved from our previous studies and reported here for purposes of comparison.
27

Dr. Arnaud Diffo Kaze, Research Associate, FSTC
5.2. Fatigue loading to failure
The failure type 3, which is checked by means of the maximal displacement range within
hysteresis loops, did not occur in the Activmotion group, as well as in the groups 1, 2 and 3.
This failure type occurred only in the groups of TomoFix sm and Contour Lock (Maas, Diffo
Kaze, Dueck, & Pape, 2013; Diffo Kaze, et al., 2015; Diffo Kaze A. , 2016).
The crack formation observed prior to the collapse of the specimen Activmotion 4 (Figure
11) was not considered as failure and the other fractures observed were not preceded with
visible cracking. Hence the permanent plastic valgus-malrotation of the tibia before and after
the failure was considered to be the same for the group Activmotion. The values of the
permanent plastic valgus-malrotation are summarized in Figure 32 for the groups 1, 2, 3 and
6. Figure 33 shows the permanent plastic deflection angle in the groups 4 and 5. The load
history according to Figure 3 is indicated with the Load Step number (LSn) at which the
failure occurred. The failure type 1, which is characterized by a permanent plastic deflection
angle greater than 1.4 °, occurred only in the groups of the iBalance, TomoFix sm and
Contour Lock.
28

Dr. Arnaud Diffo Kaze, Research Associate, FSTC
Figure 32: Deflection angle or valgus-malrotation of the tibia head before and after the failure for groups
1, 2, 3 and 6. The failure type 1 was observed in the case of the specimen iBalance 6 after the collapse of the opposite cortex. LS “n” means the failure occurred at load step “n”. The values of the first 3 groups are retrieved from our previous studies.
29

Dr. Arnaud Diffo Kaze, Research Associate, FSTC
Permanent plastic deformation
Figure 33: Deflection angle or valgus-malrotation of the tibia head before and after the failure for groups 4 and 5 (From our previous studies). The TomoFix specimens here are the TomoFix small stature of the group 4 of the present study. The failure type 1 was thus observed for the specimens TomoFix sm 5 and Contour Lock 5.
For sake of comparison, the results of fatigue loading to failure from our previous studies are
presented here, together with the results obtained from the testing on the Activmotion plate,
in the Table 9, Table 10, which summarize the results of the cyclic fatigue to failure tests by
listing the maximal compressive force, lateral and the vertical stiffness of the specimens at
the beginning of the first load step, the number of cycles performed prior to the failure and
the types of failure.
30

Dr. Arnaud Diffo Kaze, Research Associate, FSTC
Table 9: Summary of fatigue failure tests (Groups 1, 2 & 3): max. load, vertical & lateral stiffnesses, number of cycles (all values prior to failure) and failure types.
Table 10: Summary of fatigue to failure tests (Groups 4, 5 & 6): max. load, vertical & lateral stiffnesses, number of cycles (all values prior to failure) and failure types. The values of the group 4 and 5 are retrieved from our previous studies and reported here for sake of comparison
For the group 6 only the failure type 2, i.e., collapse of the contralateral cortex was observed
(Table 10). A damage of the fixation system, i.e, failure type 4 occurred in the iBalance
group.
31

Dr. Arnaud Diffo Kaze, Research Associate, FSTC
Table 11 shows mean values per group of the characteristic values given in the Table 9 and
Table 10 of the individual specimens.
Table 11: Average mean values, including the standard deviations (SD), per group of the cyclic fatigue to failure tests (All comma values rounded to the 1st decimal). The values of the first 5 groups are retrieved from our previous studies and reported here for purposes of comparison.
Regarding the parameters investigated for the fatigue loading to failure tests the Contour
Lock group showed the highest values followed by the Activmotion. The highest lateral and
medial stiffness was showed by the Activmotion and the iBalance group respectively.
PEEKPower group showed higher stiffnesses compared with the TomoFix plates.
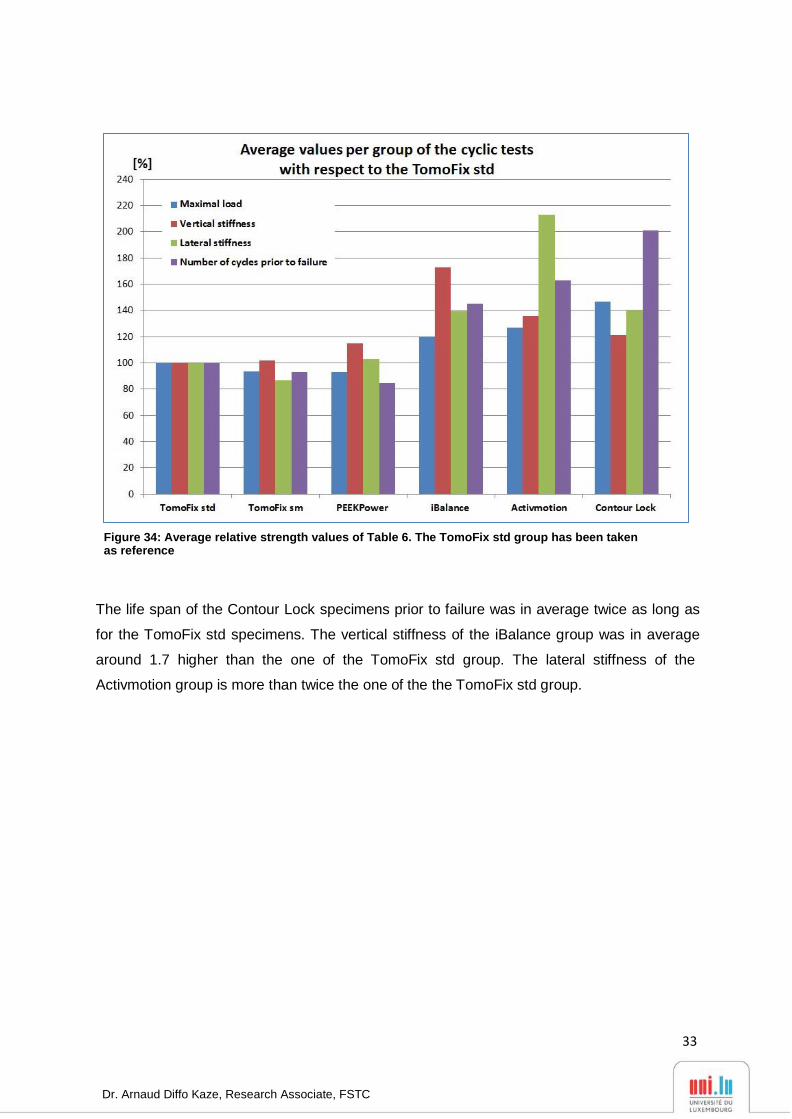
Figure 34 shows the average relative values per groups of the cyclic tests that have been
calculated based on Table 11 and by taking the group TomoFix std as reference.
32
Dr. Arnaud Diffo Kaze, Research Associate, FSTC
Figure 34: Average relative strength values of Table 6. The TomoFix std group has been taken as reference
The life span of the Contour Lock specimens prior to failure was in average twice as long as
for the TomoFix std specimens. The vertical stiffness of the iBalance group was in average
around 1.7 higher than the one of the TomoFix std group. The lateral stiffness of the
Activmotion group is more than twice the one of the the TomoFix std group.
33

Dr. Arnaud Diffo Kaze, Research Associate, FSTC
6. Conclusion
In this study the Activmotion plate was investigated and compared to our previous studies
using the same experimental setup and protocol, thus comparing the static and fatigue
fixation stability provided by the Activmotion plate to the one provided by the following five
different medial open wedge HTO-plates: The TomoFix std plate, the PEEKPower plate, the
iBalance implant, the Contour Lock HTO plate and the TomoFix sm plate. The key findings
of the present study were that: (1) the stiffest bone-implant construct was found to be the
Activmotion plate followed by the Contour Lock plate. (2) The Contour Lock plate provided
the highest fatigue strength under cyclic loading conditions. (3) Static loading until failure
tests revealed superior strength of the Activmotion plate followed by the ibalance implant, the
TomoFix std, the PEEKPower plate, the Contour Lock and the TomoFix sm plates. (4) All
implants withstood the maximal physiological vertical tibiofemoral contact force while slow
walking. This force is about 3 times the body weight (Heinlein et al. 2009; Taylor et al. 2004),
e.g. 2400 N for a patient weighing 80 kg.
All the tested bone-implant-constructs failed eventually due to the collapse of the opposite
cortex, regardless whether a static or cyclic failure test was applied, as for the cases of our
previous study. The final fracture of the contralateral cortex was not generally preceded by a
cracking as it was usually the case in previous studies, except for the specimen Activmotion
4. The displacements of the lateral side of the osteotomy were more pronounced than the
medial displacement, which explains the valgus rotation in the frontal plane of the tibial head
during the static and the cyclic loading tests.
During the static loading to failure test, the average ultimate force of the Activmotion was 8.2
kN, a value which is higher compared to the average values from our previous studies,
namely 5.3 kN, 4.4 kN, 3.6 kN and 3.4 kN for the iBalance, the TomoFix std, the
PEEKPower, the Contour Lock and the TomoFix sm group respectively. Hence, the
Activmotion is superior regarding the static performance.
The maximal load at failure that were observed during the fatigue tests for the Activmotion
group was in average 1,9 kN. Considering the number of cycles and the maximal load at
failure, the Contour Lock plate showed the best performance with 2.2 kN and 173000 cycles,
followed by the Activmotion plates with 1.9 kN and 140000 cycles. Based on those two
parameters a ranking for the cyclic tests would place the iBalance in the third position
after the Activmotion (2nd) and the Contour Lock plate (1st), then the TomoFix std (4th)
followed by the TomoFix sm (5th) and the PEEKpower (6th).
34

Dr. Arnaud Diffo Kaze, Research Associate, FSTC
A valgus deformation of the knee will result from the valgus-malrotation of the tibial head,
which occurred during the tests, and consequently alter the localisation of the mechanical
axis and the primary performed correction. No permanent plastic valgus-malrotation of the
tibial head, which led to failure type 1, was observed in the Activmotion group. Permanent
plastic valgus-malrotations resulting in failure type 1 before fracture of the contralateral
cortex were in the groups of the iBalance, the TomoFix sm and of the Contour Lock, as
shown in Figure 32 and Figure 33. Hence, it can be assume that the TomoFix std and the
PEEKPower plates better conserve correction compare to the iBalance, Tomofix sm and
Contour Lock implants, but the Activmotion provides the best results of all due to its relative
higher number of performed loading cycles before failure. It is cautioned at this level that the
last observation is only valid if there is no bone healing prior to the fatigue failure, which is
not a realistic scenario.
35

Dr. Arnaud Diffo Kaze, Research Associate, FSTC
7. References
1. Diffo Kaze, A. (2016). Etude biomécanique comparative de cinq différents systèmes de fixation
utilisés dans les cas d'ostéotomies tibiales valgisantes: Essais expérimentaux et simulations
numériques incluant les forces musculaires. University of Luxembourg. Aachen: SHAKER VERLAG.
2. Diffo Kaze, A., Maas, S., Waldmann, D., Zilian, A., Dueck, K., & Pape, D. (2015). Biomechanical
properties of five different currently used implants for open-wedge high tibial osteotomy.
Journal of Experimental Orthopaedics, 2(14). doi:10.1186/s40634-015-0030-4
3. ISO 7206-4. (1989). Implants for surgery: Determination of endurance properties of stemmed
femoral components with application of torsion.
4. ISO 7206-6. (1992). Implants for surgery: Determination of endurance properties of head and
neck region of stemmed femoral components.
5. ISO 7206-8. (1995). Implants for surgery: Endurance performance of stemmed femoral
components with application of torsion.
6. Maas, S., Diffo Kaze, A., Dueck, K., & Pape, D. (2013). Static and Dynamic Differences in Fixation
Stability between a Spacer Plate and a Small Stature Plate Fixator Used for High Tibial
Osteotomies: A Biomechanical Bone Composite Study. ISRN Orthopedics, 2013.
doi:10.1155/2013/387620
7. Pape, D.; Lorbach, O.; Schmitz, C.; Busch, L. C.; Van Giffen, N.; Seil, R.; Kohn, D. M. (2010). Effect
of a biplanar osteotomy on primary stability following high tibial osteotomy: a biomechanical
cadaver study. Knee Surg Sports Traumatol Arthrosc., 18, 204-211.
36