Embed Size (px)
Citation preview

Experimental Study on Reinforced Concrete Dampers Using De-Bonded Deformed Bars Kazushi Shimazaki Kanagawa University, JAPAN
ABSTRACT: The demands of building owners have changed in recent years: they now wish to be able to continue using buildings with small repair cost even after a severe earthquake. A building system with dampers is one structural type which meets these performance requirements. There are various types of damper, and the axial yield type hysteresis damper is commonly used. This type damper should be designed to handle local buckling during compression yielding. An experimental research was carried out to develop good RC dampers using de-bonded deformed bars as the axial yield type hysteresis dampers. Two types are prepared. One is a RC stud column damper. The other one is a brace type damper. Tested results for the both dampers showed excellent performance as damping members. They had good repairability, and the performance does not degrade after repair works. Keywords: Reinforced concrete structure, De-bond, Diagonally reinforced stud, Brace, Earthquake resistant design 1. INTRODUCTION The goal of earthquake resistant design in any country is to protect life in case of a very severe earthquake by providing buildings with the strength and durability required to resist collapse. After the devastating Great Hanshin Earthquake, however, the demands of building owners changed: they now want to be able to continue using the buildings again at a low repair cost, and so damage control design has become popular. However, the performance requirements of buildings during planning are diverse, such as improved habitability and large open spaces for flexibility. The building system with dampers is one structural type which meets these performance requirements, for which the dampers need good performance and applicability. There are various types of damper such as hysteresis type dampers, visco-elastic dampers, friction dampers, and so on. Of these, the axial yield type hysteresis damper is commonly used, particularly for buckling-restrained braces. This type of damper must handle local buckling during compression yielding. The authors showed [Shimazaki, 2002] how short beams with de-bonded diagonal reinforcements reduce damage during a severe earthquake and thus improve repairability. Based on the result, an experiment was carried out to develop a good RC damper using de-bonded deformed bars as axial yield type hysteresis dampers. The two types of specimen shown in Figure 1 are considered. One is an RC stud column damper. The damper has eight de-bonded diagonal deformed bars covered by RC stud columns. The stud has a 10-mm clearance at the top and bottom ends. The other type is a brace damper, which has four de-bonded deformed bars covered by RC. At both ends, the deformed bars become thicker and have a 20-mm clearance without concrete cover to yield on compression at the canter part without buckling.

2. RC STUD COLUMN DAMPER 2.1. Experiment The geometries and details of the stud type damper test specimens are shown in Figure 2. Two specimens are tested. The full-scale stud columns have a cross section of 200×400 mm and length of 800 mm with stubs at both ends. In order to absorb the geometric shaft elongation, 10 mm-thick rubber plates are placed at the end division of the stud part throughout the cross section. The deformed bar is de-bond processed by filling the internodes with wax and covering by butyl rubber. The mechanical properties of the material are shown in Table 1.
Table 1. Material properties of test specimens
Rebars Yield (N/mm2)
Strength (N/mm2) Concrete Strength
(N/mm2) Young’s Modulus
(N/mm2) D6 (SD345) 359 519 Concrete 40 2.83×10⁴ D10 (SD345) 392 593 Mortar 35 - D19 (SD345) 393 574
Antisymmetric moment was applied to the specimens using a horizontal actuator as shown in Figure 3. Two vertical actuators are controlled to keep the upper stub horizontal and no axial elongation for the test specimen No.1, and no axial load for the test specimen No.2. Test specimen No. 1 will have variable axial force and specimen No. 2 will have axial elongation. These are assumed to be the extreme case of the boundary condition on the top and bottom floor by beams. In an actual structure, the behavior was regarded as intermediate between these cases. The loading cycle is one cycle at R = 1/700, three at R = 1/400 and 1/200, six at R = 1/100, three at R = 1/67 and R = 1/40, and finally
(a) RC stud column damper (b) Brace damper Figure 1. Two types of Hysteresis type dampers
Figure 2. Details of RC stud column damper
Debond rubber
軸力用アクチュエーター
アクチュエーター
試験体
油圧ジャッキ
Figure 3. Test set-up of RC stud column d
H. Actuator
V. Actuator
one-way loading to R = 1/20. The deflection of R = 1/100 for the specimen corresponds to about R = 1/400 – 1/350 in an actual building, assuming a floor height of 3000 mm and stud depth of 800 mm. Specimen No. 2 was repaired and tested after the first test. 2.2. Experimental Results Crack pattern Crack patterns of each test specimen are shown in Photo 1.
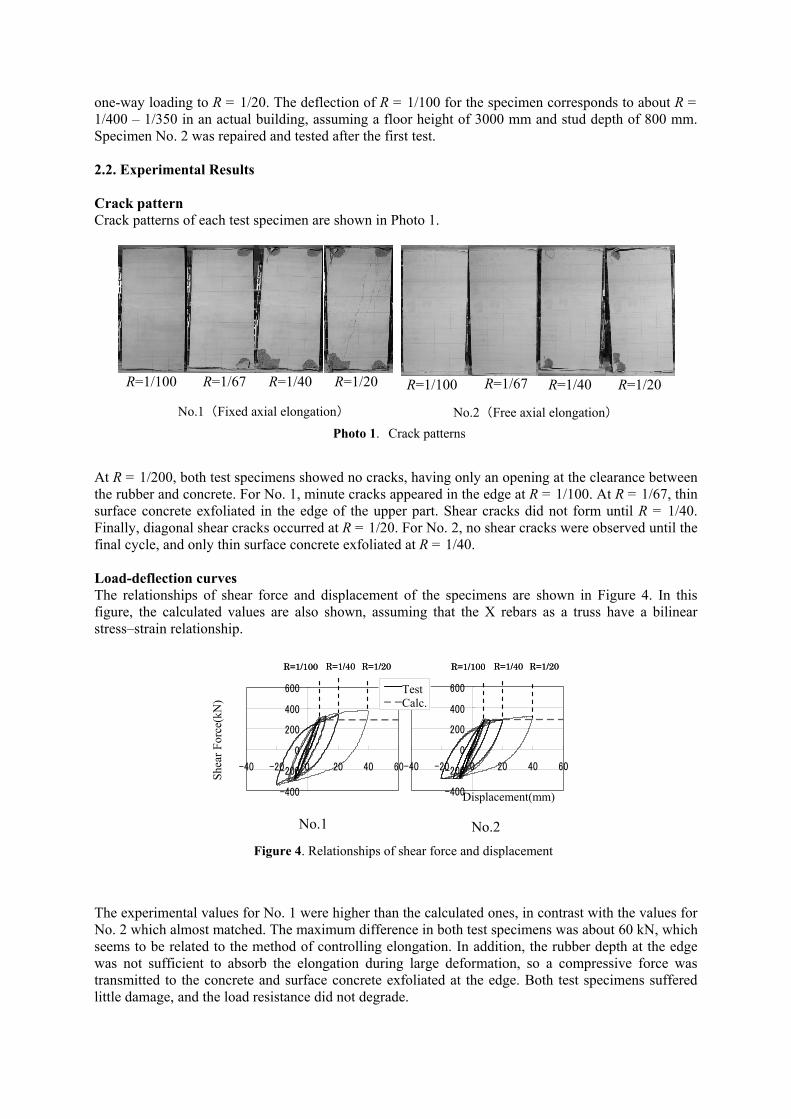
At R = 1/200, both test specimens showed no cracks, having only an opening at the clearance between the rubber and concrete. For No. 1, minute cracks appeared in the edge at R = 1/100. At R = 1/67, thin surface concrete exfoliated in the edge of the upper part. Shear cracks did not form until R = 1/40. Finally, diagonal shear cracks occurred at R = 1/20. For No. 2, no shear cracks were observed until the final cycle, and only thin surface concrete exfoliated at R = 1/40. Load-deflection curves The relationships of shear force and displacement of the specimens are shown in Figure 4. In this figure, the calculated values are also shown, assuming that the X rebars as a truss have a bilinear stress–strain relationship.
The experimental values for No. 1 were higher than the calculated ones, in contrast with the values for No. 2 which almost matched. The maximum difference in both test specimens was about 60 kN, which seems to be related to the method of controlling elongation. In addition, the rubber depth at the edge was not sufficient to absorb the elongation during large deformation, so a compressive force was transmitted to the concrete and surface concrete exfoliated at the edge. Both test specimens suffered little damage, and the load resistance did not degrade.
-400
-200
0
200
400
600
-40 -20 0 20 40 60
-400
-200
0
200
400
600
-40 -20 0 20 40 60
実験値
計算値
R=1/100 R=1/40 R=1/20 R=1/100 R=1/40 R=1/20
-400
-200
0
200
400
600
-40 -20 0 20 40 60
-400
-200
0
200
400
600
-40 -20 0 20 40 60
実験値
計算値
-400
-200
0
200
400
600
-40 -20 0 20 40 60
-400
-200
0
200
400
600
-40 -20 0 20 40 60
実験値
計算値
R=1/100 R=1/40 R=1/20 R=1/100 R=1/40 R=1/20
Figure 4. Relationships of shear force and displacement
Shea
r For
ce(k
N)
No.1 No.2
Displacement(mm)
TestCalc.
No.1 (Fixed axial elongation)
R=1/100 R=1/67 R=1/40 R=1/20
Photo 1. Crack patterns
R=1/100 R=1/67 R=1/40 R=1/20
No.2 (Free axial elongation)
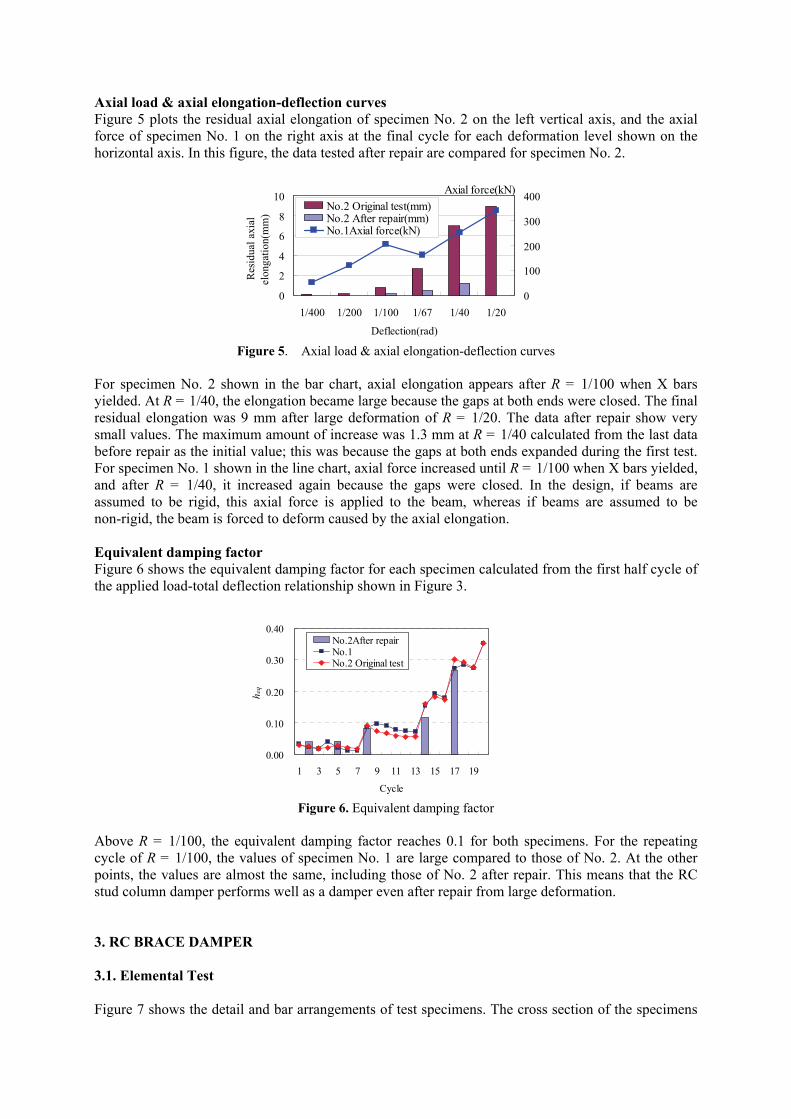
Axial load & axial elongation-deflection curves Figure 5 plots the residual axial elongation of specimen No. 2 on the left vertical axis, and the axial force of specimen No. 1 on the right axis at the final cycle for each deformation level shown on the horizontal axis. In this figure, the data tested after repair are compared for specimen No. 2.
0
2
4
6
8
10
1/400 1/200 1/100 1/67 1/40 1/20
Deflection(rad)
Res
idua
l axi
alel
onga
tion(
mm
)
0
100
200
300
400No.2 Original test(mm)No.2 After repair(mm)No.1Axial force(kN)
Axial force(kN)
Figure 5. Axial load & axial elongation-deflection curves
For specimen No. 2 shown in the bar chart, axial elongation appears after R = 1/100 when X bars yielded. At R = 1/40, the elongation became large because the gaps at both ends were closed. The final residual elongation was 9 mm after large deformation of R = 1/20. The data after repair show very small values. The maximum amount of increase was 1.3 mm at R = 1/40 calculated from the last data before repair as the initial value; this was because the gaps at both ends expanded during the first test. For specimen No. 1 shown in the line chart, axial force increased until R = 1/100 when X bars yielded, and after R = 1/40, it increased again because the gaps were closed. In the design, if beams are assumed to be rigid, this axial force is applied to the beam, whereas if beams are assumed to be non-rigid, the beam is forced to deform caused by the axial elongation. Equivalent damping factor Figure 6 shows the equivalent damping factor for each specimen calculated from the first half cycle of the applied load-total deflection relationship shown in Figure 3.
0.00
0.10
0.20
0.30
0.40
1 3 5 7 9 11 13 15 17 19
Cycle
h eq
No.2After repairNo.1No.2 Original test
Figure 6. Equivalent damping factor
Above R = 1/100, the equivalent damping factor reaches 0.1 for both specimens. For the repeating cycle of R = 1/100, the values of specimen No. 1 are large compared to those of No. 2. At the other points, the values are almost the same, including those of No. 2 after repair. This means that the RC stud column damper performs well as a damper even after repair from large deformation. 3. RC BRACE DAMPER 3.1. Elemental Test Figure 7 shows the detail and bar arrangements of test specimens. The cross section of the specimens

is 240×210 mm and the length is 1500 mm. At both ends, the deformed bars are thick, and both rebars are connected by friction welding. At the weld point, the midsection thin rebars are covered by butyl rubber as large as the diameter of the end part rebars to act as a buffer to yield in compression. Both the end part and midsection rebars are de-bonded. The end part rebars are filled to a sufficient length in RC to avoid compression buckling. Both ends are fixed by additional steel plates to attach the loading frame. The test set-up is shown in Figure 8.
Figure 7. Detail and bar arrangements of test specimens Figure 8. Test set-up Table 2 shows a list of the test specimens. The main parameters are de-bonding method, clearance between rebar and concrete cover, and type of longitudinal bar. In the column “De-bond”, “+” means that the dimple parts of a deformed bar were filled by wax or clay, and then the bar was coated by butylene rubber or covered by a heat-contracting tube. The others were covered by a rigid polyvinyl chloride pipe, polyvinyl chloride tube, or hot-dip zincing steel plate without filling. The definition of “clearance” is the thickness of clearance gap for No. 1, 3, 4, 9 and the thickness of the de-bond material for the other specimens.
Table 2 List of test specimens Clearance
bars De-bond bars De-bond (mm)No.1 - 0No.2 D16 wax+butylene rubber D22 1.0No.3 (SD345) rigid polyvinyl chloride pipe (SD345) 2.0No.4 polyvinyl chloride tube 1.0No.5 D16 clay+heat contracting tube 0.7No.6 (SD345) heat contracting tube 0.7No.7 D16 polyvinyl chloride tube D25 0.6No.8 (SD345) hot-dip zincing steel plate (SD345) 0No.9 φ16 - 0No.10 (SNR490B) heat contracting tube 0.7
φ16(SNR400B)
0.7
Center End
wax+
butylenerubber
wax+
butylenerubber
No.11 heat contracting tube
3.2. Elemental Test Results Axial load–deflection relationships are shown in Figure 9 for typical specimens. Only the bonded specimen No. 1 suffered subsidiary fracture at a weld point during the R = 1/67 loading cycle. For specimens No. 2 to 4 whose end rebars were small, the end bars buckled at R = 1/100 – 1/40. Then,
Actuator
2700mm
2700
mm
Specimen A
B’ 1,500(De-bond)
A-A’sectionD16
Rebars
B-B’section D22, D25
Screw Rebars
B
A’

the loading sequence was modified only on the tension side after buckling. Specimens No. 5 to 7 showed good performance until R = 1/20. Specimen No. 8 suffered degraded load capacity at R = 1/40 in compression loading with increasing cracking of confining concrete, though the performance was not so poor. Specimen No. 9 containing bonded round bars showed good performance until R = 1/40, but subsidiary fracture at the weld point thereafter. The specimens with less “clearance” showed large compression resistance caused by the transfer of stress to confining RC by friction, without absorbing the cubical expansion in the compression side. This appeared to serve to increase the crack.
Figure 9. Axial load-axial deflection relationships Photo 2 shows the final state of rebars after removing the confining RC cover. The deformed bar buckled gently in the weak axis in contrast to the round bar which buckled sharply only in the buffer zone and suffered subsidiary fracture. This indicates the advantage of using deformed bars.
(a) Deformed bar (b) Round bar
Photo 2. Final state of bars at weld point
Figure 10 shows the cumulative absorption energy of each specimen calculated from the area of the axial load–axial deflection relationship shown in Figure 9. Significant differences are not observed except for specimens No. 1 to 4, which buckled at the end part rebars because they had insufficient section.
0100200300400500600
No.
1
No.
2
No.
3
No.
4
No.
5
No.
6
No.
7
No.
8
No.
9
No.
10
No.
11
FinalR=1/40R=1/100
Tota
l Ene
rgy
(kN
m)
Figure 10. Cumulative absorption energy
-800.0
-600.0
-400.0
-200.0
0.0
200.0
400.0
600.0
-60 -40 -20 0 20 40 60 80 100
軸変位(㎜)
軸荷
重(k
N)
No.8 -800.0
-600.0
-400.0
-200.0
0.0
200.0
400.0
600.0
-60 -40 -20 0 20 40 60 80 100
軸変位(㎜)
軸荷
重(k
N)
No.9 -800
-600
-400
-200
0
200
400
600
-60 -40 -20 0 20 40 60 80 100
軸変位(㎜)
軸荷
重(k
N)
No.4 -800.0
-600.0
-400.0
-200.0
0.0
200.0
400.0
600.0
-60 -40 -20 0 20 40 60 80 100
軸変位(㎜)
軸荷
重(k
N)
No.6 Axi
al F
orce
(kN
)
Displacement (mm) Displacement (mm) Displacement (mm) Displacement (mm)
R=1/20R=1/40 R=1/20R=1/40 R=1/40R=1/40

3.3. Frame Test One test specimen was prepared at one-third scale, and was designed to confirm the condition of column-beam-brace connections. Figure 11 shows the detail and bar arrangements of the test specimens. The cross section of the columns is 255×255 mm with 14-D13 rebars and 870 mm clear span. The beam is 180×240 mm section with 12-D13 rebars and 1845 mm clear span. The brace is 180×160 mm section with 4-D13 rebars at the center part and 4-D19 rebars at both ends. The total length is 1640 mm and the length of the center D13 part is 1250 mm. This length is determined to yield at R = 1/250. At both ends, there are 15-mm clearances so that the rebars yield in compression. The end part rebars are filled to sufficient length in the beam-column joint with fixing plates. The test set-up is shown in Figure 12. Cyclic horizontal force is applied at the top loading steel frame. The loading cycle is one cycle at R = 1/700, three at R = 1/400 and 1/200, six at R = 1/100, three at R = 1/67 and R = 1/40, and finally one-way loading to R = 1/33.
PL
PL
PL
PL-6×320×250(A)
PL
PL
D6 @100
150
4-M24
PL -20×150×130
6-M22
15
15
1515
PLー16×255×255(B) PLー16×255×255(B)
200
400
318
241
1640
435
1050 2100
480
870
240
柱255×255(14-D13)
梁180×240(12-D13)
基礎梁400×480(8-D19)
D6 @60
柱255×255(14-D13)
2-D10 D10 @100
ー16×255×255(B)ー16×255×255(B)
ー12×180×240(C)
ー12×180×240(C)
クレビス用インサート
1590
ピンー250×320×235(横×奥行き×高)
3770×400×400
-320×250×6(A)
555
324
曲げ直径 76㎜余長 15d(285㎜)
D6 @90
D10@100
D6@60
3800
450
559
400
2549
6-M22
6-M22
Figure 11. Detail and bar arrangements of test specimens Figure 12. Test set-up
During the response in the R = 1/200 cycle, bending cracks were observed at beam ends and column ends. The center rebars in the brace yielded at the R = 1/200 cycle. Bending-shear cracks were observed for the beam at the R = 1/100 cycle. Damage to the brace was very small until final loading. Crack patterns at R = 1/100 and at the final cycle are shown in Photo 3. Cracks are not severe in the beam-column connection zone.
(a) R =1/100 (b) Final
Photo 3 Crack Patterns
The horizontal load–horizontal deflection behavior is shown in Figure 13. Very ductile behavior was observed until R = 1/40 with very fat hysteresis loops. In this figure, calculated values are also drawn. “Frame” means the value calculated by nonlinear space frame analysis, while “brace” means the value calculated from the axial yield strength and deformation of rebars. The relationship between brace axial force estimated from the strain of the end reinforcing bar and axial displacement is shown in Figure 14. In the compression side, the strain decreases because concrete works with bars. However, it seems possible to estimate the axial force in the tension side. In this figure, the bi-linear relationship
Reaction Wall Reaction
Wall
PantographActuator
Pantograph
Loading Frame

with the assumption of 7% second modulus to the elastic stiffness is superimposed. The correspondence is good. The relationship shown in Figure 13 is modified to the relationship in the horizontal force–horizontal displacement. “Frame+Brace” means the sum of “Frame” and “Brace”. The calculated values show good agreement with the test results. Equivalent damping factors at each loading cycle are shown in Figure 15. In this figure, common values for RC frame structures defined by the Japanese building code are compared, showing that values almost two to three times as large are obtained. This means that the system used here is on the high ground to absorb earthquake energy.
Figure 13. Horizontal load-horizontal deflection Figure 14. Estimated axial force-axial deformation
0
10
20
30
0
1/
100
1/
50
3/
100
Drift Angle(rad)
heq(
%)
R=1/40
1/200
R=1/67
δy=1/200
δy=1/100
Figure 15. Equivalent damping factor(heq)
4. CONCLUSIONS This paper described an experiment conducted for developing good RC dampers using de-bonded deformed bars as axial yield type hysteresis dampers. The main findings were as follows: 1. Energy absorption ability is large by tension and compressive axial yielding of de-bonded deformed
bars, and the performance as a damping member is excellent. 2. For the RC stud column damper, a gap at the boundary of the stud part, absorption of axial force
and shaft elongation are possible, which reduces damage to the member. 3. The repairability is very good, with no difference in performance before and after repair. ACKNOWLEDGEMENT This study was funded by Kanagawa University. The opinions and findings do not necessarily represent those of the sponsor. REFERENCES SHIMAZAKI, K. (2002): Experimental study of a diagonally reinforced beam with well repairability, Proc. 12th
European Conference on Earthquake Engineering, CD-ROM, Paper 258, London
-600
-400
-200
0
200
400
600
-30 -20 -10 0 10 20 30
Displ.(mm)
Sto
ry S
hear
Forc
e(k
N)
-300
-200
-100
0
100
200
300
-30 -20 -10 0 10 20 30
Axial deformation(mm)
Est
imat
ed
Axi
al F
orce(
kN)
R=1/40R=1/100
FrameBrace
Frame+Brace
Test results