Embed Size (px)
Citation preview
PII: S0301-5629(00)00260-X
● Original Contribution
EXPERIMENTAL STUDY OF THE EFFECTS OF OPTISON tCONCENTRATION ON SONOPORATION IN VITRO
MARK WARD,* JUNRU WU* and JEN-FU CHIU†
*Department of Physics and†Department of Biochemistry, University of Vermont, Burlington, VT, USA
(Received9 September1999; in final form 2 May 2000)
Abstract—Lethal sonoporation and reparable sonoporation were observed in Jurkat lymphocytes in suspensionwith the addition of varying amounts of Optisont, a commercially available bubble-based contrast agent. Forgiven ultrasound (US) exposure conditions (spatial peak-pressure amplitude of 0.2 MPa, duty cycle 10% and2-MHz frequency), sonoporation was directly related to the bubble-to-cell ratio (in a range from 0 to 230). It wasfound that the nearest bubble-cell spacing was also related to the occurrence frequency of bioeffects. A constantbubble-to-cell ratio often provided very different results for two different initial cell concentrations (200,000cells/mL and 600,000 cells/mL), with the higher cell concentration generally exhibiting higher levels of sonopo-ration. In contrast, a constant bubble-to-cell spacing provided similar results between the two initial cellconcentrations. The frequency of reparable and lethal sonoporation was seen to decay as the inverse-cube powerof the nearest bubble-cell spacing. Significant reparable sonoporation was observed at a bubble-cell spacing thatwas 10mm larger than the minimum spacing at which significant lethal sonoporation was observed. Preliminaryanalysis also suggests the possibility of a step-wise increase in lethal sonoporation as spacing decreases; furtherexperiment is needed. © 2000 World Federation for Ultrasound in Medicine & Biology.
Key Words:Sonoporation, Bioeffects of ultrasound, Therapeutic ultrasound.
INTRODUCTION
The possible enhancement of bioeffects due to the ap-plication of contrast agents in clinical diagnostic ultra-sound (US) has recently become a focus of research(Brayman et al. 1999; Miller and Thomas 1996; Miller etal. 1996, 1999; Bao et al. 1997; Miller and Gies 1998;Ward et al. 1999). An ultrasonic contrast agent that hasbeen used in the USA and other countries is Optisont(Mallinckrodt Medical, St. Louis, MO). It consists ofmicrometer-size (mean diameter> 2–5 mm) denaturedhollow albumin microspheres of shell thickness approx-imately 15 nm. The microbubbles are filled with octaflu-oropropane and the microbubble stock concentration isapproximately 6.53 108/mL. Our previous studies(Ward et al. 1999) demonstrated that the use of contrastagents significantly enhanced the probability of biologi-cal effects when suspensions of cells were exposed to2-MHz US of modest pressure amplitude (spatial peakpressure amplitude of 0.2 MPa, duty cycle 10%). Ob-served bioeffects include: 1. reparable sonoporation, atemporary “opening” of the cell membrane that subse-
quently reseals; and 2. lethal sonoporation (disruption ofthe plasma membrane that permits permanent staining ofthe cell’s interior by the dye Trypan Blue). The mecha-nisms of the bioeffects were not precisely known at thattime, and remain poorly understood.
One hypothesis regarding the mechanism contendsthat the bioeffects are consequences of inertial cavitation,violent oscillations and collapse of bubbles in the sur-rounding fluid (Bao et al. 1997). Physical and chemicalphenomena related to inertial cavitation include mi-crostreaming (Gormley and Wu 1998), shock waves,microjets, extremely high localized temperatures andpressures inside of bubbles and generation of free radi-cals (namely H1, OH2, O22) (Apfel 1997). The addi-tion of a contrast agent such as Optisont can providenuclei for inertial cavitation in the forms of stabilized gasspheres or pockets of gas and shell fragments releasedfrom the disruption of a stabilized sphere. The mechan-ical index (MI) (AIUM/NEMA 1992, 1998; AIUM 1993,2000; Apfel and Holland 1991) is used to describe thelikelihood of causing a nucleus of optimum size to un-dergo inertial cavitation in response to a short pulse ofUS, and is intended to be an indicator of the potential forin vivo bioeffects. For short pulses (a few acoustic cy-
Address correspondence to: Junru Wu, Department of Physics,University of Vermont, Burlington, VT 05405 USA.
Ultrasound in Med. & Biol., Vol. 26, No. 7, pp. 1169–1175, 2000Copyright © 2000 World Federation for Ultrasound in Medicine & Biology
Printed in the USA. All rights reserved0301-5629/00/$–see front matter
1169
cles), inertial cavitation is not expected to occurin vivoif the mechanical index is less than 0.7 (AIUM 2000).However, for longer pulses (the pulses used in this studycorrespond to twenty acoustic cycles), a nucleus maygrow through rectified diffusion and eventually be stim-ulated to violent inertial cavitation. The calculated MI forour case (water path) is 0.14. The numerical calculationsdone by Flynn and Church (1988) indicate that there is areasonable possibility for inertial cavitation in water tooccur even at such a low MI with cavitation nucleipresent. Direct determination of the nature of the cavi-tation (inertial or noninertial) has not been performed forthese experiments.
For this study, it was hypothesized that reparablesonoporation and lethal sonoporation, two distinct ob-served effects, are two “stages” of degree of severity ofthe same actual mechanism and reparable sonoporationshould appear at lower contrast agent concentrations orlarger bubble-cell spacing than lethal sonoporation, un-der a given modest intensity US exposure. The recurrentdisturbances of cell membranes by US may eventuallycause cells to lose the ability to repair themselves; thetransition from reparable sonoporation to lethal sonopo-ration, therefore, takes place.
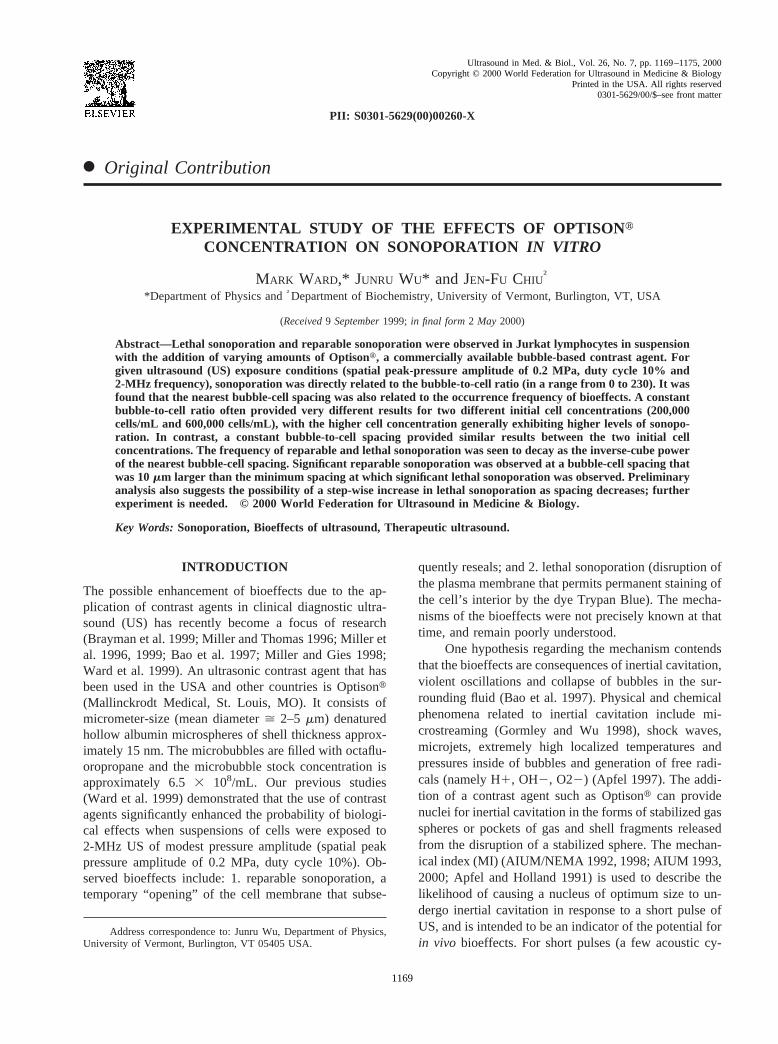
It was further hypothesized that both reparablesonoporation and lethal sonoporation are consequencesof a short-range bubble-cell interaction (the effects decayas the inverse-cube power, r23, of the bubble-cell spac-ing). The model used in this paper assumes that thebubbles and cells are evenly distributed in the suspen-sion. Under this assumption, it can easily be shown thatthe bubble-bubble spacing is equal to the nearest bubble-cell spacing (center to center), as in Fig. 1. This assump-tion may not be completely accurate because bubbleaggregates may form due to the attractive secondaryforces (Wu and Tong 1998; Dayton et al. 1999) andbuoyancy forces may cause the bubbles to rise to thesurface. Nevertheless, it may give some useful physicalinsight, and the continuous vortexing action of the rotat-ing tube exposure system and acoustic streaming mayhelp to make this model a reasonable approximation forour testing system. Using this model, the average cellspacings for the concentrations used in this study werecalculated to be 171mm and 118mm, and the averagebubble spacing ranged from about 18mm to 63mm. Thecells used were approximately 15mm in diameter and thebubble diameter was between 2mm and 5mm. When thenearest bubble-cell spacing was much less than the cell-cell spacing, the cell concentration was not expected tobe a significant factor in determining the bioeffects.Furthermore, because of the ability of a cell to repairminor damage to its membrane, reparable sonoporationwas hypothesized to occur as a result of a relatively mildinjury, which could be expected for relatively large bub-
ble-cell spacing (say, greater than a few cell diameters).The frequency of reparable sonoporation was expected toincrease continuously as the mean bubble-cell spacingdecreased. Lethal sonoporation was not expected to oc-cur unless the injury to the cell was severe enough (dueto relatively small bubble-cell spacing) so that the cellcould not maintain the necessary repair processes, result-ing in lethal damage.
EXPERIMENTAL METHODS
Jurkat lymphocytes (subclone of T cells) were in-cubated in a 37°C, 5% CO2 atmosphere in 25 cm2 tissueculture flasks (Becton-Dickson, Oxnard, CA) in a solu-tion of RPMI Medium 1640 (GIBCOBRL, Grand Island,NY) supplemented with 10% fetal bovine serum (FBS).For exposures, the cells were diluted to a concentrationof either 23 105 or 6 3 105 cells/mL and supplementedwith 10% fluorescein isothyocyanate-dextran (FITC).The FITC has a molecular weight of about 500,000 Da,and is normally unable to penetrate the cell membrane.For each trial, 2.0 mL of the cell suspension was placedin a plastic culture tube of 12-mm diameter and 75-mmlength (VWR Scientific, West Chester, PA) using aseptictechnique and combined with the appropriate amount ofOptisont (0 to 420mL), to achieve specific microbubble:cell ratios. For example, the bubble-to-cell ratio of 230was achieved by mixing 2 mL of cell suspension (63
Fig. 1. An idealized 2-D representation of the evenly distrib-uted bubble and cell model. In a hexagonal close-packed struc-ture, every cell would be surrounded by 12 nearest-neighborbubbles (in 3-D). This is an approximate scale drawing of therelative sizes of the cells and bubbles at the smallest bubblespacing used in these experiments. As the bubble-to-cell ratiodecreases, the nearest neighbor bubbles will “spread out,”
resulting in larger values of r.
1170 Ultrasound in Medicine and Biology Volume 26, Number 7, 2000
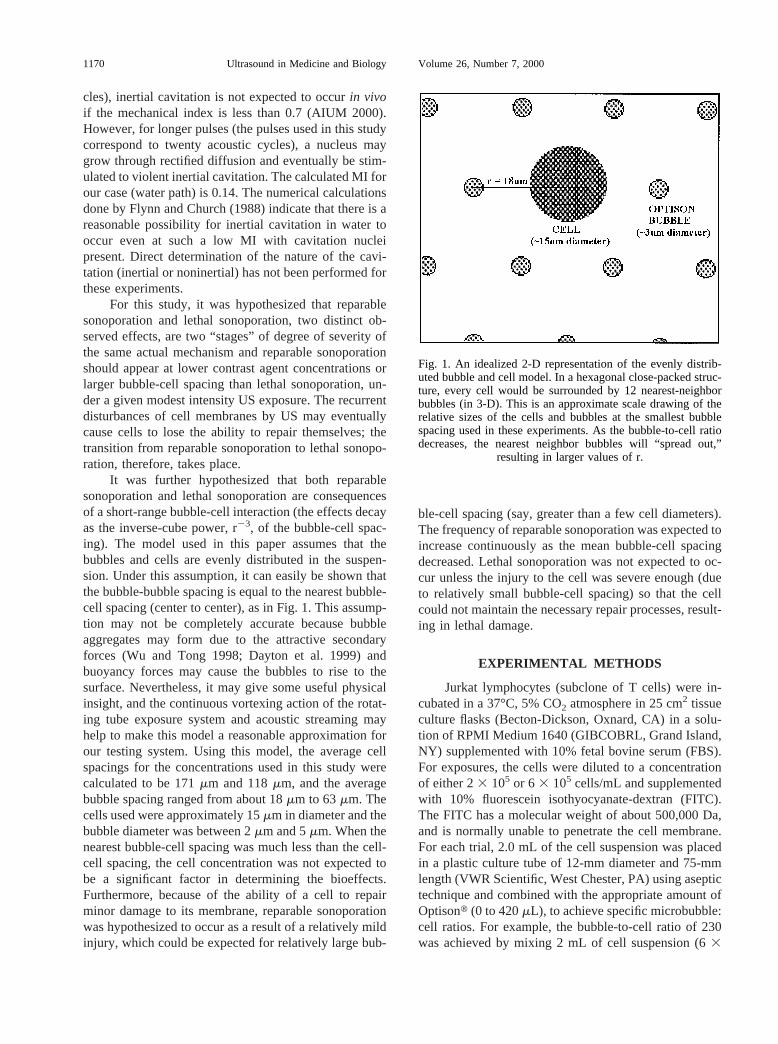
105 cells/mL) with 420mL of Optisont from a freshlyopened vial. The tube was tightly capped and kept on iceexcept during exposure, centrifuging and pipetting. Thesuspension was gently and thoroughly mixed by invert-ing several times just before exposure. The exposuresystem used has been previously described (Ward et al.1999). Briefly, the culture tube was attached by its cap toa small DC motor, which rotated the tube at 200 rpm..This assembly was lowered into a glass tank filled withwater at room temperature (20°C) and aligned with theUS transducer at a distance of 10 cm (Fig. 2). Thetransducer used was a 2.5-cm diameter Panametrics A304 S planar transducer (Panametrics, Waltham, MA),driven by a Hewlett Packard 3314A function generator(Agilent Technologies, Palo Alto, CA) and an ENI2100L RF power amplifier (ENI, Rochester, NY). Thecenter frequency was 1.98 MHz, a resonance mode of thetransducer, and the duty cycle was 10% (on cycles/offcycles5 20/180, pulse repetition frequency5 10 kHz).The test tube was situated in the near-field of the US fieldproduced by the transducer. The spatial peak-pressureamplitude was 0.2 MPa, determined by the acousticradiation force method (Ward et al. 1999). A three-dimensional (3-D) plot of the sound fieldin situ wasprovided in our previous paper (Ward et al. 1999).
The sample described earlier was exposed to the USfor 5 min, centrifuged, and the cells were washed withcold RPMI (serum-free) to remove any Optisont andFITC-dextran from the surrounding solution. The cellswere resuspended in about 0.4 mL RPMI and 0.1 mLTrypan Blue dye, gently mixed and counted using ahemacytometer. Each count involved pipeting about 100
mL of the solution and placing a small drop in thehemacytometer chamber. The microscope used forcounting was a Nikon Optiphot-2, which can be switchedbetween “normal (white light) mode” and “epifluores-cent mode” (excitation wavelength 440 nm, fluorescencewavelength 530 nm). A minimum of 200 total cells werecounted for each trial (scored blindly), and the numbersof cells that were stained with Trypan Blue or werefluorescent were counted. A stained cell indicated thatthe plasma membrane was damaged (lethal poration) andthe cell was unable to exclude the Trypan Blue dye(molecular weight of about 960 Da). A fluorescent cellindicated that the plasma membrane was previouslydamaged, which allowed the FITC-dextran to enter thecell, but had since been repaired, which prevented theFITC-dextran from leaving the cell. The earlier washingsteps removed all the FITC-dextran from the surroundingsolution and from any lethally porated cells, so fluores-cent cells were easily spotted. There was no evidence ofbinding of the FITC-dextran inside the cells. If bindingdid occur, a lethally porated cell would appear “double-stained,” both blue and fluorescent. The experimentalsetup allowed observation of specific cells under “white”and fluorescent light alternately, and no double-stainedcells were observed. From the data, it was possible tocalculate the number of cells that were stained or fluo-rescent in a sample. Each data point is an average of fourindependent trials of the same bubble-to-cell ratio; dataare presented as the average of the individual values plusor minus 1 standard deviation.
RESULTS
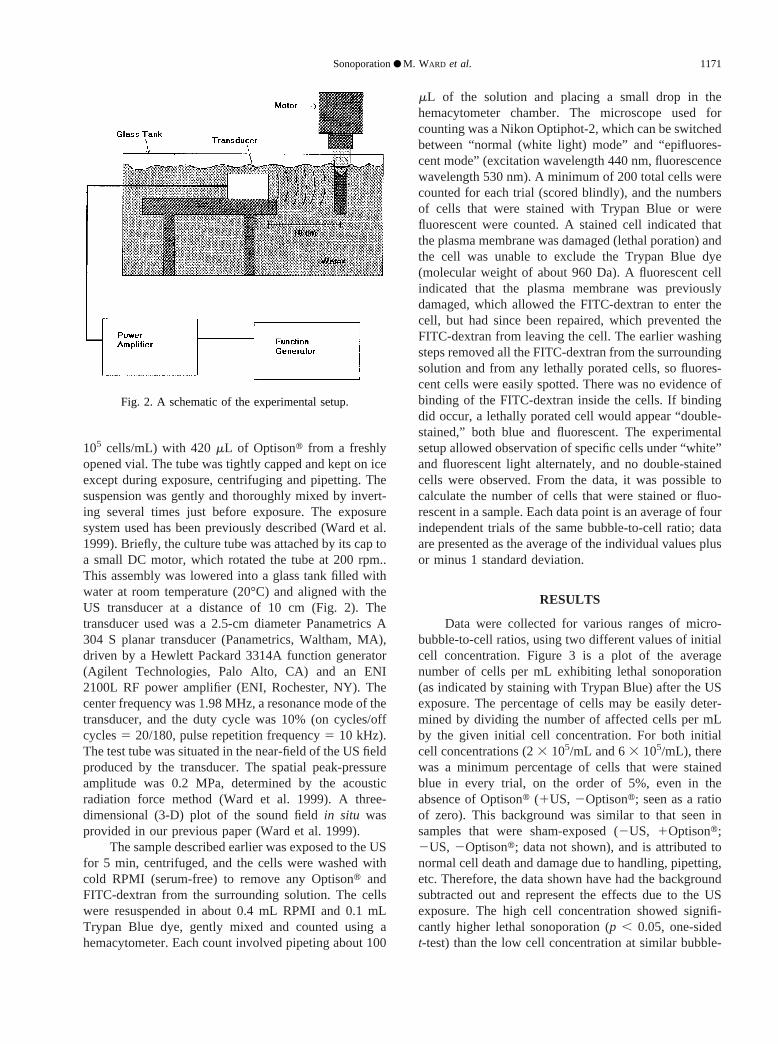
Data were collected for various ranges of micro-bubble-to-cell ratios, using two different values of initialcell concentration. Figure 3 is a plot of the averagenumber of cells per mL exhibiting lethal sonoporation(as indicated by staining with Trypan Blue) after the USexposure. The percentage of cells may be easily deter-mined by dividing the number of affected cells per mLby the given initial cell concentration. For both initialcell concentrations (23 105/mL and 63 105/mL), therewas a minimum percentage of cells that were stainedblue in every trial, on the order of 5%, even in theabsence of Optisont (1US, 2Optisont; seen as a ratioof zero). This background was similar to that seen insamples that were sham-exposed (2US, 1Optisont;2US, 2Optisont; data not shown), and is attributed tonormal cell death and damage due to handling, pipetting,etc. Therefore, the data shown have had the backgroundsubtracted out and represent the effects due to the USexposure. The high cell concentration showed signifi-cantly higher lethal sonoporation (p , 0.05, one-sidedt-test) than the low cell concentration at similar bubble-
Fig. 2. A schematic of the experimental setup.
Sonoporation● M. WARD et al. 1171
to-cell ratios for all of the data points except ratios of 0and 20. It should be noted that the high cell concentrationcases were compared here with low cell concentrationcases under the same cell-to-bubble ratio; therefore, therewere many more bubbles involved in the high cell con-centration cases than in low cell concentration cases. Forthe high cell concentration, there appears to be the pos-sibility of three discrete steps, where the number ofaffected cells per mL increased from (roughly) 12,000 to70,000 to 150,000. From this graph, the trend is moredifficult to see for the low cell concentration; furtheranalysis and justification will follow. A linear fit hasbeen applied to each data set, resulting in R-values of0.9473 (600,000 cells/mL) and 0.9694 (200,000 cells/mL). (An R-value of 1 indicates a perfect fit.)
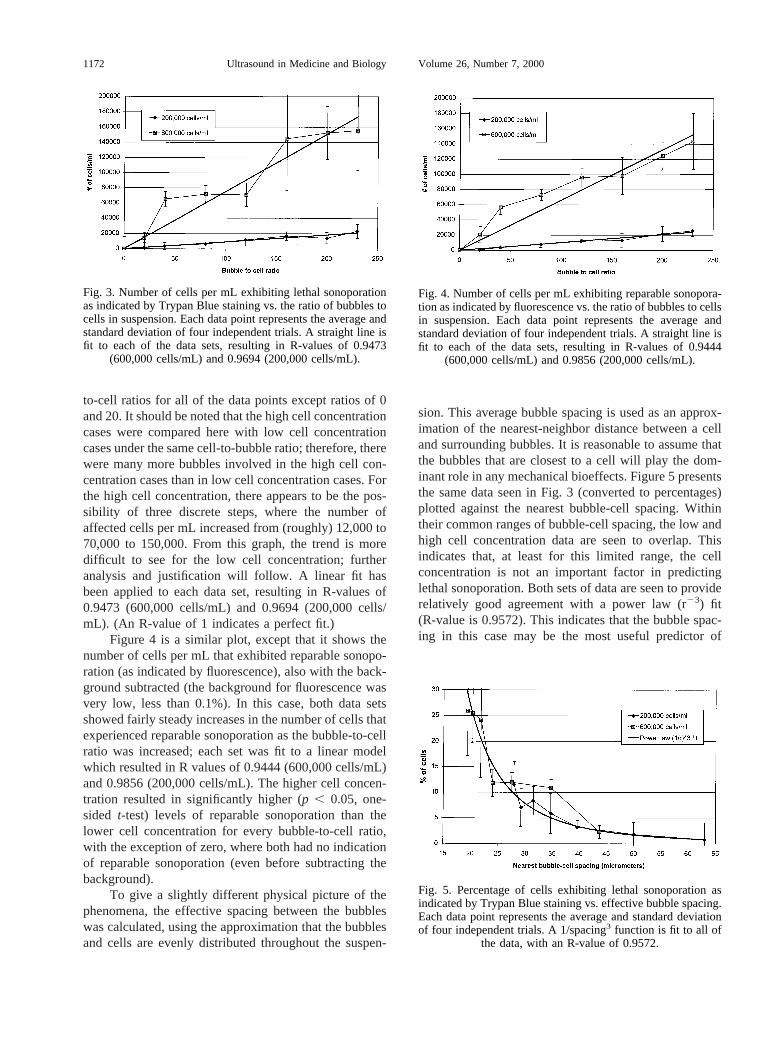
Figure 4 is a similar plot, except that it shows thenumber of cells per mL that exhibited reparable sonopo-ration (as indicated by fluorescence), also with the back-ground subtracted (the background for fluorescence wasvery low, less than 0.1%). In this case, both data setsshowed fairly steady increases in the number of cells thatexperienced reparable sonoporation as the bubble-to-cellratio was increased; each set was fit to a linear modelwhich resulted in R values of 0.9444 (600,000 cells/mL)and 0.9856 (200,000 cells/mL). The higher cell concen-tration resulted in significantly higher (p , 0.05, one-sided t-test) levels of reparable sonoporation than thelower cell concentration for every bubble-to-cell ratio,with the exception of zero, where both had no indicationof reparable sonoporation (even before subtracting thebackground).
To give a slightly different physical picture of thephenomena, the effective spacing between the bubbleswas calculated, using the approximation that the bubblesand cells are evenly distributed throughout the suspen-
sion. This average bubble spacing is used as an approx-imation of the nearest-neighbor distance between a celland surrounding bubbles. It is reasonable to assume thatthe bubbles that are closest to a cell will play the dom-inant role in any mechanical bioeffects. Figure 5 presentsthe same data seen in Fig. 3 (converted to percentages)plotted against the nearest bubble-cell spacing. Withintheir common ranges of bubble-cell spacing, the low andhigh cell concentration data are seen to overlap. Thisindicates that, at least for this limited range, the cellconcentration is not an important factor in predictinglethal sonoporation. Both sets of data are seen to providerelatively good agreement with a power law (r23) fit(R-value is 0.9572). This indicates that the bubble spac-ing in this case may be the most useful predictor of
Fig. 3. Number of cells per mL exhibiting lethal sonoporationas indicated by Trypan Blue staining vs. the ratio of bubbles tocells in suspension. Each data point represents the average andstandard deviation of four independent trials. A straight line isfit to each of the data sets, resulting in R-values of 0.9473
(600,000 cells/mL) and 0.9694 (200,000 cells/mL).
Fig. 4. Number of cells per mL exhibiting reparable sonopora-tion as indicated by fluorescence vs. the ratio of bubbles to cellsin suspension. Each data point represents the average andstandard deviation of four independent trials. A straight line isfit to each of the data sets, resulting in R-values of 0.9444
(600,000 cells/mL) and 0.9856 (200,000 cells/mL).
Fig. 5. Percentage of cells exhibiting lethal sonoporation asindicated by Trypan Blue staining vs. effective bubble spacing.Each data point represents the average and standard deviationof four independent trials. A 1/spacing3 function is fit to all of
the data, with an R-value of 0.9572.
1172 Ultrasound in Medicine and Biology Volume 26, Number 7, 2000
bioeffects. The largest observed bubble-cell spacing thatgave results significantly higher (p , 0.05, one-sidedt-test) than the background (“infinite” spacing) was 39.7mm.
Referring to the discussion of Fig. 3, there may beanother interpretation of the lethal sonoporation data. Itwas proposed that there exist in this data three regimensof bubble spacing that produced similar percentages oflethal sonoporation independent of the initial cell con-centration. Briefly, the first regimen included bubblespacing from about 39mm to 65mm, the second from 24mm to 35mm, and the third from about 18mm to 23mm.The data included in each of these regimens were deter-mined to lack statistically significant differences usingone way analysis of variance (p 5 0.188;p 5 0.085;p 50.960, respectively). Also, the data in the second stepwas found to be significantly higher than the data in thefirst step (p , 0.001, one-sidedt-test), and the data in thethird step was found to be significantly higher than thedata in the second step (p , 0.001, Mann–Whitney ranksum test). All statistical tests were carried out on a PCwith SigmaStat software (SPSSt, Inc., Chicago, IL).This separation into regimens may be somewhat artificialand, with the limited data presented, evidence to supportthe claim is not strong statistically. However, as dis-cussed later, this interpretation may have important im-plications when modeling cavitation-related bioeffects.Further research and more data are certainly needed.
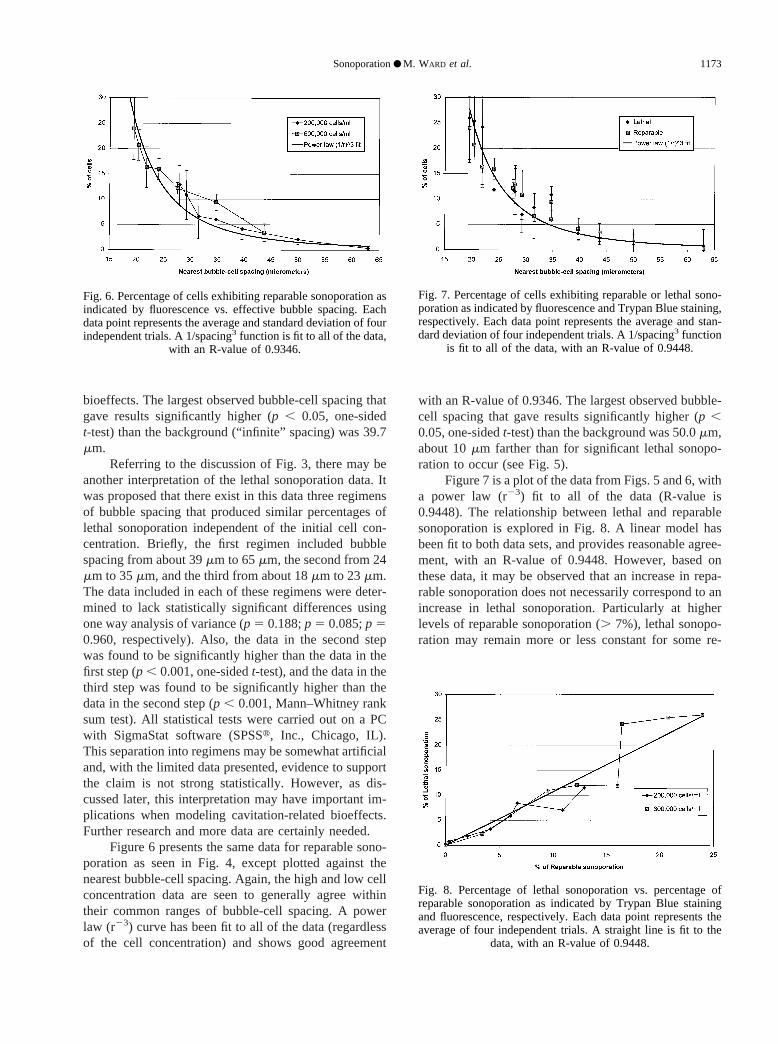
Figure 6 presents the same data for reparable sono-poration as seen in Fig. 4, except plotted against thenearest bubble-cell spacing. Again, the high and low cellconcentration data are seen to generally agree withintheir common ranges of bubble-cell spacing. A powerlaw (r23) curve has been fit to all of the data (regardlessof the cell concentration) and shows good agreement
with an R-value of 0.9346. The largest observed bubble-cell spacing that gave results significantly higher (p ,0.05, one-sidedt-test) than the background was 50.0mm,about 10mm farther than for significant lethal sonopo-ration to occur (see Fig. 5).
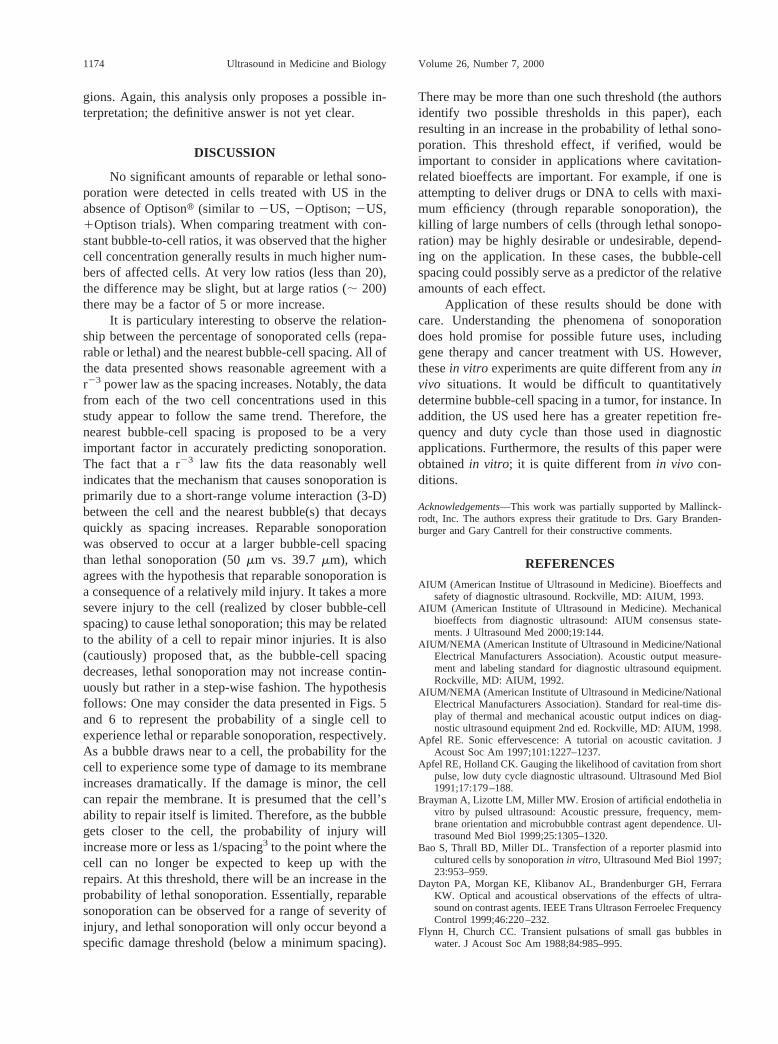
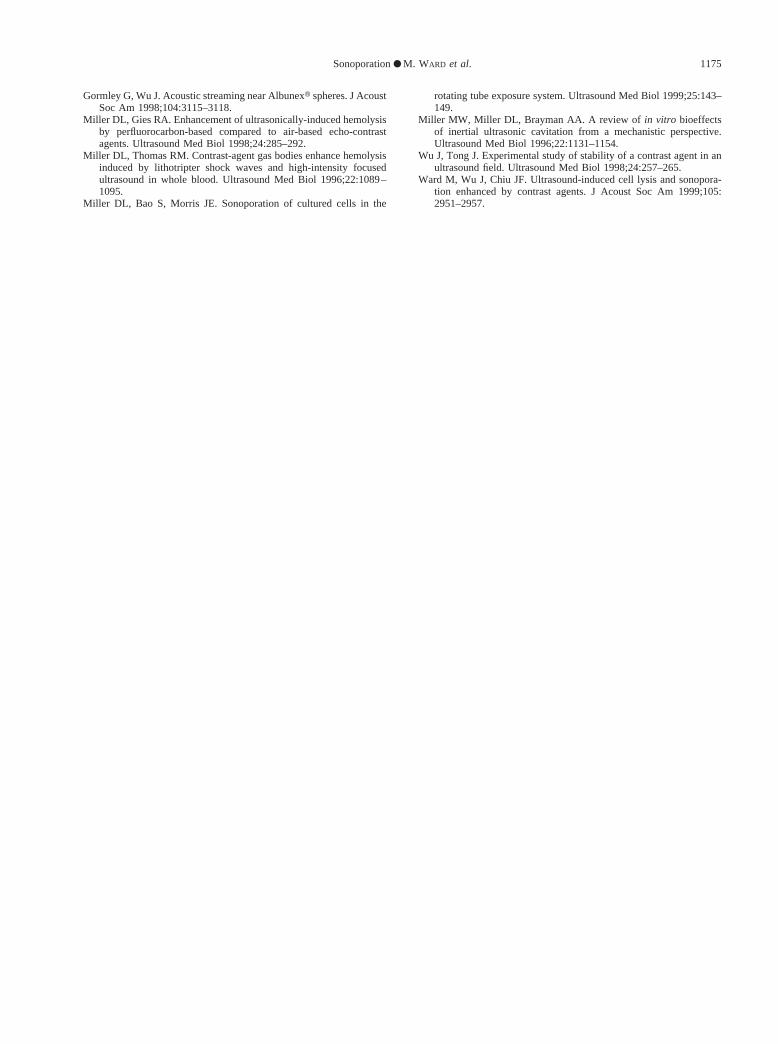
Figure 7 is a plot of the data from Figs. 5 and 6, witha power law (r23) fit to all of the data (R-value is0.9448). The relationship between lethal and reparablesonoporation is explored in Fig. 8. A linear model hasbeen fit to both data sets, and provides reasonable agree-ment, with an R-value of 0.9448. However, based onthese data, it may be observed that an increase in repa-rable sonoporation does not necessarily correspond to anincrease in lethal sonoporation. Particularly at higherlevels of reparable sonoporation (. 7%), lethal sonopo-ration may remain more or less constant for some re-
Fig. 6. Percentage of cells exhibiting reparable sonoporation asindicated by fluorescence vs. effective bubble spacing. Eachdata point represents the average and standard deviation of fourindependent trials. A 1/spacing3 function is fit to all of the data,
with an R-value of 0.9346.
Fig. 7. Percentage of cells exhibiting reparable or lethal sono-poration as indicated by fluorescence and Trypan Blue staining,respectively. Each data point represents the average and stan-dard deviation of four independent trials. A 1/spacing3 function
is fit to all of the data, with an R-value of 0.9448.
Fig. 8. Percentage of lethal sonoporation vs. percentage ofreparable sonoporation as indicated by Trypan Blue stainingand fluorescence, respectively. Each data point represents theaverage of four independent trials. A straight line is fit to the
data, with an R-value of 0.9448.
Sonoporation● M. WARD et al. 1173
gions. Again, this analysis only proposes a possible in-terpretation; the definitive answer is not yet clear.
DISCUSSION
No significant amounts of reparable or lethal sono-poration were detected in cells treated with US in theabsence of Optisont (similar to 2US, 2Optison;2US,1Optison trials). When comparing treatment with con-stant bubble-to-cell ratios, it was observed that the highercell concentration generally results in much higher num-bers of affected cells. At very low ratios (less than 20),the difference may be slight, but at large ratios (; 200)there may be a factor of 5 or more increase.
It is particulary interesting to observe the relation-ship between the percentage of sonoporated cells (repa-rable or lethal) and the nearest bubble-cell spacing. All ofthe data presented shows reasonable agreement with ar23 power law as the spacing increases. Notably, the datafrom each of the two cell concentrations used in thisstudy appear to follow the same trend. Therefore, thenearest bubble-cell spacing is proposed to be a veryimportant factor in accurately predicting sonoporation.The fact that a r23 law fits the data reasonably wellindicates that the mechanism that causes sonoporation isprimarily due to a short-range volume interaction (3-D)between the cell and the nearest bubble(s) that decaysquickly as spacing increases. Reparable sonoporationwas observed to occur at a larger bubble-cell spacingthan lethal sonoporation (50mm vs. 39.7mm), whichagrees with the hypothesis that reparable sonoporation isa consequence of a relatively mild injury. It takes a moresevere injury to the cell (realized by closer bubble-cellspacing) to cause lethal sonoporation; this may be relatedto the ability of a cell to repair minor injuries. It is also(cautiously) proposed that, as the bubble-cell spacingdecreases, lethal sonoporation may not increase contin-uously but rather in a step-wise fashion. The hypothesisfollows: One may consider the data presented in Figs. 5and 6 to represent the probability of a single cell toexperience lethal or reparable sonoporation, respectively.As a bubble draws near to a cell, the probability for thecell to experience some type of damage to its membraneincreases dramatically. If the damage is minor, the cellcan repair the membrane. It is presumed that the cell’sability to repair itself is limited. Therefore, as the bubblegets closer to the cell, the probability of injury willincrease more or less as 1/spacing3 to the point where thecell can no longer be expected to keep up with therepairs. At this threshold, there will be an increase in theprobability of lethal sonoporation. Essentially, reparablesonoporation can be observed for a range of severity ofinjury, and lethal sonoporation will only occur beyond aspecific damage threshold (below a minimum spacing).
There may be more than one such threshold (the authorsidentify two possible thresholds in this paper), eachresulting in an increase in the probability of lethal sono-poration. This threshold effect, if verified, would beimportant to consider in applications where cavitation-related bioeffects are important. For example, if one isattempting to deliver drugs or DNA to cells with maxi-mum efficiency (through reparable sonoporation), thekilling of large numbers of cells (through lethal sonopo-ration) may be highly desirable or undesirable, depend-ing on the application. In these cases, the bubble-cellspacing could possibly serve as a predictor of the relativeamounts of each effect.
Application of these results should be done withcare. Understanding the phenomena of sonoporationdoes hold promise for possible future uses, includinggene therapy and cancer treatment with US. However,thesein vitro experiments are quite different from anyinvivo situations. It would be difficult to quantitativelydetermine bubble-cell spacing in a tumor, for instance. Inaddition, the US used here has a greater repetition fre-quency and duty cycle than those used in diagnosticapplications. Furthermore, the results of this paper wereobtainedin vitro; it is quite different fromin vivo con-ditions.
Acknowledgements—This work was partially supported by Mallinck-rodt, Inc. The authors express their gratitude to Drs. Gary Branden-burger and Gary Cantrell for their constructive comments.
REFERENCES
AIUM (American Institue of Ultrasound in Medicine). Bioeffects andsafety of diagnostic ultrasound. Rockville, MD: AIUM, 1993.
AIUM (American Institute of Ultrasound in Medicine). Mechanicalbioeffects from diagnostic ultrasound: AIUM consensus state-ments. J Ultrasound Med 2000;19:144.
AIUM/NEMA (American Institute of Ultrasound in Medicine/NationalElectrical Manufacturers Association). Acoustic output measure-ment and labeling standard for diagnostic ultrasound equipment.Rockville, MD: AIUM, 1992.
AIUM/NEMA (American Institute of Ultrasound in Medicine/NationalElectrical Manufacturers Association). Standard for real-time dis-play of thermal and mechanical acoustic output indices on diag-nostic ultrasound equipment 2nd ed. Rockville, MD: AIUM, 1998.
Apfel RE. Sonic effervescence: A tutorial on acoustic cavitation. JAcoust Soc Am 1997;101:1227–1237.
Apfel RE, Holland CK. Gauging the likelihood of cavitation from shortpulse, low duty cycle diagnostic ultrasound. Ultrasound Med Biol1991;17:179–188.
Brayman A, Lizotte LM, Miller MW. Erosion of artificial endothelia invitro by pulsed ultrasound: Acoustic pressure, frequency, mem-brane orientation and microbubble contrast agent dependence. Ul-trasound Med Biol 1999;25:1305–1320.
Bao S, Thrall BD, Miller DL. Transfection of a reporter plasmid intocultured cells by sonoporationin vitro, Ultrasound Med Biol 1997;23:953–959.
Dayton PA, Morgan KE, Klibanov AL, Brandenburger GH, FerraraKW. Optical and acoustical observations of the effects of ultra-sound on contrast agents. IEEE Trans Ultrason Ferroelec FrequencyControl 1999;46:220–232.
Flynn H, Church CC. Transient pulsations of small gas bubbles inwater. J Acoust Soc Am 1988;84:985–995.
1174 Ultrasound in Medicine and Biology Volume 26, Number 7, 2000
Gormley G, Wu J. Acoustic streaming near Albunext spheres. J AcoustSoc Am 1998;104:3115–3118.
Miller DL, Gies RA. Enhancement of ultrasonically-induced hemolysisby perfluorocarbon-based compared to air-based echo-contrastagents. Ultrasound Med Biol 1998;24:285–292.
Miller DL, Thomas RM. Contrast-agent gas bodies enhance hemolysisinduced by lithotripter shock waves and high-intensity focusedultrasound in whole blood. Ultrasound Med Biol 1996;22:1089–1095.
Miller DL, Bao S, Morris JE. Sonoporation of cultured cells in the
rotating tube exposure system. Ultrasound Med Biol 1999;25:143–149.
Miller MW, Miller DL, Brayman AA. A review of in vitro bioeffectsof inertial ultrasonic cavitation from a mechanistic perspective.Ultrasound Med Biol 1996;22:1131–1154.
Wu J, Tong J. Experimental study of stability of a contrast agent in anultrasound field. Ultrasound Med Biol 1998;24:257–265.
Ward M, Wu J, Chiu JF. Ultrasound-induced cell lysis and sonopora-tion enhanced by contrast agents. J Acoust Soc Am 1999;105:2951–2957.
Sonoporation● M. WARD et al. 1175