Embed Size (px)
Citation preview
Experimental study of current loss and plasma formationin the Z machine post-hole convolute
M. R. Gomez,1,* R. M. Gilgenbach,2 M. E. Cuneo,1 C. A. Jennings,1 R. D. McBride,2,†
E. M. Waisman,1 B. T. Hutsel,1 W. A. Stygar,1 D. V. Rose,3 and Y. Maron41Sandia National Laboratories, Albuquerque, New Mexico 87185, USA
2Nuclear Engineering and Radiological Sciences Department,University of Michigan, Ann Arbor, Michigan 48109, USA
3Voss Scientific, LLC, Albuquerque, New Mexico 87108, USA4Department of Physics, Weizmann Institute of Science, Rehovot 76100, Israel
(Received 23 August 2016; published 24 January 2017)
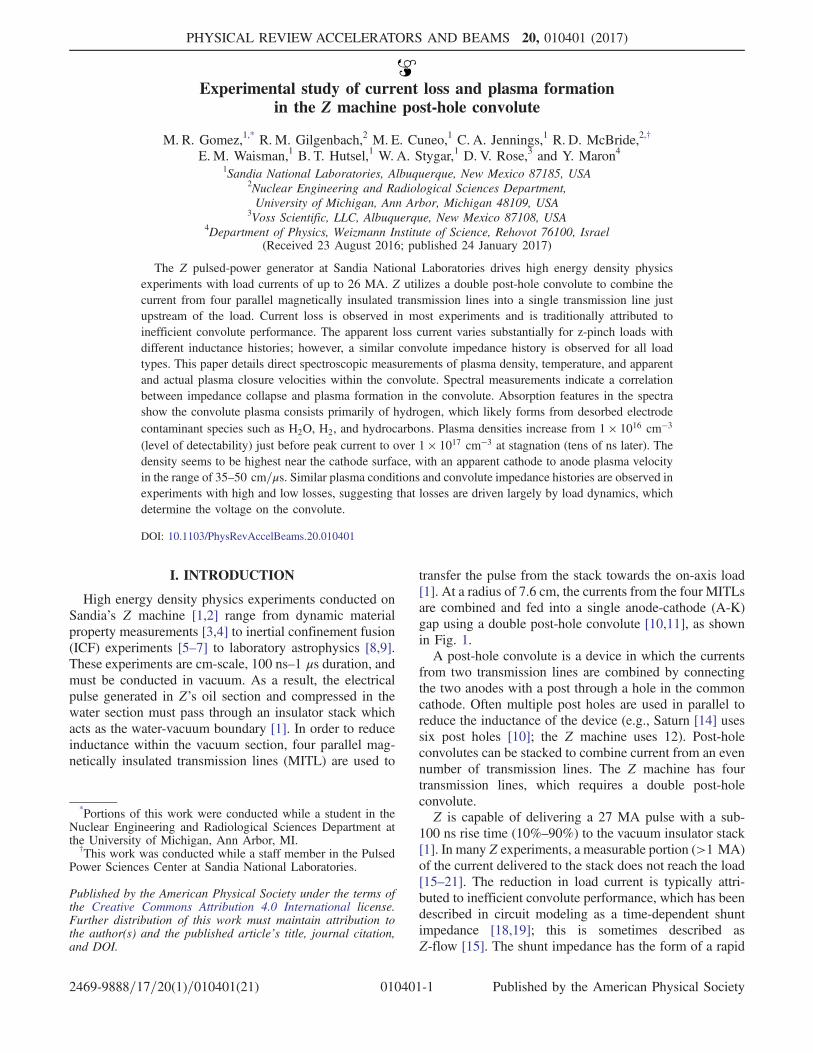
The Z pulsed-power generator at Sandia National Laboratories drives high energy density physicsexperiments with load currents of up to 26 MA. Z utilizes a double post-hole convolute to combine thecurrent from four parallel magnetically insulated transmission lines into a single transmission line justupstream of the load. Current loss is observed in most experiments and is traditionally attributed toinefficient convolute performance. The apparent loss current varies substantially for z-pinch loads withdifferent inductance histories; however, a similar convolute impedance history is observed for all loadtypes. This paper details direct spectroscopic measurements of plasma density, temperature, and apparentand actual plasma closure velocities within the convolute. Spectral measurements indicate a correlationbetween impedance collapse and plasma formation in the convolute. Absorption features in the spectrashow the convolute plasma consists primarily of hydrogen, which likely forms from desorbed electrodecontaminant species such as H2O, H2, and hydrocarbons. Plasma densities increase from 1 × 1016 cm−3(level of detectability) just before peak current to over 1 × 1017 cm−3 at stagnation (tens of ns later). Thedensity seems to be highest near the cathode surface, with an apparent cathode to anode plasma velocityin the range of 35–50 cm=μs. Similar plasma conditions and convolute impedance histories are observed inexperiments with high and low losses, suggesting that losses are driven largely by load dynamics, whichdetermine the voltage on the convolute.
DOI: 10.1103/PhysRevAccelBeams.20.010401
I. INTRODUCTION
High energy density physics experiments conducted onSandia’s Z machine [1,2] range from dynamic materialproperty measurements [3,4] to inertial confinement fusion(ICF) experiments [5–7] to laboratory astrophysics [8,9].These experiments are cm-scale, 100 ns–1 μs duration, andmust be conducted in vacuum. As a result, the electricalpulse generated in Z’s oil section and compressed in thewater section must pass through an insulator stack whichacts as the water-vacuum boundary [1]. In order to reduceinductance within the vacuum section, four parallel mag-netically insulated transmission lines (MITL) are used to
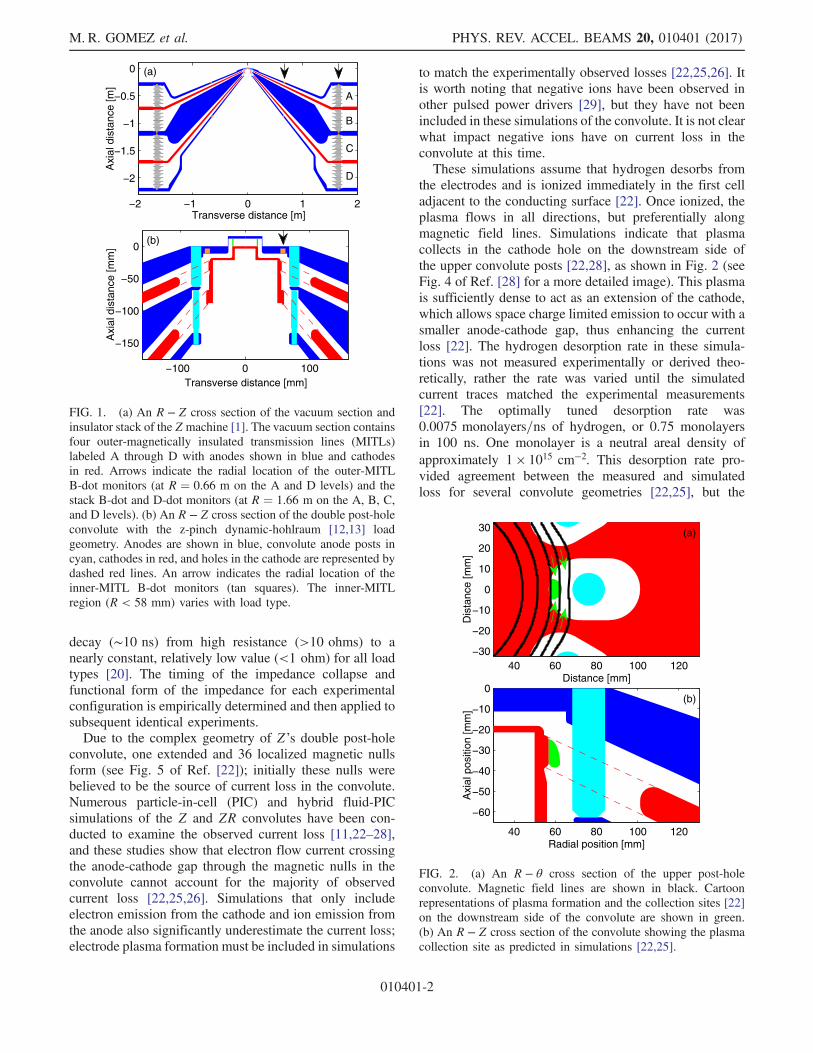
transfer the pulse from the stack towards the on-axis load[1]. At a radius of 7.6 cm, the currents from the four MITLsare combined and fed into a single anode-cathode (A-K)gap using a double post-hole convolute [10,11], as shownin Fig. 1.A post-hole convolute is a device in which the currents
from two transmission lines are combined by connectingthe two anodes with a post through a hole in the commoncathode. Often multiple post holes are used in parallel toreduce the inductance of the device (e.g., Saturn [14] usessix post holes [10]; the Z machine uses 12). Post-holeconvolutes can be stacked to combine current from an evennumber of transmission lines. The Z machine has fourtransmission lines, which requires a double post-holeconvolute.Z is capable of delivering a 27 MA pulse with a sub-
100 ns rise time (10%–90%) to the vacuum insulator stack[1]. In many Z experiments, a measurable portion (>1 MA)of the current delivered to the stack does not reach the load[15–21]. The reduction in load current is typically attri-buted to inefficient convolute performance, which has beendescribed in circuit modeling as a time-dependent shuntimpedance [18,19]; this is sometimes described asZ-flow [15]. The shunt impedance has the form of a rapid
*Portions of this work were conducted while a student in theNuclear Engineering and Radiological Sciences Department atthe University of Michigan, Ann Arbor, MI.
†This work was conducted while a staff member in the PulsedPower Sciences Center at Sandia National Laboratories.
Published by the American Physical Society under the terms ofthe Creative Commons Attribution 4.0 International license.Further distribution of this work must maintain attribution tothe author(s) and the published article’s title, journal citation,and DOI.
PHYSICAL REVIEW ACCELERATORS AND BEAMS 20, 010401 (2017)
2469-9888=17=20(1)=010401(21) 010401-1 Published by the American Physical Society
decay (∼10 ns) from high resistance (>10 ohms) to anearly constant, relatively low value (<1 ohm) for all loadtypes [20]. The timing of the impedance collapse andfunctional form of the impedance for each experimentalconfiguration is empirically determined and then applied tosubsequent identical experiments.Due to the complex geometry of Z’s double post-hole
convolute, one extended and 36 localized magnetic nullsform (see Fig. 5 of Ref. [22]); initially these nulls werebelieved to be the source of current loss in the convolute.Numerous particle-in-cell (PIC) and hybrid fluid-PICsimulations of the Z and ZR convolutes have been con-ducted to examine the observed current loss [11,22–28],and these studies show that electron flow current crossingthe anode-cathode gap through the magnetic nulls in theconvolute cannot account for the majority of observedcurrent loss [22,25,26]. Simulations that only includeelectron emission from the cathode and ion emission fromthe anode also significantly underestimate the current loss;electrode plasma formation must be included in simulations
to match the experimentally observed losses [22,25,26]. Itis worth noting that negative ions have been observed inother pulsed power drivers [29], but they have not beenincluded in these simulations of the convolute. It is not clearwhat impact negative ions have on current loss in theconvolute at this time.These simulations assume that hydrogen desorbs from
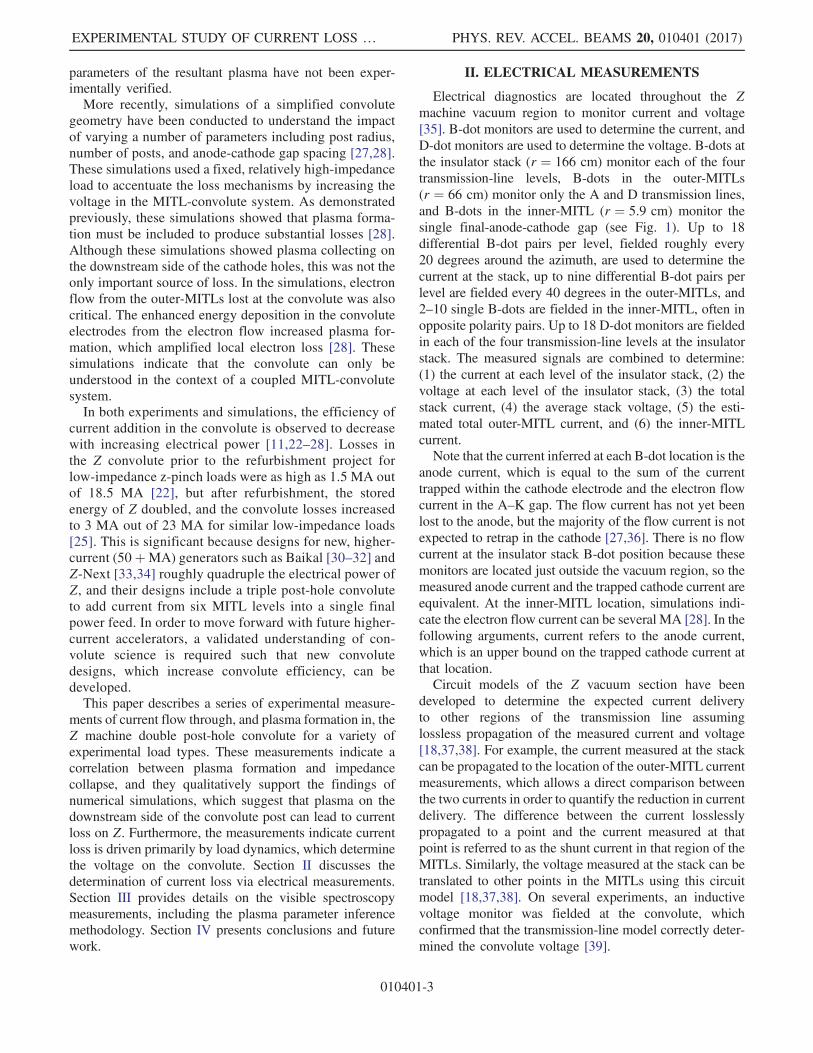
the electrodes and is ionized immediately in the first celladjacent to the conducting surface [22]. Once ionized, theplasma flows in all directions, but preferentially alongmagnetic field lines. Simulations indicate that plasmacollects in the cathode hole on the downstream side ofthe upper convolute posts [22,28], as shown in Fig. 2 (seeFig. 4 of Ref. [28] for a more detailed image). This plasmais sufficiently dense to act as an extension of the cathode,which allows space charge limited emission to occur with asmaller anode-cathode gap, thus enhancing the currentloss [22]. The hydrogen desorption rate in these simula-tions was not measured experimentally or derived theo-retically, rather the rate was varied until the simulatedcurrent traces matched the experimental measurements[22]. The optimally tuned desorption rate was0.0075 monolayers=ns of hydrogen, or 0.75 monolayersin 100 ns. One monolayer is a neutral areal density ofapproximately 1 × 1015 cm−2. This desorption rate pro-vided agreement between the measured and simulatedloss for several convolute geometries [22,25], but the
−2 −1 0 1 2
−2
−1.5
−1
−0.5
0
Axi
al d
ista
nce
[m]
Transverse distance [m]
A
B
C
D
(a)
−100 0 100
−150
−100
−50
0
Axi
al d
ista
nce
[mm
]
Transverse distance [mm]
(b)
FIG. 1. (a) An R − Z cross section of the vacuum section andinsulator stack of the Zmachine [1]. The vacuum section containsfour outer-magnetically insulated transmission lines (MITLs)labeled A through D with anodes shown in blue and cathodesin red. Arrows indicate the radial location of the outer-MITLB-dot monitors (at R ¼ 0.66 m on the A and D levels) and thestack B-dot and D-dot monitors (at R ¼ 1.66 m on the A, B, C,and D levels). (b) An R − Z cross section of the double post-holeconvolute with the z-pinch dynamic-hohlraum [12,13] loadgeometry. Anodes are shown in blue, convolute anode posts incyan, cathodes in red, and holes in the cathode are represented bydashed red lines. An arrow indicates the radial location of theinner-MITL B-dot monitors (tan squares). The inner-MITLregion (R < 58 mm) varies with load type.
40 60 80 100 120−30
−20
−10
0
10
20
30
Dis
tanc
e [m
m]
Distance [mm]
(a)
40 60 80 100 120
−60
−50
−40
−30
−20
−10
0
Axi
al p
ositi
on [m
m]
Radial position [mm]
(b)
FIG. 2. (a) An R − θ cross section of the upper post-holeconvolute. Magnetic field lines are shown in black. Cartoonrepresentations of plasma formation and the collection sites [22]on the downstream side of the convolute are shown in green.(b) An R − Z cross section of the convolute showing the plasmacollection site as predicted in simulations [22,25].
M. R. GOMEZ et al. PHYS. REV. ACCEL. BEAMS 20, 010401 (2017)
010401-2
parameters of the resultant plasma have not been exper-imentally verified.More recently, simulations of a simplified convolute
geometry have been conducted to understand the impactof varying a number of parameters including post radius,number of posts, and anode-cathode gap spacing [27,28].These simulations used a fixed, relatively high-impedanceload to accentuate the loss mechanisms by increasing thevoltage in the MITL-convolute system. As demonstratedpreviously, these simulations showed that plasma forma-tion must be included to produce substantial losses [28].Although these simulations showed plasma collecting onthe downstream side of the cathode holes, this was not theonly important source of loss. In the simulations, electronflow from the outer-MITLs lost at the convolute was alsocritical. The enhanced energy deposition in the convoluteelectrodes from the electron flow increased plasma for-mation, which amplified local electron loss [28]. Thesesimulations indicate that the convolute can only beunderstood in the context of a coupled MITL-convolutesystem.In both experiments and simulations, the efficiency of
current addition in the convolute is observed to decreasewith increasing electrical power [11,22–28]. Losses inthe Z convolute prior to the refurbishment project forlow-impedance z-pinch loads were as high as 1.5 MA outof 18.5 MA [22], but after refurbishment, the storedenergy of Z doubled, and the convolute losses increasedto 3 MA out of 23 MA for similar low-impedance loads[25]. This is significant because designs for new, higher-current (50þMA) generators such as Baikal [30–32] andZ-Next [33,34] roughly quadruple the electrical power ofZ, and their designs include a triple post-hole convoluteto add current from six MITL levels into a single finalpower feed. In order to move forward with future higher-current accelerators, a validated understanding of con-volute science is required such that new convolutedesigns, which increase convolute efficiency, can bedeveloped.This paper describes a series of experimental measure-
ments of current flow through, and plasma formation in, theZ machine double post-hole convolute for a variety ofexperimental load types. These measurements indicate acorrelation between plasma formation and impedancecollapse, and they qualitatively support the findings ofnumerical simulations, which suggest that plasma on thedownstream side of the convolute post can lead to currentloss on Z. Furthermore, the measurements indicate currentloss is driven primarily by load dynamics, which determinethe voltage on the convolute. Section II discusses thedetermination of current loss via electrical measurements.Section III provides details on the visible spectroscopymeasurements, including the plasma parameter inferencemethodology. Section IV presents conclusions and futurework.
II. ELECTRICAL MEASUREMENTS
Electrical diagnostics are located throughout the Zmachine vacuum region to monitor current and voltage[35]. B-dot monitors are used to determine the current, andD-dot monitors are used to determine the voltage. B-dots atthe insulator stack (r ¼ 166 cm) monitor each of the fourtransmission-line levels, B-dots in the outer-MITLs(r ¼ 66 cm) monitor only the A and D transmission lines,and B-dots in the inner-MITL (r ¼ 5.9 cm) monitor thesingle final-anode-cathode gap (see Fig. 1). Up to 18differential B-dot pairs per level, fielded roughly every20 degrees around the azimuth, are used to determine thecurrent at the stack, up to nine differential B-dot pairs perlevel are fielded every 40 degrees in the outer-MITLs, and2–10 single B-dots are fielded in the inner-MITL, often inopposite polarity pairs. Up to 18 D-dot monitors are fieldedin each of the four transmission-line levels at the insulatorstack. The measured signals are combined to determine:(1) the current at each level of the insulator stack, (2) thevoltage at each level of the insulator stack, (3) the totalstack current, (4) the average stack voltage, (5) the esti-mated total outer-MITL current, and (6) the inner-MITLcurrent.Note that the current inferred at each B-dot location is the
anode current, which is equal to the sum of the currenttrapped within the cathode electrode and the electron flowcurrent in the A–K gap. The flow current has not yet beenlost to the anode, but the majority of the flow current is notexpected to retrap in the cathode [27,36]. There is no flowcurrent at the insulator stack B-dot position because thesemonitors are located just outside the vacuum region, so themeasured anode current and the trapped cathode current areequivalent. At the inner-MITL location, simulations indi-cate the electron flow current can be several MA [28]. In thefollowing arguments, current refers to the anode current,which is an upper bound on the trapped cathode current atthat location.Circuit models of the Z vacuum section have been
developed to determine the expected current deliveryto other regions of the transmission line assuminglossless propagation of the measured current and voltage[18,37,38]. For example, the current measured at the stackcan be propagated to the location of the outer-MITL currentmeasurements, which allows a direct comparison betweenthe two currents in order to quantify the reduction in currentdelivery. The difference between the current losslesslypropagated to a point and the current measured at thatpoint is referred to as the shunt current in that region of theMITLs. Similarly, the voltage measured at the stack can betranslated to other points in the MITLs using this circuitmodel [18,37,38]. On several experiments, an inductivevoltage monitor was fielded at the convolute, whichconfirmed that the transmission-line model correctly deter-mined the convolute voltage [39].
EXPERIMENTAL STUDY OF CURRENT LOSS … PHYS. REV. ACCEL. BEAMS 20, 010401 (2017)
010401-3
It is worth emphasizing that there is a difference betweenthe shunt current and the amount of current that would berecovered in a lossless system [20,27]. Because current lossprovides a low-impedance path in parallel with the loadimpedance, the total impedance of the system decreaseswith increasing loss. Thus for a given driving voltage pulse,more total current is delivered by the accelerator to theMITL-convolute-load system, even though less currentreaches the load. Simulations show that the current thatwould be recovered in a lossless system is generally abouthalf of the shunt current [20,27].The refurbished Z accelerator was designed to drive
z-pinch dynamic hohlraum (ZPDH) [12,13], and consis-tently more than 25 out of the 27 MA delivered to theinsulator stack reach the ZPDH load. The efficient con-volute performance in ZPDH experiments is attributed tothe relatively low initial load inductance and the moderateimplosion velocity, which equates to a low rate of change ofthe load inductance, dL=dt. The voltage applied to theconvolute can be approximated by
VðtÞ ¼ ½LloadðtÞ þ Linner�dIðtÞdt
þ IðtÞ dLloadðtÞdt
; ð1Þ
where Lload is the time-dependent load inductance, Linner isthe fixed inductance of the inner-MITL, and I is the time-dependent current. Assuming a perfectly conducting,coaxial, thin-shell representation for the load and returncurrent path, the load inductance is given by
LloadðtÞ ¼ 2h � ln½r0=rðtÞ�; ð2Þ
where Lload is the inductance in nH, h is the load height incm, r0 is the radius of the outer conductor (return current
path), and rðtÞ is the radius of the load. The time derivativeof the load inductance is given by
dLloadðtÞdt
¼ 0.002h � vðtÞrðtÞ ; ð3Þ
where dLload=dt is in units of nH=ns, h is the load height incm, vðtÞ is the radially inward velocity in km=s, and rðtÞ isthe load radius in mm.At early times, I and dLload=dt are small, and dI=dt is
large, so the first term of Eq. (1) dominates; near peakcurrent, dI=dt is small, and I and dLload=dt are large, so thesecond term dominates. Thus voltage is minimized in loadswith low initial inductance and low late-time implosionvelocity. While these guidelines are useful for ensuringefficient delivery of current to the load, they are often incontradiction with experimental requirements, so it isuseful to understand how the convolute performs undera variety of conditions. The initial inductance and approxi-mate peak dL=dt are compared to the peak convolutevoltage and shunt current for a variety of experiment typesin Table I.As has been observed previously [18,20,38], the shunt
current between the stack and the outer-MITL was negli-gible for all load types investigated. This is attributed to therelatively large AK gaps, which limited the impact ofcathode plasma formation and motion in the outer MITLs.Also, by design, there is no anode plasma formation in theouter MITLs [40].By contrast, large shunt currents were observed between
the outer- and inner-MITL B-dot locations for someexperiments. The convolute is located in between thesecurrent monitors, and the observed loss was attributed to it.The convolute shunt current ranged from approximately
TABLE I. A collection of the initial inner-MITL plus load inductance, approximate maximum implosion velocity, height of theimploding region, approximate peak rate of change of inductance, peak convolute voltage, and peak convolute shunt current for a varietyof load types. The different objectives of these experiments required the wide range of initial L and peak dL=dt, which impact convolutevoltage and shunt current. Initial inductance was calculated assuming a perfectly conducting, coaxial, thin-shell approximation for theload and return current cylinder. This assumption underestimated the initial inductance by around 0.2–0.3 nH in experiments withnonazimuthally continuous loads and/or return current cylinders (e.g., wire-array loads and slotted return current cylinders), which aremarked with a #. The values for dL=dt were calculated at rðtÞ ¼ 0.5 mm, which is a good approximation for the radius at the time ofpeak implosion velocity in these experiments. Shunt current values in parentheses assume the 0.956x scale factor on the inner-MITLcurrent described in Appendix A. Note that peak values for the convolute voltage and shunt current were not necessarily simultaneous.When marked with an *, the peak shunt current was estimated due to early B-dot failure, which was the result of an extremely high initialinductance. Traces from the experiments in bold are shown in Figs. 3–5.
Experiment description L0 [nH] vmax [km=s] h [cm] dL=dt [nH=ns] Vc [MV] Is [MA]
z2082#-70-mm SS wire array 1.8 1000 2 8.0 2.9 7.3 (8.3)z1992#-65-mm W wire array 2.7 800 2 6.4 2.4 3.8 (4.9)z2409#-Z-pinch dynamic hohlraum 2.7 300 1.2 1.4 1.7 1.8 (3.2)z2172 -Short-pulse liner 4.3 100 0.65 0.26 1.8 3.1 (4.0)z2713 -Long-pulse liner, extended feed 4.8 30 0.65 0.08 0.9 2.3 (3.4)z2110 -Shaped-pulse liner 4.9 50 0.65 0.13 1.7 2.4 (3.5)z2708#-Short-pulse liner, extended feed 7.0 70 1 0.28 2.6 9* (10*)
M. R. GOMEZ et al. PHYS. REV. ACCEL. BEAMS 20, 010401 (2017)
010401-4
1–2 MA (roughly the threshold of detection) in ZPDHexperiments (low L0, moderate dL=dt) up to 7–8 MA inexperiments with wire arrays designed to produce intenseK-shell x-ray emission [41] (low L0, high dL=dt).Substantial convolute shunt currents were also inferredon ICF experiments in which an extended inner-MITL wasrequired to accommodate applied-B-field coils [7,42] (highL0, low dL=dt) but due to failure of the inner-MITL B-dots,
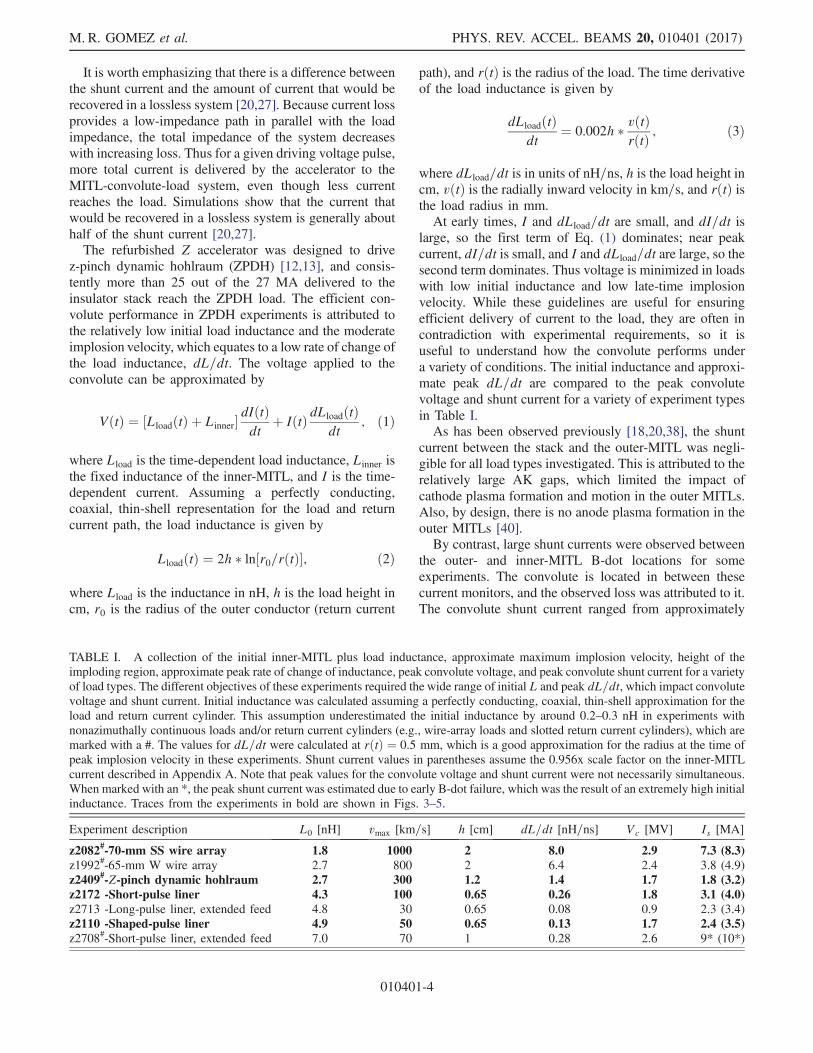
a detailed analysis of the signals could not be performed.As noted above, the maximum recoverable drive current isabout half the observed shunt current, even with losslessconvolute performance.Plots of the currents for the experiments listed in bold in
Table I are shown in Fig. 3. In order to directly compare thevarious experiments, the traces were time shifted such thatt ¼ 0 ns occurred at the time that the convolute shunt
0
10
20
30
Cur
rent
[MA
]
(a) SS array
Prop. StackInner MITLConv. Shunt
0
10
20
30
Cur
rent
[MA
]
(b) ZPDH
Prop. StackInner MITLConv. Shunt
−200 −150 −100 −50 0 500
10
20
30
Time [ns]
Cur
rent
[MA
]
(c) Short−pulse liner
Prop. StackInner MITLConv. Shunt
−200 −150 −100 −50 0 500
10
20
30
Cur
rent
[MA
]
Time [ns]
(d) Shaped−pulse liner
Prop. StackInner MITLConv. Shunt
FIG. 3. (a)–(d) Plots of the losslessly propagated stack current (black), the inner-MITL current (cyan), and the difference between thetwo (red), called the convolute shunt current, for the four bolded load types from Table I. A dot at the end of each trace represents thetime of stagnation. The time at which the convolute shunt impedance drops below 2 ohms is defined as t ¼ 0 ns. Dashed lines indicatethe uncertainty in each measurement [35].
0
2
4
6
Vol
tage
[MV
]
(a) SS array
StackConvolute
0
2
4
6
Vol
tage
[MV
]
(b) ZPDH
StackConvolute
−200 −150 −100 −50 0 500
2
4
6
Vol
tage
[MV
]
Time [ns]
(c) Short−pulse liner
StackConvolute
−200 −150 −100 −50 0 500
2
4
6
Vol
tage
[MV
]
Time [ns]
(d) Shaped−pulse liner
StackConvolute
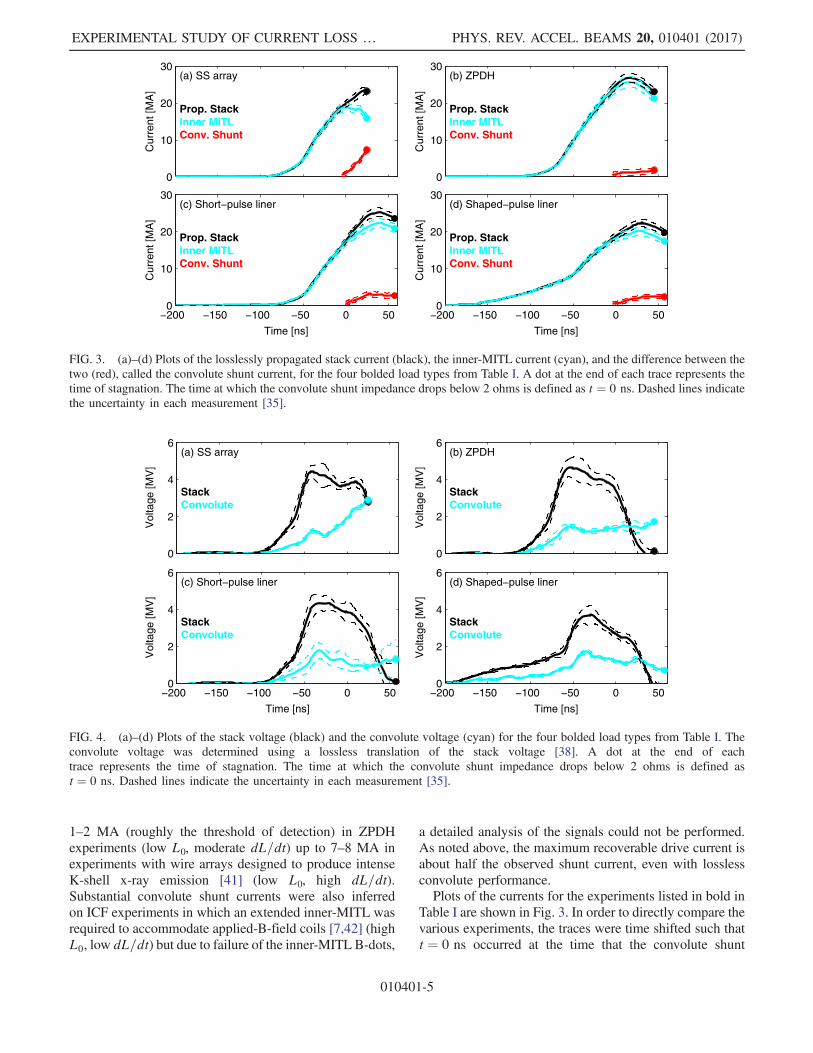
FIG. 4. (a)–(d) Plots of the stack voltage (black) and the convolute voltage (cyan) for the four bolded load types from Table I. Theconvolute voltage was determined using a lossless translation of the stack voltage [38]. A dot at the end of eachtrace represents the time of stagnation. The time at which the convolute shunt impedance drops below 2 ohms is defined ast ¼ 0 ns. Dashed lines indicate the uncertainty in each measurement [35].
EXPERIMENTAL STUDY OF CURRENT LOSS … PHYS. REV. ACCEL. BEAMS 20, 010401 (2017)
010401-5
impedance (details below) was equal to 2 ohms. Therelative time shift between two experiments was typicallyless than 10 ns, but in some experiments with a nonstandardcurrent pulse shape it exceeded 20 ns.The uncertainty in the shunt current is a combination
of the random uncertainties in the measured stack andinner-MITL currents and the systematic uncertainty in theB-dot measurements [35]. Typical uncertainties in thepeak stack and inner-MITL currents are just over 1 MA(about 5%).Plots of the stack and convolute voltages for the same set
of bolded experiments from Table I are shown in Fig. 4.The uncertainty in these measurements is given as thestandard deviation of the average voltage of the fourtransmission lines [18] combined in quadrature with thesystematic uncertainty of the D-dot measurements [35].For short-pulse experiments, a local maximum was
observed in the convolute voltage approximately 70 nsafter the start of the signal; the local peak value wasprimarily determined by the initial inductance of the loadand the charge voltage of the Marx banks. In low-initial-inductance loads, this value was as low as 1 MV and inhigh-initial-inductance loads it could approach 3 MV.In rapidly imploding loads (>500 km=s) the convolutevoltage continued to rise after the initial peak, andapproached 3 MV at stagnation. The voltage remainedrelatively constant at approximately 1.5 MV in moderate-implosion-velocity (300 km=s) experiments such as theZPDH. In some slower implosion loads (<100 km=s) thevoltage decreased following the initial spike. Experimentswith a shaped current pulse are also fielded on Z. Thevoltage in these experiments was applied for a much longerperiod (hundreds of ns), but it also was lower amplitude forthe majority of the pulse.The effective convolute shunt impedance was calculated
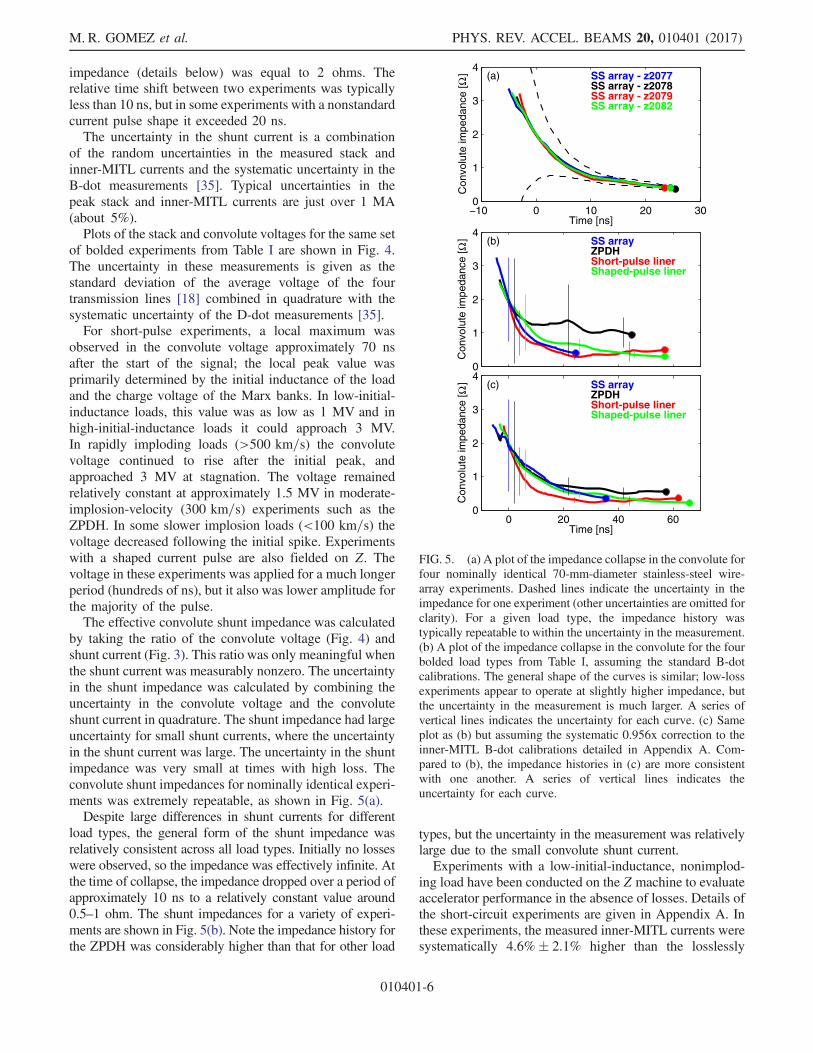
by taking the ratio of the convolute voltage (Fig. 4) andshunt current (Fig. 3). This ratio was only meaningful whenthe shunt current was measurably nonzero. The uncertaintyin the shunt impedance was calculated by combining theuncertainty in the convolute voltage and the convoluteshunt current in quadrature. The shunt impedance had largeuncertainty for small shunt currents, where the uncertaintyin the shunt current was large. The uncertainty in the shuntimpedance was very small at times with high loss. Theconvolute shunt impedances for nominally identical experi-ments was extremely repeatable, as shown in Fig. 5(a).Despite large differences in shunt currents for different
load types, the general form of the shunt impedance wasrelatively consistent across all load types. Initially no losseswere observed, so the impedance was effectively infinite. Atthe time of collapse, the impedance dropped over a period ofapproximately 10 ns to a relatively constant value around0.5–1 ohm. The shunt impedances for a variety of experi-ments are shown in Fig. 5(b). Note the impedance history forthe ZPDH was considerably higher than that for other load
types, but the uncertainty in the measurement was relativelylarge due to the small convolute shunt current.Experiments with a low-initial-inductance, nonimplod-
ing load have been conducted on the Z machine to evaluateaccelerator performance in the absence of losses. Details ofthe short-circuit experiments are given in Appendix A. Inthese experiments, the measured inner-MITL currents weresystematically 4.6%� 2.1% higher than the losslessly
−10 0 10 20 300
1
2
3
4
Con
volu
te im
peda
nce
[ ]Ω
Time [ns]
SS array - z2077SS array - z2078SS array - z2079SS array - z2082
(a)
0
1
2
3
4
Con
volu
te im
peda
nce
[ ] Ω SS array
ZPDHShort-pulse linerShaped-pulse liner
(b)
0 20 40 600
1
2
3
4
Con
volu
te im
peda
nce
[ ] Ω
Time [ns]
SS arrayZPDHShort-pulse linerShaped-pulse liner
(c)
FIG. 5. (a) A plot of the impedance collapse in the convolute forfour nominally identical 70-mm-diameter stainless-steel wire-array experiments. Dashed lines indicate the uncertainty in theimpedance for one experiment (other uncertainties are omitted forclarity). For a given load type, the impedance history wastypically repeatable to within the uncertainty in the measurement.(b) A plot of the impedance collapse in the convolute for the fourbolded load types from Table I, assuming the standard B-dotcalibrations. The general shape of the curves is similar; low-lossexperiments appear to operate at slightly higher impedance, butthe uncertainty in the measurement is much larger. A series ofvertical lines indicates the uncertainty for each curve. (c) Sameplot as (b) but assuming the systematic 0.956x correction to theinner-MITL B-dot calibrations detailed in Appendix A. Com-pared to (b), the impedance histories in (c) are more consistentwith one another. A series of vertical lines indicates theuncertainty for each curve.
M. R. GOMEZ et al. PHYS. REV. ACCEL. BEAMS 20, 010401 (2017)
010401-6
translated stack current, which is nonphysical. To correctthis, the inner-MITL currents could be decreased by 4.4%or the stack currents could be increased by 4.6%. Given thatthe environment in which the inner-MITL B-dots residedwas hostile (including MeV electrons and dense plasmas),the inner-MITL current measurements were less trusted, sothe inner-MITL current was lowered rather than raising thestack current. Note that changing either current produces
similar convolute impedances curves. The convolute shuntcurrents and impedances were recalculated with the inner-MITL current correction, and the impedances are plotted inFig. 5(c). The 4.4% change in current is within thepreviously stated uncertainty in the inner-MITL currentmeasurement. Because the shunt current in the ZPDHexperiments was only approximately 3% of the totalcurrent, the change to the inner-MITL current calibrationhad the largest impact on the ZPDH shunt impedance. Thisbrought the ZPDH impedance much closer to the imped-ances observed in the other three experiment types. Theconvolute impedance for these experiments is reasonablywell fit by
ZðtÞ ¼ 1.5e−0.082t þ 0.31; ð4Þ
where Z is the convolute shunt impedance in ohms and t isthe time in ns relative to the time when the impedance dropsbelow 2 ohms.While the shunt impedance was fairly consistent from
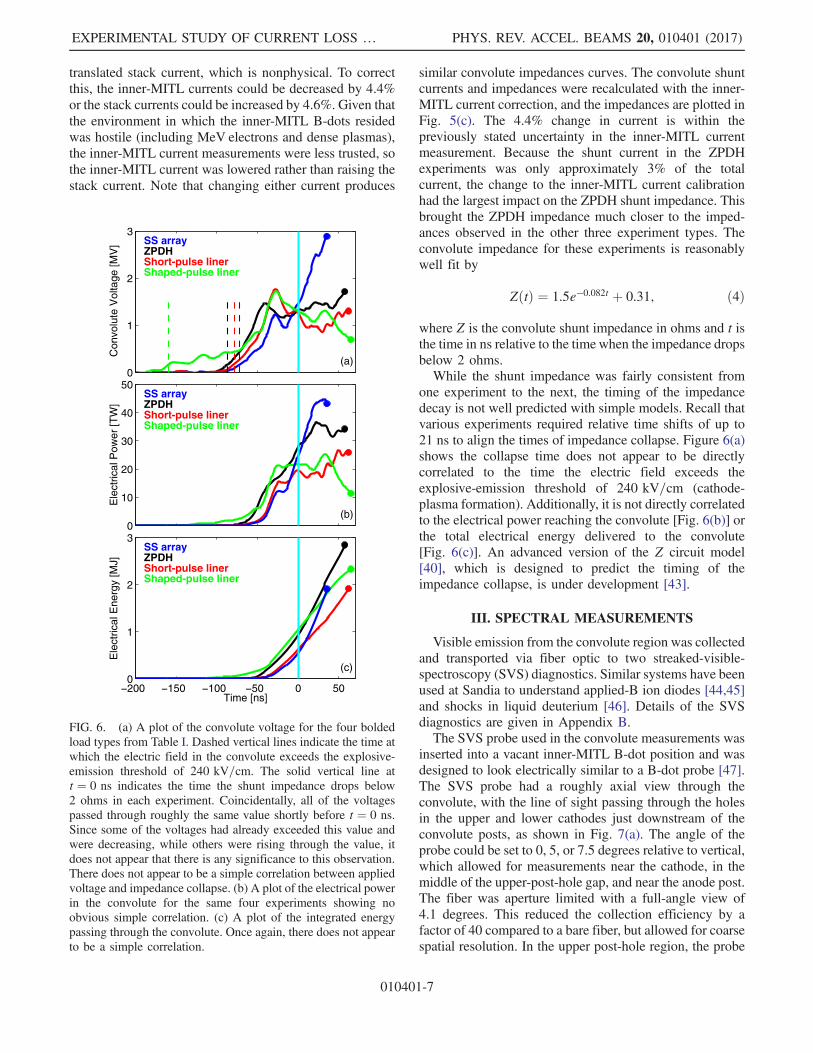
one experiment to the next, the timing of the impedancedecay is not well predicted with simple models. Recall thatvarious experiments required relative time shifts of up to21 ns to align the times of impedance collapse. Figure 6(a)shows the collapse time does not appear to be directlycorrelated to the time the electric field exceeds theexplosive-emission threshold of 240 kV=cm (cathode-plasma formation). Additionally, it is not directly correlatedto the electrical power reaching the convolute [Fig. 6(b)] orthe total electrical energy delivered to the convolute[Fig. 6(c)]. An advanced version of the Z circuit model[40], which is designed to predict the timing of theimpedance collapse, is under development [43].
III. SPECTRAL MEASUREMENTS
Visible emission from the convolute region was collectedand transported via fiber optic to two streaked-visible-spectroscopy (SVS) diagnostics. Similar systems have beenused at Sandia to understand applied-B ion diodes [44,45]and shocks in liquid deuterium [46]. Details of the SVSdiagnostics are given in Appendix B.The SVS probe used in the convolute measurements was
inserted into a vacant inner-MITL B-dot position and wasdesigned to look electrically similar to a B-dot probe [47].The SVS probe had a roughly axial view through theconvolute, with the line of sight passing through the holesin the upper and lower cathodes just downstream of theconvolute posts, as shown in Fig. 7(a). The angle of theprobe could be set to 0, 5, or 7.5 degrees relative to vertical,which allowed for measurements near the cathode, in themiddle of the upper-post-hole gap, and near the anode post.The fiber was aperture limited with a full-angle view of4.1 degrees. This reduced the collection efficiency by afactor of 40 compared to a bare fiber, but allowed for coarsespatial resolution. In the upper post-hole region, the probe
0
1
2
3
Con
volu
te V
olta
ge [M
V] SS array
ZPDHShort-pulse linerShaped-pulse liner
(a)
0
10
20
30
40
50
Ele
ctric
al P
ower
[TW
]
SS arrayZPDHShort-pulse linerShaped-pulse liner
(b)
−200 −150 −100 −50 0 500
1
2
3
Ele
ctric
al E
nerg
y [M
J]
Time [ns]
SS arrayZPDHShort-pulse linerShaped-pulse liner
(c)
FIG. 6. (a) A plot of the convolute voltage for the four boldedload types from Table I. Dashed vertical lines indicate the time atwhich the electric field in the convolute exceeds the explosive-emission threshold of 240 kV=cm. The solid vertical line att ¼ 0 ns indicates the time the shunt impedance drops below2 ohms in each experiment. Coincidentally, all of the voltagespassed through roughly the same value shortly before t ¼ 0 ns.Since some of the voltages had already exceeded this value andwere decreasing, while others were rising through the value, itdoes not appear that there is any significance to this observation.There does not appear to be a simple correlation between appliedvoltage and impedance collapse. (b) A plot of the electrical powerin the convolute for the same four experiments showing noobvious simple correlation. (c) A plot of the integrated energypassing through the convolute. Once again, there does not appearto be a simple correlation.
EXPERIMENTAL STUDY OF CURRENT LOSS … PHYS. REV. ACCEL. BEAMS 20, 010401 (2017)
010401-7
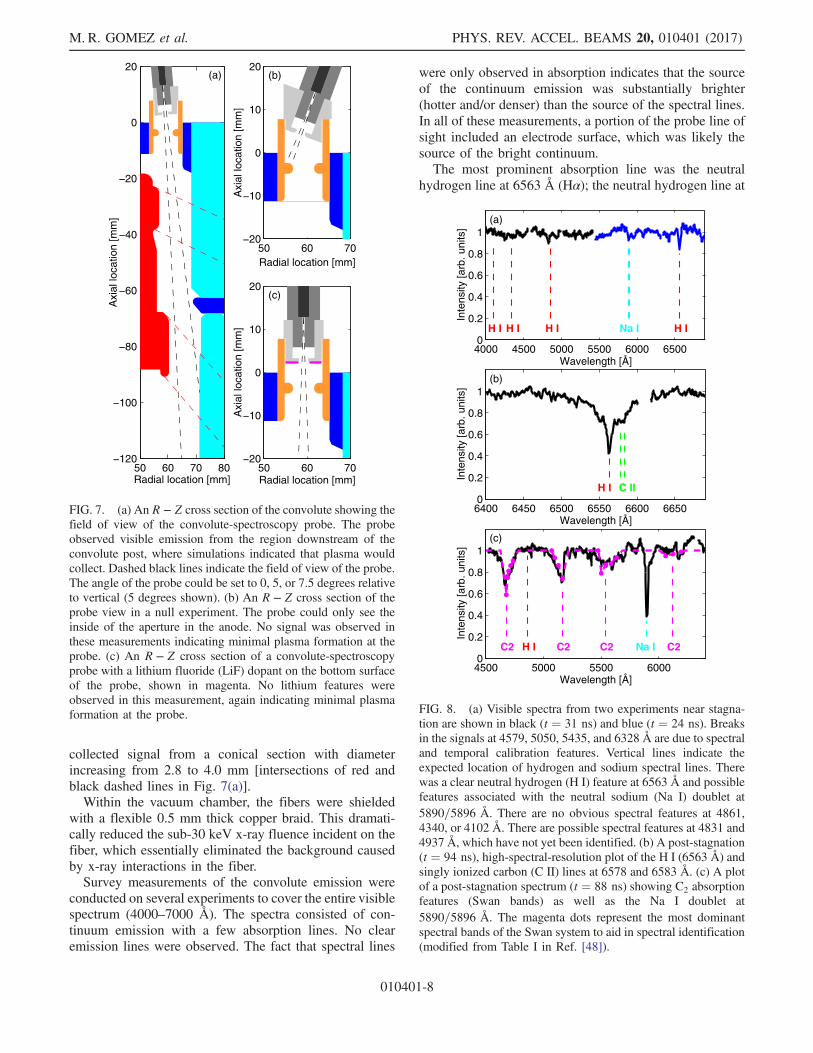
collected signal from a conical section with diameterincreasing from 2.8 to 4.0 mm [intersections of red andblack dashed lines in Fig. 7(a)].Within the vacuum chamber, the fibers were shielded
with a flexible 0.5 mm thick copper braid. This dramati-cally reduced the sub-30 keV x-ray fluence incident on thefiber, which essentially eliminated the background causedby x-ray interactions in the fiber.Survey measurements of the convolute emission were
conducted on several experiments to cover the entire visiblespectrum (4000–7000 Å). The spectra consisted of con-tinuum emission with a few absorption lines. No clearemission lines were observed. The fact that spectral lines
were only observed in absorption indicates that the sourceof the continuum emission was substantially brighter(hotter and/or denser) than the source of the spectral lines.In all of these measurements, a portion of the probe line ofsight included an electrode surface, which was likely thesource of the bright continuum.The most prominent absorption line was the neutral
hydrogen line at 6563 Å (Hα); the neutral hydrogen line at
50 60 70 80−120
−100
−80
−60
−40
−20
0
20
Axi
al lo
catio
n [m
m]
Radial location [mm]
(a)
50 60 70−20
−10
0
10
20
Axi
al lo
catio
n [m
m]
Radial location [mm]
(b)
50 60 70−20
−10
0
10
20
Axi
al lo
catio
n [m
m]
Radial location [mm]
(c)
FIG. 7. (a) An R − Z cross section of the convolute showing thefield of view of the convolute-spectroscopy probe. The probeobserved visible emission from the region downstream of theconvolute post, where simulations indicated that plasma wouldcollect. Dashed black lines indicate the field of view of the probe.The angle of the probe could be set to 0, 5, or 7.5 degrees relativeto vertical (5 degrees shown). (b) An R − Z cross section of theprobe view in a null experiment. The probe could only see theinside of the aperture in the anode. No signal was observed inthese measurements indicating minimal plasma formation at theprobe. (c) An R − Z cross section of a convolute-spectroscopyprobe with a lithium fluoride (LiF) dopant on the bottom surfaceof the probe, shown in magenta. No lithium features wereobserved in this measurement, again indicating minimal plasmaformation at the probe.
4000 4500 5000 5500 6000 65000
0.2
0.4
0.6
0.8
1
Wavelength [Å]
Inte
nsity
[arb
. uni
ts]
H IH IH IH I Na I
(a)
6400 6450 6500 6550 6600 66500
0.2
0.4
0.6
0.8
1
H I C II
Wavelength [Å]
Inte
nsity
[arb
. uni
ts]
(b)
4500 5000 5500 60000
0.2
0.4
0.6
0.8
1
H IC2 C2 C2 C2Na I
Wavelength [Å]
Inte
nsity
[arb
. uni
ts]
(c)
FIG. 8. (a) Visible spectra from two experiments near stagna-tion are shown in black (t ¼ 31 ns) and blue (t ¼ 24 ns). Breaksin the signals at 4579, 5050, 5435, and 6328 Å are due to spectraland temporal calibration features. Vertical lines indicate theexpected location of hydrogen and sodium spectral lines. Therewas a clear neutral hydrogen (H I) feature at 6563 Å and possiblefeatures associated with the neutral sodium (Na I) doublet at5890=5896 Å. There are no obvious spectral features at 4861,4340, or 4102 Å. There are possible spectral features at 4831 and4937 Å, which have not yet been identified. (b) A post-stagnation(t ¼ 94 ns), high-spectral-resolution plot of the H I (6563 Å) andsingly ionized carbon (C II) lines at 6578 and 6583 Å. (c) A plotof a post-stagnation spectrum (t ¼ 88 ns) showing C2 absorptionfeatures (Swan bands) as well as the Na I doublet at5890=5896 Å. The magenta dots represent the most dominantspectral bands of the Swan system to aid in spectral identification(modified from Table I in Ref. [48]).
M. R. GOMEZ et al. PHYS. REV. ACCEL. BEAMS 20, 010401 (2017)
010401-8
4861 Å (Hβ) was not clearly observed. Due to itsprominence, the Hα line was the focus of additionalhigh-spectral-resolution measurements. Other spectral fea-tures observed in absorption included the neutral sodium(Na I) doublet at 5890 and 5896 Å, singly ionized carbon(C II) lines at 6578 and 6583 Å, and, at late times, C2
molecular features [48] at roughly 4640–4760 Å, 5080–5180 Å and 5460–5700 Å. Example spectra are shown inFig. 8. These spectroscopic measurements were used todetermine the composition, location, density, temperature,apparent closure velocity, and radial velocity of the plasma.An underlying assumption in the following analysis is
that the neutral hydrogen absorption line is an indicator ofthe presence of dense plasma, which is partially ionized.The signature of neutral hydrogen is used to infer con-ditions of the bulk plasma. This assumption should be validfor the inferred temperatures (few eV) and densities(1 × 10¹⁶–1 × 1018 cm−3).
A. Composition and location
Due to the high electrical power density (∼TW=cm2) inthe convolute, plasma formation on the probe was aconcern [49]. A series of experiments were conducted toconfirm that the observed spectral features originated in theconvolute, as opposed to on the probe itself. Several nulltests were conducted in which the probe could only collectemission from within the B-dot recess in the anode, asshown in Fig. 7(b). No signal was observed in theseexperiments, which indicates that any plasma formationwithin the recess and/or on the probe itself did not producethe signals observed in other measurements with similarprobe designs.An additional null test with a lithium fluoride (LiF)
dopant, as depicted in Fig. 7(c), was conducted. Lithiumwas chosen because it was not observed in any previousspectra, so if observed, the source of the signal could beisolated. Additionally, there is a strong neutral lithium lineat 6708 Å, which has been observed previously in high-power diodes [44,45]. In this experiment, the bottom of theSVS probe was coated with 1 μm of LiF. The probe had afield of view similar to the one shown in Fig. 7(a). Therecorded spectrum consisted of continuum emission andthe Hα absorption line, but no lithium features wereobserved. This further demonstrated that there was notsignificant plasma formation on the probe.A measurement was conducted using a LiF dopant to
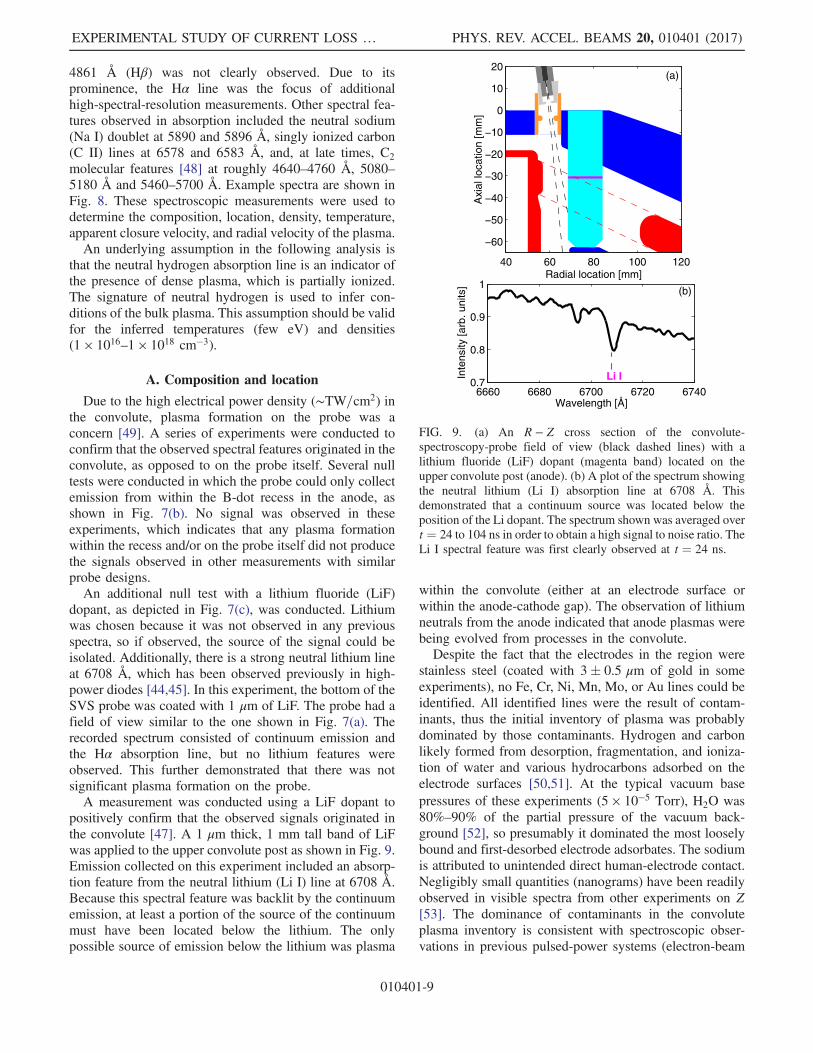
positively confirm that the observed signals originated inthe convolute [47]. A 1 μm thick, 1 mm tall band of LiFwas applied to the upper convolute post as shown in Fig. 9.Emission collected on this experiment included an absorp-tion feature from the neutral lithium (Li I) line at 6708 Å.Because this spectral feature was backlit by the continuumemission, at least a portion of the source of the continuummust have been located below the lithium. The onlypossible source of emission below the lithium was plasma
within the convolute (either at an electrode surface orwithin the anode-cathode gap). The observation of lithiumneutrals from the anode indicated that anode plasmas werebeing evolved from processes in the convolute.Despite the fact that the electrodes in the region were
stainless steel (coated with 3� 0.5 μm of gold in someexperiments), no Fe, Cr, Ni, Mn, Mo, or Au lines could beidentified. All identified lines were the result of contam-inants, thus the initial inventory of plasma was probablydominated by those contaminants. Hydrogen and carbonlikely formed from desorption, fragmentation, and ioniza-tion of water and various hydrocarbons adsorbed on theelectrode surfaces [50,51]. At the typical vacuum basepressures of these experiments (5 × 10⁻⁵ Torr), H2O was80%–90% of the partial pressure of the vacuum back-ground [52], so presumably it dominated the most looselybound and first-desorbed electrode adsorbates. The sodiumis attributed to unintended direct human-electrode contact.Negligibly small quantities (nanograms) have been readilyobserved in visible spectra from other experiments on Z[53]. The dominance of contaminants in the convoluteplasma inventory is consistent with spectroscopic obser-vations in previous pulsed-power systems (electron-beam
6660 6680 6700 6720 67400.7
0.8
0.9
1
Inte
nsity
[arb
. uni
ts]
Wavelength [Å]
(b)
Li I
40 60 80 100 120
−60
−50
−40
−30
−20
−10
0
10
20
Axi
al lo
catio
n [m
m]
Radial location [mm]
(a)
FIG. 9. (a) An R − Z cross section of the convolute-spectroscopy-probe field of view (black dashed lines) with alithium fluoride (LiF) dopant (magenta band) located on theupper convolute post (anode). (b) A plot of the spectrum showingthe neutral lithium (Li I) absorption line at 6708 Å. Thisdemonstrated that a continuum source was located below theposition of the Li dopant. The spectrum shown was averaged overt ¼ 24 to 104 ns in order to obtain a high signal to noise ratio. TheLi I spectral feature was first clearly observed at t ¼ 24 ns.
EXPERIMENTAL STUDY OF CURRENT LOSS … PHYS. REV. ACCEL. BEAMS 20, 010401 (2017)
010401-9
diodes, ion-beam diodes, MITLs) [54]. Desorption rates ofsurface contaminants are orders of magnitude greater thanthe vapor pressures of electrode materials, until electrodesreach melt and vaporization [54].Continuum emission was observed in the convolute once
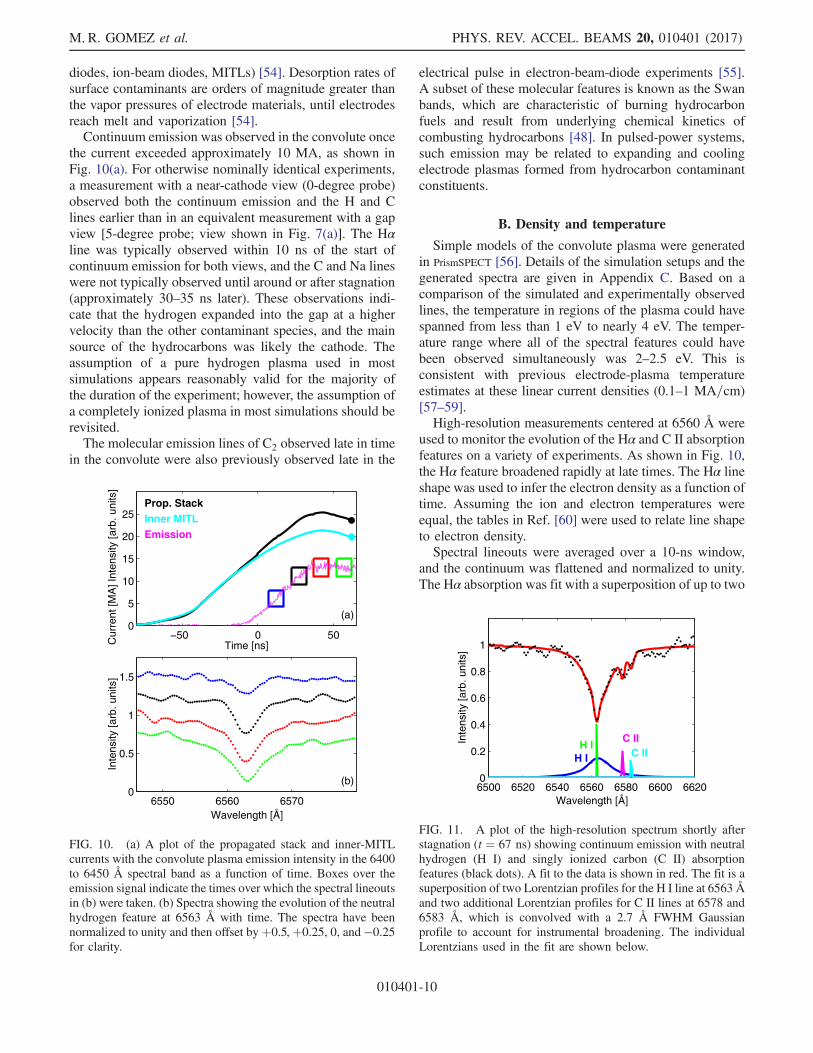
the current exceeded approximately 10 MA, as shown inFig. 10(a). For otherwise nominally identical experiments,a measurement with a near-cathode view (0-degree probe)observed both the continuum emission and the H and Clines earlier than in an equivalent measurement with a gapview [5-degree probe; view shown in Fig. 7(a)]. The Hαline was typically observed within 10 ns of the start ofcontinuum emission for both views, and the C and Na lineswere not typically observed until around or after stagnation(approximately 30–35 ns later). These observations indi-cate that the hydrogen expanded into the gap at a highervelocity than the other contaminant species, and the mainsource of the hydrocarbons was likely the cathode. Theassumption of a pure hydrogen plasma used in mostsimulations appears reasonably valid for the majority ofthe duration of the experiment; however, the assumption ofa completely ionized plasma in most simulations should berevisited.The molecular emission lines of C2 observed late in time
in the convolute were also previously observed late in the
electrical pulse in electron-beam-diode experiments [55].A subset of these molecular features is known as the Swanbands, which are characteristic of burning hydrocarbonfuels and result from underlying chemical kinetics ofcombusting hydrocarbons [48]. In pulsed-power systems,such emission may be related to expanding and coolingelectrode plasmas formed from hydrocarbon contaminantconstituents.
B. Density and temperature
Simple models of the convolute plasma were generatedin PrismSPECT [56]. Details of the simulation setups and thegenerated spectra are given in Appendix C. Based on acomparison of the simulated and experimentally observedlines, the temperature in regions of the plasma could havespanned from less than 1 eV to nearly 4 eV. The temper-ature range where all of the spectral features could havebeen observed simultaneously was 2–2.5 eV. This isconsistent with previous electrode-plasma temperatureestimates at these linear current densities (0.1–1 MA=cm)[57–59].High-resolution measurements centered at 6560 Å were
used to monitor the evolution of the Hα and C II absorptionfeatures on a variety of experiments. As shown in Fig. 10,the Hα feature broadened rapidly at late times. The Hα lineshape was used to infer the electron density as a function oftime. Assuming the ion and electron temperatures wereequal, the tables in Ref. [60] were used to relate line shapeto electron density.Spectral lineouts were averaged over a 10-ns window,
and the continuum was flattened and normalized to unity.The Hα absorption was fit with a superposition of up to two
−50 0 500
5
10
15
20
25
Cur
rent
[MA
] Int
ensi
ty [a
rb. u
nits
]
Time [ns]
Prop. StackInner MITLEmission
(a)
6550 6560 65700
0.5
1
1.5
Inte
nsity
[arb
. uni
ts]
Wavelength [Å]
(b)
FIG. 10. (a) A plot of the propagated stack and inner-MITLcurrents with the convolute plasma emission intensity in the 6400to 6450 Å spectral band as a function of time. Boxes over theemission signal indicate the times over which the spectral lineoutsin (b) were taken. (b) Spectra showing the evolution of the neutralhydrogen feature at 6563 Å with time. The spectra have beennormalized to unity and then offset byþ0.5,þ0.25, 0, and −0.25for clarity.
6500 6520 6540 6560 6580 6600 66200
0.2
0.4
0.6
0.8
1
Inte
nsity
[arb
. uni
ts]
Wavelength [Å]
C IIC II
H IH I
FIG. 11. A plot of the high-resolution spectrum shortly afterstagnation (t ¼ 67 ns) showing continuum emission with neutralhydrogen (H I) and singly ionized carbon (C II) absorptionfeatures (black dots). A fit to the data is shown in red. The fit is asuperposition of two Lorentzian profiles for the H I line at 6563 Åand two additional Lorentzian profiles for C II lines at 6578 and6583 Å, which is convolved with a 2.7 Å FWHM Gaussianprofile to account for instrumental broadening. The individualLorentzians used in the fit are shown below.
M. R. GOMEZ et al. PHYS. REV. ACCEL. BEAMS 20, 010401 (2017)
010401-10
Lorentzian profiles convolved with a Gaussian profile,which accounted for the instrumental broadening (typically2.7 Å FWHM). At early times, a single Lorentzian profilewas sufficient to fit the data, but at late times, Hα wasbetter fit by two profiles: one with an equivalent density ofabout 1 × 1016 cm−3 and the other between 1 × 10¹⁷ and1 × 1018 cm−3. This dual density fit to Hα is not a uniquesolution, but it demonstrates that the plasma likely had adensity gradient that covered the range of densities used inthe fit. In addition to Hα, a pair of nearby C II absorptionlines were included in the fit. An example spectrum withthe fit is shown in Fig. 11. Given the typical resolution ofthe instrument, the SVS measurements were only sensitiveto densities in excess of 1 × 1016 cm−3.The uncertainty in the inferred density is a combination
in quadrature of several sources of uncertainty. Theuncertainty in the FWHM of the fit, which ranged fromsub-Å at low densities to approximately �10 Å at highdensities, corresponds to approximately a 25% uncertainty
in the density (on average), with larger uncertainty at lowerdensities. An additional uncertainty was introduced byassuming the plasma temperature was 2 eV. Given a�1 eVuncertainty in temperature, the resulting additional uncer-tainty in the density was approximately 13% [60].
C. Correlation of impedance and density
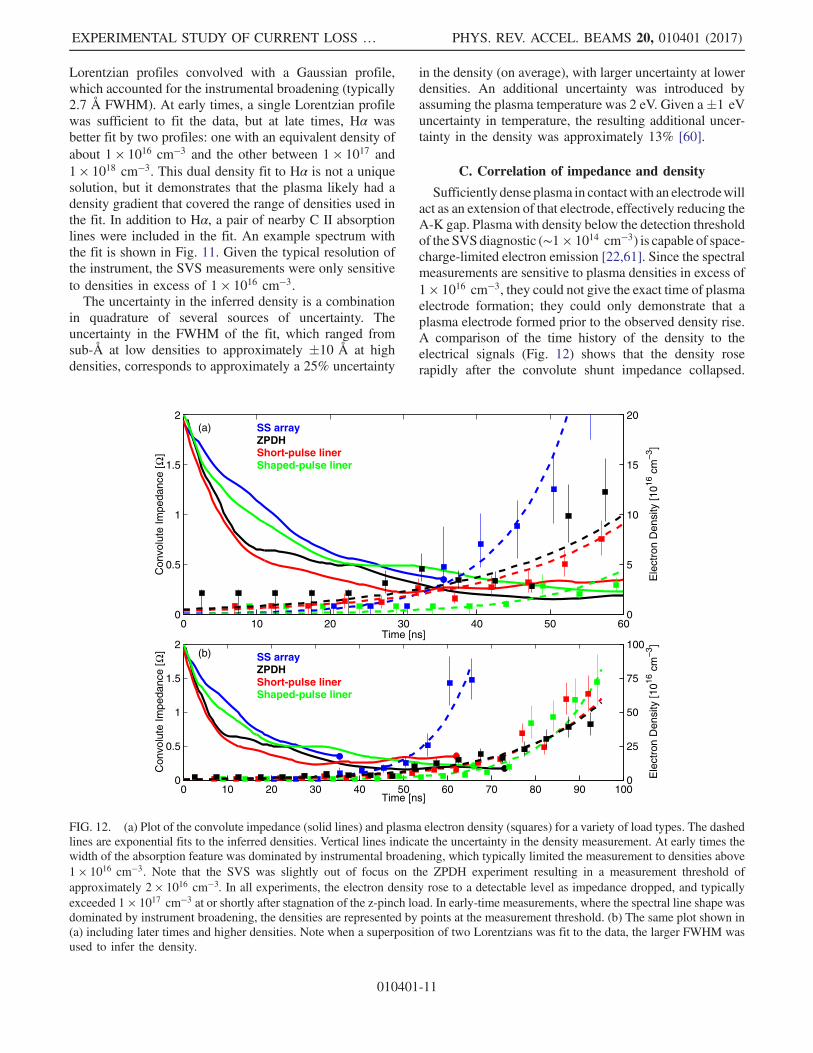
Sufficiently dense plasma in contactwith an electrodewillact as an extension of that electrode, effectively reducing theA-K gap. Plasmawith density below the detection thresholdof the SVSdiagnostic (∼1 × 1014 cm−3) is capable of space-charge-limited electron emission [22,61]. Since the spectralmeasurements are sensitive to plasma densities in excess of1 × 1016 cm−3, they could not give the exact time of plasmaelectrode formation; they could only demonstrate that aplasma electrode formed prior to the observed density rise.A comparison of the time history of the density to theelectrical signals (Fig. 12) shows that the density roserapidly after the convolute shunt impedance collapsed.
0
0.5
1
1.5
2
Con
volu
te Im
peda
nce
[ ] Ω
Time [ns]
SS arrayZPDHShort-pulse linerShaped-pulse liner
(a)
0 10 20 30 40 50 600
5
10
15
20
Ele
ctro
n D
ensi
ty [1
016 c
m−3
]
0
0.5
1
1.5
2
Con
volu
te Im
peda
nce
[ ] Ω
Time [ns]
SS arrayZPDHShort-pulse linerShaped-pulse liner
(b)
0 10 20 30 40 50 60 70 80 90 1000
25
50
75
100E
lect
ron
Den
sity
[1016
cm
−3]
FIG. 12. (a) Plot of the convolute impedance (solid lines) and plasma electron density (squares) for a variety of load types. The dashedlines are exponential fits to the inferred densities. Vertical lines indicate the uncertainty in the density measurement. At early times thewidth of the absorption feature was dominated by instrumental broadening, which typically limited the measurement to densities above1 × 1016 cm−3. Note that the SVS was slightly out of focus on the ZPDH experiment resulting in a measurement threshold ofapproximately 2 × 1016 cm−3. In all experiments, the electron density rose to a detectable level as impedance dropped, and typicallyexceeded 1 × 1017 cm−3 at or shortly after stagnation of the z-pinch load. In early-time measurements, where the spectral line shape wasdominated by instrument broadening, the densities are represented by points at the measurement threshold. (b) The same plot shown in(a) including later times and higher densities. Note when a superposition of two Lorentzians was fit to the data, the larger FWHM wasused to infer the density.
EXPERIMENTAL STUDY OF CURRENT LOSS … PHYS. REV. ACCEL. BEAMS 20, 010401 (2017)
010401-11
This implies that the plasma density in this region exceeded1 × 1014 cm−3 (allowing a plasma electrode to form) at anearlier time, but it is not clear exactly when it occurredrelative to the start of the impedance collapse.Despite the substantially different voltage histories
applied to the convolute and the large difference in shuntcurrents for the different types of z-pinch loads, the electron-density histories for these experiments followed a similartrend. In each case, the density was typically less than1 × 1016 cm−3 for the majority of the experiment; after thestart of the impedance collapse, the density rapidly increasedand normally reached 1 × 1017 cm−3 by stagnation. In mostexperiments, the density peaked around 1 × 1018 cm−3 wellafter stagnation. The density curves for the ZPDH, short-pulse liner, and shaped-pulse liner experiments were similarto one another, which reinforces the hypothesis that theconvolute behavior was similar across a variety of experi-ments, and the observed losses were primarily driven by thevoltage applied to the convolute. In general, there appears tobe a trend towards a slightly later density rise in experimentswith higher impedance, although the differences in imped-ance were generally within the uncertainty in the measure-ments of one another.While the general behavior of plasma electron density
was similar across these experiments, there was onerelatively dramatic difference. For the SS wire array, whichproduced nearly 3 MV across the convolute at stagnation(compared to 1–2 MV for the other experiments), thedensity rose more quickly post-stagnation, rapidlyapproaching 1 × 1018 cm−3 approximately 30 ns prior tothe other experiments, as shown in Fig. 12(b). This may bea sign that although the convolute impedance collapselooked very similar for the different experiments, theplasma dynamics could diverge from nominal forextremely high-stress experiments at late times.However, it is worth noting that the time at which theinferred density approached 1 × 1018 cm−3 relative to thestagnation time in each experiment was similar, so the late-time spike in density may be related to post-stagnationeffects rather than the convolute impedance collapse. Forexample, an extremely intense burst of x rays bathes theinner-MITL and convolute at stagnation, which couldenhance plasma formation and motion in the region.This effect could be more pronounced in the wire-arrayimplosions, since they can generate hundreds of TW ofx rays [41].It is worth reemphasizing that due to diagnostic limi-
tations, much of the interesting physics occurred prior tothe time at which the plasma conditions were diagnosedwith these spectral measurements. The time at which theplasma density exceeded 1 × 1017 cm−3 may not bedirectly linked to the time at which the density reaches1 × 1014 cm−3 and a plasma extension of the cathodeforms. Note that there is precedent for using late-time behavior to understand related, but undiagnosable,
early-time effects [62]; however, any conclusions drawnfrom comparing late-time plasma densities are softenedby the assumption that the density rate of rise between1 × 1016 and 1 × 1018 cm−3 is directly correlated to thedensity rate of rise around 1 × 1014 cm−3.
D. Post to post symmetry
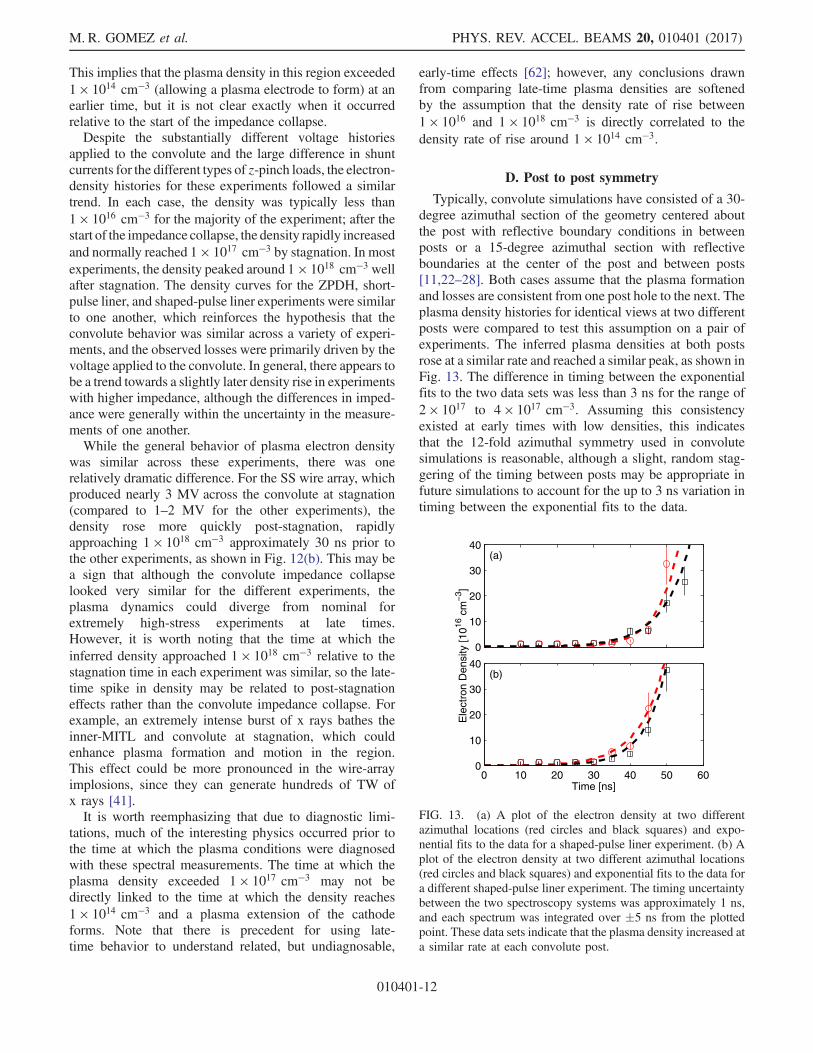
Typically, convolute simulations have consisted of a 30-degree azimuthal section of the geometry centered aboutthe post with reflective boundary conditions in betweenposts or a 15-degree azimuthal section with reflectiveboundaries at the center of the post and between posts[11,22–28]. Both cases assume that the plasma formationand losses are consistent from one post hole to the next. Theplasma density histories for identical views at two differentposts were compared to test this assumption on a pair ofexperiments. The inferred plasma densities at both postsrose at a similar rate and reached a similar peak, as shown inFig. 13. The difference in timing between the exponentialfits to the two data sets was less than 3 ns for the range of2 × 1017 to 4 × 1017 cm−3. Assuming this consistencyexisted at early times with low densities, this indicatesthat the 12-fold azimuthal symmetry used in convolutesimulations is reasonable, although a slight, random stag-gering of the timing between posts may be appropriate infuture simulations to account for the up to 3 ns variation intiming between the exponential fits to the data.
0
10
20
30
40
Ele
ctro
n D
ensi
ty [1
016 c
m−3
]
(a)
0 10 20 30 40 50 600
10
20
30
40
Time [ns]
(b)
FIG. 13. (a) A plot of the electron density at two differentazimuthal locations (red circles and black squares) and expo-nential fits to the data for a shaped-pulse liner experiment. (b) Aplot of the electron density at two different azimuthal locations(red circles and black squares) and exponential fits to the data fora different shaped-pulse liner experiment. The timing uncertaintybetween the two spectroscopy systems was approximately 1 ns,and each spectrum was integrated over �5 ns from the plottedpoint. These data sets indicate that the plasma density increased ata similar rate at each convolute post.
M. R. GOMEZ et al. PHYS. REV. ACCEL. BEAMS 20, 010401 (2017)
010401-12
E. Apparent expansion velocity
The density inferences mentioned above required neutralhydrogen in the line of sight, which was often located atleast 3 mm from the nearest electrode surface. A typicalexpansion velocity for a 2 eV hydrogen plasma is 2 cm=μs[63], but at this rate the hydrogen would not enter the line ofsight for 150 ns. The earliest measurements of hydrogenabsorption occurred approximately 70 ns after the start ofcurrent, which would require an expansion velocity of atleast 4 cm=μs. Similarly, the Li dopant from the experimentdescribed in Fig. 9 was observed 4 mm from the anode postapproximately 100 ns after the start of current, implying atleast a 4 cm=μs velocity. These observations indicate thatneutral particle expansion from both the anode and cathodeoccurred at more rapid rates than typical dense plasmaexpansion rates observed in MITLs.In a previous study, the turn-on times of the continuum
emission at a few radial positions in the upper post-holeregion were used to infer that the convolute plasma formedat the cathode and progressed towards the post (anode)[47]. This measurement relied on several nominally iden-tical Z-pinch experiments, each with a different SVS-probealignment angle. Based on these measurements, the closurevelocity was estimated to be > 7 cm=μs [47]. Concernsover the location of the continuum emission source, theangle of the observation line of sight, and the shot-to-shotreproducibility of the emission prompted this measurementto be revisited.A probe was designed to allow multiple measurements in
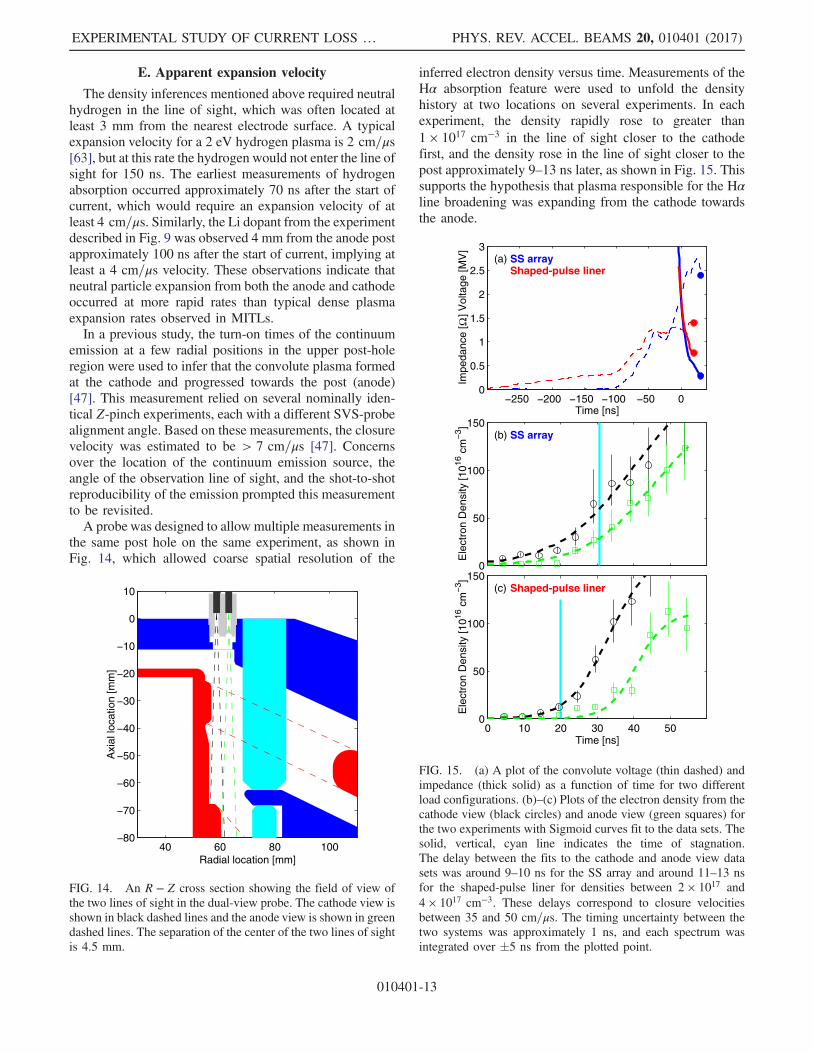
the same post hole on the same experiment, as shown inFig. 14, which allowed coarse spatial resolution of the
inferred electron density versus time. Measurements of theHα absorption feature were used to unfold the densityhistory at two locations on several experiments. In eachexperiment, the density rapidly rose to greater than1 × 1017 cm−3 in the line of sight closer to the cathodefirst, and the density rose in the line of sight closer to thepost approximately 9–13 ns later, as shown in Fig. 15. Thissupports the hypothesis that plasma responsible for the Hαline broadening was expanding from the cathode towardsthe anode.
40 60 80 100−80
−70
−60
−50
−40
−30
−20
−10
0
10
Axi
al lo
catio
n [m
m]
Radial location [mm]
FIG. 14. An R − Z cross section showing the field of view ofthe two lines of sight in the dual-view probe. The cathode view isshown in black dashed lines and the anode view is shown in greendashed lines. The separation of the center of the two lines of sightis 4.5 mm.
−250 −200 −150 −100 −50 00
0.5
1
1.5
2
2.5
3
Impe
danc
e [
] V
olta
ge [M
V]
Ω
Time [ns]
SS arrayShaped-pulse liner
(a)
0
50
100
150
Ele
ctro
n D
ensi
ty [1
016 c
m−3
]
SS array(b)
0 10 20 30 40 500
50
100
150
Ele
ctro
n D
ensi
ty [1
016 c
m−3
]
Time [ns]
Shaped-pulse liner(c)
FIG. 15. (a) A plot of the convolute voltage (thin dashed) andimpedance (thick solid) as a function of time for two differentload configurations. (b)–(c) Plots of the electron density from thecathode view (black circles) and anode view (green squares) forthe two experiments with Sigmoid curves fit to the data sets. Thesolid, vertical, cyan line indicates the time of stagnation.The delay between the fits to the cathode and anode view datasets was around 9–10 ns for the SS array and around 11–13 nsfor the shaped-pulse liner for densities between 2 × 10¹⁷ and4 × 1017 cm−3. These delays correspond to closure velocitiesbetween 35 and 50 cm=μs. The timing uncertainty between thetwo systems was approximately 1 ns, and each spectrum wasintegrated over �5 ns from the plotted point.
EXPERIMENTAL STUDY OF CURRENT LOSS … PHYS. REV. ACCEL. BEAMS 20, 010401 (2017)
010401-13
These data were used to infer the apparent plasmaclosure velocity
veff ¼r2 − r1t2 − t1
¼ 4.5½mm�t2 − t1
; ð5aÞ
n1ðt ¼ t1Þ ¼ n2ðt ¼ t2Þ ¼ n0; ð5bÞ
where r1 and r2 are the radial positions of fibers 1 and 2with respect to the machine axis, respectively, n1ðtÞ andn2ðtÞ are the electron densities inferred from the data setscollected by probe one and two, respectively, and n0 is arepresentative electron density, which was chosen to bebetween 2 × 10¹⁷ and 4 × 1017 cm−3. Fiber 1 is defined tobe the probe closer to the machine axis, which is also theprobe closer to the cathode. The plasma closure velocity inthe SS-array experiment ranged from 45 to 50 cm=μs, andin the shaped-pulse liner experiment the velocity rangedfrom 35 to 41 cm=μs, depending on the value chosen forn0. In both cases the velocity was over an order ofmagnitude above the expected thermal velocity of theplasma. Note however that the experimental value is similarto the 20 cm=μs convolute-plasma closure velocitiesobserved in simulations [22] and to the estimated21 cm=μs anode-plasma closure velocity assumed toexplain impedance collapse in previous experiments [18].The above measurements indicate that the plasma
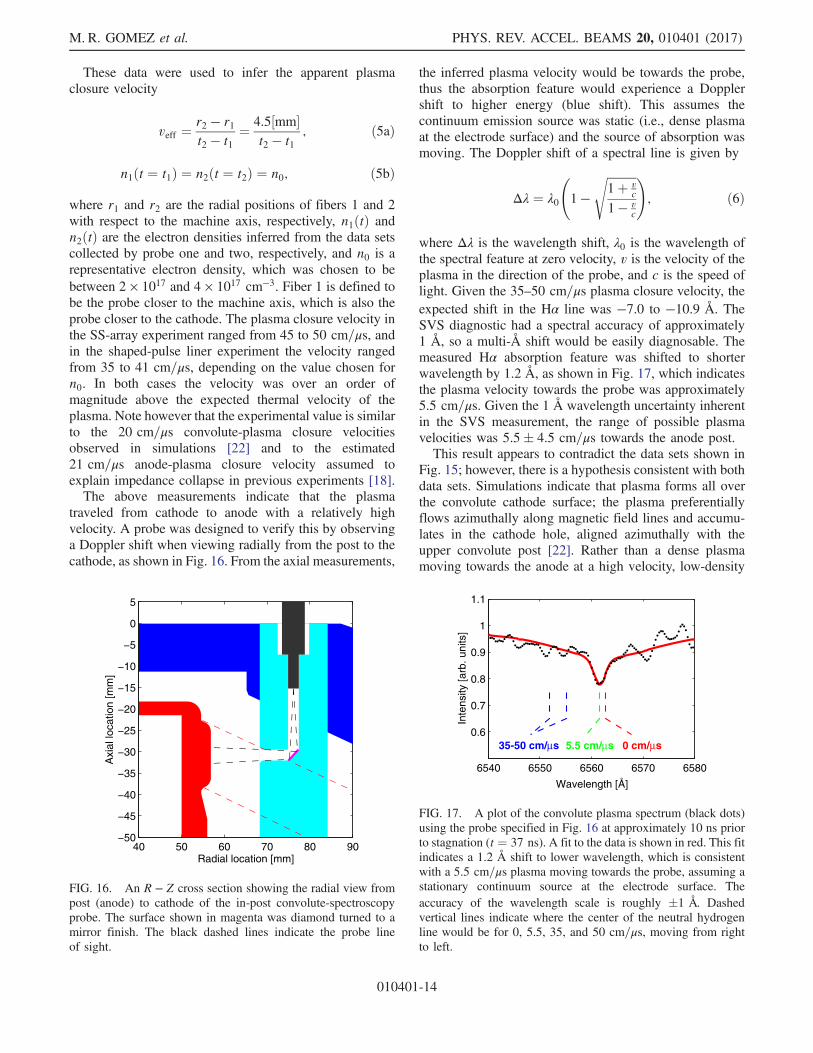
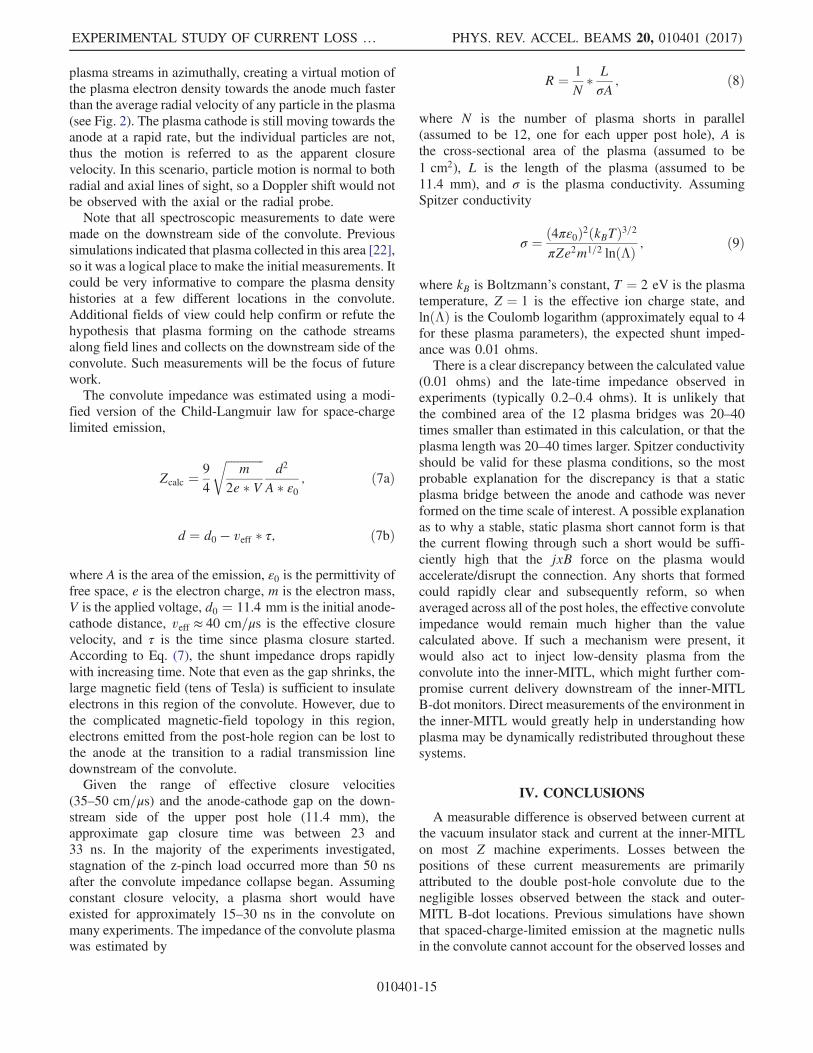
traveled from cathode to anode with a relatively highvelocity. A probe was designed to verify this by observinga Doppler shift when viewing radially from the post to thecathode, as shown in Fig. 16. From the axial measurements,
the inferred plasma velocity would be towards the probe,thus the absorption feature would experience a Dopplershift to higher energy (blue shift). This assumes thecontinuum emission source was static (i.e., dense plasmaat the electrode surface) and the source of absorption wasmoving. The Doppler shift of a spectral line is given by
Δλ ¼ λ0
1 −
ffiffiffiffiffiffiffiffiffiffi1þ v
c
1 − vc
s !; ð6Þ
where Δλ is the wavelength shift, λ0 is the wavelength ofthe spectral feature at zero velocity, v is the velocity of theplasma in the direction of the probe, and c is the speed oflight. Given the 35–50 cm=μs plasma closure velocity, theexpected shift in the Hα line was −7.0 to −10.9 Å. TheSVS diagnostic had a spectral accuracy of approximately1 Å, so a multi-Å shift would be easily diagnosable. Themeasured Hα absorption feature was shifted to shorterwavelength by 1.2 Å, as shown in Fig. 17, which indicatesthe plasma velocity towards the probe was approximately5.5 cm=μs. Given the 1 Å wavelength uncertainty inherentin the SVS measurement, the range of possible plasmavelocities was 5.5� 4.5 cm=μs towards the anode post.This result appears to contradict the data sets shown in
Fig. 15; however, there is a hypothesis consistent with bothdata sets. Simulations indicate that plasma forms all overthe convolute cathode surface; the plasma preferentiallyflows azimuthally along magnetic field lines and accumu-lates in the cathode hole, aligned azimuthally with theupper convolute post [22]. Rather than a dense plasmamoving towards the anode at a high velocity, low-density
40 50 60 70 80 90−50
−45
−40
−35
−30
−25
−20
−15
−10
−5
0
5
Axi
al lo
catio
n [m
m]
Radial location [mm]
FIG. 16. An R − Z cross section showing the radial view frompost (anode) to cathode of the in-post convolute-spectroscopyprobe. The surface shown in magenta was diamond turned to amirror finish. The black dashed lines indicate the probe lineof sight.
6540 6550 6560 6570 6580
0.6
0.7
0.8
0.9
1
1.1
Inte
nsity
[arb
. uni
ts]
Wavelength [Å]
0 cm/μs35-50 cm/μs 5.5 cm/μs
FIG. 17. A plot of the convolute plasma spectrum (black dots)using the probe specified in Fig. 16 at approximately 10 ns priorto stagnation (t ¼ 37 ns). A fit to the data is shown in red. This fitindicates a 1.2 Å shift to lower wavelength, which is consistentwith a 5.5 cm=μs plasma moving towards the probe, assuming astationary continuum source at the electrode surface. Theaccuracy of the wavelength scale is roughly �1 Å. Dashedvertical lines indicate where the center of the neutral hydrogenline would be for 0, 5.5, 35, and 50 cm=μs, moving from rightto left.
M. R. GOMEZ et al. PHYS. REV. ACCEL. BEAMS 20, 010401 (2017)
010401-14
plasma streams in azimuthally, creating a virtual motion ofthe plasma electron density towards the anode much fasterthan the average radial velocity of any particle in the plasma(see Fig. 2). The plasma cathode is still moving towards theanode at a rapid rate, but the individual particles are not,thus the motion is referred to as the apparent closurevelocity. In this scenario, particle motion is normal to bothradial and axial lines of sight, so a Doppler shift would notbe observed with the axial or the radial probe.Note that all spectroscopic measurements to date were
made on the downstream side of the convolute. Previoussimulations indicated that plasma collected in this area [22],so it was a logical place to make the initial measurements. Itcould be very informative to compare the plasma densityhistories at a few different locations in the convolute.Additional fields of view could help confirm or refute thehypothesis that plasma forming on the cathode streamsalong field lines and collects on the downstream side of theconvolute. Such measurements will be the focus of futurework.The convolute impedance was estimated using a modi-
fied version of the Child-Langmuir law for space-chargelimited emission,
Zcalc ¼9
4
ffiffiffiffiffiffiffiffiffiffiffiffiffim
2e � Vr
d2
A � ε0; ð7aÞ
d ¼ d0 − veff � τ; ð7bÞ
where A is the area of the emission, ε0 is the permittivity offree space, e is the electron charge, m is the electron mass,V is the applied voltage, d0 ¼ 11.4 mm is the initial anode-cathode distance, veff ≈ 40 cm=μs is the effective closurevelocity, and τ is the time since plasma closure started.According to Eq. (7), the shunt impedance drops rapidlywith increasing time. Note that even as the gap shrinks, thelarge magnetic field (tens of Tesla) is sufficient to insulateelectrons in this region of the convolute. However, due tothe complicated magnetic-field topology in this region,electrons emitted from the post-hole region can be lost tothe anode at the transition to a radial transmission linedownstream of the convolute.Given the range of effective closure velocities
(35–50 cm=μs) and the anode-cathode gap on the down-stream side of the upper post hole (11.4 mm), theapproximate gap closure time was between 23 and33 ns. In the majority of the experiments investigated,stagnation of the z-pinch load occurred more than 50 nsafter the convolute impedance collapse began. Assumingconstant closure velocity, a plasma short would haveexisted for approximately 15–30 ns in the convolute onmany experiments. The impedance of the convolute plasmawas estimated by
R ¼ 1
N� LσA
; ð8Þ
where N is the number of plasma shorts in parallel(assumed to be 12, one for each upper post hole), A isthe cross-sectional area of the plasma (assumed to be1 cm2), L is the length of the plasma (assumed to be11.4 mm), and σ is the plasma conductivity. AssumingSpitzer conductivity
σ ¼ ð4πε0Þ2ðkBTÞ3=2πZe2m1=2 lnðΛÞ ; ð9Þ
where kB is Boltzmann’s constant, T ¼ 2 eV is the plasmatemperature, Z ¼ 1 is the effective ion charge state, andlnðΛÞ is the Coulomb logarithm (approximately equal to 4for these plasma parameters), the expected shunt imped-ance was 0.01 ohms.There is a clear discrepancy between the calculated value
(0.01 ohms) and the late-time impedance observed inexperiments (typically 0.2–0.4 ohms). It is unlikely thatthe combined area of the 12 plasma bridges was 20–40times smaller than estimated in this calculation, or that theplasma length was 20–40 times larger. Spitzer conductivityshould be valid for these plasma conditions, so the mostprobable explanation for the discrepancy is that a staticplasma bridge between the anode and cathode was neverformed on the time scale of interest. A possible explanationas to why a stable, static plasma short cannot form is thatthe current flowing through such a short would be suffi-ciently high that the jxB force on the plasma wouldaccelerate/disrupt the connection. Any shorts that formedcould rapidly clear and subsequently reform, so whenaveraged across all of the post holes, the effective convoluteimpedance would remain much higher than the valuecalculated above. If such a mechanism were present, itwould also act to inject low-density plasma from theconvolute into the inner-MITL, which might further com-promise current delivery downstream of the inner-MITLB-dot monitors. Direct measurements of the environment inthe inner-MITL would greatly help in understanding howplasma may be dynamically redistributed throughout thesesystems.
IV. CONCLUSIONS
A measurable difference is observed between current atthe vacuum insulator stack and current at the inner-MITLon most Z machine experiments. Losses between thepositions of these current measurements are primarilyattributed to the double post-hole convolute due to thenegligible losses observed between the stack and outer-MITL B-dot locations. Previous simulations have shownthat spaced-charge-limited emission at the magnetic nullsin the convolute cannot account for the observed losses and
EXPERIMENTAL STUDY OF CURRENT LOSS … PHYS. REV. ACCEL. BEAMS 20, 010401 (2017)
010401-15
indicate that plasma formation in the convolute contributessubstantially to the observed current loss [22,25–28].The effective impedance of the convolute collapsed from
greater than 10 ohms to less than 1 ohm over a roughly10 ns period, and the impedance approached a relativelyconstant value of approximately 0.2–0.4 ohms. Thisbehavior was observed across a wide variety of experimenttypes including those that are considered well matched tothe driver, such as the z-pinch dynamic hohlraum. Thevariation in timing of the impedance collapse betweendifferent types of experiments is still under investigation.Given the similar impedance behavior across many load
types, coupled with a similar timing and magnitude ofobserved plasma density as a function of time, it appears thatthe wide range of observed shunt currents were primarilydriven by the wide range of voltages applied to the con-volute, which strongly depended on the load inductancehistory. Loads with high initial inductance and loads withhigh implosion velocities applied a larger voltage to theconvolute, which caused a higher shunt current.Spectroscopic measurements in the convolute show a
dense plasma (greater than 1 × 1016 cm−3) formed on thedownstream side of the upper post hole for all types ofexperiments. The time of plasma formation appears corre-lated with the time of convolute impedance collapse.Simulations indicate that plasma formation in this regioncan contribute significantly to current loss.The convolute plasma had an apparent cathode-to-anode
velocity of approximately 35–50 cm=μs, which was muchfaster than expected for a roughly 2 eV plasma. An estimateof the radially outward plasma velocity using Dopplerspectroscopy suggested that this was not the velocity ofcharged particles in the plasma, but an effective bulkmotion of the plasma. This is consistent with the hypothesisthat low-beta plasma slowly streams in along magnetic fieldlines and collects downstream of the post, producing anapparent motion of the plasma across the gap between thecathode and the anode. Even with the rapid closurevelocity, the impedance of the convolute did not dropbelow 0.1 ohms, indicating that a static plasma short acrossthe post-hole gap did not form during the experiment.Despite the progress made in diagnosing convolute
plasma behavior, there are many outstanding questions.The formation time of a plasma electrode with sufficientdensity to support space-charge-limited emission(1014 cm−3), the correlation between high-density obser-vations late in time and low-density behavior early in time,and the direction and velocity of plasma motion are stilluncertain. Additionally, it is not clear by what process theneutral contaminant species are accelerated into the anode-cathode gap, and the source/location of the continuumbacklighter is in question. Additional investigations toanswer these questions are planned and will be discussedin a future publication.
In light of the findings detailed above, the inner-MITLand load regions are being redesigned for a number ofexperiments to reduce the initial inductance. For example,the initial inductance for some upcoming magnetizedliner inertial fusion experiments [7] was reduced from 6.5to 4.6 nH, which should drop the peak convolute voltagefrom over 2.5 MV to less than 2 MV. This change ispredicted to increase the current from 17–18 MA to19–20 MA [43].Additionally, a larger-diameter convolute was designed
in order to improve current delivery to the load on Z [64].The new convolute was tested on several experiments, andpreliminary results indicate that current delivery wasimproved. The new convolute design moved the postsradially outward, which decreased current density andreduced plasma formation in the post-hole region.Moving the posts to a larger radius also provided enoughspace to enlarge the holes in the cathode, which createdlarger A-K gaps for the plasma to cross. This comes at thecost of increased inductance inside the convolute, whichincreases the voltage applied to the convolute. Details of thenew convolute will be the topic of a future publication.
ACKNOWLEDGMENTS
The authors acknowledge a series of extremely usefuldiscussions on this topic with J. E. Bailey, J. Reneker, andG. A. Rochau. The authors would like to thank W. E.Fowler, J. K. Moore, M. E. Savage, and T. C. Wagoner fortheir work calibrating the electrical probes, D. E. Bliss,A. L. Carlson, D. H. Dolan, R. E. Falcon, R. G. Hacking,D. J. Scoglietti, C. T. Seagle, and C. C. Smith for theircontributions to the fielding and calibration of the streaked-visible-spectroscopy systems, and the rest of the Z machineoperations team for executing the experiments. The authorswould also like to thank D. J. Ampleford, J. E. Bailey, E. C.Harding, B. Jones, M. C. Jones, G. P. Loisel, G. A. Rochau,and D. B. Sinars, who were the principal investigators (inaddition to some of the authors) that allowed thesespectroscopic, nonperturbative, ride-along measurementsto occur on more than 50 experiments over six years. Inaddition, the authors thank E. A. Madrid, D. R. Welch,J. Gansz-Torres, and C. Mostrom for discussions related tothe previously published numerical-simulation results.Portions of this research were funded by the NationalNuclear Security Administration through the Krell Institutevia the Stewardship Science Graduate Fellowship. Thisproject was also funded in part by Sandia’s LaboratoryDirected Research and Development Program. SandiaNational Laboratories is a multi-program laboratory man-aged and operated by Sandia Corporation, a wholly ownedsubsidiary of Lockheed Martin Corporation, for the U.S.Department of Energy’s National Nuclear SecurityAdministration under Contract No. DE-AC04-94AL85000.
M. R. GOMEZ et al. PHYS. REV. ACCEL. BEAMS 20, 010401 (2017)
010401-16
APPENDIX A: SHORT-CIRCUIT EXPERIMENTS
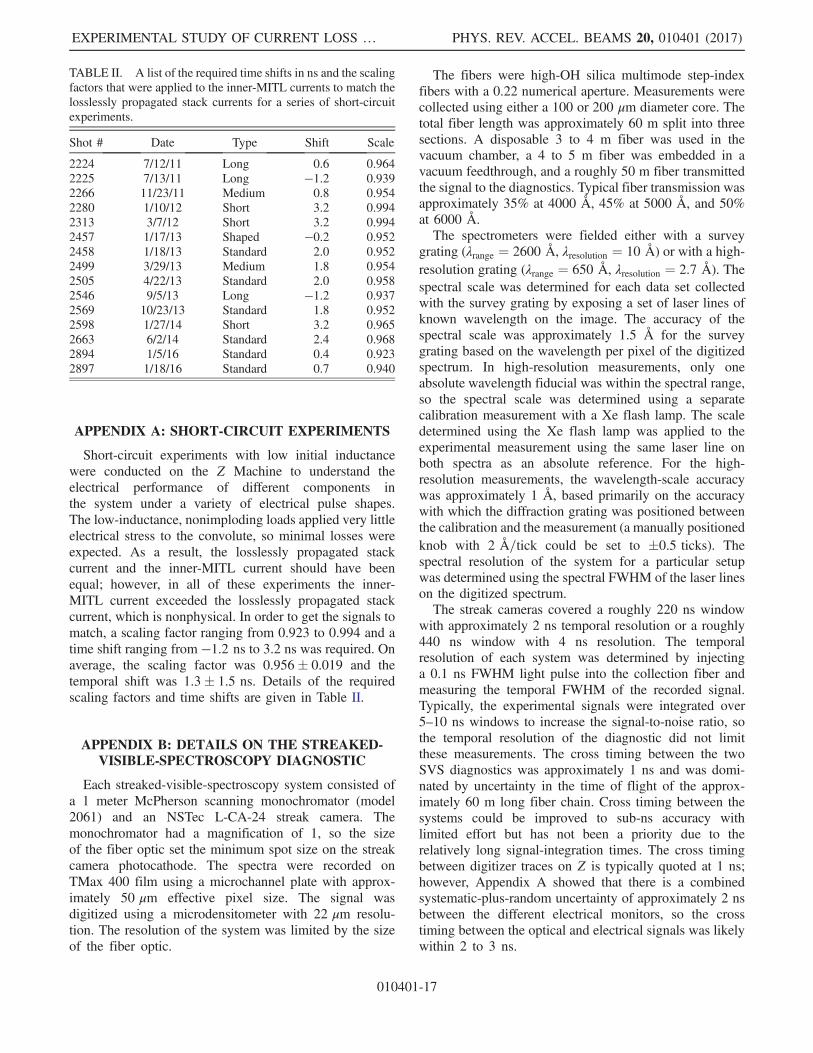
Short-circuit experiments with low initial inductancewere conducted on the Z Machine to understand theelectrical performance of different components inthe system under a variety of electrical pulse shapes.The low-inductance, nonimploding loads applied very littleelectrical stress to the convolute, so minimal losses wereexpected. As a result, the losslessly propagated stackcurrent and the inner-MITL current should have beenequal; however, in all of these experiments the inner-MITL current exceeded the losslessly propagated stackcurrent, which is nonphysical. In order to get the signals tomatch, a scaling factor ranging from 0.923 to 0.994 and atime shift ranging from −1.2 ns to 3.2 ns was required. Onaverage, the scaling factor was 0.956� 0.019 and thetemporal shift was 1.3� 1.5 ns. Details of the requiredscaling factors and time shifts are given in Table II.
APPENDIX B: DETAILS ON THE STREAKED-VISIBLE-SPECTROSCOPY DIAGNOSTIC
Each streaked-visible-spectroscopy system consisted ofa 1 meter McPherson scanning monochromator (model2061) and an NSTec L-CA-24 streak camera. Themonochromator had a magnification of 1, so the sizeof the fiber optic set the minimum spot size on the streakcamera photocathode. The spectra were recorded onTMax 400 film using a microchannel plate with approx-imately 50 μm effective pixel size. The signal wasdigitized using a microdensitometer with 22 μm resolu-tion. The resolution of the system was limited by the sizeof the fiber optic.
The fibers were high-OH silica multimode step-indexfibers with a 0.22 numerical aperture. Measurements werecollected using either a 100 or 200 μm diameter core. Thetotal fiber length was approximately 60 m split into threesections. A disposable 3 to 4 m fiber was used in thevacuum chamber, a 4 to 5 m fiber was embedded in avacuum feedthrough, and a roughly 50 m fiber transmittedthe signal to the diagnostics. Typical fiber transmission wasapproximately 35% at 4000 Å, 45% at 5000 Å, and 50%at 6000 Å.The spectrometers were fielded either with a survey
grating (λrange ¼ 2600 Å, λresolution ¼ 10 Å) or with a high-resolution grating (λrange ¼ 650 Å, λresolution ¼ 2.7 Å). Thespectral scale was determined for each data set collectedwith the survey grating by exposing a set of laser lines ofknown wavelength on the image. The accuracy of thespectral scale was approximately 1.5 Å for the surveygrating based on the wavelength per pixel of the digitizedspectrum. In high-resolution measurements, only oneabsolute wavelength fiducial was within the spectral range,so the spectral scale was determined using a separatecalibration measurement with a Xe flash lamp. The scaledetermined using the Xe flash lamp was applied to theexperimental measurement using the same laser line onboth spectra as an absolute reference. For the high-resolution measurements, the wavelength-scale accuracywas approximately 1 Å, based primarily on the accuracywith which the diffraction grating was positioned betweenthe calibration and the measurement (a manually positionedknob with 2 Å=tick could be set to �0.5 ticks). Thespectral resolution of the system for a particular setupwas determined using the spectral FWHM of the laser lineson the digitized spectrum.The streak cameras covered a roughly 220 ns window
with approximately 2 ns temporal resolution or a roughly440 ns window with 4 ns resolution. The temporalresolution of each system was determined by injectinga 0.1 ns FWHM light pulse into the collection fiber andmeasuring the temporal FWHM of the recorded signal.Typically, the experimental signals were integrated over5–10 ns windows to increase the signal-to-noise ratio, sothe temporal resolution of the diagnostic did not limitthese measurements. The cross timing between the twoSVS diagnostics was approximately 1 ns and was domi-nated by uncertainty in the time of flight of the approx-imately 60 m long fiber chain. Cross timing between thesystems could be improved to sub-ns accuracy withlimited effort but has not been a priority due to therelatively long signal-integration times. The cross timingbetween digitizer traces on Z is typically quoted at 1 ns;however, Appendix A showed that there is a combinedsystematic-plus-random uncertainty of approximately 2 nsbetween the different electrical monitors, so the crosstiming between the optical and electrical signals was likelywithin 2 to 3 ns.
TABLE II. A list of the required time shifts in ns and the scalingfactors that were applied to the inner-MITL currents to match thelosslessly propagated stack currents for a series of short-circuitexperiments.
Shot # Date Type Shift Scale
2224 7/12/11 Long 0.6 0.9642225 7/13/11 Long −1.2 0.9392266 11/23/11 Medium 0.8 0.9542280 1/10/12 Short 3.2 0.9942313 3/7/12 Short 3.2 0.9942457 1/17/13 Shaped −0.2 0.9522458 1/18/13 Standard 2.0 0.9522499 3/29/13 Medium 1.8 0.9542505 4/22/13 Standard 2.0 0.9582546 9/5/13 Long −1.2 0.9372569 10/23/13 Standard 1.8 0.9522598 1/27/14 Short 3.2 0.9652663 6/2/14 Standard 2.4 0.9682894 1/5/16 Standard 0.4 0.9232897 1/18/16 Standard 0.7 0.940
EXPERIMENTAL STUDY OF CURRENT LOSS … PHYS. REV. ACCEL. BEAMS 20, 010401 (2017)
010401-17
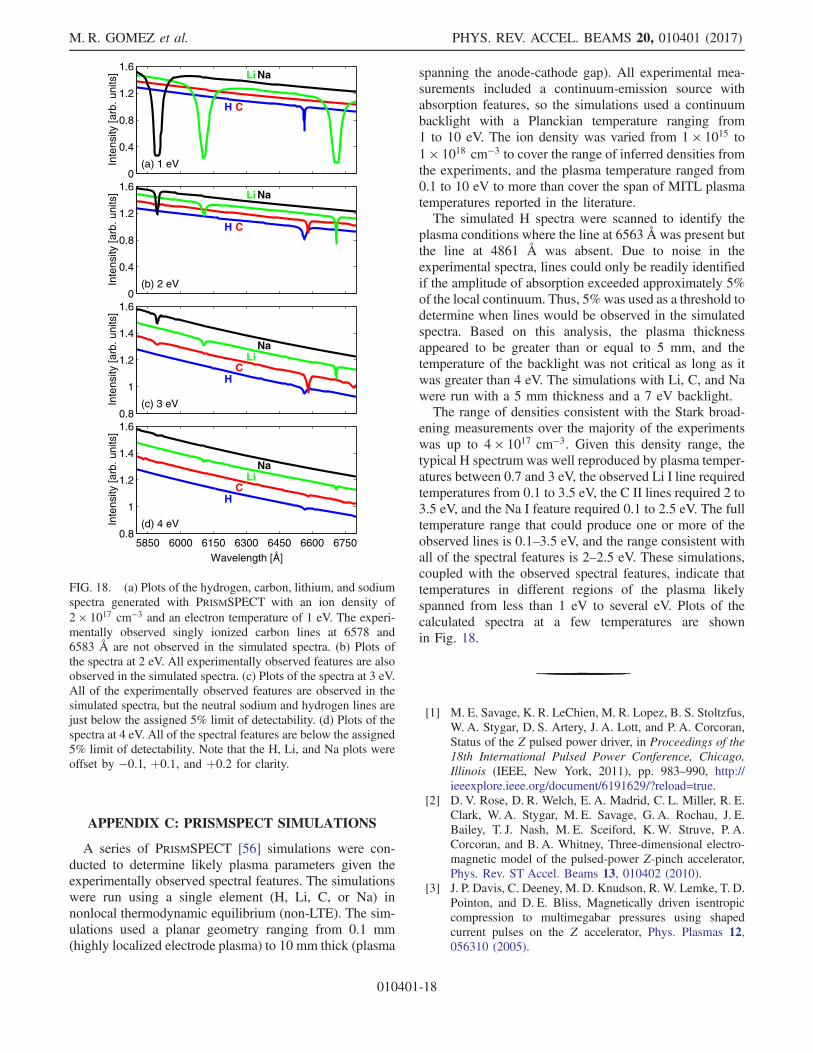
APPENDIX C: PRISMSPECT SIMULATIONS
A series of PRISMSPECT [56] simulations were con-ducted to determine likely plasma parameters given theexperimentally observed spectral features. The simulationswere run using a single element (H, Li, C, or Na) innonlocal thermodynamic equilibrium (non-LTE). The sim-ulations used a planar geometry ranging from 0.1 mm(highly localized electrode plasma) to 10 mm thick (plasma
spanning the anode-cathode gap). All experimental mea-surements included a continuum-emission source withabsorption features, so the simulations used a continuumbacklight with a Planckian temperature ranging from1 to 10 eV. The ion density was varied from 1 × 10¹⁵ to1 × 1018 cm−3 to cover the range of inferred densities fromthe experiments, and the plasma temperature ranged from0.1 to 10 eV to more than cover the span of MITL plasmatemperatures reported in the literature.The simulated H spectra were scanned to identify the
plasma conditions where the line at 6563 Å was present butthe line at 4861 Å was absent. Due to noise in theexperimental spectra, lines could only be readily identifiedif the amplitude of absorption exceeded approximately 5%of the local continuum. Thus, 5% was used as a threshold todetermine when lines would be observed in the simulatedspectra. Based on this analysis, the plasma thicknessappeared to be greater than or equal to 5 mm, and thetemperature of the backlight was not critical as long as itwas greater than 4 eV. The simulations with Li, C, and Nawere run with a 5 mm thickness and a 7 eV backlight.The range of densities consistent with the Stark broad-
ening measurements over the majority of the experimentswas up to 4 × 1017 cm−3. Given this density range, thetypical H spectrum was well reproduced by plasma temper-atures between 0.7 and 3 eV, the observed Li I line requiredtemperatures from 0.1 to 3.5 eV, the C II lines required 2 to3.5 eV, and the Na I feature required 0.1 to 2.5 eV. The fulltemperature range that could produce one or more of theobserved lines is 0.1–3.5 eV, and the range consistent withall of the spectral features is 2–2.5 eV. These simulations,coupled with the observed spectral features, indicate thattemperatures in different regions of the plasma likelyspanned from less than 1 eV to several eV. Plots of thecalculated spectra at a few temperatures are shownin Fig. 18.
[1] M. E. Savage, K. R. LeChien, M. R. Lopez, B. S. Stoltzfus,W. A. Stygar, D. S. Artery, J. A. Lott, and P. A. Corcoran,Status of the Z pulsed power driver, in Proceedings of the18th International Pulsed Power Conference, Chicago,Illinois (IEEE, New York, 2011), pp. 983–990, http://ieeexplore.ieee.org/document/6191629/?reload=true.
[2] D. V. Rose, D. R. Welch, E. A. Madrid, C. L. Miller, R. E.Clark, W. A. Stygar, M. E. Savage, G. A. Rochau, J. E.Bailey, T. J. Nash, M. E. Sceiford, K. W. Struve, P. A.Corcoran, and B. A. Whitney, Three-dimensional electro-magnetic model of the pulsed-power Z-pinch accelerator,Phys. Rev. ST Accel. Beams 13, 010402 (2010).
[3] J. P. Davis, C. Deeney, M. D. Knudson, R. W. Lemke, T. D.Pointon, and D. E. Bliss, Magnetically driven isentropiccompression to multimegabar pressures using shapedcurrent pulses on the Z accelerator, Phys. Plasmas 12,056310 (2005).
0
0.4
0.8
1.2
1.6
Inte
nsity
[arb
. uni
ts]
(a) 1 eV
H C
Li Na
0
0.4
0.8
1.2
1.6
Inte
nsity
[arb
. uni
ts]
(b) 2 eV
H C
Li Na
0.8
1
1.2
1.4
1.6
Inte
nsity
[arb
. uni
ts]
(c) 3 eV
HC
LiNa
5850 6000 6150 6300 6450 6600 67500.8
1
1.2
1.4
1.6
(d) 4 eV
Wavelength [Å]
Inte
nsity
[arb
. uni
ts]
HC
LiNa
FIG. 18. (a) Plots of the hydrogen, carbon, lithium, and sodiumspectra generated with PRISMSPECT with an ion density of2 × 1017 cm−3 and an electron temperature of 1 eV. The experi-mentally observed singly ionized carbon lines at 6578 and6583 Å are not observed in the simulated spectra. (b) Plots ofthe spectra at 2 eV. All experimentally observed features are alsoobserved in the simulated spectra. (c) Plots of the spectra at 3 eV.All of the experimentally observed features are observed in thesimulated spectra, but the neutral sodium and hydrogen lines arejust below the assigned 5% limit of detectability. (d) Plots of thespectra at 4 eV. All of the spectral features are below the assigned5% limit of detectability. Note that the H, Li, and Na plots wereoffset by −0.1, þ0.1, and þ0.2 for clarity.
M. R. GOMEZ et al. PHYS. REV. ACCEL. BEAMS 20, 010401 (2017)
010401-18
[4] M. R. Martin, R. W. Lemke, R. D. McBride, J. P. Davis,D. H. Dolan, M. D. Knudson, K. R. Cochrane, D. B.Sinars, I. C. Smith, M. Savage, W. A. Stygar, K. Killebrew,D. G. Flicker, and M. C. Herrmann, Solid liner implosionson Z for producing multi-megabar, shockless compres-sions, Phys. Plasmas 19, 056310 (2012).
[5] M. E. Cuneo et al., Development and characterization of aZ-pinch-driven hohlraum high-yield inertial confinementfusion target concept, Phys. Plasmas 8, 2257 (2001).
[6] R. D. McBride et al., Penetrating Radiography of Implod-ing and Stagnating Beryllium Liners on the Z Accelerator,Phys. Rev. Lett. 109, 135004 (2012).
[7] M. R. Gomez et al., Experimental Demonstration ofFusion-Relevant Conditions in Magnetized Liner InertialFusion, Phys. Rev. Lett. 113, 155003 (2014).
[8] G. A. Rochau, J. E. Bailey, R. E. Falcon, G. P. Loisel, T.Nagayama, R. C. Mancini, I. Hall, D. E. Winget, M. H.Montgomery, and D. A. Leidahl, ZAPP: The Z astrophysi-cal plasma properties collaboration, Phys. Plasmas 21,056308 (2014).
[9] J. E. Bailey et al., A higher-than-predicted measurement ofiron opacity at solar interior temperatures, Nature (London)517, 56 (2014).
[10] R. B. Spielman, P. Corcoran, J. Fockler, H. Kishi, andP. W. Spence, A double post-hole convolute diode forZ-pinch experiments on Saturn, in Proceedings of the7th International Pulsed Power Conference, Monterey,California 1989 (IEEE, New York, 1989), pp. 445–448,http://ieeexplore.ieee.org/document/767519/.
[11] T. D. Pointon, W. A. Stygar, R. B. Spielman, H. C. Ives,and K.W. Struve, Particle-in-cell simulations of electronflow in the post-hole convolute of the Z accelerator, Phys.Plasmas 8, 4534 (2001).
[12] T. W. L. Sanford, R. E. Olson, R. L. Bowers, G. A.Chandler, M. S. Derzon, D. E. Hebron, R. J. Leeper,R. C. Mock, T. J. Nash, D. L. Peterson, L. E. Ruggles,W.W. Simpson, K. W. Struve, and R. A. Vesey, Z-Pinch-Generated X Rays Demonstrate Potential for Indirect-Drive ICF Experiments, Phys. Rev. Lett. 83, 5511(1999).
[13] J. E. Bailey et al., Dynamic hohlraum radiation hydro-dynamics, Phys. Plasmas 13, 056301 (2006).
[14] D. D. Bloomquist, R. W. Stinnett, D. H. McDaniel,J. R. Lee, A. W. Sharpe, J. A. Halbleib, L. G. Schlitt,P. W. Spence, and P. Corcoran, SATURN, A large areax-ray simulation accelerator, in Proceedings of the 6thInternational Pulsed Power Conference, Arlington,Virginia, 1987 (IEEE, New York, 1987), pp. 310–317.
[15] K. W. Struve, T. H. Martin, R. B. Spielman, W. A. Stygar,P. A. Corcoran, and J. W. Douglas, Circuit-code modelingof the PBFA Z for Z-pinch experiments, in Proceedingsof the 11th International Pulsed Power Conference, Balti-more, Maryland (IEEE, Piscataway, NJ, 1997), pp. 162–167, http://ieeexplore.ieee.org/document/679300/.
[16] D. L. Peterson, R. L. Bowers, W. Matuska, K. D.McLenithan, G. A. Chandler, C. Deeney, M. S. Derzon,M. Douglas, M. K. Matzen, T. J. Nash, R. B. Spielman,K. W. Struve, W. A. Stygar, and N. F. Roderick, Insightsand applications of two-dimensional simulations toZ-pinch experiments, Phys. Plasmas 6, 2178 (1999).
[17] R. W. Lemke, M. D. Knudson, A. C. Robinson, T. A.Haill, K. W. Struve, J. R. Asay, and T. A. Mehlhorn,Self-consistent, two-dimensional, magnetohydrodynamicsimulations of magnetically driven flyer plates, Phys.Plasmas 10, 1867 (2003).
[18] C. A. Jennings, J. P. Chittenden, M. E. Cuneo, W. A.Stygar, D. J. Ampleford, E. M. Waisman, M. Jones,M. E. Savage, K. R. LeChien, and T. C. Wagoner, Circuitmodel for driving three-dimensional resistive MHD wirearray Z-pinch calculations, IEEE Trans. Plasma Sci. 38,529 (2010).
[19] C. A. Jennings, M. E. Cuneo, E. M. Waisman, D. B. Sinars,D. J. Ampleford, G. R. Bennett, W. A. Stygar, and J. P.Chittenden, Simulations of the implosion and stagnation ofcompact wire arrays, Phys. Plasmas 17, 092703 (2010).
[20] M. R. Gomez, M. E. Cuneo, J.-P. Davis, R. W. Lemke,R. D. McBride, R. B. Campbell, C. A. Jennings, W. A.Stygar, D. V. Rose, D. R. Welch, and E. A. Madrid, Asystematic study of current flow and impedance behaviorin the Z machine double post-hole convolute, in Proceed-ings of the 19th International Pulsed Power Conference,San Francisco, California (IEEE, New York, 2013),pp. 63–68, http://ieeexplore.ieee.org/document/6627397/.
[21] B. Jones et al., A renewed capability for gas puff science onSandia’s Z machine, IEEE Trans. Plasma Sci. 42, 1145(2014).
[22] D. V. Rose, D. R. Welch, T. P. Hughes, R. E. Clark, andW. A. Stygar, Plasma evolution and dynamics in high-power vacuum-transmission-line post-hole convolutes,Phys. Rev. ST Accel. Beams 11, 060401 (2008).
[23] T. D. Pointon, W. L. Langston, and M. E. Savage,Computer simulations of the magnetically insulatedtransmission lines and post-hole convolute of ZR, inProceedings of the 16th IEEE International Pulsed PowerConference, Albuquerque, NM (IEEE, Piscataway, NJ,2007), pp. 165–170, http://ieeexplore.ieee.org/document/4651814/.
[24] D. V. Rose, D. R. Welch, T. P. Hughes, R. E. Clark, C. B.Mostrom, and W. A. Stygar, Plasma formation, evolution,and dynamics in 100 TW vacuum-transmission-line post-hole convolutes, in Proceedings of the 16th IEEEInternational Pulsed Power Conference, Albuquerque,NM (IEEE, Piscataway, NJ, 2007), pp. 171–174, http://ieeexplore.ieee.org/document/4651815/.
[25] D. V. Rose, D. R. Welch, R. E. Clark, E. A. Madrid, C. L.Miller, C. Mostrom, W. A. Stygar, M. E. Cuneo, C. A.Jennings, B. Jones, D. J. Ampleford, and K.W. Struve,ZR-convolute analysis and modeling: plasma evolutionand dynamics leading to current losses, in Proceedingsof the 17th International Pulsed Power Conference,Washington, DC (IEEE, New York, 2009), pp. 1153–1158, http://ieeexplore.ieee.org/document/5386268/.
[26] T. D. Pointon and D. B. Seidel, Current loss in the vacuumsection of the refurbished Z accelerator, in Proceedingsof the 17th International Pulsed Power Conference,Washington, DC (IEEE, New York, 2009), pp. 1159–1164, http://ieeexplore.ieee.org/document/5386319/.
[27] E. A. Madrid, D. V. Rose, D. R. Welch, R. E. Clark, C. B.Mostrom, W. A. Stygar, M. E. Cuneo, M. R. Gomez, T. P.Hughes, T. D. Pointon, and D. B. Seidel, Steady-state
EXPERIMENTAL STUDY OF CURRENT LOSS … PHYS. REV. ACCEL. BEAMS 20, 010401 (2017)
010401-19
modeling of current loss in a post-hole convolute driven byhigh power magnetically insulated transmission lines,Phys. Rev. ST Accel. Beams 16, 120401 (2013).
[28] D. V. Rose, E. A. Madrid, D. R. Welch, R. E. Clark, C. B.Mostrom, W. A. Stygar, and M. E. Cuneo, Computationalanalysis of current-loss mechanisms in a post-hole con-volute driven by magnetically insulated transmission lines,Phys. Rev. ST Accel. Beams 18, 030402 (2015).
[29] J. P. VanDevender, R. W. Stinnett, and R. J. Anderson,Negative ion losses in magnetically insulated vacuum gaps,Appl. Phys. Lett. 38, 229 (1981).
[30] V. V. Alexandrov, E. A. Azizov, S. G. Alikhanov, E. V.Grabovsky, A. P. Lototsky, S. L. Nedoseev, G. M. Oleinik,V. P. Smirnov, V. A. Yagnov, A. M. Zhitlukhin, E. P.Velikhov, V. A. Glukhih, V. C. Kuchinsky, O. P. Pechersky,and P. V. Sasorov, Superfast liner implosion physicsstudy and development of x-ray facility based on900 MJ inductive store, in Proceedings of the 12thIEEE International Pulsed Power Conference (IEEE,Piscataway, NJ, 1999), pp. 754–757, http://ieeexplore.ieee.org/document/823623/.
[31] E. V. Grabovsky et al., Development of x-ray facility“Baikal” based on 900 MJ inductive store and relatedproblems, in Proceedings of the 13th InternationalPulsed Power Conference, Las Vegas, Nevada (IEEE,New York, 2001), pp. 773–776, http://ieeexplore.ieee.org/document/960788/.
[32] V. P. Bakhtin et al., Part testing of the “MOL” stand for the“Baikal” project, in Proceedings of the 15th InternationalPulsed Power Conference, Monterey, California (IEEE,New York, 2005), pp. 394–397, http://ieeexplore.ieee.org/document/4084235/.
[33] W. A. Stygar, M. E. Cuneo, D. I. Headley, H. C. Ives, R. J.Leeper, M. G. Mazarakis, C. L. Olson, J. L. Porter, T. C.Wagoner, and J. R. Woodworth, Architecture of petawatt-class z-pinch accelerators, Phys. Rev. STAccel. Beams 10,030401 (2007).
[34] W. A. Stygar et al., Conceptual designs of two petawatt-class pulsed-power accelerators for high-energy-density-physics experiments, Phys. Rev. ST Accel. Beams 18,110401 (2015).
[35] T. C. Wagoner et al., Differential-output B-dot and D-dotmonitors for current and voltage measurements on a 20-MA, 3-MV pulsed-power accelerator, Phys. Rev. STAccel.Beams 11, 100401 (2008).
[36] J. T. Crow and G. D. Peterson, Recovery of electron sheathcurrent in magnetically self-insulated transmission lines,IEEE Trans. Plasma Sci. 11, 219 (1983).
[37] E. M. Waisman, M. E. Cuneo, R. W. Lemke, D. B. Sinars,and W. A. Stygar, Lower bounds for the kinetic energy andresistance of wire array Z pinches on the Z pulsed-poweraccelerator, Phys. Plasmas 15, 042702 (2008).
[38] R. D. McBride, C. A. Jennings, R. A. Vesey, G. A. Rochau,M. E. Savage, W. A. Stygar, M. E. Cuneo, D. B. Sinars, M.Jones, K. R. LeChien, M. R. Lopez, J. K. Moore, K. W.Struve, T. C. Wagoner, and E. M. Waisman, Displacementcurrent phenomena in the magnetically insulated trans-mission lines of the refurbished Z accelerator, Phys. Rev.ST Accel. Beams 13, 120401 (2010).
[39] E. M. Waisman, R. D. McBride, M. E. Cuneo, D. F.Wenger, W. E. Fowler, W. A. Johnson, L. I. Basilio, R. S.Coats, C. A. Jennings, D. B. Sinars, R. A. Vesey, B.Jones, D. J. Ampleford, R. W. Lemke, M. R. Martin, P.C. Schrafel, S. A. Lewis, J. K. Moore, M. E. Savage, andW. A. Stygar, Voltage measurements at the vacuum post-hole convolute of the Z pulsed-power accelerator, Phys.Rev. ST Accel. Beams 17, 120401 (2014).
[40] W. A. Stygar et al., 55-TW magnetically insulated trans-mission-line system: Design, simulations, and perfor-mance, Phys. Rev. ST Accel. Beams 12, 120401 (2009).
[41] D. J. Ampleford et al., Contrasting physics in wire array zpinch sources of 1–20 keV emission on the Z, Phys.Plasmas 21, 056708 (2014).
[42] D. C. Rovang et al., Pulsed-coil magnet systems forapplying uniform 10–30 T fields to centimeter-scale targetson Sandia’s Z facility, Rev. Sci. Instrum. 85, 124701(2014).
[43] B. T. Hutsel (private communication).[44] J. E. Bailey, A. B. Filuk, A. L. Carlson, D. J. Johnson, P.
Lake, E. J. McGuire, T. A. Mehlhorn, T. D. Pointon, T. J.Renk, W. A. Stygar, and Y. Maron, Measurements ofAcceleration Gap Dynamics in a 20-TW Applied-Magnetic-Field Ion Diode, Phys. Rev. Lett. 74, 1771(1995).
[45] A. B. Filuk, J. E. Bailey, A. L. Carlson, D. J. Johnson, P.Lake, T. A. Mehlhorn, L. P. Mix, T. J. Renk, W. A. Stygar,and Y. Maron, Charge-Exchange Atoms and Ion SourceDivergence in a 20 TW Applied-B Ion Diode, Phys. Rev.Lett. 77, 3557 (1996).
[46] J. E. Bailey, M. D. Knudson, A. L. Carlson, G. S. Dunham,M. P. Desjarlais, D. L. Hanson, and J. R. Asay, Time-resolved optical spectroscopy measurements of shockedliquid deuterium, Phys. Rev. B 78, 144107 (2008).
[47] M. R. Gomez, R. M. Gilgenbach, M. E. Cuneo, R. D.McBride, G. A. Rochau, D. J. Ampleford, J. E. Bailey,A. D. Edens, B. Jones, M. Jones, M. R. Lopez, M. E.Savage, D. B. Sinars, and W. A. Stygar, Spectroscopicmeasurements in the post-hole convolute on Sandia’sZ-machine (invited), in Proceedings of the 18thInternational Pulsed Power Conference, Chicago, Illinois(IEEE, New York, 2011), pp. 688–695, http://ieeexplore.ieee.org/document/6191564/.
[48] R. B. King, Relative transition probabilities of the Swanbands of carbon, Astrophys. J. 108, 429 (1948).
[49] D. V. Rose, D. R. Welch, C. L. Miller, R. E. Clark,E. A. Madrid, C. B. Mostrom, T. C. Wagoner, J. K. Moore,W. A. Stygar, J. E. Bailey, T. J. Nash, G. A. Rochau, andD. B. Sinars, 107-A load-current B-dot monitor: Simula-tions, design, and performance, Phys. Rev. ST Accel.Beams 13, 040401 (2010).
[50] M. E. Cuneo, P. R. Menge, D. L. Hanson, W. E. Fowler,M. A. Bernard, G. R. Ziska, A. B. Filuk, T. D. Pointon,R. A. Vesey, D. R. Welch, J. E. Bailey, M. P. Desjarlais,T. R. Lockner, T. A. Mehlhorn, S. A. Slutz, and M. A.Stark, Results of vacuum cleaning techniques on theperformance of LiF field-threshold ion sources on extrac-tion applied-B ion diodes at 1–10 TW, IEEE Trans. PlasmaSci. 25, 229 (1997).
M. R. GOMEZ et al. PHYS. REV. ACCEL. BEAMS 20, 010401 (2017)
010401-20
[51] R. W. Stinnett, G. R. Allen, H. P. Davis, T. W. Hussey, G. J.Lockwood, M. A. Palmer, L. E. Ruggles, A. Widman,H. N. Woodall, and R. D. Bengtson, Cathode plasmaformation in magnetically-insulated transmission lines,IEEE Trans. Electr. Insul. EI-20, 807 (1985).
[52] M. Jones (private communication).[53] M. R. Gomez, S. B. Hansen, K. J. Peterson, D. E. Bliss,
A. L. Carlson, D. C. Lamppa, D. G. Schroen, and G. A.Rochau, Magnetic field measurements via visible spectros-copyontheZmachine,Rev.Sci. Instrum.85,11E609(2014).
[54] M. E. Cuneo, The effect of electrode contamination,cleaning and conditioning on high-energy pulsed-powerdevice performance, IEEE Trans. Dielectr. Electr. Insul. 6,469 (1999).
[55] M. E. Cuneo, R. M. Gilgenbach, and M. L. Brake, Spectro-scopic study of anode plasmas in a microsecond electronbeam diode, IEEE Trans. Plasma Sci. 15, 375 (1987).
[56] http://www.prism‑cs.com.[57] V. V. Ivanov, P. J. Laca, B. S. Bauer, R. Presura,
V. I. Sotnikov, A. L. Astanovitskiy, B. Le Galloudec, J.Glassman, and R. A. Wirtz, Investigation of plasma evolu-tion in a coaxial small-gap magnetically insulatedtransmission line, IEEE Trans. Plasma Sci. 32, 1843 (2004).
[58] T. J. Awe, B. S. Bauer, S. Fuelling, I. R. Lindemuth,and R. E. Siemon, Experimental investigation of thermal
plasma formation from thick aluminum surfaces by pulsedmultimegagauss magnetic field, Phys. Plasmas 17, 102507(2010).
[59] S. A. Chaikovsky, V. I. Oreshkin, I. M. Datsko, N. A.Labetskaya, and N. A. Ratakhin, Skin explosion of dou-ble-layer conductors in fast-rising high magnetic fields,Phys. Plasmas 21, 042706 (2014).
[60] M. A. Gigosos and V. Cardenoso, New plasma diagnosistables of hydrogen Stark broadening including ion dynam-ics, J. Phys. B 29, 4795 (1996).
[61] C. Thoma, T. C. Genoni, D. R. Welch, D. V. Rose, R. E.Clark, C. L. Miller, W. A. Stygar, and M. L. Kiefer,Numerical simulation of cathode plasma dynamics inmagnetically insulated vacuum transmission lines, Phys.Plasmas 22, 032101 (2015).
[62] K. J. Peterson, D. B. Sinars, E. P. Yu, M. C. Herrmann,M. E. Cuneo, S. A. Slutz, I. C. Smith, B. W. Atherton,M. D. Knudson, and C. Nakhleh, Electrothermal instabilitygrowth in magnetically driven pulsed power liners, Phys.Plasmas 19, 092701 (2012).
[63] R.W. Stinnett, M. A. Palmer, R. B. Spielman, and R.Bengtson, Small gap experiments in magnetically insulatedtransmission lines, IEEE Trans. Plasma Sci. 11, 216(1983).
[64] D. C. Rovang (private communication).
EXPERIMENTAL STUDY OF CURRENT LOSS … PHYS. REV. ACCEL. BEAMS 20, 010401 (2017)
010401-21