Embed Size (px)
Citation preview

Journal of Rehabilitation in Civil Engineering 7-4 (2019) 01-17
DOI: 10.22075/JRCE.2018.14532.1266
Journal homepage: http://civiljournal.semnan.ac.ir/
Experimental Strengthening of the Two-way
Reinforced Concrete Slabs with High Performance
Fiber Reinforced Cement Composites (HPFRCC)
Prefabricated Sheets
M.M. Fallah1, M. K. Sharbatdar
2* and A. Kheyroddin
3
1. Ph.D. Candidate, Faculty of Civil Engineering, Semnan University, Semnan, Iran
2. Associate Professor, Faculty of Civil Engineering, Semnan University, Semnan, Iran
3. Professor, Faculty of Civil Engineering, Semnan University, Semnan, Iran
Corresponding author: [email protected]
ARTICLE INFO
ABSTRACT
Article history:
Received: 19 April 2018
Accepted: 14 July 2018
Reinforced concrete structures need to be strengthened and
retrofitted for various reasons, including errors during design
and/or construction, so in most cases strengthening of
structural elements is much more economical than rebuilding
the structure. Using HPFRCC with tensile stiffening
behavior has been developed to strengthen the concrete
structures over the recent few years. In this paper, the usage
of HPFRCC for strengthening two-way reinforced concrete
slabs has been studied. A total of five two-way slabs were
constructed and tested to reach their own collapse stage, one
of specimen was as non-strengthened control slab, and the
others were strengthened in various forms. The strengthening
was carried out in two ways; by installing precast plate in the
tensile area and the other by installing precast plate in both
tensile and compression area at two different percentages of
the fiber. The bending behavior, cracking, yielding and
rupture of the experimental specimens were evaluated. The
results indicated that the installation of HPFRCC pre-
fabricated laminates significantly improved the bending
performance of reinforced slabs, so that the ductility, energy
absorption value, cracking strength, and initial hardness of
the slabs was increased and the crack width was decreased.
Therefore, the proposed precast HPFRCC sheets can be used
to strengthening the deficient slabs.
Keywords:
Two-Way Slab,
Poly Propylene Synthetic,
Fibers (PPS)Fibers,
Reinforcement,
HPFRCC,
Bending Performance,
Strengthening.
1. Introduction
For various reasons such as designing and/or
construction errors, material deterioration in
aggressive environment condition, damage
due to earthquake, converting the application
of structure as well as the loss of part of

2 M.M. Fallah et al./ Journal of Rehabilitation in Civil Engineering 7-4 (2019) 01-17
structural strength due to the corrosion of
steel bars, many RC structures needs to be
strengthened and retrofitted, and on the other
hand, strengthening the structural members is
much more economical than reconstructing
the structure in most cases. For this purpose
strengthening the RC structures has been
much progressed during the recent years.
However, few researches have been
conducted on RC slabs, especially on
strengthening of two-way slabs [1].
Strengthening the reinforced concrete slabs
has been done by the various ways such as
external post-tensioning, cross-sectional
extending, reinforced cement cover,
techniques of shortening the span, and adding
the complementary supports [1]. In addition
to the traditional strengthening methods, the
performance of steel plates as external bond
[2,3], strengthening with textile reinforced
mortars (TRM)[4, 5], polyurethane cement
composites (PUCs)[6], steel laminates, fibers
reinforced polymer (FRP)[7,8], and the
bonding techniques of these methods
attracted many researchers’ attention.
Although these methods have been used
considerably, but the present disadvantages
such as undesirable shear failure, corrosion
of bonded steel plates [9,10] and heavy
laminates, mismatch in tensile strength and
stiffness of FRP sheets and costly FRP sheets
have led many researchers to perform many
studies during several recent years to use
powerful materials with mechanical and
behavioral properties similar to concrete
instead of the conventional materials, one of
which is (HPFRCC). Namman and Reinhardt
(2003) introduced the materials as HPFRCC
that had tensile strain hardening in strain
stress curve. HPFRCC materials have been
classified separate from fiber-reinforced
concrete (FRC), so that HPFRCC are a
particular type of composites which their
notable sing is the strain hardening behavior
in post-crack tension that are accompanied
with multiple cracks until they reach
relatively large strains [11]. The studies by
Chanvillard and Rigaud (2003) concluded a
tensile strength of 12 MPa and a tensile
ductility of 0.02% - 0.06% [12]. Li's studies
(1993) and Fisher (2003) showed a tensile
strength of 4 to 6 MPa and a tensile ductility
of 3 to 5 % [13,14]. In 2006, the Technical
committee of RILEM decided to emphasize
the strain hardening properties of these
materials, so the name of Strain Hardening
Cementitious Composites (SHCC) was
selected for it [15]. Also, CARDIFRC
materials, developed at Cardiff University,
Wales, are one of a variety of HPFRCCs
innovated by Farhat, Nicolaides,
Kanellopoulos and Karihalloo in 2006, and
compressive strength was observed up to 200
MPa and a tensile strength up to 27 MPa [16]
that main application of these materials is for
repairing and improving the structural
members. Habel And Gauvreau (2008)
compounded concepts of ultra high
performance concrete (UHPC) and fiber
concrete and designed new materials named
as ultra-high performance fiber reinforced
concrete (UHPFRC) that tensile strength,
compressive strength and ultimate tensile
strain are higher than 10 MPa, 150 MPa and
0.005 respectively [17]. In 2009, Yoo et al.
carried out some researches on improvement
of the beam to concrete column connection
behavior. The beam-to-column connection
was strengthened with prefabricated fiber
composite laminate. The results showed that
the initial hardness of the strengthened
sample was reduced, but its resistance
increased by 15%. The amount of energy
depletion has also increased [18]. In the
2015, Hemmati et al., performed
experimental and parametric studies to
M.M. Fallah et al./ Journal of Rehabilitation in Civil Engineering 7-4 (2019) 01-17 3
evaluate the effect of compressive strength,
loading type and tensile reinforcement ratio
on the characteristics of the final deformation
of the reinforced HPFRCC beams, and
showed that if the loading conditions is
changed from concentrated to monotonic
loading, the plastic hinge rotation capacity is
increased [19, 20, 21]. In 2015, Behzard et al.
carried out to investigate the effectiveness of
a novel Near Surface Mounted (NSM)
technique using innovative manually Made
CFRP Rods (MMRs) and manually made
CFRP strips (MMSs) for flexural
strengthening of Reinforced Concrete (RC)
two way slabs with low clear cover
thickness. The test results confirmed the
feasibility and efficacy of this technique in
improving the behavior of the RC two- way
slabs. Strengthened slabs showed an increase
in flexural capacity between 279% and 394%
over the control specimen [22]. In 2016,
Khairaldin et al. have conducted some
researches on increasing the capacity of
reinforced concrete frame using HPFRCC
materials in numerical way. In these models,
the connecting span was replaced by
HPFRCC materials with different tensile and
compressive strengths then was compared
with complete concrete frames and complete
HPFRCC. The results indicated that the use
of these high performance materials can
increase the load-bearing capacity and
ductility of these frames [23]. In 2017,
Abasszade et al. arranged an experimental
programs to investigate the effectiveness of
using two innovative methods near surface
mounted (NSM) techniques and HPFRCC
Composites for improvement RC middle
two-way slabs. The results confirmed the
Strengthened slabs showed an increase in
flexural capacity between 17.5% and 97%
over the control specimen [24].
In recent years, investigations on the
application of HPFRCC materials have been
focused mostly on the cases such as the
effects of bonding conditions between the
substrate concrete and the laminate of
HPFRCC [25], the layer thickness [26], the
fiber volume percentage and the properties of
the HPFRCC mix [27], crack growth and
propagation [28], optimization and
optimization and flexural performance [29,
30] and tensile strain hardening behavior
[31]. Recently, the feasibility of using
HPFRCC for the strengthening of deficient
or damaged slab and beam has been
investigated widely [26, 32, 33]. In this
paper, the feasibility of using HPFRCC
composites has been studied as a
slab and various applications and settings for
HPFRCC have been proposed. Then, the
load-displacement curves obtained from the
tested slabs and some of the parameters of
the flexural performance of them, such as
energy absorption capacity, ductility factors,
initial stiffness and maximum resistance,
were evaluated.
2. Experimental Plan
2.1 Materials Properties
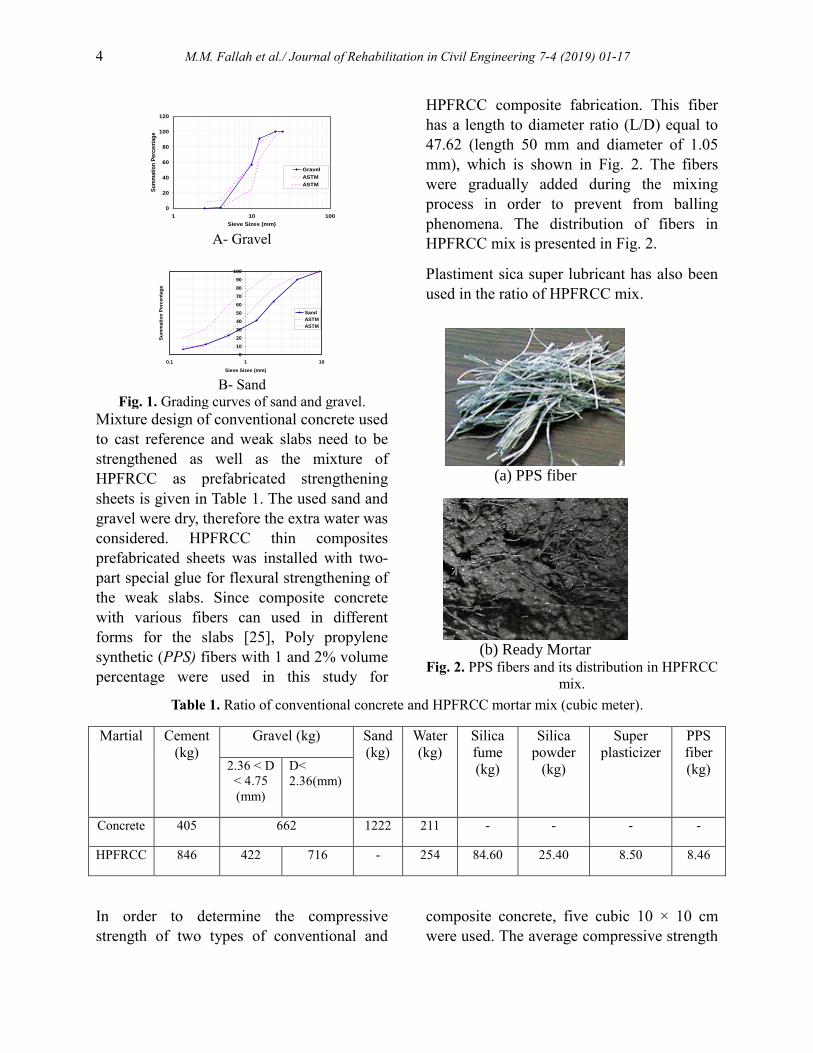
The used gravel in the applied concrete had a
fracture percentage of 47% located in the
sieve range of 0.5 inches (12.5 mm) to the 4
(4.75 mm). The sand used in this test is also
in the blow sieve range of 4 (4.75 mm). The
sand and gravel grading curves is shown in
Fig. 1. The cement used in this test is
Portland type 2 cement.
4 M.M. Fallah et al./ Journal of Rehabilitation in Civil Engineering 7-4 (2019) 01-17
A- Gravel
B- Sand
Fig. 1. Grading curves of sand and gravel.
Mixture design of conventional concrete used
to cast reference and weak slabs need to be
strengthened as well as the mixture of
HPFRCC as prefabricated strengthening
sheets is given in Table 1. The used sand and
gravel were dry, therefore the extra water was
considered. HPFRCC thin composites
prefabricated sheets was installed with two-
part special glue for flexural strengthening of
the weak slabs. Since composite concrete
with various fibers can used in different
forms for the slabs [25], Poly propylene
synthetic (PPS) fibers with 1 and 2% volume
percentage were used in this study for
HPFRCC composite fabrication. This fiber
has a length to diameter ratio (L/D) equal to
47.62 (length 50 mm and diameter of 1.05
mm), which is shown in Fig. 2. The fibers
were gradually added during the mixing
process in order to prevent from balling
phenomena. The distribution of fibers in
HPFRCC mix is presented in Fig. 2.
Plastiment sica super lubricant has also been
used in the ratio of HPFRCC mix.
(a) PPS fiber
(b) Ready Mortar
Fig. 2. PPS fibers and its distribution in HPFRCC
mix.
Table 1. Ratio of conventional concrete and HPFRCC mortar mix (cubic meter).
Martial Cement
(kg)
Gravel (kg) Sand
(kg)
Water
(kg)
Silica
fume
(kg)
Silica
powder
(kg)
Super
plasticizer
PPS
fiber
(kg) 2.36 < D
< 4.75
(mm)
D<
2.36(mm)
Concrete 405 662 1222 211 - - - -
HPFRCC 846 422 716 - 254 84.60 25.40 8.50 8.46
In order to determine the compressive
strength of two types of conventional and
composite concrete, five cubic 10 × 10 cm
were used. The average compressive strength
0
20
40
60
80
100
120
1 10 100
Sieve Sizes (mm)
Su
mm
ati
on
Pe
rce
nta
ge
Gravel
ASTM
ASTM
0
10
20
30
40
50
60
70
80
90
100
0.1 1 10
Sieve Sizes (mm)
Su
mm
ati
on
Perc
en
tag
e
Sand
ASTM
ASTM

M.M. Fallah et al./ Journal of Rehabilitation in Civil Engineering 7-4 (2019) 01-17 5
of the cube samples of the conventional
concrete and HPFRCC concrete were equal
to 23.5 and 74.5 MPa, respectively and the
equivalent value of cylindrical samples of
these two types of concrete were
approximately 19 and 59 MPa. Steel bars
with a diameter of 10 mm were selected from
the type of thread class of AII, which the
yielding strength of the rebar obtained using
uni-axial tension tests was equal to 366 MPa.
2.2 Experimental Specimens and Set-Up
Five simple-supported rectangular two-way
RC slabs with a geometric dimension length
of 1500mm, width 1500mm and depth
100mm were constructed and tested. Two-
way slabs with a low ratio longitudinal bar
were designed to achieve flexural dominate
failure and preventing any possible punch
shear failure, the two-way slabs with a
reinforcement ratio of 1% and higher are
prone to shear failure caused by punching
[34] ,thus in order to ensure prediction of
flexural failure mode in the slabs and to
investigate the effects of the strengthening
technique, the slabs were designed with a
low reinforcement ratio about the minimum
reinforcement ratio (0.2%) according to
regulation of ACI 318-99 [33]. Therefore, 5
steel rebars with a diameter of 10 mm, at a
distance of 130 mm on each side, with an
average effective depth of 75 mm, have been
placed in a layer near the slab tensile face.
The anchorage of bars was provided by 180
degree hooks at both ends. The general
layout of a test samples and steel
reinforcement details are shown in Figure 3.
The specimen details are given in Table 2.
One of these five specimens was as non-
strengthened weak reference (control slab)
named M and four other similar specimens
were strengthened with different techniques.
Two specimens of the second (MB1) and
fourth (MA1) were strengthened with
HPFRCC composites sheets contained 1%
fibers and two specimens of the third (MB2)
and fifth (MA2) specimen were fabricated
with HPFRCC composites contained 2%
fiber. In the second and third specimens, the
composite cover was installed only on the
lower tensile face of slab and in the fourth
and fifth specimens simultaneously the
composite sheets was installed on the tensile
and compressive face of the slab, more
complete details are shown in Figure 4.
HPFRCC composites were individually
fabricated in a mold with dimensions of 1000
x 1000 x 30 mm and, after reaching the age
of 28 days, they were installed to the slabs
faces with special two-component adhesives.
In order to connect properly, firstly the slab
surfaces are grinded and completely
smoothed.
Fig. 3. General layout of a test specimen and
details of steel reinforcements.

6 M.M. Fallah et al./ Journal of Rehabilitation in Civil Engineering 7-4 (2019) 01-17
(a) Composite with fiber 1% to strengthen
the tensile face (MB1)
(b) Composite with fiber 1% to strengthen
tensile and compressive face (MA1)
(c) Composite with fiber 2% for
strengthening tensile face (MB2)
(d) composite with 2% fiber to strengthen
tensile and compressive face (MA2)
Fig. 4. Layout of strengthened forms.
Table 2. The Details tested specimens and strengthening methods.
Fibre volume
percentage (%) Lower layer Upper layer Type of
concrete slab Name of
slab Specimen
No. 2 1 composite laminate HPFRCC composite laminate HPFRCC Mean - - - - M 1
- - MB1 2
- - MB2 3
- MA1 4
- MA2 5
First, the considered strengthened and non-
strengthened slabs are placed on four 1,350
mm steel rollers embedded on top of the
supporting frame as a roller support along the
edges. A 500 kN hydraulic jack was used to
test the slab failure under monotonic loading.
These loads were transmitted to the slab
using a distributor steel beam, through four
loading points shown in Figure 5. The
loading points and supports were selected to
provide an effective 1,350 mm span and a
300 mm slit opening in both directions, as
shown in Figure 5. Vertical displacements of
the each tested specimen were measured at

M.M. Fallah et al./ Journal of Rehabilitation in Civil Engineering 7-4 (2019) 01-17 7
different positions in two directions
perpendicular to each other using the linear
variable displacement transducer (LVDT)
mounted on a rigid metal base placed
individually below the slab, shown in Figure
6. One of the LVDTs is placed below the
center of the slab and the four LVDTs were
placed in the direction of the central lines of
the slab to measure the raise at 300 and 550
mm from the center of the slab.
b) real a) shematic Fig. 5. Layout of general test setup.
Fig. 6. Location of LVDTs.
3. Results and Discussion
The results obtained from the experiments
are presented in the later sections as the load-
displacement curves, the comparison of the
failure modes, the cracking pattern, values of
strength loads, displacement and energy
ductility, the excessive resistance and the
maximum resistance.
3.1. Load Displacement Response
The load-displacement response curves of the
control weak reference specimen in
comparison with the other four slabs which
have been strengthened with HPFRCC
composites are illustrated in Figure 7. The
maximum displacement recorded at the
centre of the slab in each loading stage is
used to draw the load-displacement curve.

8 M.M. Fallah et al./ Journal of Rehabilitation in Civil Engineering 7-4 (2019) 01-17
(b) reference and MA1 slabs
(a) the reference and MA2 slabs
(d) reference and MB1 slabs
(c) reference and MB2 slabs
Fig. 7. Load-displacement curves of weak reference slab in comparison with the strengthened slabs.
A summary of the results from the
experiments, including the cracking, yielding
and ultimate load and their corresponding
displacements (the centre) have been
presented for all specimens in Tables 3 and 4.
In the mentioned tables ,
Pcr and cr
respectively, load and displacement
corresponding to the cracking load, and yP
y
determine the yielding load and the
displacement corresponding to the yielding
load, and maxP and max are the maximum
load and raise corresponding to it, uP and
u ultimate loading capacity and
displacement corresponding to the ultimate
slab load. Indeed u indicates the slab load
displacement in 20% load drop after the
maximum load. In yP & y value the
proposed method of Park Robert have been
used, as shown in Figure 8. In general, the
load-displacement response is divided into
two stages before cracking and the post-
cracking stage. The cracked stage can be
divided into two stages such as before yield
and after yield stages. The cracked stage
before yield is from cracking load ( crP ) to
yield load ( yP ).The cracked stage, after
yield, continues from the yield ( yP ) to the
ultimate load ( uP ).

M.M. Fallah et al./ Journal of Rehabilitation in Civil Engineering 7-4 (2019) 01-17 9
Table 3. Load -displacement response parameters of slabs in cracking and yielding resistances.
Specimen
Cracking Initial
stiffness
ki(kN/mm)
wi
i
k
k
Yield
wy
y
P
P
Yield
stiffness
ky (kN/mm) wy
y
k
k
Δcr
(mm)
Pcr
(kN)
Δy
(mm)
Py
(kN)
Control(M)
(M)
0.8 21.60 27 1 17.50 157.7 1 9.01 1
MB1 1.14 67.17 58.92 2.18 14.35 160.5 1.02 11.18 1.23
MB2 1.33 73.16 55.01 2.04 9.5 165.56 1.05 17.43 1.92
MA1 1.72 85.83 49.90 1.85 10.90 178.6
.
1.13 16.38 1.80
MA2 1.88 80 42.55 1.58 12.65 179.2 1.14 14.17 1.56
Table 4. Load - displacement response parameters of slabs in maximum and ultimate resistances.
Mu
u
K
K
Ultimate
stiffness
uk
(kN /mm)
Ultimate
Mk
k
max
max
Maximum
stiffness
maxk
)/( mmkN
MP
P
max
max
Maximum
Specimen
Pu
(kN)
Δu
(mm) maxP
(kN)
Δmax
(mm)
1 2.97 144 48.52 1 5.38 1 180 33.47 Control
(M) 1.07 3.18 145.86 45.80 1.25 6.71 1.01
182.3
3 27.18 MB1
1.21 3.59 159.60 42.05 2.01 10.81 1.11 199.5 18.45 MB2
1.25 3.72 168.53 45.30 1.08 5.80 1.17 210.6
7
36.30 MA1
1.09 3.24 176.26 54.35 1.26 6.80 1.22 220.3
3 32.42 MA2
Since the visual observation of the first
cracking in the under face of the slab is not
possible with sufficient precision, the first
cracking load can be accepted as the point
where the load-displacement response from
the initial elastic response is diverted.
Yielding load can be defined as the load that
leads to strain in steel bars equal to the yield
curve measured from the tension tests. Also,
in the yield load, there is a significant change
in the slope of the load-displacement curve.
The ultimate load is the maximum tolerable
load by the specimen (load bearing capacity
of specimen). By observing the load-
displacement response curves it can be seen
that the strengthened slabs had the initial
hardness far more than the reference slab
from the first stage. Also, in all samples, the
yield strength and maximum and finally the
ductility and energy absorption rate have
been improved significantly.
Fig. 8. determiner Curve of the yield resistance
by Park Robert method [35].

10 M.M. Fallah et al./ Journal of Rehabilitation in Civil Engineering 7-4 (2019) 01-17
3.2. Comparison of Failure Mode and
Cracking Pattern
By comparing the failure patterns of the
specimens in Figures 9 and 10, it was
observed that the strengthened specimens
showed a more ductility behaviour than the
control specimen. All strengthened
specimens had a lower crack width than the
control specimen, the reason for this was the
effect of strengthening HPFRCC in
preventing the crack propagation. Also, by
comparing the load- displacement response
of the specimens in Figure 7 and the results
presented in Table 3, it can be seen that
resistance to cracking and initial stiffness of
the specimens were increased by
strengthening with HPFRCC. An increase in
cracking load in the strengthened specimens
compared with control slab is attributed to
the role of strengthened with HPFRCC
composites in limiting the growth of cracks.
Cracking patterns in the tensile face (lower)
of the control specimen in the failure stage
are shown in Figure 10. The first crack in the
control slab, which is simulator of a weak
slab behaviour in bending, occurred in the
form of a shield (Y) (pre-cracking stage).
After the first crack and the slope change of
the load displacement curve, which represent
the initial stiffness of the slab, the pre-yield
cracking stage is begun, which continues
until the yield of the tensile reinforcements.
After yielding of steel bars, the slab is
entered the third part of the behavioural
curve which is strain hardening. In this area,
with increasing the applied load, the length
of the flexural cracks reaches the edges then
it turns into shear cracks with a 45 degree
angle at the sides. These cracks were
expanded with increasing force and reach
themselves to the pressure section of the slab.
Also, by comparing the cracking patterns in
this section and the load-displacement
response in section 3.1, it can be seen that the
behaviour of the MB1 and MB2 slabs in the
pre-cracking stage was quite similar to that of
the control slab. Due to the presence of
composites, these slabs were flowed at higher
yield load, but the behaviour of the MA1 and
MA2 slabs in the pre-cracking stage was
different from the control slab and showed a
great stiffness at this stage.
Fig. 9. The expansion of the flexural cracks and their movement toward the edge of the control slab.

M.M. Fallah et al./ Journal of Rehabilitation in Civil Engineering 7-4 (2019) 01-17 11
(b) slab MA2
slab MA1
(d) slab MB2
(c) slab MB1
Fig. 10. The expansion of the flexural cracks in the strengthened slabs.
3.3. Comparison of the Loads and Stiffness
The comparison of the cracking load (Pcr),
yielding load (Py), ultimate load (Pu) and
their corresponding displacements (∆cr), (∆y)
and (∆u) for all specimens are shown in
Figures 11 and 12, respectively. Also,
comparison of the stiffness of the specimens
at three cases of (kcr), (ky) and (ku) are shown
in Figure 13. As expected, the initial stiffness
(ki), which was calculated through the load-
displacement curve as the tangent stiffness of
the un-cracked stage, all strengthened slabs
had a higher value compared to the reference
slab, and increase in the initial stiffness was
due to increased cracking resistance and
indicated the effect of HPFRCC composites.
The strengthened slabs also received higher
cracking values from range of 67.17 kN in
slab MB1 to 83.8 kN in slab MA1. A further
increase in cracking load was observed in the
strengthened slabs with a 1 and 2% fibre
content was closed to each other and had a
slight difference. This issue was also true for
yield and maximum loads of the strengthened
slabs, indicating that increasing the fibre
higher than 1% in slab load bearing was not
very effective, while the increase in load in
two-way strengthened slabs is significant
compared to one-way strengthened slabs.
According to the diagrams in all samples, the
amount of displacement was increased in
cracking load and decreased in yield load.
Decrease in the amount of displacement in

12 M.M. Fallah et al./ Journal of Rehabilitation in Civil Engineering 7-4 (2019) 01-17
the strengthened specimen was due to the
hardening effects of the HPFRCC
composites.
Fig. 11. Comparison of loads ratio in cracking,
yielding and ultimate modes.
Fig. 12. Comparison of displacement ratio in
cracking, yielding and ultimate modes.
Fig. 13. Comparison of stiffness ratio in cracking,
yielding and ultimate modes.
3.4. Energy Absorption
The energy absorption capacity of the slabs is
evaluated by the area under the load-
displacement curve. To compare the effect of
different types of HPFRCC composites on
increasing of weak slab strength, the
tolerance values are calculated in Table 5 and
are drawn in Figure (14). As can be seen,
energy absorption capacity has been
increased in all slabs. So that the energy
absorption ratio was increased by 1 to 5
percent in slab strengthened only at the lower
part and 23 to 50 percent in the slabs
strengthen at the top and bottom.
Table 5. Energy absorption capacity, and ductility of the slabs.
wR
R
Excessive
resistance
factor
R=(Pmax/Py)
w
y
u
%80
WE
E
%)80(
%)80(
y
u
EE
E %80
Energy
absorption
of each
specimen
to reference
Energy
absorption
(kN.mm)
Strengthen
specimens
1 1.14 1 2.77 1 4.07 1 6794.95 Control(M)
(W) 1.07 1.22 1.35 3.74 1.04 4.25 1.01 6859.26 MB1
1.06 1.21 1.60 4.43 1.55 6.31 1.05 7119.37 MB2 1.03 1.18 1.50 4.16 1.50 6.11 1.23 8327.61 MA1
1.08 1.23 1.55 4.30 1.49 6.06 1.50 10163.43 MA2
M.M. Fallah et al./ Journal of Rehabilitation in Civil Engineering 7-4 (2019) 01-17 13
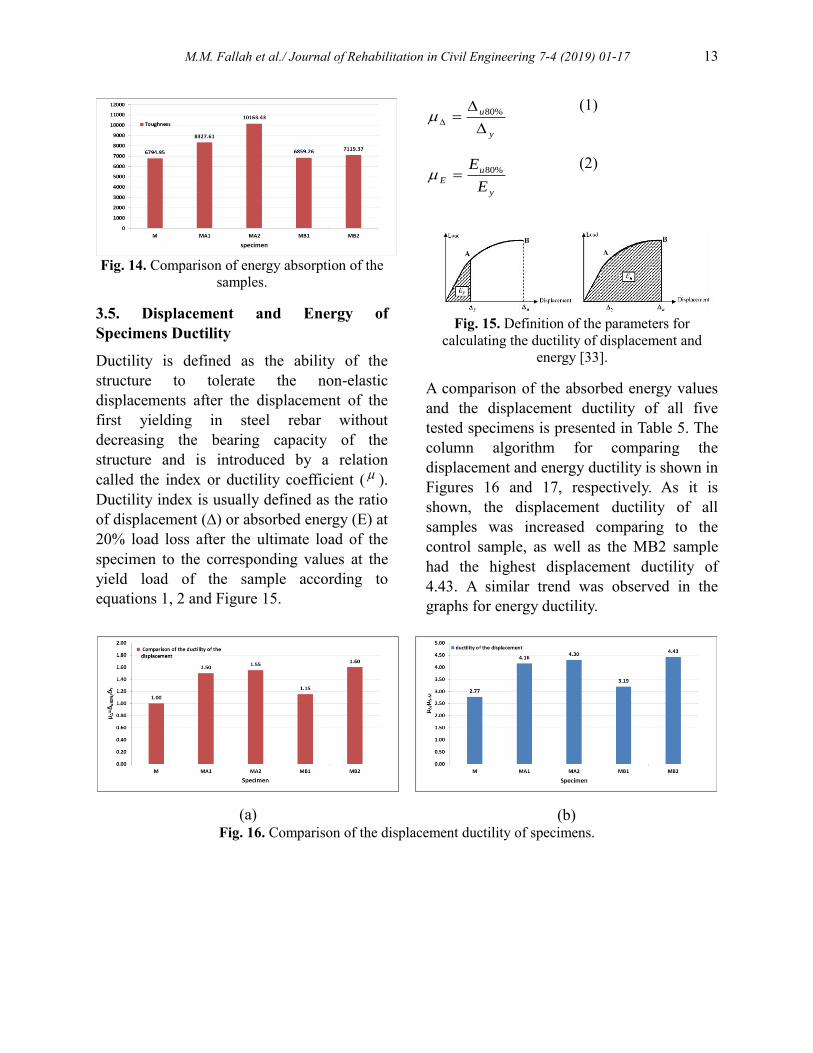
Fig. 14. Comparison of energy absorption of the
samples.
3.5. Displacement and Energy of
Specimens Ductility
Ductility is defined as the ability of the
structure to tolerate the non-elastic
displacements after the displacement of the
first yielding in steel rebar without
decreasing the bearing capacity of the
structure and is introduced by a relation
called the index or ductility coefficient ( ).
Ductility index is usually defined as the ratio
of displacement (∆) or absorbed energy (E) at
20% load loss after the ultimate load of the
specimen to the corresponding values at the
yield load of the sample according to
equations 1, 2 and Figure 15.
(1)
y
u
%80
(2)
y
u
EE
E %80
Fig. 15. Definition of the parameters for
calculating the ductility of displacement and
energy [33].
A comparison of the absorbed energy values
and the displacement ductility of all five
tested specimens is presented in Table 5. The
column algorithm for comparing the
displacement and energy ductility is shown in
Figures 16 and 17, respectively. As it is
shown, the displacement ductility of all
samples was increased comparing to the
control sample, as well as the MB2 sample
had the highest displacement ductility of
4.43. A similar trend was observed in the
graphs for energy ductility.
(b)
(a)
Fig. 16. Comparison of the displacement ductility of specimens.

14 M.M. Fallah et al./ Journal of Rehabilitation in Civil Engineering 7-4 (2019) 01-17
(b)
(a)
Fig. 17. Comparison of the absorption energy ductility in specimens.
Fig16:
My
u ba
,%80
Fig17:
My
uE
E
Eb
E
Ea ,%80
By comparing the ductility values of the
samples in this section and the load-
displacement response in section 3.1, it can
be seen that in samples with higher ductility,
the load bearing capacity decreased with a
more moderate slope and was not
accompanying with any sudden drop.
Conversely, samples that had a lower degree
of ductility exhibited a bitter behaviour, and
the load bearing capacity was fell down
suddenly in these samples.
3.6. Extensive Resistance Factor and
Maximum Resistance
The coefficient of excessive resistance (R),
which is influenced by factors such as the
number of uncertain degrees of the structure,
the strain hardening, the displacement
constraints, the mechanical properties of the
materials, and the strengthening pattern, is
determined by an inelastic response curve,
which is the ratio of maximum to yieldloads
of slabs specimens. The coefficient values of
the excessive resistance are calculated for all
samples and presented in Table 5. As shown
in Figure 18, the maximum coefficient of
excessive resistance of specimens has
increased up to 23% in slab MA2.
Fig. 18. Comparison of the coefficient values of samples resistance.

M.M. Fallah et al./ Journal of Rehabilitation in Civil Engineering 7-4 (2019) 01-17 15
4. Conclusion
The results of experimental research on
application of HPFRCC composite pre-
casted sheets for strengthening of deficient
slabs are presented as following:
1. By comparing the specimen failure modes
and the load-displacement response curves, it
can be seen that the strengthened specimens
exhibited a more ductility behaviour than the
control specimen.
2. All strengthened specimens have a lower
crack width than the control specimen.
3. The cracking strength and initial stiffness
of the specimens strengthened with HPFRCC
were increased due to limiting the expansion
of the cracks, so that the initial stiffness
ratios in the specimens strengthened only at
tensile face were 2.18 and 2.04 times of that
of control sample and this ratios at specimens
strengthened at both tensile and compressive
faces were 1.58 and 1.85.
4. The yield and maximum load were
increased respectively up to 14 and 22% in
all strengthened specimens compared to the
control sample. There was no significant
difference between loads of specimens
strengthened only at tensile face at two cases
of 1 and 2%, but there was difference at 1
and 2% fibre specimens strengthened at both
tensile and compressive faces.
5. The energy absorption values of the slabs
strengthened at both tensile and compressive
faces were increased significantly up to 1.50
times of the energy value in the control slab.
6. The displacement ductility values in all
strengthened specimens were increased up to
60% compared to the control sample.
7. Excessive resistance coefficients in all
slabs were increased up to 23% compare to
control un-strengthened specimen.
REFERENCES
[1] Radomski, W. (2002). Bridge rehabilitation.
London: Imperial College Press.
[2] Zhang, J. Teng, J. Wong, Y. and Lu, Z.
(2001). Behavior of two-way RC slabs
externally bonded with steel plate. Journal
of Structural Engineering, 127(4), 390-
397.
[3] Ebead, U. and Marzouk, H. (2002).
Strengthening of two-way slabs using steel
plates. Structural Journal. 99(1), 23-31.
[4] Papanicolaou, C. Triantafillou, T.
Papantoniou, I. and Balioukos, C. (2009).
Strengthening of two-way reinforced
concrete slabs with textile reinforced
mortars (TRM). In: Proc of the 4th
colloquium on textile reinforced structures
(CTRS4) und zur 1. Anwendertagung.
Eigenverlag: Technische Universität
Dresden, 409–420.
[5] Koutas, L. and Bournas, D. (2016). Flexural
strengthening of two-way RC slabs with
textile-reinforced mortar: experimental
investigation and design equations.
Journal of Composites for Construction.
21(1), 04016065.
[6] Kexin, Z. and Quansheng, S. (2016).
Strengthening of a Reinforced Concrete
Bridge with Polyurethane-cement
Composite (PUC). The Open Civil
Engineering Journal, 10(1), 768-781.
[7] Limam, O. Foret, G. and Ehrlacher, A.
(2003). RC two-way slabs strengthened
with CFRP strips: experimental study and
a limit analysis approach. Composite
Structures, 60(4), 467-471.
[8] Qian, K. and Li, B. (2012). Strengthening and
retrofitting of RC flat slabs to mitigate
progressive collapse by externally bonded
CFRP laminates. Journal of Composites
for Construction, 17(4), 554-565.

16 M.M. Fallah et al./ Journal of Rehabilitation in Civil Engineering 7-4 (2019) 01-17
[9] Jones, R. Swamy, R. and Charif, A. (1988).
Plate separation and anchorage of
reinforced concrete beams strengthened by
epoxy-bonded steel plates. Structural
Engineer, 66(5). [10] Hussain, M. Sharif, A. Bauch, I, Al
Sulaimani, G. (1995) Flexural behavior of
precracked reinforced concrete beams
strengthened externally by steel plates.
Structural Journal, 92(1), 14-23.
[11] Naaman, A. and Rienhardt, H.W. (2003).
Setting the Stage, Toward Performance
Based Classification of FRC Composites.
In: High Performance Fiber Reinforced
Cement Composites (HPFRCC 4), Proc. of
the 4th Int. RILEM Workshop, concrete
journal, 43(6), 57-62.
[12] Chanvillard, G. and Rigaud, S. (2003).
Complete characterization of tensile
properties of Ductal UHPFRC according to
the French recommendations. In:
Proceedings of the 4th International
RILEM workshop High Performance Fiber
Reinforced Cementitious Composites,
RILEM Publications SARL, 21-34. [13] Li, V.C. (1993). From micromechanics to
structural engineering-the design of
cementitous composites for civil
engineering applications.
[14] FISCHER, G. and Shuxin, W. (2003).
Design of engineered cementitious
composites (ECC) for processing and
workability requirements, in: Brittle
Matrix Composites 7. Elsevier, 29-36.
[15] Rosenblueth, E. and Meli, R. (1986). The
1985 Mexico earthquake. Concrete
international, 8(5), 23-34.
[16] Farhat, F. Nicolaides, D. Kanellopoulos, A.
and Karihaloo, B. (2007). High
performance fibre-reinforced cementitious
composite (CARDIFRC)–Performance and
application to retrofitting. Engineering
fracture mechanics, 74(1-2), 151-167.
[17] Habel, K. and Gauvreau, P. (2008).
Response of ultra-high performance fiber
reinforced concrete (UHPFRC) to impact and static loading. Cement and Concrete
Composites, 30(10), 938-946.
[18] Choi, W. Yun, H. Cho, Ch. And Feo, L.
(2014). Attempts to apply high
performance fiber-reinforced cement
composite (HPFRCC) to infrastructures in
South Korea. Composite Structures, 109,
211-223.
[19] Hemmati, A. Kheyroddin, A. and
Sharbatdar, M.K. (2015). Increasing the
flexural capacity of RC beams using
partially HPFRCC layers. Computers and
Concrete, 16(4), 545-568.
[20] Hemmati, A., Kheyroddin, A., Sharbatdar,
M.K., “Flexural Behavior of Reinforced
HPFRCC Beams”, Journal of
Rihabilitation in Civil Engieering, Vol. 1
(2013) 66-77.
[21] Hemmati, A., Kheyroddin, A. and
Sharbatdar, M.K. (2014), “Plastic hinge
rotation capacity of reinforced HPFRCC
beams”, J. Struct. Eng., 141(2),
04014111.
[22] Behzard, P. Sharbatdar, M.K. and
Kheyroddin, A. (2016). A different NSM
FRP technique for strengthening of RC
two-way slabs with low clear cover
thickness. Scientia Iranica A, 23(2), 520-
534. [23] Hemmati, A. Kheyroddin, A. Sharbatdar,
M.K. Park, Y. and Abolmaali, A. (2016).
Ductile behavior of high performance fiber
reinforced cementitious composite
(HPFRCC) frames. Construction and
Building Materials, 115, 681-689.
[24] Abbaszade, M.A. Sharbatdar, M.K. and
Kheyroddin, A. (2017). Strain Hardening
Cementitous Comosites for Retrofitting
Two-Way RC Slabs. Journal of
Fundamental and Applied Sciences, 9(2),
1251-1282.
[25] Alaee, F. (2002). Retrofitting of concrete
structures using high performance fibre
reinforced cementitious composite
(HPFRCC). Cardiff University.
[26] Yun, H.-D. Rokugo, K. Izuka, T. and Lim,
S. (2011). Crack-damage mitigation of RC
one-way slabs with a strain-hardening
cement-based composite layer. Magazine
of Concrete Research, 63(7), 493-509.

M.M. Fallah et al./ Journal of Rehabilitation in Civil Engineering 7-4 (2019) 01-17 17
[27] Naghibdehi, M. Mastali, M. Sharbatdar,
M.K. and Naghibdehi, M.G. (2014).
Flexural performance of functionally
graded RC cross-section with steel and PP
fibres. Magazine of Concrete Research,
66(5), 219-233.
[28] Banthia, N. and Nandakumar, N. (2003).
Crack growth resistance of hybrid fiber
reinforced cement composites. Cement and
Concrete Composites, 25(1), 1-9.
[29] Meng, W. and Khayat, K.H. (2017).
Improving flexural performance of ultra-
high-performance concrete by rheology
control of suspending mortar. Composites
Part B: Engineering, 117, 26-34.
[30] Meng, W. Valipour, M. and Khayat, K.H.
(2017). Optimization and performance of
cost-effective ultra-high performance
concrete. Materials and structures, 50(1),
29.
[31] Li, V.C. Wang, S. Wang, Sh, and Wu, C.
(2001). Tensile strain-hardening behavior
of polyvinyl alcohol engineered
cementitious composite (PVA-ECC). ACI
Materials Journal-American Concrete
Institute, 98(6), 483-492.
[32] Hemmati, A. Kheyroddin, A. and
Sharbatdar, M.K. (2013). Plastic hinge
rotation capacity of reinforced HPFRCC
beams. Journal of Structural Engineering,
141(2), 04014111.
[33] Meng, W. and Khayat, K.H. (2016).
Experimental and Numerical Studies on
Flexural Behavior of Ultrahigh-
Performance Concrete Panels Reinforced
with Embedded Glass Fiber-Reinforced
Polymer Grids. Transportation Research
Record: Journal of the Transportation
Research Board, 2592, 38-44.
[34] Afefy, H. and Fawzy, T.M. (2013).
Strengthening of RC one-way slabs
including cut-out using different
techniques. Engineering Structures, 57,
23-36.
[35] Robert, Park. (1998). Ductility evalution
from laboratory and analytical testing.
Tokyo-Kyoto, JAPAN: Ninth world
Conference on Earthquake Engineering,
606-607.