Embed Size (px)
Citation preview
Experimental procedures
Milling experiments: Milling experiments were performed using a planetary mill
(PM-D0.4L, Droide Instrument & Equipment (Shanghai) Co., Ltd., China) with an air
cycle refrigeration system under different temperatures. Four agate ball milling jars,
with a volume of 50 cm3 and contain 10 balls (ø = 10 mm) of the same material, were
used. Each milling was performed using 1.0 g of the powder to ensure homogeneous
milling and reproducible results. The rotation speed of the solar disk was set to 400
rpm, and alternate milling periods (typically 10 min) with intervals (typically 2 min)
were applied to limit the mechanical heating of the sample. The samples were milled
for different time periods at various temperatures to obtain different solid forms of
glipizide and the samples were detected through XRPD after milled.
Solubility and dissolution testing: The solubility studies of Forms I, II, and III were
conducted by adding an excess of samples (100 mg) in 20 mL of tri-distilled water
and pH 6.8 phosphate buffer solution. The samples were kept on a magnetic stirrer for
48 and 72 h at 25 °C and 37 °C. The solutions were filtered (0.45 μm), diluted, and
analyzed by UV−vis spectrophotometer at 224 nm after stirring for 48 or 72 h. Each
experiment was repeated thrice. SPSS 11.0 software (SPSS, Chicago, IL, USA) was
used for statistical analysis. Statistical comparisons were performed using one-way
ANOVA with Duncan’s multiple range test.
In vitro dissolution studies were conducted using a ZRC-8D dissolution tester
(Chuangxing, Tianjin, China) at 100 rpm and 37±0.5 °C (paddle). Forms I, II, and III
(10 mg) were separately added to 900 mL of dissolution media (tri-distilled water and
pH 6.8 phosphate buffer). Aliquots (5 mL) of the sample solutions were filtered
through a 0.45 μm hydrophilic membrane and analyzed with a UV spectrophotometer
at prescribed times.
Stability studies: The stability of glipizide solid forms was investigated at 25 °C
under different RH levels. RH of 0% was achieved with P2O5 in desiccators; RH of
11.3%, 32.8%, 43.2%, 57.6%, 75.3%, 84.3%, and 97.3% were achieved with the
saturated salt solutions of LiCl, MgCl2, K2CO3, NaBr, NaCl, KCl, and K2SO4 in
desiccators, respectively, at 25 °C.1 The samples were exposed to different RH
conditions and analyzed at regular time intervals.
1 L. Greenspan, J. Res. Nat. Bur. Stand., 1977, 81A, 89-96.
Electronic Supplementary Material (ESI) for CrystEngComm.This journal is © The Royal Society of Chemistry 2016
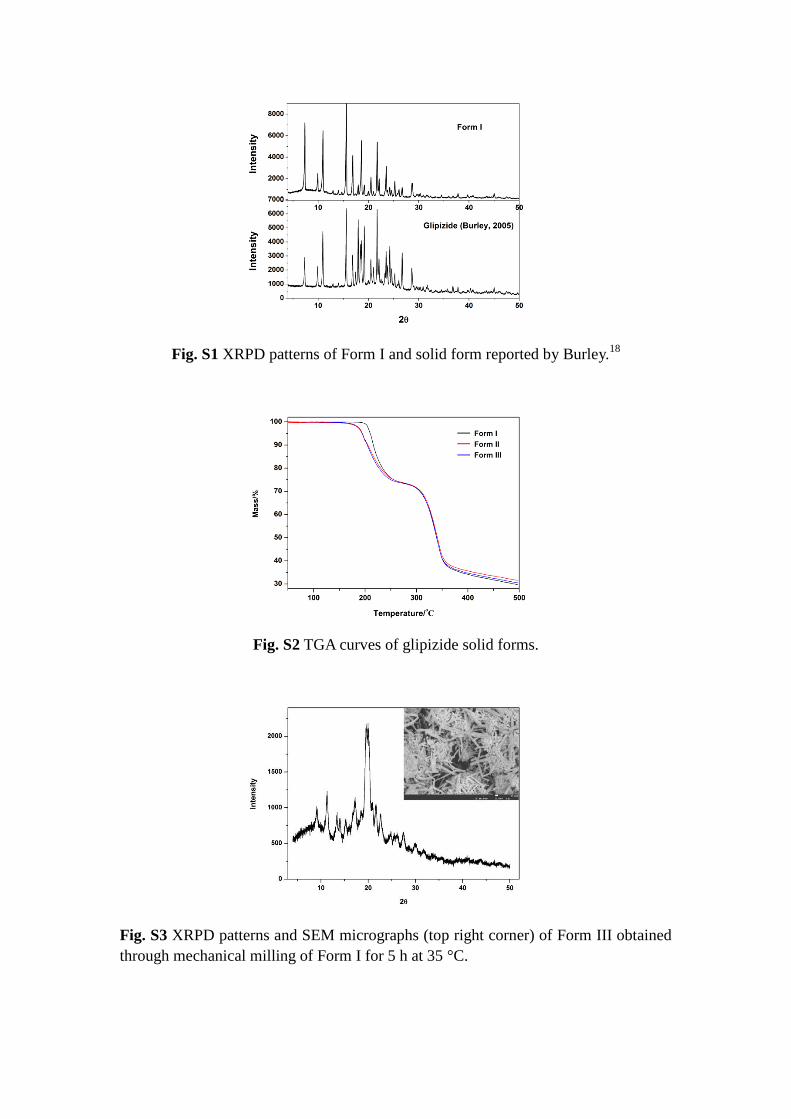
Fig. S1 XRPD patterns of Form I and solid form reported by Burley.18
Fig. S2 TGA curves of glipizide solid forms.
Fig. S3 XRPD patterns and SEM micrographs (top right corner) of Form III obtained
through mechanical milling of Form I for 5 h at 35 °C.
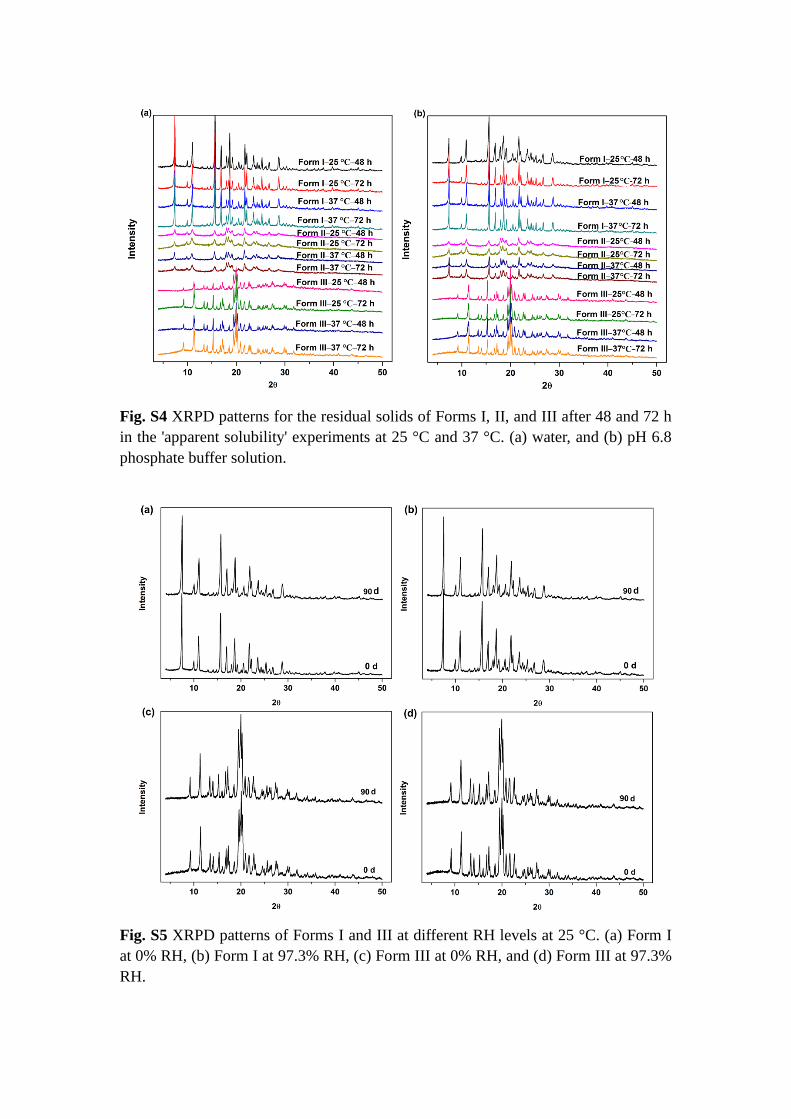
Fig. S4 XRPD patterns for the residual solids of Forms I, II, and III after 48 and 72 h
in the 'apparent solubility' experiments at 25 °C and 37 °C. (a) water, and (b) pH 6.8
phosphate buffer solution.
Fig. S5 XRPD patterns of Forms I and III at different RH levels at 25 °C. (a) Form I
at 0% RH, (b) Form I at 97.3% RH, (c) Form III at 0% RH, and (d) Form III at 97.3%
RH.
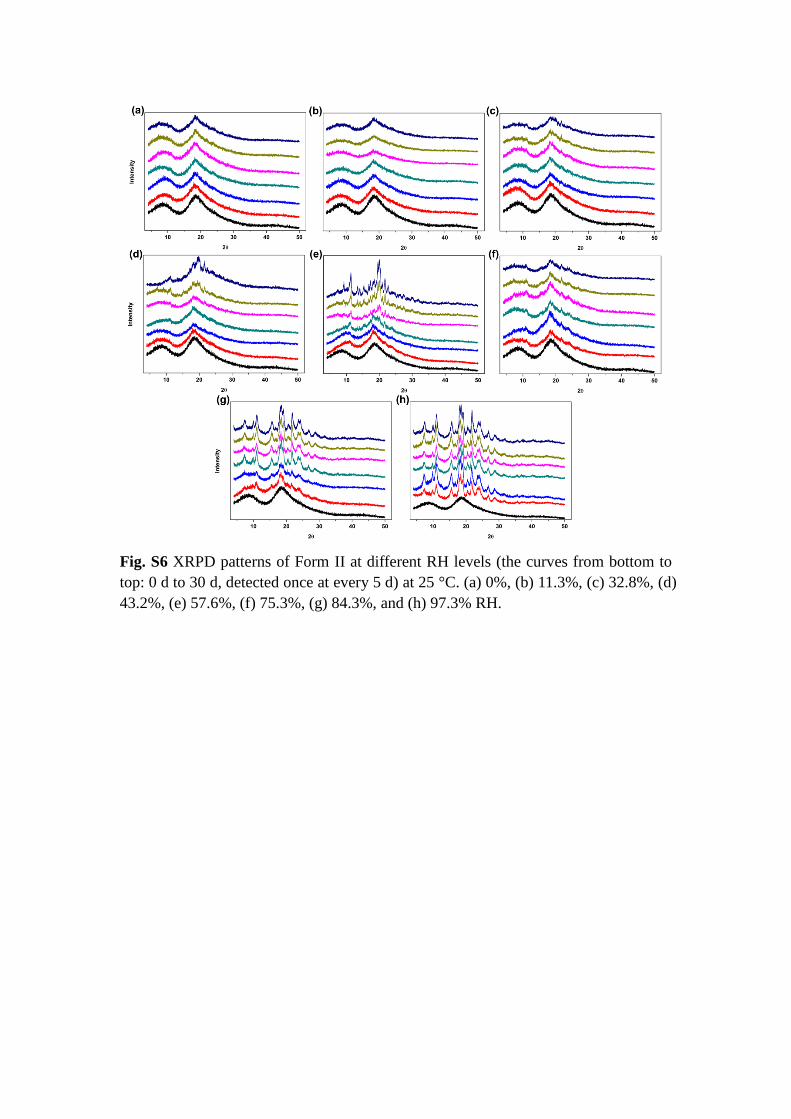
Fig. S6 XRPD patterns of Form II at different RH levels (the curves from bottom to
top: 0 d to 30 d, detected once at every 5 d) at 25 °C. (a) 0%, (b) 11.3%, (c) 32.8%, (d)
43.2%, (e) 57.6%, (f) 75.3%, (g) 84.3%, and (h) 97.3% RH.
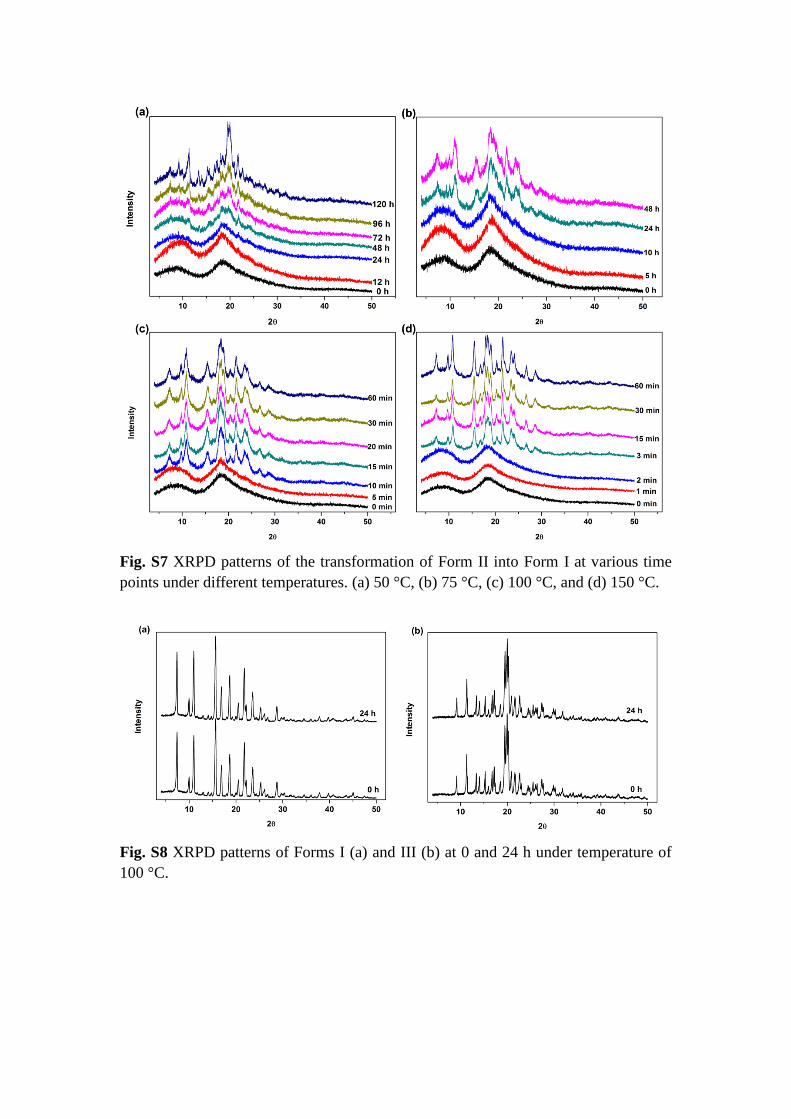
Fig. S7 XRPD patterns of the transformation of Form II into Form I at various time
points under different temperatures. (a) 50 °C, (b) 75 °C, (c) 100 °C, and (d) 150 °C.
Fig. S8 XRPD patterns of Forms I (a) and III (b) at 0 and 24 h under temperature of
100 °C.
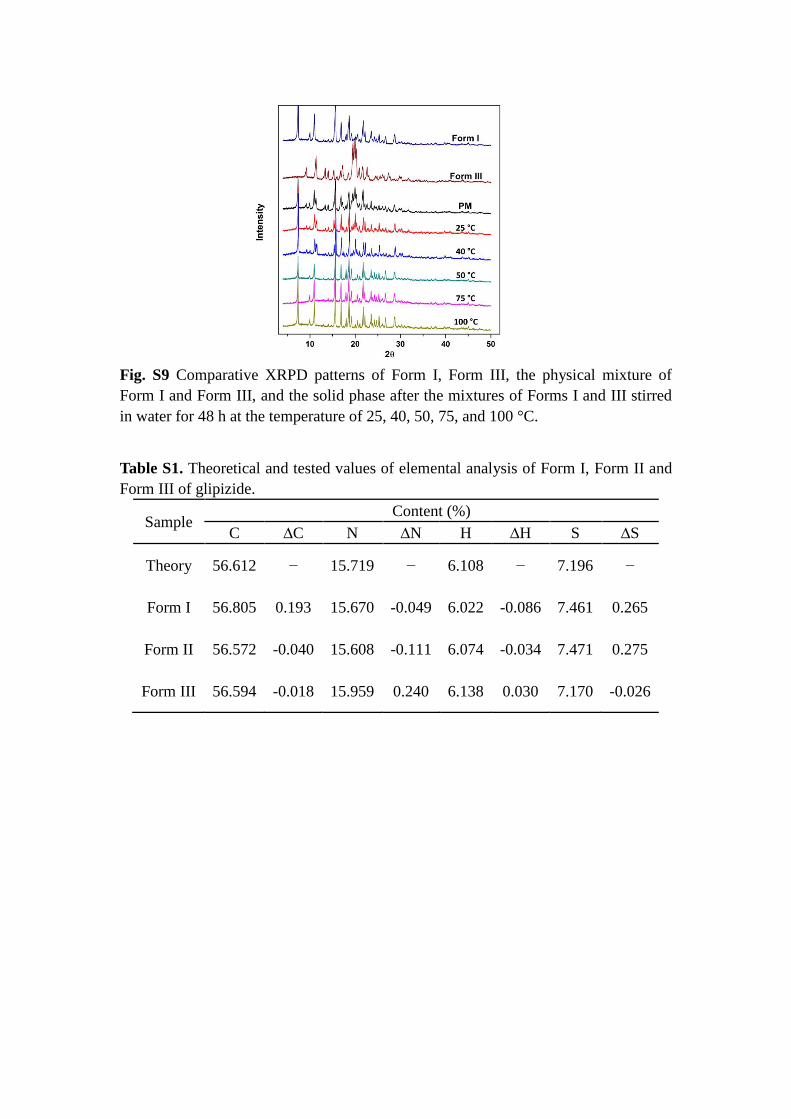
Fig. S9 Comparative XRPD patterns of Form I, Form III, the physical mixture of
Form I and Form III, and the solid phase after the mixtures of Forms I and III stirred
in water for 48 h at the temperature of 25, 40, 50, 75, and 100 °C.
Table S1. Theoretical and tested values of elemental analysis of Form I, Form II and
Form III of glipizide.
Sample Content (%)
C ∆C N ∆N H ∆H S ∆S
Theory 56.612 − 15.719 − 6.108 − 7.196 −
Form I 56.805 0.193 15.670 -0.049 6.022 -0.086 7.461 0.265
Form II 56.572 -0.040 15.608 -0.111 6.074 -0.034 7.471 0.275
Form III 56.594 -0.018 15.959 0.240 6.138 0.030 7.170 -0.026