Embed Size (px)
Citation preview
Experimental observation of the effect ofgeneric singularities in
polychromatic dark hollow beamsBharat Kumar Yadav,1,* Stuti Joshi,2 and Hem Chandra Kandpal1,2
1Optical Radiation Standards, CSIR-National Physical Laboratory, Dr. K.S. Krishnan Road, New Delhi 110012, India2Quantum Optics and Photon Physics, CSIR-National Physical Laboratory, New Delhi 110012, India
*Corresponding author: [email protected]
Received March 26, 2014; revised June 13, 2014; accepted July 20, 2014;posted July 21, 2014 (Doc. ID 208889); published August 15, 2014
This Letter presents the essence of our recent experimental study on generic singularities carrying spatially partiallycoherent, polychromatic dark hollow beams (PDHBs). To the best of our knowledge, this is the first experimentaldemonstration of generic singularities-inducedwavefront tearing in focused polychromatic beams. © 2014 OpticalSociety of AmericaOCIS codes: (030.1640) Coherence; (050.1940) Diffraction; (260.6042) Singular optics.http://dx.doi.org/10.1364/OL.39.004966
Singular optics [1] has emerged as a new branch of optics.Initially, it was confined to monochromatic light-fieldsbut in the last few years its domain has been extended toquasi-monochromatic [2–4], partially coherent [5–8], andspatially partially, polychromatic light-fields [9–14]. Thestudies carried out so far reveal that singularities pos-sessed by polychromatic wave fields manifest themselvesin the form of spectral anomalies [9,10]. However, it iswell known that random fluctuations in polychromaticwave fields tend to move its singular points, leaving nozeros in the average intensity. It has been emphasized thatsuch optical fields do not possess obvious phase singular-ities like monochromatic light-fields; instead, the singular-ities in a polychromatic wave field are hidden for certainfrequencies [11]. Most of the experimental studies re-ported so far have concentrated on the generation of vor-tex carrying beams and their topological properties [3–8].Less attention has been paid to experimental studies ofthe beamswhose topology is not well defined even thoughthey possess singularities, e.g., polychromatic dark hollowbeams (PDHBs). These beams have an average (almostnull) intensity at focus (or core) that is surrounded inall the three dimensions by regions of higher intensity.In this Letter, we report on observations that provide
experimental evidence for the theoretical predictionsmade for the evolution and propagation of generic singu-larities in focused partially spatially coherent wave fields[11–14], generic singularities-induced chromatic effects[10] in the vicinity of focus, and spectral anomalies [9,10].The results from this study might find potential applica-tion in the understanding of the evolution of the achro-matic zone (null intensity region) at the core of PDHBsand chromatic effects at the core as a function of coher-ence and propagation characteristics of generic singular-ities carrying beams in free-space. A schematic of theoptical setup used is shown in Fig. 1. The beams wereproduced using the well known axicon-lens system [15].The light emerging from a tungsten halogen lamp S (24 V,10 A) was allowed to fall on an aperture A1 (diameterd � 0.50 mm) through a broadband filter F (peak wave-length λ0 � 556 nm). A spatially incoherent, polychro-matic Gaussian source of uniform brightness was
produced at the aperture plane AP . The light became spa-tially partially coherent after propagating for a distancez1 (≈560 mm� in free-space. The light impinged upon thefacet of the axicon (which is made of BK7 glass; the angleγ between the conical surface and flat surface is 1°). Theresultant light beam was further focused by a positivelens L (focal length f � 120 mm) and a PDHB was gen-erated at the back focal plane of L.
To generate PDHBs with different states of coherence,four apertures A1, A2, A3, and A4 with diameters of 0.50,0.10, 0.05, and 0.02 mm, respectively, were used. Therespective coherence lengths (LC) were estimated tobe ≈100 μm, ≈498 μm, ≈996 μm, and ≈2491 μm usingthe formula 0.16λ0z1∕d. By changing the apertures, theLC ; was varied by approximately 5, 10, and 25 times ofthe LC ; produced with A1 for comparison purposes.For convenience, the beams produced with these aper-tures were designated as B1, B2, B3, and B4.
The study was carried out in two parts. In the first seg-ment, the beams were analyzed for the impact of genericsingularities on the focused wave field. For this purpose,a CCD (3.4 μm × 3.4 μm pixel size mounted on a micro-scaled moveable platform) was used to record the spatialintensity distribution of the beams at different distancesalong the z axis. In the second part, intensity profiles andspectra in the x-and z-planes across the cross sections ofthe beams were recorded and investigated simultane-ously. For these observations, the setup was slightlymodified. A beam splitter BS was introduced after L tosplit the resultant beam into two branches. To recordthe spectra and the cross sections of the beams concur-rently, a portable spectrometer (SM, Shamrock Sr-303i)
Fig. 1. Schematic diagram of the experimental setup.
4966 OPTICS LETTERS / Vol. 39, No. 16 / August 15, 2014
0146-9592/14/164966-04$15.00/0 © 2014 Optical Society of America
and the CCD were placed on movable platforms alongthe z axis and x axis, respectively (Fig. 1). The dashedarrows indicate the direction of movements. The slitopening of the spectrometer was adjusted at 10 μm.Throughout the observations, f , z1, and z2 separation be-tween A and lens L were fixed while z (distance along thez axis and direction of beam propagation) and d werevariable. The observations were taken from z � 150 mmto z � 450 mm at 10 mm intervals. However, to capturesome significant cross sections of the beams, the stepsize was varied in some cases. The observations wererepeated and reproduced several times for all the beamsto confirm the results. Theoretically, the transverseelectric field distribution of the Gaussian beam withamplitude E0 and radius w falling on A is given byE�r� � E0 exp�−r2∕w2�, where r is the radial distanceperpendicular to the z axis. The PDHBs were producedunder the condition z2 < f . The on-axis field of the poly-chromatic beam after passing through the axicon-lenssystem can be given by [15]
E�0; λ; z� � −
2πiλB
E0 exp�ikz��12μ
−
ib4μ
���π
μ
rexp
�b2
4μ
�
×�1 − ϕ
�ib
2���μ
p���
; (1)
where μ � 1∕w2− ikA∕2B, b � 2πn tan�γ�∕λ, A and B are
the elements of the ABCD matrix, and k is the wavenum-ber, which is related to the λ by k � 2π∕λ. The on-axisintensity in the propagation direction can be given by
I�0; λ; z� � S�λ�jE�0; λ; z�j2: (2)
Here, S�λ� � exp�−�λ0 − λ�2λ20∕σ2λ2� indicates the Gaus-sian distribution for polychromatic light and σ representsthe frequency separation at FWHM. The final axial inten-sity can be expressed as I�z� � R
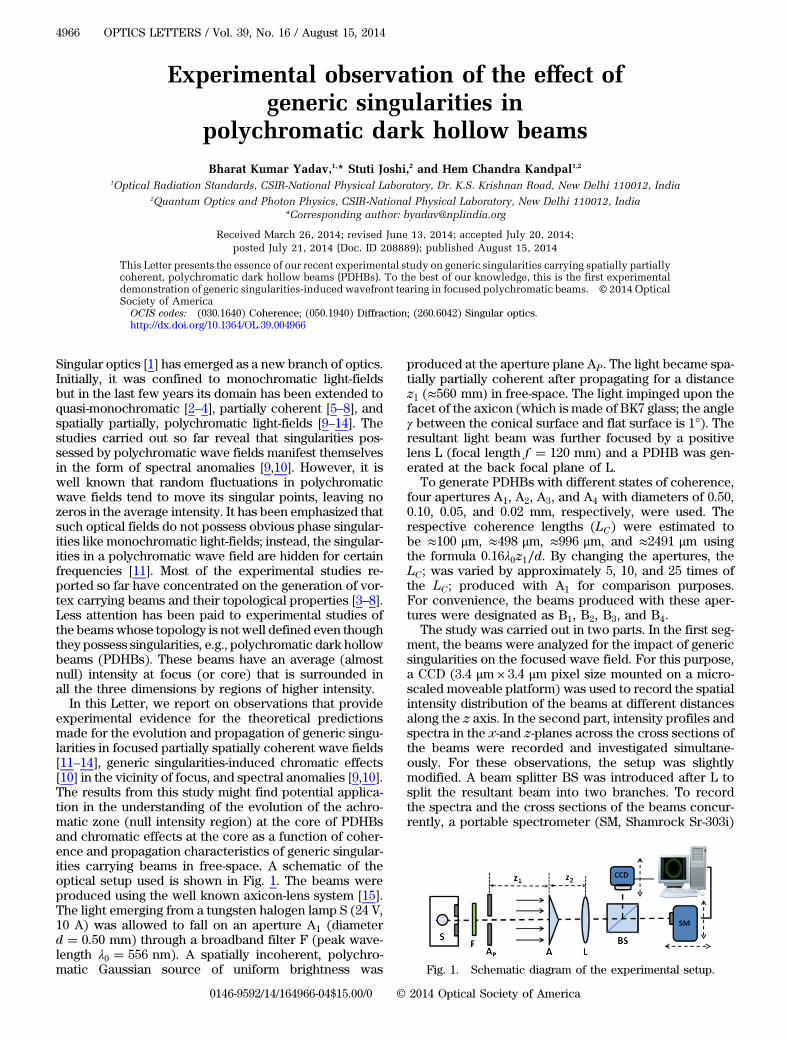
I�0; λ; z�dλ [16], whereintegration is extended over the entire spectral region.We found some interesting internal formations in thecore of the beam B1 at certain distances. At these loca-tions the formations are the result of interference of theconical waves produced by the axicon. The internalchanges were very prominent just before the develop-ment of an achromatic zone due to the destructive inter-ference at the focus of the beam. The contrast of theinternal structure for this beam was dim because of lowcoherence (figures are not included). The internalstructures in and around the core became sharper andbetter in the case of beam B2. For instance, some crosssections of the beam are shown in Fig. 2. One may noticea tornado-like wave structure around the bright centerof the focused beam at z � 160 mm [Fig. 2(a)]. This maybe the effect of a linear phase shift �τ�r� � exp�−ibr��experienced by the field due to the axicon. The structuredisappeared as wemoved the CCD further. Subsequently,the core was converted into an overlapped star-like for-mation at z � 170 mm [Fig. 2(b)]. This is the result offocusing region displacement by the axicon [17]. Onfurther movement of the CCD, it was observed thatafter z � 171 mm, the intensity of the core gradually kepton increasing up to few millimeters. At z � 175 mm a
complex wave structure developed at the core [Fig. 2(c)].Subsequently, an achromatic zone began to developand the former structure disappeared from the core[see Figs. 2(c) and 2(d)].
Afterward, the achromatic zone kept on increasingand reached its maximum at z � 185 mm [Fig. 2(e)]. Onfurther movement of the CCD in the direction of beampropagation, the achromatic zone kept on shrinking. Torealize the natural colors of cross sections of the beam,we also took observations after removing the filter Ffrom the setup. The images of the beam cross sectionsrecorded at the same observation points are depictedin Figs. 2(g)–2(l). For comparison, some selected crosssections of beam B3 with [Figs. 3(a)–3(c)] and withouta filter [Figs. 3(d)–3(f)] are also shown in Fig. 3. It hasbeen shown that the wave field possesses some pairsof points at which the field is fully coherent [18], andother pairs may be partially coherent and incoherent.Correlation singularities develop between these pointsat which the field is fully coherent [10]. Certain correla-tion singularities move together and eventually annihilateeach other [19]. The impact of random perturbationsof these points might be observed in the form of strongdisturbances and complex color texture at the core [seeFigs. 2(c), 2(d), 3(b), and 3(c)]. Although in beams B2(Fig. 2) and B3 (Fig. 3) the aforesaid situation is notapparent, in beam B4 the effect of correlation singular-ities became obvious. A clear-cut development of thewavefront tearing effect for certain frequencies might
Fig. 2. Cross section of beam B2 at different distance z.
August 15, 2014 / Vol. 39, No. 16 / OPTICS LETTERS 4967
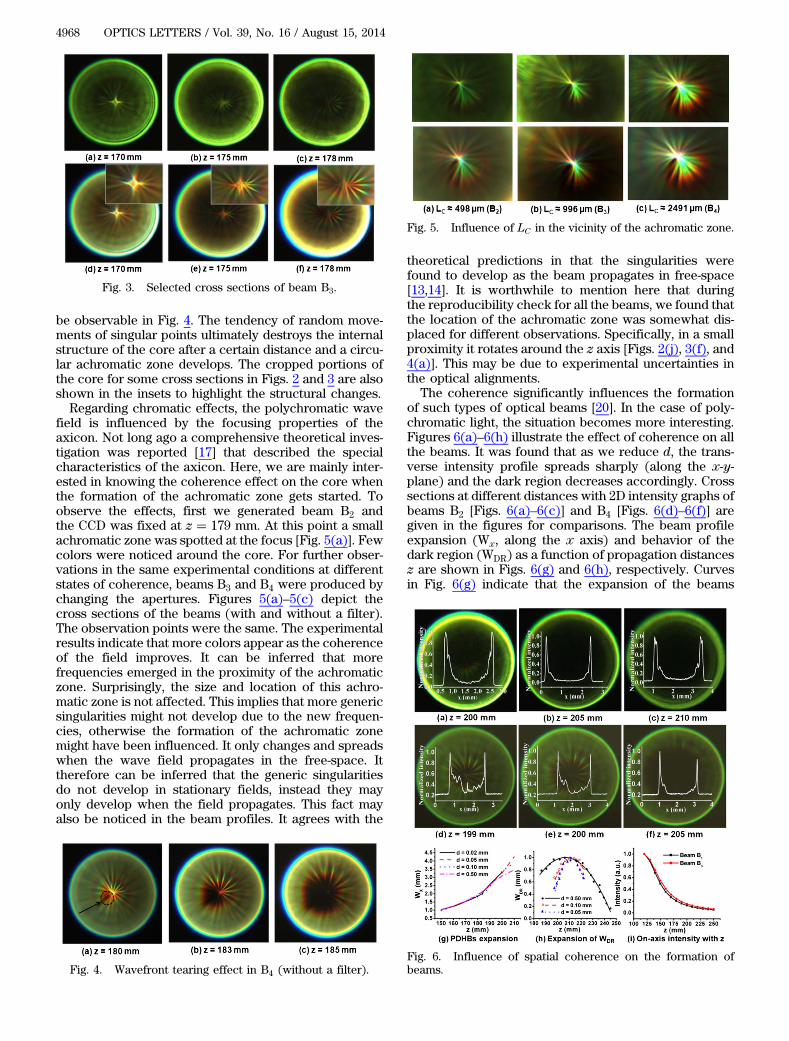
be observable in Fig. 4. The tendency of random move-ments of singular points ultimately destroys the internalstructure of the core after a certain distance and a circu-lar achromatic zone develops. The cropped portions ofthe core for some cross sections in Figs. 2 and 3 are alsoshown in the insets to highlight the structural changes.Regarding chromatic effects, the polychromatic wave
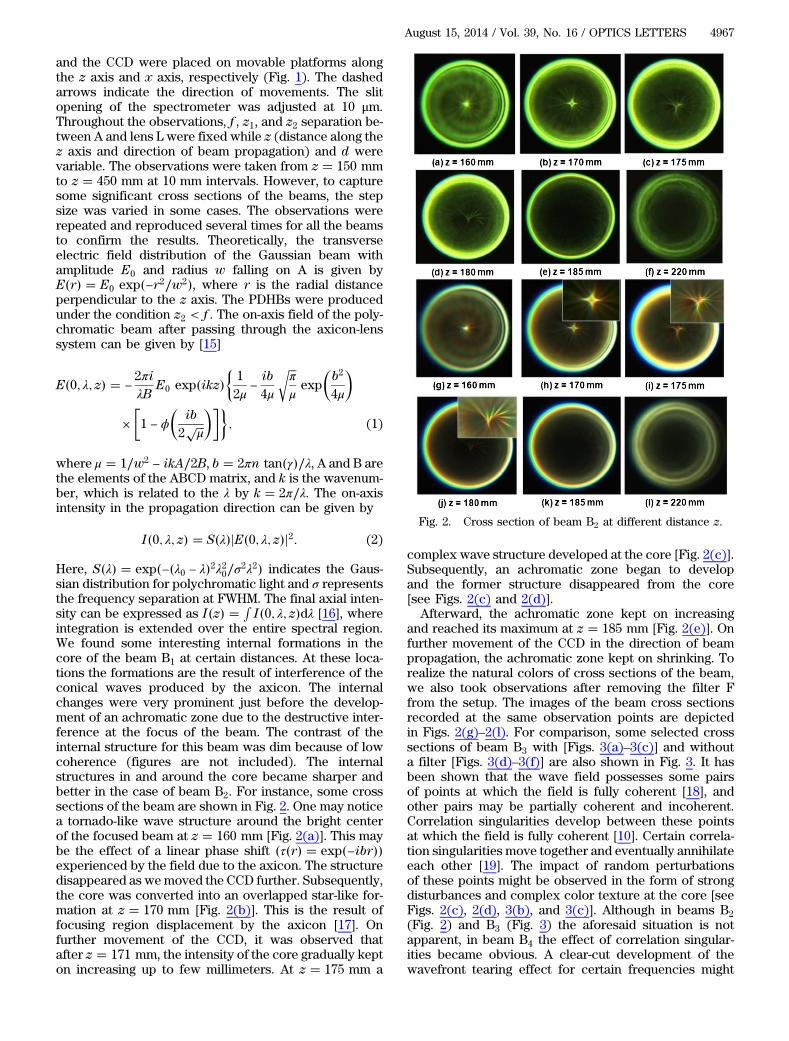
field is influenced by the focusing properties of theaxicon. Not long ago a comprehensive theoretical inves-tigation was reported [17] that described the specialcharacteristics of the axicon. Here, we are mainly inter-ested in knowing the coherence effect on the core whenthe formation of the achromatic zone gets started. Toobserve the effects, first we generated beam B2 andthe CCD was fixed at z � 179 mm. At this point a smallachromatic zone was spotted at the focus [Fig. 5(a)]. Fewcolors were noticed around the core. For further obser-vations in the same experimental conditions at differentstates of coherence, beams B3 and B4 were produced bychanging the apertures. Figures 5(a)–5(c) depict thecross sections of the beams (with and without a filter).The observation points were the same. The experimentalresults indicate that more colors appear as the coherenceof the field improves. It can be inferred that morefrequencies emerged in the proximity of the achromaticzone. Surprisingly, the size and location of this achro-matic zone is not affected. This implies that more genericsingularities might not develop due to the new frequen-cies, otherwise the formation of the achromatic zonemight have been influenced. It only changes and spreadswhen the wave field propagates in the free-space. Ittherefore can be inferred that the generic singularitiesdo not develop in stationary fields, instead they mayonly develop when the field propagates. This fact mayalso be noticed in the beam profiles. It agrees with the
theoretical predictions in that the singularities werefound to develop as the beam propagates in free-space[13,14]. It is worthwhile to mention here that duringthe reproducibility check for all the beams, we found thatthe location of the achromatic zone was somewhat dis-placed for different observations. Specifically, in a smallproximity it rotates around the z axis [Figs. 2(j), 3(f), and4(a)]. This may be due to experimental uncertainties inthe optical alignments.
The coherence significantly influences the formationof such types of optical beams [20]. In the case of poly-chromatic light, the situation becomes more interesting.Figures 6(a)–6(h) illustrate the effect of coherence on allthe beams. It was found that as we reduce d, the trans-verse intensity profile spreads sharply (along the x-y-plane) and the dark region decreases accordingly. Crosssections at different distances with 2D intensity graphs ofbeams B2 [Figs. 6(a)–6(c)] and B4 [Figs. 6(d)–6(f)] aregiven in the figures for comparisons. The beam profileexpansion (Wx, along the x axis) and behavior of thedark region (WDR) as a function of propagation distancesz are shown in Figs. 6(g) and 6(h), respectively. Curvesin Fig. 6(g) indicate that the expansion of the beams
Fig. 3. Selected cross sections of beam B3.
Fig. 4. Wavefront tearing effect in B4 (without a filter).
Fig. 5. Influence of LC in the vicinity of the achromatic zone.
Fig. 6. Influence of spatial coherence on the formation ofbeams.
4968 OPTICS LETTERS / Vol. 39, No. 16 / August 15, 2014
produced by a larger d reduces after a certain distance.This means beam B1 may travel longer than beam B4. InFig. 6(h), the lines represent the polynomial fit for theexperimental data (dots, circles, and triangles) that wereachieved at different states of coherence. The width ofthe beams and dark region were estimated using the stan-dard beam width measurement method (FWHM, 1∕e2).The experimental results showed good agreement withthe theoretical model for the optical setup. For instance,the on-axis intensities of beams B1 and B3 as a functionof z are illustrated in Fig. 6(i) for the experimental datausing the aforementioned equations.The spectral anomalies in the wave fields were investi-
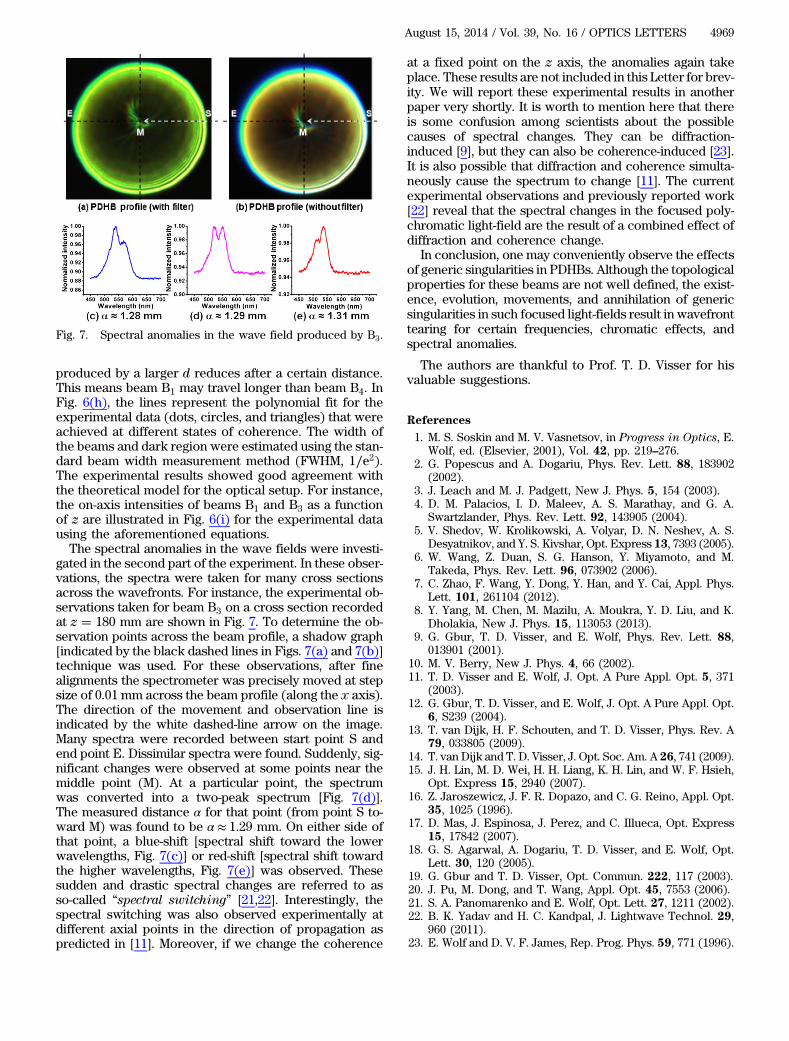
gated in the second part of the experiment. In these obser-vations, the spectra were taken for many cross sectionsacross the wavefronts. For instance, the experimental ob-servations taken for beam B3 on a cross section recordedat z � 180 mm are shown in Fig. 7. To determine the ob-servation points across the beam profile, a shadow graph[indicated by the black dashed lines in Figs. 7(a) and 7(b)]technique was used. For these observations, after finealignments the spectrometer was precisely moved at stepsize of 0.01 mm across the beam profile (along the x axis).The direction of the movement and observation line isindicated by the white dashed-line arrow on the image.Many spectra were recorded between start point S andend point E. Dissimilar spectra were found. Suddenly, sig-nificant changes were observed at some points near themiddle point (M). At a particular point, the spectrumwas converted into a two-peak spectrum [Fig. 7(d)].The measured distance α for that point (from point S to-ward M) was found to be α ≈ 1.29 mm. On either side ofthat point, a blue-shift [spectral shift toward the lowerwavelengths, Fig. 7(c)] or red-shift [spectral shift towardthe higher wavelengths, Fig. 7(e)] was observed. Thesesudden and drastic spectral changes are referred to asso-called “spectral switching” [21,22]. Interestingly, thespectral switching was also observed experimentally atdifferent axial points in the direction of propagation aspredicted in [11]. Moreover, if we change the coherence
at a fixed point on the z axis, the anomalies again takeplace. These results are not included in this Letter for brev-ity. We will report these experimental results in anotherpaper very shortly. It is worth to mention here that thereis some confusion among scientists about the possiblecauses of spectral changes. They can be diffraction-induced [9], but they can also be coherence-induced [23].It is also possible that diffraction and coherence simulta-neously cause the spectrum to change [11]. The currentexperimental observations and previously reported work[22] reveal that the spectral changes in the focused poly-chromatic light-field are the result of a combined effect ofdiffraction and coherence change.
In conclusion, one may conveniently observe the effectsof generic singularities in PDHBs. Although the topologicalproperties for these beams are not well defined, the exist-ence, evolution, movements, and annihilation of genericsingularities in such focused light-fields result in wavefronttearing for certain frequencies, chromatic effects, andspectral anomalies.
The authors are thankful to Prof. T. D. Visser for hisvaluable suggestions.
References
1. M. S. Soskin and M. V. Vasnetsov, in Progress in Optics, E.Wolf, ed. (Elsevier, 2001), Vol. 42, pp. 219–276.
2. G. Popescus and A. Dogariu, Phys. Rev. Lett. 88, 183902(2002).
3. J. Leach and M. J. Padgett, New J. Phys. 5, 154 (2003).4. D. M. Palacios, I. D. Maleev, A. S. Marathay, and G. A.
Swartzlander, Phys. Rev. Lett. 92, 143905 (2004).5. V. Shedov, W. Krolikowski, A. Volyar, D. N. Neshev, A. S.
Desyatnikov, and Y. S. Kivshar, Opt. Express 13, 7393 (2005).6. W. Wang, Z. Duan, S. G. Hanson, Y. Miyamoto, and M.
Takeda, Phys. Rev. Lett. 96, 073902 (2006).7. C. Zhao, F. Wang, Y. Dong, Y. Han, and Y. Cai, Appl. Phys.
Lett. 101, 261104 (2012).8. Y. Yang, M. Chen, M. Mazilu, A. Moukra, Y. D. Liu, and K.
Dholakia, New J. Phys. 15, 113053 (2013).9. G. Gbur, T. D. Visser, and E. Wolf, Phys. Rev. Lett. 88,
013901 (2001).10. M. V. Berry, New J. Phys. 4, 66 (2002).11. T. D. Visser and E. Wolf, J. Opt. A Pure Appl. Opt. 5, 371
(2003).12. G. Gbur, T. D. Visser, and E. Wolf, J. Opt. A Pure Appl. Opt.
6, S239 (2004).13. T. van Dijk, H. F. Schouten, and T. D. Visser, Phys. Rev. A
79, 033805 (2009).14. T. van Dijk and T. D. Visser, J. Opt. Soc. Am. A 26, 741 (2009).15. J. H. Lin, M. D. Wei, H. H. Liang, K. H. Lin, and W. F. Hsieh,
Opt. Express 15, 2940 (2007).16. Z. Jaroszewicz, J. F. R. Dopazo, and C. G. Reino, Appl. Opt.
35, 1025 (1996).17. D. Mas, J. Espinosa, J. Perez, and C. Illueca, Opt. Express
15, 17842 (2007).18. G. S. Agarwal, A. Dogariu, T. D. Visser, and E. Wolf, Opt.
Lett. 30, 120 (2005).19. G. Gbur and T. D. Visser, Opt. Commun. 222, 117 (2003).20. J. Pu, M. Dong, and T. Wang, Appl. Opt. 45, 7553 (2006).21. S. A. Panomarenko and E. Wolf, Opt. Lett. 27, 1211 (2002).22. B. K. Yadav and H. C. Kandpal, J. Lightwave Technol. 29,
960 (2011).23. E. Wolf and D. V. F. James, Rep. Prog. Phys. 59, 771 (1996).
Fig. 7. Spectral anomalies in the wave field produced by B3.
August 15, 2014 / Vol. 39, No. 16 / OPTICS LETTERS 4969


![Singularities and exotic spheres - Numdamarchive.numdam.org/article/SB_1966-1968__10__13_0.pdf · on the topology of isolated singularities ... JANICH [9]. § 1. ... SINGUlARITIES](https://img.pdfslide.us/doc/110x75/5b14468c7f8b9a397c8c357f/singularities-and-exotic-spheres-on-the-topology-of-isolated-singularities.jpg)