Embed Size (px)
Citation preview
ISSN 0104-6632 Printed in Brazil
www.abeq.org.br/bjche Vol. 29, No. 04, pp. 713 - 724, October - December, 2012
*To whom correspondence should be addressed
Brazilian Journal of Chemical Engineering
EXPERIMENTAL STUDY OF MICRO–PARTICLE FOULING UNDER FORCED CONVECTIVE HEAT
TRANSFER
S. M. Peyghambarzadeh1, A. Vatani1* and M. Jamialahmadi2
1Department of Chemical Engineering, College of Engineering, Phone: + 982188333058, Fax: +982161112197, University of Tehran, Tehran, Iran.
E-mail: [email protected] 2Petroleum University of Technology, Ahvaz, Iran.
(Submitted: December 25, 2011 ; Revised: February 22, 2012 ; Accepted: March 28, 2012)
Abstract - Particulate fouling studies of a hydrocarbon based suspension containing 2 µm alumina particles were performed in an annular heat exchanger having a hydraulic diameter of 14.7 mm. During fouling experiments, the classical asymptotical behavior was observed. It is shown that particle concentration, fluid velocity, and wall temperature have strong influences on the fouling curve and the asymptotic fouling resistance. Furthermore, a mathematical model is developed to formulate the asymptotic fouling resistance in terms of the mass transfer coefficient, thermophoresis velocity, and fluid shear rate. The results demonstrate that the prediction of the new model is in good agreement with the experimental observations. Keywords: Particulate fouling; Al2O3; Asymptotic fouling resistance; Thermophoresis; Mass transfer.
INTRODUCTION
Particulate fouling is defined as the deposition of unwanted material on a heat transfer surface. Products of fouling (i.e., sticking deposits) cause heat transfer resistance and lead to increased capital and maintenance costs and major production and energy losses in many especially energy–intensive industries (Müller–Steinhagen, 2011). The deposition of particulate matter causes problems in many technical applications, e.g., fouling of heat exchangers, contamination of nuclear reactors or blockage of membrane filters, leading to a wide-spread interest in the development of methods to predict and control the rate at which fine particles, suspended in liquids, deposit on walls (Adomeit and Renz, 1996). The subject of heat transfer in particulate liquids became popular during the 1950s (Ozbelge and Koker, 1996) and up to now several theoretical and experimental investigations have been performed. Some of the
important published papers, especially experimental studies in the area of particulate fouling, are cited here.
Epstein (1997) stated that particulate fouling is unlike most other categories of fouling. It shows no delay time before deposition is recorded, commonly yields a plot of mf (or Rf) vs t that follows a falling rate, with mf (or Rf) approaching an asymptotic value. He studied and summarized the particle deposition from suspensions flowing parallel to nonporous smooth and rough surfaces in terms of particle transport to, attachment at, and reentrainment from the surface. Particle deposition is commonly considered to be a two–step process: a transport step, in which particles are transferred to the wall, and a subsequent adhesion step, which is dominated by the interaction forces between particles and wall (Adomeit and Renz, 1996). Most of the investigations into transport mechanisms have concentrated on the situation in gas flow, where transport is frequently dominated by inertial effects (Papavergos and
714 S. M. Peyghambarzadeh, A. Vatani and M. Jamialahmadi
Brazilian Journal of Chemical Engineering
Hedley, 1984). Investigations concerning particle transport in liquids predominantly accounted for Brownian diffusion (Bowen et al., 1976), in which the transport rate can be calculated analytically for laminar flow. In turbulent flow, empirically based correlations, e.g., that suggested by Metzner and Friend (1958), are used or theories for aerosol deposition are adapted. Since in liquids the particle relaxation time is considerably smaller than in gases, the theories that account for diffusive effects are applicable, such as those of Beal (1970) and Davies (1983).
Earlier experimental investigations on particle deposition have focused on the influence of chemical materials on the deposition rates in isothermal laminar (Bowen and Epstein, 1979) and turbulent flow (Williamson et al., 1988). Other influences on deposition rates, such as temperature, heat transfer rate and flow rate have been investigated in less detail. Due to the practical importance of these influences, there is a strong need for data obtained under systematically varied adhesion conditions, covering a wide range of chemical, thermal and hydrodynamic parameters.
LITERATURE REVIEW
Williamson et al. (1988) studied the deposition of haematite (α–Fe2O3) particles of 0.2 μm diameter in suspension in water and found that the deposition is crucially dependent on the suspension pH. Melo and Pinheiro (1988) carried out particulate fouling tests using kaolin–water suspensions flowing through an annular heat exchanger. They used these data in a comparative study of several transport models. It was found that, in the lower range of fluid velocities (less than 0.5 m/s), the deposition seemed to be controlled by mass transfer. Kim and Webb (1991) developed a fouling model with an experimentally determined sticking probability and deposit bond strength factor. Their model could predict the fouling behavior of repeated rib tubes. The mass transfer rate was assumed to control the particle transport process and the wall shear stress assumed to control the removal process. The Reynolds number was between 14000–26000 and the foulant particles contained ferric oxide and aluminum oxide. Furthermore, an analysis was performed that accounts for the forces acting on the particles at the wall. The deposition rate of Lake Ontario slit onto type 304 stainless steel was given by Turner and Lister (1991). They found that only particles less than 5 μm were found in the deposit, even though particles up to 25 μm were in the flowing slit suspension.
The deposition of fine silica and polystyrene spheres was measured for conditions of laminar and turbulent flow in a rectangular channel using image analysis. Contrary to the results for laminar flow, the initial deposition rates in the turbulent flow decreased with increasing Reynolds number, indicating that deposition was no longer mass transfer controlled (Vasak et al., 1995). Karabelas et al. (1997) reported particulate fouling data for plate heat exchangers with particles of mean size 5 µm. The flow passage geometry and the fluid velocity had a strong effect on the fouling resistance. These results showed that fouling was adhesion controlled and that the maximum measured resistance was almost an order of magnitude smaller than the TEMA recommendations. They reported that tangential hydrodynamic forces are responsible for particle detachment from the heat transfer surface.
Grandgeorge et al. (1998) performed an experi-mental study on the liquid–phase particulate fouling of stainless steel corrugated plate heat exchangers. Deionized water containing TiO2 particles was used as the foulant fluid. During fouling experiments, asymptotical behavior was observed. A systematic study of the influence of the fluid velocity on the initial deposition rate as well as on the asymptotic thermal resistance of the deposit was performed. The influence of the suspension pH on the fouling process was also provided. They also proposed a falling-rate global model based on the idea that the adhesion coefficient decreases when the particles accumulate on the wall. Turner and Klimas (2000) measured the deposition rate of colloidal magnetite particles at alkaline pH under both single phase forced convection and flow boiling conditions.
The deposition of magnetite particles from suspension in water at 90 °C was studied under various conditions of flow, chemistry, and boiling heat transfer. The experiments indicated that, under non–boiling conditions, mechanisms based on diffusion and thermophoresis control deposition, while removal is negligible (Basset et al., 2000). Coutinho et al. (2001) described a thermodynamic model for predicting the deposition of paraffinic waxes during production in hydrocarbon fluids at low and high pressures. Yiantsios and Karabelas (2003) obtained a set of experimental data for micrometer–sized particle deposition under well–controlled hydrodynamic conditions covering a range of physicochemical conditions, particle sizes and substrate materials. Their experimental results revealed the important effects of gravity, lift forces, and physicochemical interactions. Even for particles in the micrometer–size range, the sticking probability
Experimental Study of Micro–Particle Fouling Under Forced Convective Heat Transfer 715
Brazilian Journal of Chemical Engineering Vol. 29, No. 04, pp. 713 - 724, October - December, 2012
was limited by hydrodynamic conditions that are similar to or less severe than those encountered in industrial heat exchangers.
Buchelli et al. (2005) analyzed particulate fouling in a continuous LDPE polymerization reactor and found that the foulant thickness grew linearly with time. Based on the heat and mass transfer analogy and analysis of the plant data they suggested that only a small fraction of the polymer that is precipitated near the reactor wall gets attached to the wall to produce fouling. Li (2007) provided data for accelerated particulate fouling in helically ribbed copper tubes at different concentrations, velocities, and geometries. Aluminum oxide particles with 3 μm average particle diameters were used as foulant. The semi–theoretical analysis of dividing a fouling factor ratio into a fouling process index and an efficiency index significantly simplified the fouling analysis.
Recently, Jamialahmadi et al. (2009) studied the mechanisms of deposition of flocculated asphaltene particles from oil experimentally and theoretically under forced convective conditions using an accurate thermal approach. It was observed that, during the first few weeks the deposition mechanism was dominant and the erosion of the deposit was almost negligible. The rate of asphaltene deposition increased with increasing flocculated asphaltene concentration and temperature, while it decreased with increasing oil velocity.
In this paper, micron–sized α–alumina particles are introduced into a hydrocarbon base fluid (n–heptane). There is almost no information about the deposition from hydrocarbon-based suspensions
in the literature. The deposition during forced convection heat transfer was measured using an accurate thermal approach. Furthermore, by ana-lyzing the effect of operating conditions, a new theoretical model was developed to predict the asymptotic fouling resistance. Results of this study could be applied in different industrial cases such as crude oil refineries and various types of water-cooled heat exchangers in chemical, food processing and power plants.
EXPERIMENTAL Experimental Apparatus and Materials
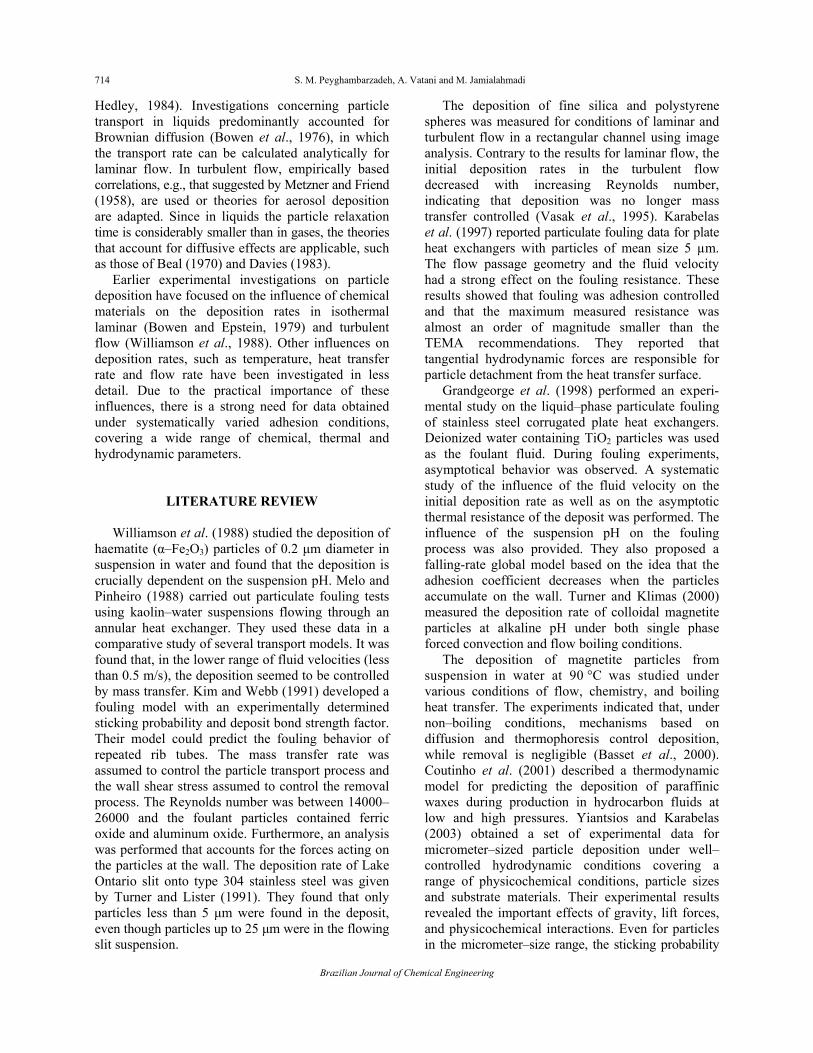
Figure 1 shows the test apparatus used for the present investigation. The solution flows in a closed loop consisting of a temperature controlled storage tank, a centrifugal pump and an annular test section. The flow velocity of the solutions was measured with a calibrated flow meter (Technical Group LZM–15Z Type) with the accuracy of ±0.1 l/min. The fluid temperature was measured by two RTDs (Pt–100Ω) located in mixing chambers before and after the test section. The complete system was made from stainless steel. Thermocouple voltages and the current and voltage drop from the test heater were measured and processed with a data acquisition system in conjunction with a computer. The solution temperature was controlled by cooling water coils inside the tanks and by electrical band heaters in conjunction with temperature controllers.
Figure 1: Simplified diagram of the experimental apparatus.
716 S. M. Peyghambarzadeh, A. Vatani and M. Jamialahmadi
Brazilian Journal of Chemical Engineering
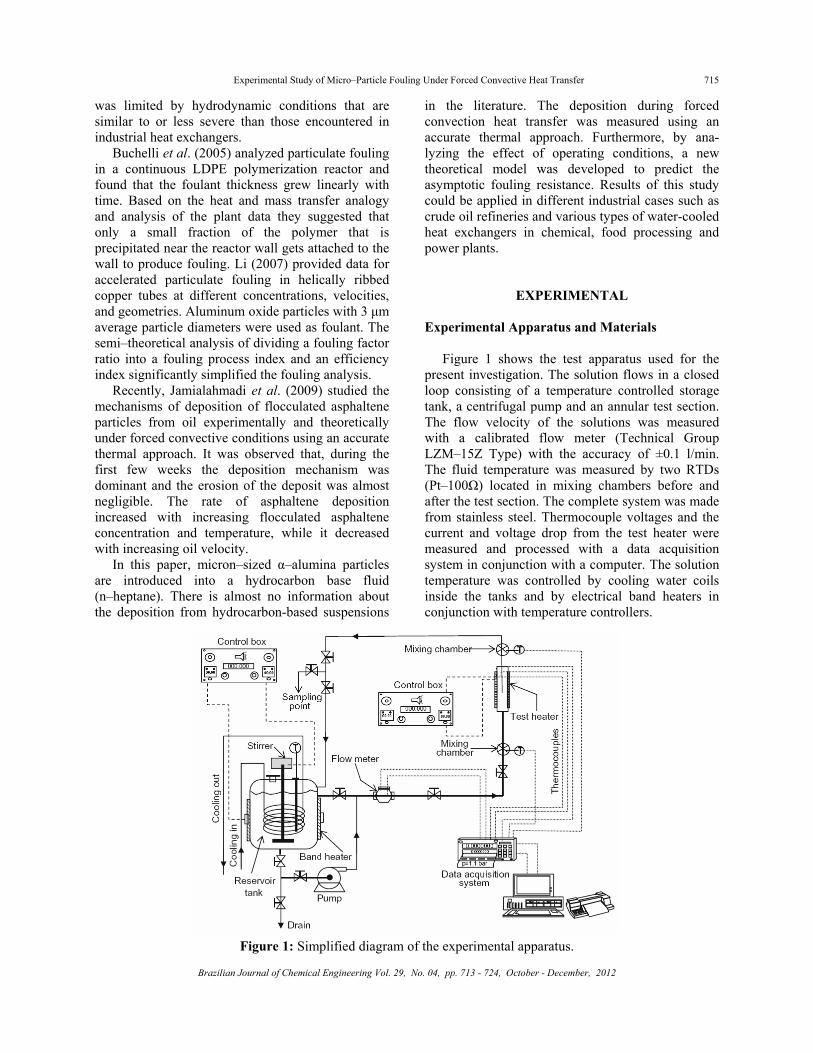
When the fluid is heated in the annular space, alumina micro-particles are deposited on the test heater. This heater was manufactured by the Ashland Chemical Company (One Drew Plaza Boonton, NJ 07005, US) according to an HTRI design. Inserting the test heater in the flow line creates an annular section. In the test section, the local wall temperatures were measured with four stainless steel sheathed miniature thermocouples (E-type), which were installed as close as possible to the heat transfer surfaces. The simplified scheme of the test heater, with the thermocouples’ location in it, is demon-strated in Figure 2. This type of heater has been extensively used for fouling research by the other investigators (Najibi et al., 1997; Helalizadeh et al., 2000). The temperature drop between the thermocou-ple location and the heat transfer surface can be calculated from:
w thw
sT T q= −λ
(1)
The ratio between the distance of the
thermocouples from the surface and the thermal conductivity of the tube material (s/λw) was determined for each thermocouple by calibration measurements using a Wilson plot technique (Fernández–Seara et al., 2007). The average tem-perature difference for each test section was the
arithmetic average for the four thermocouple locations around the rod circumference. The average of the voltage readings was used to determine the difference between the wall and bulk temperature for each thermocouple. All thermocouples used were thoroughly calibrated by using a constant tem-perature water bath, and their accuracy has been estimated to be ±0.2 °C. The local heat transfer co-efficient α is then calculated from
w b
qT T
α =−
(2)
The important dimensions of the test section are
shown in Table 1. Prior to commencing a test run, the test heater,
reservoir tanks and pipes were washed and cleaned with water and cleaning agent to remove any scale from previous experiments. After the system was cleaned, the test solution was introduced into the reservoir tanks. Following this, the tank heater was switched on and the temperature of the system allowed to rise. Once the fluid reached the desired temperature, the pump was started and the system left to stabilize to the desired bulk temperature and velocity. Then power was supplied to the test heater and kept at a pre–determined value. The data acquisition system was switched–on to record temperatures, pressure and heat flux.
Figure 2: Schematic of the test heater.
Table 1: Dimensions of the test section.
Dimensions Value (mm) Heater diameter 10.7 Annulus outside diameter 25.4 Heated length 99.1 Hydraulic diameter 14.7 Heated length to thermocouple location 82.6 Entrance length to heater beginning 216.0
Experimental Study of Micro–Particle Fouling Under Forced Convective Heat Transfer 717
Brazilian Journal of Chemical Engineering Vol. 29, No. 04, pp. 713 - 724, October - December, 2012
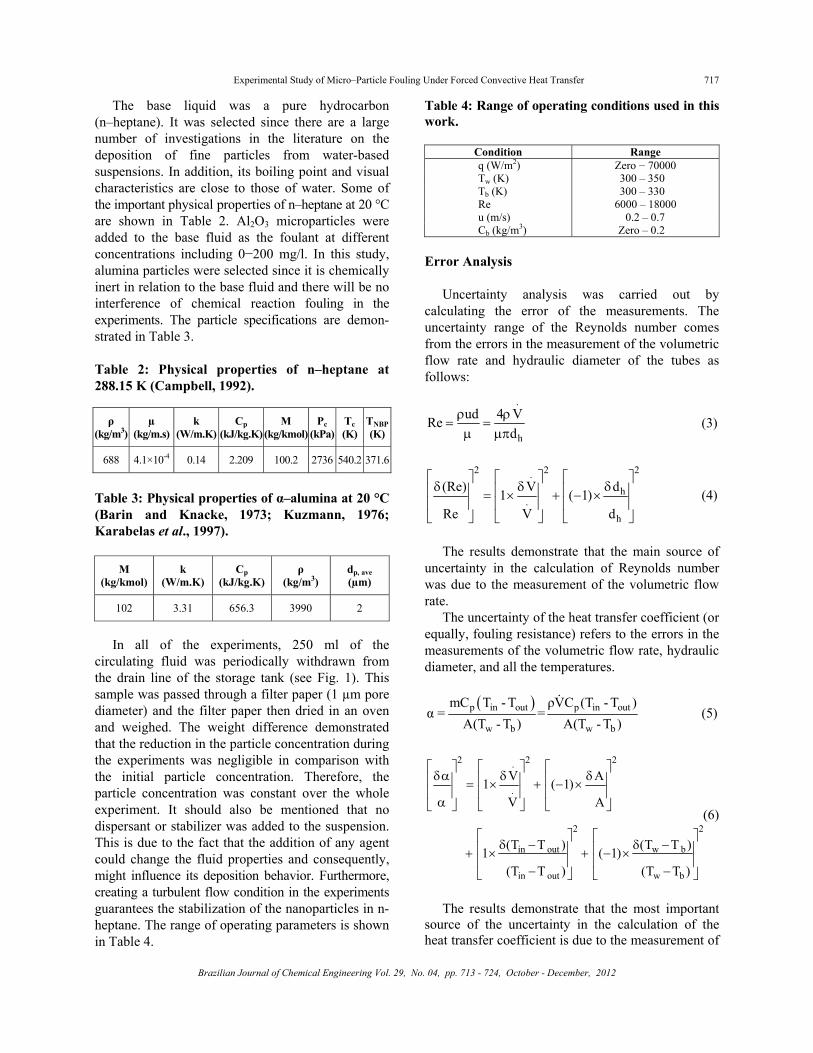
The base liquid was a pure hydrocarbon (n–heptane). It was selected since there are a large number of investigations in the literature on the deposition of fine particles from water-based suspensions. In addition, its boiling point and visual characteristics are close to those of water. Some of the important physical properties of n–heptane at 20 °C are shown in Table 2. Al2O3 microparticles were added to the base fluid as the foulant at different concentrations including 0−200 mg/l. In this study, alumina particles were selected since it is chemically inert in relation to the base fluid and there will be no interference of chemical reaction fouling in the experiments. The particle specifications are demon-strated in Table 3. Table 2: Physical properties of n–heptane at 288.15 K (Campbell, 1992).
ρ (kg/m3)
µ (kg/m.s)
k (W/m.K)
Cp (kJ/kg.K)
M (kg/kmol)
Pc (kPa)
Tc (K)
TNBP(K)
688 4.1×10⁻⁴ 0.14 2.209 100.2 2736 540.2 371.6
Table 3: Physical properties of α–alumina at 20 °C (Barin and Knacke, 1973; Kuzmann, 1976; Karabelas et al., 1997).
M (kg/kmol)
k (W/m.K)
Cp (kJ/kg.K)
ρ (kg/m3)
dp, ave (µm)
102 3.31 656.3 3990 2
In all of the experiments, 250 ml of the
circulating fluid was periodically withdrawn from the drain line of the storage tank (see Fig. 1). This sample was passed through a filter paper (1 µm pore diameter) and the filter paper then dried in an oven and weighed. The weight difference demonstrated that the reduction in the particle concentration during the experiments was negligible in comparison with the initial particle concentration. Therefore, the particle concentration was constant over the whole experiment. It should also be mentioned that no dispersant or stabilizer was added to the suspension. This is due to the fact that the addition of any agent could change the fluid properties and consequently, might influence its deposition behavior. Furthermore, creating a turbulent flow condition in the experiments guarantees the stabilization of the nanoparticles in n-heptane. The range of operating parameters is shown in Table 4.
Table 4: Range of operating conditions used in this work.
Condition Range q (W/m2) Zero − 70000 Tw (K) 300 – 350 Tb (K) 300 – 330 Re 6000 – 18000 u (m/s) 0.2 – 0.7 Cb (kg/m3) Zero – 0.2
Error Analysis
Uncertainty analysis was carried out by calculating the error of the measurements. The uncertainty range of the Reynolds number comes from the errors in the measurement of the volumetric flow rate and hydraulic diameter of the tubes as follows:
.
h
ud 4 VRed
ρ ρ= =
μ μπ (3)
2 2 2.
h.
h
(Re) V d1 ( 1)Re V d
⎡ ⎤ ⎡ ⎤ ⎡ ⎤δ δ δ⎢ ⎥ ⎢ ⎥ ⎢ ⎥= × + − ×⎢ ⎥ ⎢ ⎥ ⎢ ⎥⎣ ⎦ ⎣ ⎦ ⎣ ⎦
(4)
The results demonstrate that the main source of
uncertainty in the calculation of Reynolds number was due to the measurement of the volumetric flow rate.
The uncertainty of the heat transfer coefficient (or equally, fouling resistance) refers to the errors in the measurements of the volumetric flow rate, hydraulic diameter, and all the temperatures.
( )p in out p in out
w b w b
mC T - T ρVC (T - T )α = =
A(T - T ) A(T - T ) (5)
2 2 2.
.
2 2
in out w b
in out w b
V A1 ( 1)V A
(T T ) (T T )1 ( 1)(T T ) (T T )
⎡ ⎤ ⎡ ⎤ ⎡ ⎤δα δ δ⎢ ⎥ ⎢ ⎥ ⎢ ⎥= × + − ×⎢ ⎥ ⎢ ⎥ ⎢ ⎥α⎣ ⎦ ⎣ ⎦ ⎣ ⎦
⎡ ⎤ ⎡ ⎤δ − δ −⎢ ⎥ ⎢ ⎥+ × + − ×
⎢ ⎥ ⎢ ⎥− −⎣ ⎦ ⎣ ⎦
(6)
The results demonstrate that the most important
source of the uncertainty in the calculation of the heat transfer coefficient is due to the measurement of
718 S. M. Peyghambarzadeh, A. Vatani and M. Jamialahmadi
Brazilian Journal of Chemical Engineering
temperature differences, especially the last term in Eq. (6).
According to the uncertainty analysis described by Moffat (1988), the measurement errors of the main parameters are summarized in Table 5. Furthermore, to check the reproducibility of the experiments, some runs were repeated later, which proved to be excellent. Table 5: The uncertainties of the measured parameters.
Parameter Value Unit UncertaintyA 3.3×10⁻⁴ m2 0.94% Re 6×10³ – 1.8×10⁴ – 5.2% α 2×10² – 1.6×10³ W/m2K 10.4% Rf Zero – 4.5×10⁻³ m2K/W 10.4%
RESULTS AND DISCUSSION
It is customary to present fouling data in terms of fouling resistance (Rf), which can be calculated on the basis of the overall heat transfer coefficient at t = 0 and at any desired time:
f1 1R(t) (t 0)
= −α α =
(7)
For the range of the operating variables
investigated, an asymptotic increase of fouling resistance with time was observed, which is in accordance with the previous particulate fouling experiments (Kim and Webb, 1991; Grandgeorge et al., 1998; Sheikholeslami, 2000; Bansal et al., 2001; Walker and Sheikholeslami, 2003; Müller–Steinhagen, 2011). The values of fouling resistance were measured under different operating conditions, including particle concentration, fluid velocity, and wall tem-perature. All of the experimental data presented in this study are summarized in Table 6 for better demonstration of the effect of the operating variables.
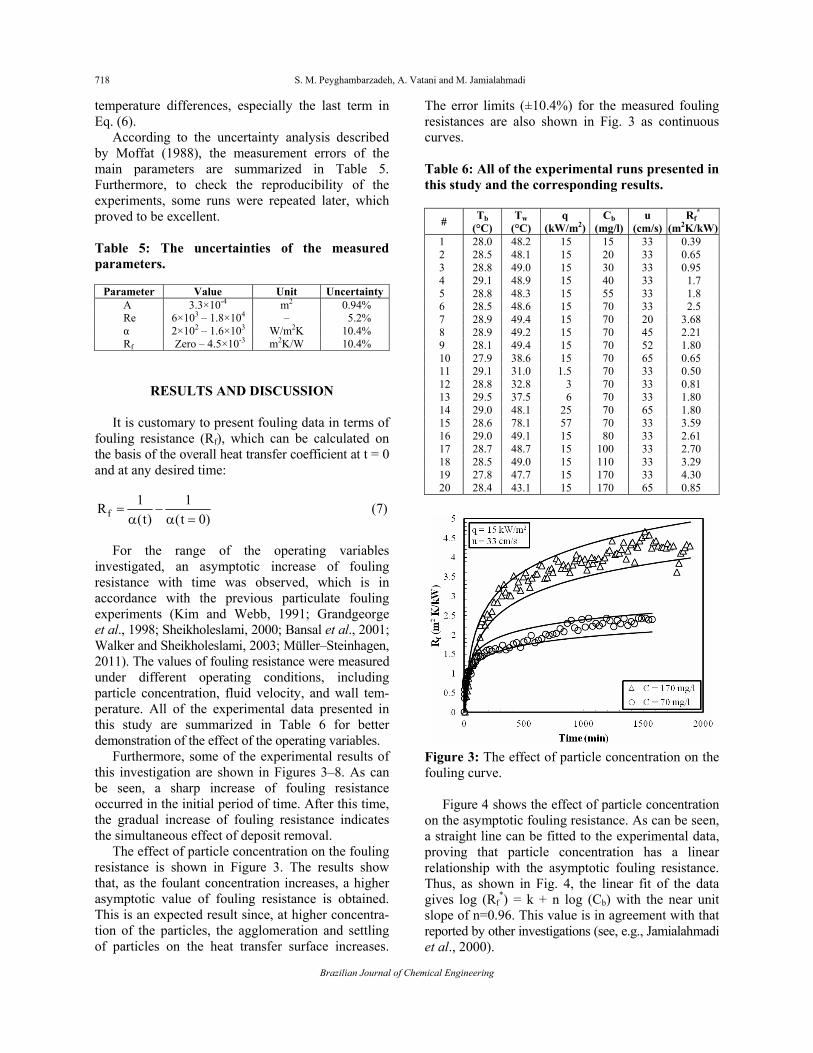
Furthermore, some of the experimental results of this investigation are shown in Figures 3–8. As can be seen, a sharp increase of fouling resistance occurred in the initial period of time. After this time, the gradual increase of fouling resistance indicates the simultaneous effect of deposit removal.
The effect of particle concentration on the fouling resistance is shown in Figure 3. The results show that, as the foulant concentration increases, a higher asymptotic value of fouling resistance is obtained. This is an expected result since, at higher concentra-tion of the particles, the agglomeration and settling of particles on the heat transfer surface increases.
The error limits (±10.4%) for the measured fouling resistances are also shown in Fig. 3 as continuous curves. Table 6: All of the experimental runs presented in this study and the corresponding results.
# Tb
(°C) Tw
(°C) q
(kW/m2) Cb
(mg/l) u
(cm/s)Rf
* (m2K/kW)
1 28.0 48.2 15 15 33 0.39 2 28.5 48.1 15 20 33 0.65 3 28.8 49.0 15 30 33 0.95 4 29.1 48.9 15 40 33 1.7 5 28.8 48.3 15 55 33 1.8 6 28.5 48.6 15 70 33 2.5 7 28.9 49.4 15 70 20 3.68 8 28.9 49.2 15 70 45 2.21 9 28.1 49.4 15 70 52 1.80 10 27.9 38.6 15 70 65 0.65 11 29.1 31.0 1.5 70 33 0.50 12 28.8 32.8 3 70 33 0.81 13 29.5 37.5 6 70 33 1.80 14 29.0 48.1 25 70 65 1.80 15 28.6 78.1 57 70 33 3.59 16 29.0 49.1 15 80 33 2.61 17 28.7 48.7 15 100 33 2.70 18 28.5 49.0 15 110 33 3.29 19 27.8 47.7 15 170 33 4.30 20 28.4 43.1 15 170 65 0.85
Figure 3: The effect of particle concentration on the fouling curve.
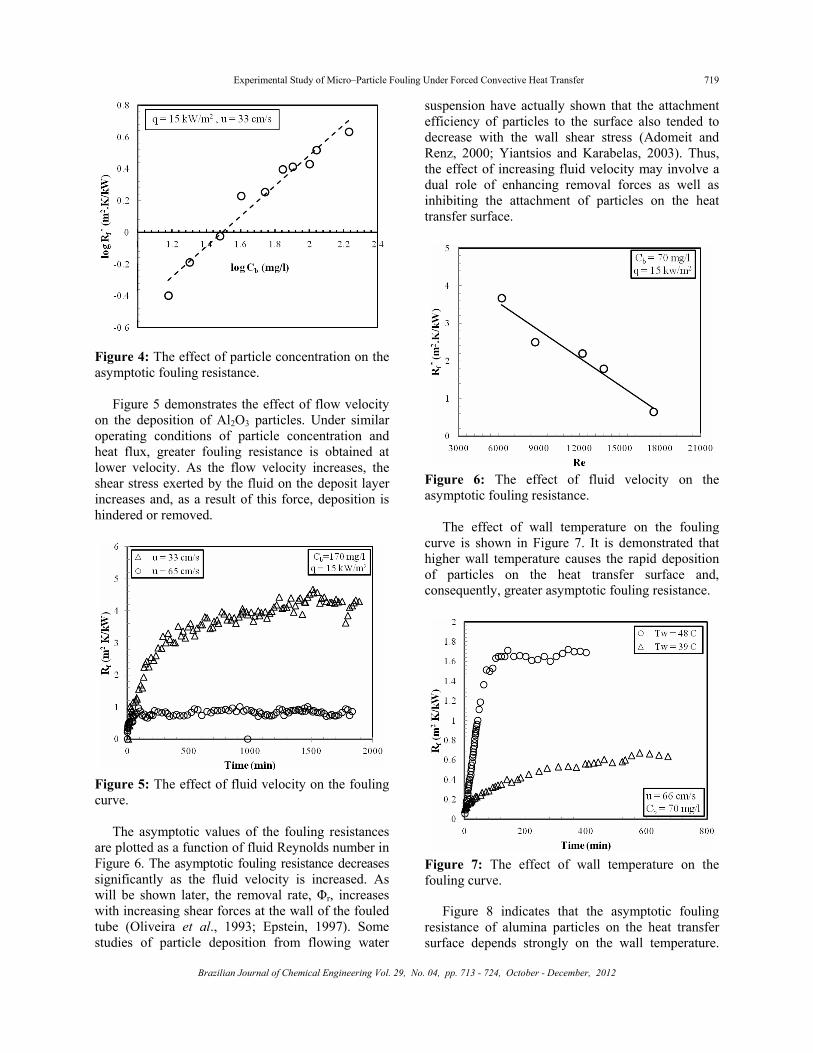
Figure 4 shows the effect of particle concentration on the asymptotic fouling resistance. As can be seen, a straight line can be fitted to the experimental data, proving that particle concentration has a linear relationship with the asymptotic fouling resistance. Thus, as shown in Fig. 4, the linear fit of the data gives log (Rf
*) = k + n log (Cb) with the near unit slope of n=0.96. This value is in agreement with that reported by other investigations (see, e.g., Jamialahmadi et al., 2000).
Experimental Study of Micro–Particle Fouling Under Forced Convective Heat Transfer 719
Brazilian Journal of Chemical Engineering Vol. 29, No. 04, pp. 713 - 724, October - December, 2012
Figure 4: The effect of particle concentration on the asymptotic fouling resistance.
Figure 5 demonstrates the effect of flow velocity on the deposition of Al2O3 particles. Under similar operating conditions of particle concentration and heat flux, greater fouling resistance is obtained at lower velocity. As the flow velocity increases, the shear stress exerted by the fluid on the deposit layer increases and, as a result of this force, deposition is hindered or removed.
Figure 5: The effect of fluid velocity on the fouling curve.
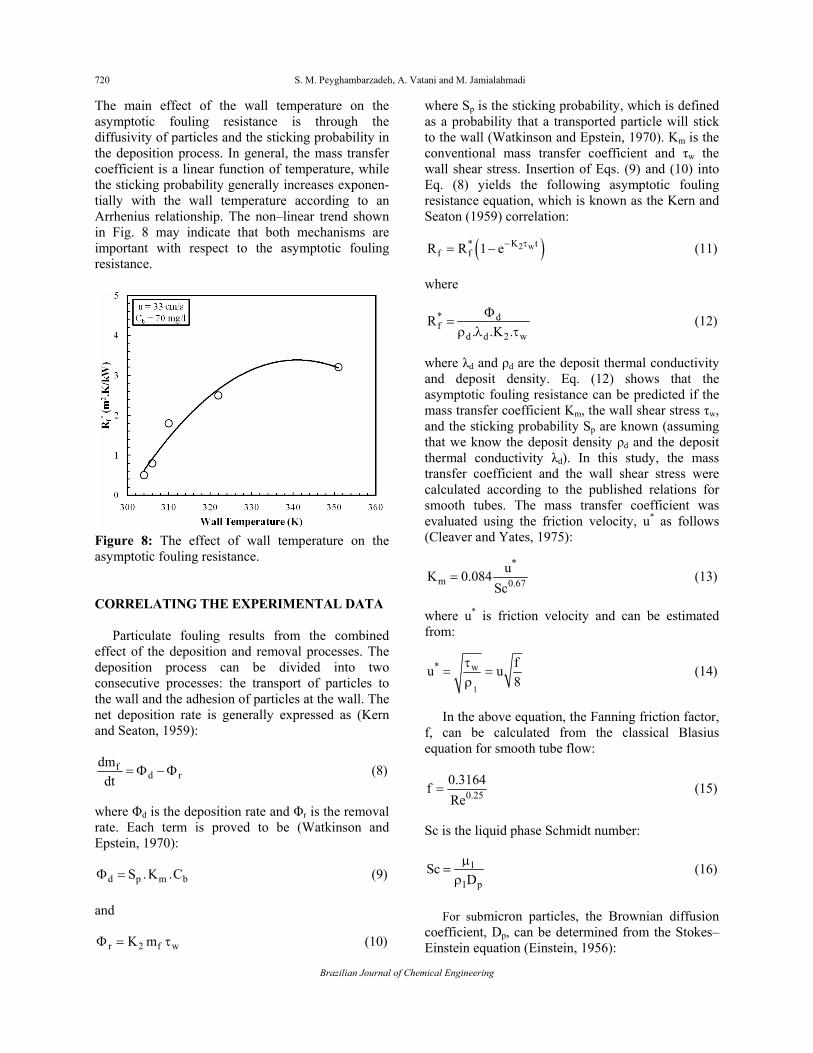
The asymptotic values of the fouling resistances are plotted as a function of fluid Reynolds number in Figure 6. The asymptotic fouling resistance decreases significantly as the fluid velocity is increased. As will be shown later, the removal rate, Φr, increases with increasing shear forces at the wall of the fouled tube (Oliveira et al., 1993; Epstein, 1997). Some studies of particle deposition from flowing water
suspension have actually shown that the attachment efficiency of particles to the surface also tended to decrease with the wall shear stress (Adomeit and Renz, 2000; Yiantsios and Karabelas, 2003). Thus, the effect of increasing fluid velocity may involve a dual role of enhancing removal forces as well as inhibiting the attachment of particles on the heat transfer surface.
Figure 6: The effect of fluid velocity on the asymptotic fouling resistance.
The effect of wall temperature on the fouling curve is shown in Figure 7. It is demonstrated that higher wall temperature causes the rapid deposition of particles on the heat transfer surface and, consequently, greater asymptotic fouling resistance.
Figure 7: The effect of wall temperature on the fouling curve.
Figure 8 indicates that the asymptotic fouling resistance of alumina particles on the heat transfer surface depends strongly on the wall temperature.
720 S. M. Peyghambarzadeh, A. Vatani and M. Jamialahmadi
Brazilian Journal of Chemical Engineering
The main effect of the wall temperature on the asymptotic fouling resistance is through the diffusivity of particles and the sticking probability in the deposition process. In general, the mass transfer coefficient is a linear function of temperature, while the sticking probability generally increases exponen-tially with the wall temperature according to an Arrhenius relationship. The non–linear trend shown in Fig. 8 may indicate that both mechanisms are important with respect to the asymptotic fouling resistance.
Figure 8: The effect of wall temperature on the asymptotic fouling resistance. CORRELATING THE EXPERIMENTAL DATA
Particulate fouling results from the combined effect of the deposition and removal processes. The deposition process can be divided into two consecutive processes: the transport of particles to the wall and the adhesion of particles at the wall. The net deposition rate is generally expressed as (Kern and Seaton, 1959):
fd r
dmdt
= Φ −Φ (8)
where Φd is the deposition rate and Φr is the removal rate. Each term is proved to be (Watkinson and Epstein, 1970):
d p m bS .K .CΦ = (9) and
r 2 f wK mΦ = τ (10)
where Sp is the sticking probability, which is defined as a probability that a transported particle will stick to the wall (Watkinson and Epstein, 1970). Km is the conventional mass transfer coefficient and τw the wall shear stress. Insertion of Eqs. (9) and (10) into Eq. (8) yields the following asymptotic fouling resistance equation, which is known as the Kern and Seaton (1959) correlation:
( )2 wK t*f fR R 1 e− τ= − (11)
where
* df
d d 2 wR
. .K .Φ
=ρ λ τ
(12)
where λd and ρd are the deposit thermal conductivity and deposit density. Eq. (12) shows that the asymptotic fouling resistance can be predicted if the mass transfer coefficient Km, the wall shear stress τw, and the sticking probability Sp are known (assuming that we know the deposit density ρd and the deposit thermal conductivity λd). In this study, the mass transfer coefficient and the wall shear stress were calculated according to the published relations for smooth tubes. The mass transfer coefficient was evaluated using the friction velocity, u* as follows (Cleaver and Yates, 1975):
*
m 0.67uK 0.084
Sc= (13)
where u* is friction velocity and can be estimated from:
1
* w fu u8
τ= =
ρ (14)
In the above equation, the Fanning friction factor,
f, can be calculated from the classical Blasius equation for smooth tube flow:
0.250.3164fRe
= (15)
Sc is the liquid phase Schmidt number:
1
1 pSc
Dμ
=ρ
(16)
For submicron particles, the Brownian diffusion
coefficient, Dp, can be determined from the Stokes–Einstein equation (Einstein, 1956):
Experimental Study of Micro–Particle Fouling Under Forced Convective Heat Transfer 721
Brazilian Journal of Chemical Engineering Vol. 29, No. 04, pp. 713 - 724, October - December, 2012
Bp
p
TD3 dκ
=πμ
(17)
The sticking probability, Sp is defined according
to (Watkinson and Epstein, 1970):
w
ERT
12
K .eSpu
−
= (18)
As described in the literature, a thermal force
moves fine particles down a temperature gradient. Hence, cold walls attract and hot walls repel colloidal particles (Epstein, 1997). The thermophoresis velocity, VT can be estimated according to Whitmore and Meisen (1977) as follows:
1T
1 p 1
0.26 qV2 .T
μ=
λ + λ ρ (19)
The thermophoresis effect is especially important
at high heat fluxes and, as inferred from the literature, the constant of 0.26 in Eq. (19) should be assigned a value almost an order of magnitude smaller than 0.26 to match the experimental data (Epstein, 1997). In this investigation, due to the low heat fluxes (less than 70 kW/m2) employed in the experiments, the thermophoresis velocity was on the order of 10-7 m/s, almost an order of magnitude smaller than the mass transfer velocity, which was on the order of 10-6 m/s. Therefore, there was no need to replace the coefficient of 0.26 with the smaller one since the thermophoresis velocity could be ignored in comparison with the mass transfer velocity. The deposition rate of Eq. (13) can be corrected as follows:
Td m b
VK .S.C2
⎡ ⎤Φ = −⎢ ⎥⎣ ⎦ (20)
Inserting Eqs. (18) and (20) into Eq. (12):
w
ERT
1 Tb m2
*f
2 d d w
K .e V.C . K2u
RK . . .
−⎡ ⎤⎢ ⎥ ⎡ ⎤−⎢ ⎥ ⎢ ⎥⎣ ⎦⎢ ⎥⎢ ⎥⎣ ⎦=
ρ λ τ (21)
substituting the definitions of Km, VT, and τw from Eqs. (13) – (19) and considering all the constants in
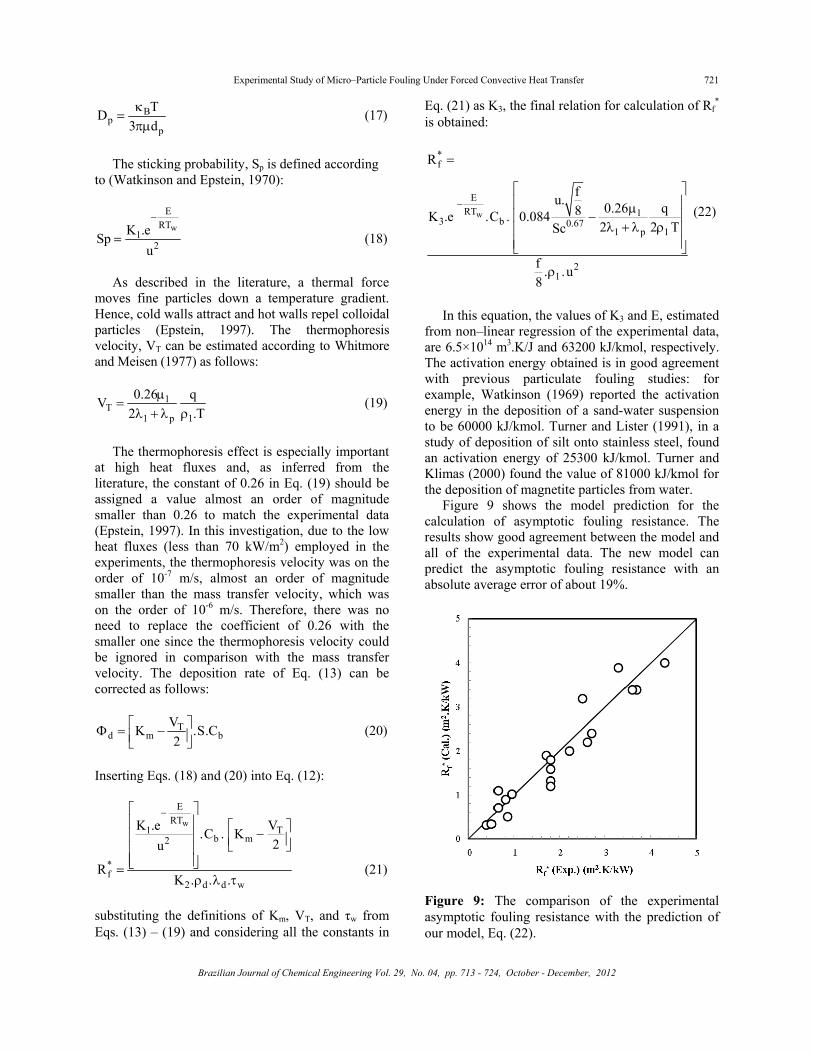
Eq. (21) as K3, the final relation for calculation of Rf*
is obtained:
w
*f
ERT 1
3 b 0.671 p 1
21
R
fu. 0.26 q8K .e .C . 0.0842 2 TSc
f . .u8
−
=
⎡ ⎤⎢ ⎥μ⎢ ⎥−
λ + λ ρ⎢ ⎥⎢ ⎥⎣ ⎦
ρ
(22)
In this equation, the values of K3 and E, estimated
from non–linear regression of the experimental data, are 6.5×10¹⁴ m3.K/J and 63200 kJ/kmol, respectively. The activation energy obtained is in good agreement with previous particulate fouling studies: for example, Watkinson (1969) reported the activation energy in the deposition of a sand-water suspension to be 60000 kJ/kmol. Turner and Lister (1991), in a study of deposition of silt onto stainless steel, found an activation energy of 25300 kJ/kmol. Turner and Klimas (2000) found the value of 81000 kJ/kmol for the deposition of magnetite particles from water.
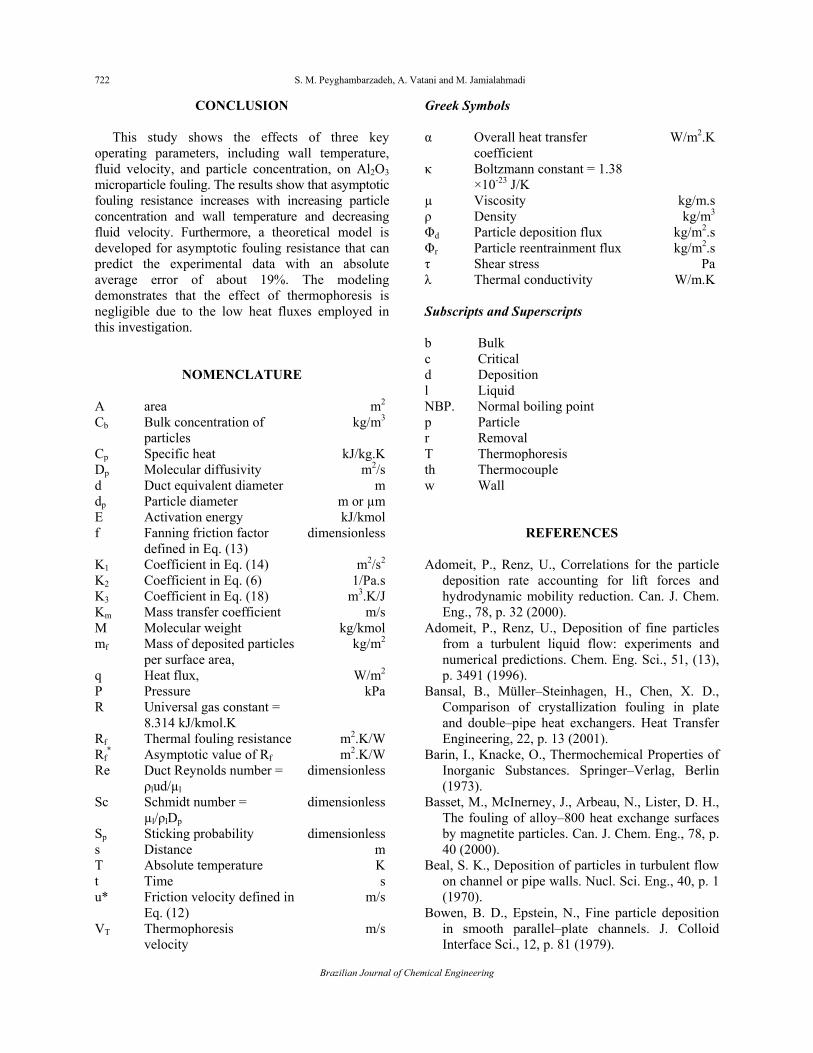
Figure 9 shows the model prediction for the calculation of asymptotic fouling resistance. The results show good agreement between the model and all of the experimental data. The new model can predict the asymptotic fouling resistance with an absolute average error of about 19%.
Figure 9: The comparison of the experimental asymptotic fouling resistance with the prediction of our model, Eq. (22).
722 S. M. Peyghambarzadeh, A. Vatani and M. Jamialahmadi
Brazilian Journal of Chemical Engineering
CONCLUSION
This study shows the effects of three key operating parameters, including wall temperature, fluid velocity, and particle concentration, on Al2O3 microparticle fouling. The results show that asymptotic fouling resistance increases with increasing particle concentration and wall temperature and decreasing fluid velocity. Furthermore, a theoretical model is developed for asymptotic fouling resistance that can predict the experimental data with an absolute average error of about 19%. The modeling demonstrates that the effect of thermophoresis is negligible due to the low heat fluxes employed in this investigation.
NOMENCLATURE A area m2
Cb Bulk concentration of particles
kg/m3
Cp Specific heat kJ/kg.KDp Molecular diffusivity m2/sd Duct equivalent diameter mdp Particle diameter m or µmE Activation energy kJ/kmolf Fanning friction factor
defined in Eq. (13) dimensionless
K1 Coefficient in Eq. (14) m2/s2
K2 Coefficient in Eq. (6) 1/Pa.sK3 Coefficient in Eq. (18) m3.K/JKm Mass transfer coefficient m/sM Molecular weight kg/kmolmf Mass of deposited particles
per surface area, kg/m2
q Heat flux, W/m2
P Pressure kPaR Universal gas constant =
8.314 kJ/kmol.K Rf Thermal fouling resistance m2.K/WRf
* Asymptotic value of Rf m2.K/WRe Duct Reynolds number =
ρlud/µl dimensionless
Sc Schmidt number = µl/ρlDp
dimensionless
Sp Sticking probability dimensionlesss Distance mT Absolute temperature Kt Time su* Friction velocity defined in
Eq. (12) m/s
VT Thermophoresis velocity
m/s
Greek Symbols α Overall heat transfer
coefficient W/m2.K
κ Boltzmann constant = 1.38 ×10⁻²³ J/K
µ Viscosity kg/m.sρ Density kg/m3
Φd Particle deposition flux kg/m2.sΦr Particle reentrainment flux kg/m2.sτ Shear stress Paλ Thermal conductivity W/m.K Subscripts and Superscripts b Bulk c Critical d Deposition l Liquid NBP. Normal boiling point p Particle r Removal T Thermophoresis th Thermocouple w Wall
REFERENCES Adomeit, P., Renz, U., Correlations for the particle
deposition rate accounting for lift forces and hydrodynamic mobility reduction. Can. J. Chem. Eng., 78, p. 32 (2000).
Adomeit, P., Renz, U., Deposition of fine particles from a turbulent liquid flow: experiments and numerical predictions. Chem. Eng. Sci., 51, (13), p. 3491 (1996).
Bansal, B., Müller–Steinhagen, H., Chen, X. D., Comparison of crystallization fouling in plate and double–pipe heat exchangers. Heat Transfer Engineering, 22, p. 13 (2001).
Barin, I., Knacke, O., Thermochemical Properties of Inorganic Substances. Springer–Verlag, Berlin (1973).
Basset, M., McInerney, J., Arbeau, N., Lister, D. H., The fouling of alloy–800 heat exchange surfaces by magnetite particles. Can. J. Chem. Eng., 78, p. 40 (2000).
Beal, S. K., Deposition of particles in turbulent flow on channel or pipe walls. Nucl. Sci. Eng., 40, p. 1 (1970).
Bowen, B. D., Epstein, N., Fine particle deposition in smooth parallel–plate channels. J. Colloid Interface Sci., 12, p. 81 (1979).
Experimental Study of Micro–Particle Fouling Under Forced Convective Heat Transfer 723
Brazilian Journal of Chemical Engineering Vol. 29, No. 04, pp. 713 - 724, October - December, 2012
Bowen, B. D., Levine, S., Epstein, N., Fine particle deposition in laminar flow through parallel-plate and cylindrical channels. J. Colloid Interface Sci., 54, p. 375 (1976).
Buchelli, A., Call, M. L., Brown, A. L., Modeling fouling effects in LDPE tubular polymerization reactors, 1. Fouling thickness determination. Ind. Eng. Chem. Res., 44, p. 1474 (2005).
Campbell, J. M., Gas Conditioning and Processing. Volume 1, 7th Edition, Campbell Petroleum Series (1992).
Cleaver, J. W., Yates, B., A sublayer model for the deposition of particles from a turbulent flow. Chem. Eng. Sci., 30, p. 983 (1975).
Coutinho, J. A. P., Pauly, J., Daridon, J. L., A thermodynamic model to predict wax formation in petroleum fluids. Braz. J. Chem. Eng., 18, (4), p. 411 (2001).
Davies, J. T., A new theory of aerosol deposition from turbulent fluids. J. Chem. Eng., 38, p. 135 (1983).
Einstein, A., The Theory of Brownian Movement. Dover, New York (1956).
Epstein, N., Elements of particle deposition onto nonporous solid surfaces parallel to suspension flows. Experimental Thermal and Fluid Science, 14, p. 323 (1997).
Fernández-Seara, J., Uhía, F. J., Sieres, J., Laboratory practices with the Wilson plot method. Experimental Heat Transfer, 20, p. 123 (2007).
Grandgeorge, S., Jallut, C., Thonon, B., Particulate fouling of corrugated plate heat exchangers. Global kinetic and equilibrium studies. Chem. Eng. Sci., 53, (17), p. 3051 (1998).
Helalizadeh, A., Müller–Steinhagen, H., Jamialahmadi, M., Mixed salt crystallisation fouling. Chemical Engineering and Processing, 39, p. 29 (2000).
Jamialahmadi, M., Soltani, B., Müller-Steinhagen, H., Rashtchian, D., Measurement and prediction of the rate of deposition of flocculated asphaltene particles from oil. Int. J. Heat Mass Transfer, 52, p. 4624 (2009).
Karabelas, A. J., Yiantsios, S. G., Thonont, B., Grillott, J. M., Liquid-side fouling of heat ex-changers, an integrated R&D approach for conventional and novel designs. Applied Thermal Engineering, 17, (8-10), p. 127 (1997).
Kern, D. Q., Seaton, R. E., A theoretical analysis of thermal surface fouling. Brit. Chem. Eng., 4, p. 258 (1959).
Kim, N. H., Webb, R. L., Particulate fouling of water in tubes having a two–dimensional roughness geometry. Int. J. Heat Mass Transfer, 34, (11), p. 2721 (1991).
Kuzmann, R., Handbook of Thermodynamic Tables and Charts. Hemisphere Publication Corporation, Washington D.C. (1976).
Li, W., Modeling liquid–side particulate fouling in internal helical–rib tubes. Chem. Eng. Sci., 62, p. 4204 (2007).
Melo, L. F., Pinheiro, J. D., Particle transport in fouling caused by kaolin–water suspensions on cupper tubes. Can. J. Chem. Eng., 66, p. 36 (1988).
Metzner, A. B., Friend, W. L., Theoretical analogies between heat, mass and momentum transfer and modifications for fluids of high Prandtl or Schmidt numbers. Can. J. Chem. Eng., 36, p. 235 (1958).
Moffat, R. J., Describing the uncertainties in experimental results. Exp. Therm. Fluid Sci., 1, p. 3 (1988).
Müller-Steinhagen, H., Heat transfer fouling: 50 years after the Kern and Seaton model. Heat Transfer Engineering, 32, (1), p. 1 (2011).
Najibi, S. H., Müller-Steinhagen, H., Jamialahmadi, M., Calcium sulphate scale formation during subcooled flow boiling. Chem. Eng. Sci., 52, (8), p. 1265 (1997).
Oliveira, R., Melo, L., Pinheiro, M., Vieira, M. J., Surface interactions and deposit growth in fouling of heat exchangers. Corrosion Rev., 11, p. 55 (1993).
Ozbelge, T. A., Koker, S. H., Heat transfer enhance-ment in water–feldspar upflows through vertical annuli. Int. J. Heat Mass Transfer, 39, (1), p. 135 (1996).
Papavergos, P. G., Hedley, A. B., Particle deposition behaviour from turbulent flows. Chem. Eng. Res. Design, 62, p. 275 (1984).
Sheikholeslami, R., Calcium sulfate fouling–precipitation or particulate: a proposed composite model. Heat Transfer Engineering, 21, p. 24 (2000).
Turner, C., Klimas, S. J., Deposition of magnetite particles from flowing suspensions under flow boiling and single phase forced convective heat transfer. Can. J. Chem. Eng., 78, p. 1065 (2000).
Turner, C. W., Lister, D. H., A study of the deposition of slit onto the surface of type 304 stainless steel. Can. J. Chem. Eng., 69, p. 203 (1991).
Vasak, F., Bowen, B. D., Chen, C. Y., Kastanek, F., Epstein, N., Fine particle deposition in laminar and turbulent flows. Can. J. Chem. Eng., 73, p. 785 (1995).
Walker, P., Sheikholeslami, R., Assessment of the effect of velocity and residence time in CaSO4 precipitating flow reaction. Chem. Eng. Sci., 58, p. 3807 (2003).
724 S. M. Peyghambarzadeh, A. Vatani and M. Jamialahmadi
Brazilian Journal of Chemical Engineering
Watkinson, P., Particulate fouling of sensible heat exchanger. PhD Thesis, University of British Columbia (1969).
Watkinson, P., Epstein, N., Particulate fouling of sensible heat exchangers. Presented at the Fourth International Heat Transfer Conference, Versailles, France (1970).
Whitmore, P. J., Meisen, A., Estimation of thermo– and diffusiophoretic particle deposition. Can. J.
Chem. Eng., 55, p. 279 (1977). Williamson, R., Newson, I., Bott, T. R., The
deposition of hematite particles from flowing water. Can. J. Chem. Eng., 66, p. 51 (1988).
Yiantsios, S. G., Karabelas, A. J., Deposition of micron–sized particles on flat surfaces: Effects of hydrodynamic and physicochemical conditions on particle attachment efficiency. Chem. Eng. Sci., 58, p. 3105 (2003).