Embed Size (px)
Citation preview

J. Aerosp. Technol. Manag., São José dos Campos, Vol.8, No 3, pp.307-318, Jul.-Sep., 2016
ABSTRACT: The purpose of this paper is to present the aerodynamic and flow characteristics of a slender body with a 30° swept wing configuration undergoing a limit cycle oscillation using a synchronous measurement and control technique of wing rock/particle image velocimetry/dynamic pressure associated with the time history of the wing rock motion. The experimental investigation was concentrated on 3 main areas: motion characteristics, static and dynamic surface pressures and static and dynamic particle image velocimetry. The tests’ results revealed that the lag in asymmetric twin vortices over the forebody switching from the left vortice pattern to the right one exhibits a hysteresis evolvement during the wing rock motion; the asymmetric triple vortices over the forebody interacted with the flowfield over wings appeared to induce the instability and damping moments. The main flow phenomena responsible for wing rock of wing body configuration were completely determined by the forebody vortices. These exhibit apparent dynamic hysteresis in vertical position, which further influences the wing flows, and the dynamic hysteresis of flows yields the damping moments sustaining the oscillations.
KEYWORDS: Wing rock, Asymmetric forebody vortices, Wing body, High angle of attack, Wind tunnel test.
Experimental Investigation on Limit Cycle Wing Rock Effect on Wing Body Configuration Induced by Forebody VorticesZhen Rong1,2 , Xueying Deng2, Baofeng Ma2, Bing Wang2
INTRODUCTION
The demand for improved airplane performance occasionally results in maneuvers falling outside the designated flight envelope. One of the limitations to combat effectiveness for all fighter aircraft is the phenomenon of wing rock — a primary motion in roll with, in some cases, a coupled oscillation in yaw. Generally, the onset of wing rock is attributed to a loss of stability in the lateral/directional mode and can be caused by a number of different aerodynamic phenomena.
At high angles of attack, the vortices emanating from the forebody of an aircraft can be very strong. Studies (Katz 1999; Nelson and Pelletier 2003; Ericsson 1989) have shown that interactions between asymmetric forebody vortices and the other surfaces on the aircraft are primarily responsible for wing rock in this flight regime. In a more recent study, Ericsson and Beyers (2003) believed that forebody vortices induce wing rock on a variety of wings with aspect ratios substantially larger than unity. In order to understand the static and dynamic stabilities of an aircraft at high angle of attack, Brandon and Nguyen (1988) found that a forebody cross-sectional shape can strongly effect wing rock behavior at high angle of attack. However, most of the studies focus on the kinematic characteristics of wing rock, and there is little effort to pay close attention to the flow mechanism. Although the mechanism of the wing rock has not been understood so far, some test results indicate that this flow phenomenon does not show repeatability. The HARV F-18 was tested by Quast (1991) in a wind tunnel test using a 2.5%-scale model, and the wing-rock was caused by the interaction of the wing with the forebody vortices. Nevertheless, the limit cycle
doi: 10.5028/jatm.v8i3.627
1.Zhejiang University – School of Aeronautics and Astronautics – Hangzhou/Zhejiang – China. 2.Ministry of Education – Beihang University – Key Laboratory of Fluid Mechanics – Beijing/China.
Author for correspondence: Zhen Rong | Zhejiang University – School of Aeronautics and Astronautics | 38 Zheda Rd – Xihu Dist | Hangzhou/Zhejiang – China – 310027 | Email: [email protected]
Received: 02/25/2016 | Accepted: 05/29/2016
J. Aerosp. Technol. Manag., São José dos Campos, Vol.8, No 3, pp.307-318, Jul.-Sep., 2016
308Rong Z, Deng X, Ma B, Wang B
oscillation on F-18 model was not existent in the test made by Ross and Nguyen (1988). So, it was maybe a determinacy problem for the roll oscillation similar to the asymmetric vortices over a slender body at high angle of attack.
Recently, Deng et al. (2008) and Ma et al. (2015) have studied the effects of artificial perturbation on the tip of the model on behaviors of the wing rock induced by the forebody vortices. Their results showed determinacy problems for the roll oscillation induced by forebody vortices and concluded that, with natural tip perturbations, the roll motion of the model was not deterministic due to the randomness of these perturbations, but the deterministic roll motion could be predetermined by setting an artificial perturbation on the tip of the model. In addition, the model exhibited a limit cycle oscillation motion as the artificial tip perturbations were set at the azimuth angle of 0° or 180° on the tip of the model.
The experiments and analysis reported in the cited references provide some insight into the kinematic and aerodynamic characteristics of the wing rock phenomenon. However, these experiments produced very little data on the unsteady flowfield associated with the rolling motion. To truly understand the relationship between the vertical flowfield and the unsteady aerodynamic roll moment driving the wing in the limit cycle motion induced by the forebody vortices when the artificial tip perturbation is set at the azimuth angle of 0° or 180°, one needs to have information about the surface pressure distributions and the vortices flow structures.
The purpose of this paper is to present the forebody vortices and flowfield over the wings behavior on a wing body configuration undergoing a limit cycle motion using the synchronous measurement and control technique of wing rock/particle image velocimetry (PIV)/dynamic pressure (Rong et al. 2010). The investigations consist of motion history, surface pressure and digital particle image velocimetry (DPIV) experiments with the goal of identifying the primary fluid mechanisms causing the limit cycle oscillation behavior.
The tests’ results revealed that the lag in asymmetric twin vortices over the forebody switching from the left vortice pattern (LVP) to the right vortice pattern (RVP) would exhibit a hysteresis evolvement during the wing rock motion, and the asymmetric triple vortices over the forebody which interacted with the flowfield over wings appeared to induce the instability and damping moments. The main flow phenomena responsible for wing rock of wing body configuration were completely determined by the forebody vortices. The forebody vortices
exhibit apparent dynamic hysteresis in vertical position, which further influences the wing flows, and the dynamic hysteresis of flows yields the damping moments sustaining the oscillations.
EXPERIMENTAL SETUPAll experiments were conducted in the D4 wind tunnel of
Fluid Mechanics Institute of Beihang University. This low-speed low-noise tunnel had a 1.5 × 1.5 × 2.5 m opened test section, with a turbulence level of less than 0.1%; speeds up to 65 m·s–1 could be achieved through a closed-circuit continuous flow system.
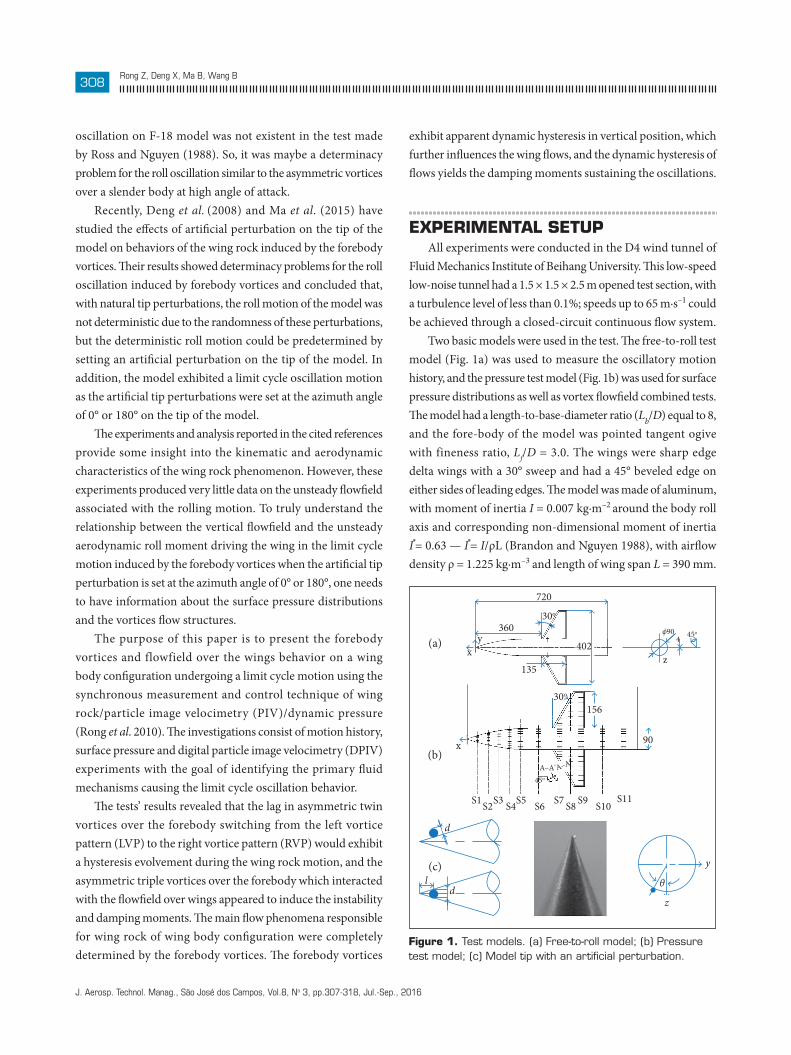
Two basic models were used in the test. The free-to-roll test model (Fig. 1a) was used to measure the oscillatory motion history, and the pressure test model (Fig. 1b) was used for surface pressure distributions as well as vortex flowfield combined tests. The model had a length-to-base-diameter ratio (Lb/D) equal to 8, and the fore-body of the model was pointed tangent ogive with fineness ratio, Lf/D = 3.0. The wings were sharp edge delta wings with a 30° sweep and had a 45° beveled edge on either sides of leading edges. The model was made of aluminum, with moment of inertia I = 0.007 kg·m–2 around the body roll axis and corresponding non-dimensional moment of inertia I⃰ = 0.63 — I⃰ = I/ρL (Brandon and Nguyen 1988), with airflow density ρ = 1.225 kg·m–3 and length of wing span L = 390 mm.
d
dz
y
S11
90x
xy
z
ϕ904
156
135
402
360
720
30o
45o
30o
S10S8S6S4S2S1 S3 S5 S7
A–A'45o
A–A'
S9
θl
Figure 1. Test models. (a) Free-to-roll model; (b) Pressure test model; (c) Model tip with an artificial perturbation.
(a)
(b)
(c)

J. Aerosp. Technol. Manag., São José dos Campos, Vol.8, No 3, pp.307-318, Jul.-Sep., 2016
309Experimental Investigation on Limit Cycle Wing Rock Effect on Wing Body Configuration Induced by Forebody Vortices
Table 1. Pressure tap stations.
Station Dimension (mm) Non-dimensional
S1 45.0 0.5
S2 90.0 1.0
S3 135.0 1.5
S4 180.0 2.0
S5 225.0 2.5
S6 301.5 3.35
S7(W1) 391.5 4.35
S8 (W2) 436.5 4.85
S9 (W3) 481.5 5.35
S10 571.5 6.35
S11 661.5 7.35
The pressure test model had also 11 tapping sections, and pressure taps stations were shown in Table 1. A piece of artificial perturbation (Fig. 1c) made by chinaware was set at the tip of the model at azimuth angle of γ = 0°, being the windward symmetric plane.
Digital Particle Image Velocimetry System (DPIV) measure-ments were taken using a Dantec PIV system (Dantec Company 2000), incorporating a pair of pulsed Nd:YAG lasers with a maximum energy input of 350 mJ per pulse, in order to create a more detailed velocity picture of the flowfield over the model. To illuminate the desired planes, the PIV system was placed besides the test section of the wind tunnel (Fig. 2c). Images were captured using a high-digital camera with a resolution of 2,048 × 2,048 pixels. The commercial software package Flow-Manager and an auto-correlation algorithm were used to analyze the images, with an interrogation window size of 64 by 64 pixels and to produce velocity vectors for further processing. Sequences of 8 instantaneous frames were taken for each case and the time-averaged (or phase-averaged for dynamic roll motion)
FREE-TO-ROLL SYSTEMThe model was mounted on a dynamic roll rig installed
in the D4 wind tunnel (Fig. 2a). The model sting was fitted through a low-friction bearing that could allow the model to rotate “freely” around the longitudinal axis. Motion history was measured using a 12-bit high-precision optical encoder, yielding a resolution of ±0.088°.
In order to obtain the results of the surface flow and the spatial flow structure simultaneously, a synchronous measurement and control technique of wing rock/PIV/dynamic pressure was exploited in D4 wing tunnel (Rong et al. 2010). The surface pressure was measured using pressure scanners based on pressure tubing. The vortex wakes were determined using a PIV system. For the pressure measurements, the pressure tubes were arranged inside the model. These tubes will interfere with the free oscillations of the model, so a forced-to-roll rig driven by a motor was used to drive another model with pressure tubes, thereby reproducing the time histories obtained previously and measuring the surface pressure and vortex wakes during the prescribed motion to avoid the interference. It provided a useful technique for the research of dynamic flow characteristics as the PIV phase-locking accurately and PIV working with dynamic pressure acquisition in-phase were carried out. Figure 2b was the sketch of this combined measurement system.
Figure 2. Test facilities. (a) Free-to-roll rig; (b) PIV/dynamic pressure combined test system; (c) Scene of the PIV system;(d) Forced-to-roll rig.
Wind tunnel
Free stream
Servo motor
Digital encoder
Semi "π" arm
Servo motorPressure scanvalve
Pressure model
Seeding pot
Compressor
RotorGearServoRotor
Compressor
Hyscan2000
PIV platform
Test rig
Lasers
Fog pipesModel
Tunnel
Camera
PIV acquisition computer
PIV synchronization
box
Dynamic control computer
Hyscan2000Pressure system
Camera
Tunnel
Free-to-Roll Sting
Model(a)
(b)
(c)
(d)

J. Aerosp. Technol. Manag., São José dos Campos, Vol.8, No 3, pp.307-318, Jul.-Sep., 2016
310Rong Z, Deng X, Ma B, Wang B
a free stream velocity V = 15 m·s–1, corresponding to a Reynolds number, based on base diameter, of Re = ρVD/μ = 9.0 × 10⁴
and in sub-critical Reynolds number flow (Lamont 1982).
Figure 3. The working principle of synchronous test.
Motion control signal
External trigger delay (∆ tdelay = 20 ms)Delay to open (dt = 30s) Delay to close
External triggerCamera tirg
Camera exposureLaser 1 Trig
Laser 1 Open time
Laser 2 Open time
Dynamic pressure trig
Laser 2 Trig
∆ tdelay
A B
dt
Free-to-roll systemForced-to-roll system
Start step Stable step
60
30
–30
–60
0
0 1 2 3 4
Time [s]
65 7 8 9 10 11
Free-to-roll system Forced-to-roll systemSimulation error
ϕ [°
]
80
–80
40
–40
0
0 1 2 3 4
Time [s]
65 7 8 9 10
Single limit cycle
Velocity ofthe coming
flow = 25 m/s
Angle ofattack = 52.5o
ϕ [d
eg]
velocity fields were calculated. The flow was seeded with particles of mean diameter of 1 μm compressed by the edible bean oil. For the dynamic case, the PIV system was extra-triggered in order to capture the flow field at a specific roll angle and then perform phase averaging (Fig. 3). An error of ±0.02° in the extra-triggered angle existed in these measurements.
The Hyscan2000 was a data acquisition system designed for high-speed data collection and made up of 5 parts, such as DAQ data acquisition, IFM2000 ZOC Module, ZOC Pressure Scanning Modules, CSM2000 Cable-Service Unit and SPC3000 Servo Pressure Calibration Module (Scanivalve Corporation 1992). This data acquisition system could sample and store pressure at rates up to 100,000 channels per second, and the accuracy of pressure measurement was near ±0.06% F.S. The ZOC contains up to 64 pressure sensors in pressure ranged from 0 to 1 psid, and the frequency of the pressure collection was set at 128 Hz. It was manifested that to meet the frequency response requirements, the pressure pipes connected ZOC with model were shorten than 1 m (Cao 2008). In the tests, 0.5 m long pressure pipes were chosen. The working mode of the Hyscan2000 was extra-trigger and host modes.
The forced-to-roll system was accomplished with a DC servo motor and motion control computer board. Encoder signals were used for feedback (Wang et al. 2009), as shown in Fig. 2d. Digital proportional-integral-derivative (PID) with velocity and acceleration feed-forward control was implemented for precision tracking of the time history. Time histories taken with the free-to-roll apparatus were used to provide the input signal to the rock trajectory. The dynamic pressure data and DPIV system was synchronized with the motion control system so that the roll angle and time were known for each sample. The simulation of the time history had a high precision, and the error was limited to 5%, as shown in Fig. 4. The combined measurement data were taken at
Figure 4. Curve of forced-roll simulation (Wang et al. 2009).
Figure 5. The chart of limit cycle oscillation.
RESULTSFigure 5 is the typical plot of the limit cycle motion time history
that is induced by the asymmetric fore-body vortices when the artificial tip perturbations are set at the azimuth angle of 0°. The motion was regardless of the initial conditions. From the plot of time history, the amplitude of the limit cycle motion was about 55° and the frequency of oscillation was 1.35 Hz. Figure 6a shows the variation of limit cycle amplitude with increasing Reynolds number for the model configuration. The trend of the amplitude remained relatively in the same level range of 40° – 60°. The dependence of limit cycle frequency on Reynolds number was also studied, as seen in Fig. 6b. It was revealed that the dominant frequency increased in what appeared to be a linear trend, but the reduced frequency maintained a relatively constant value over the Reynolds number range in sub-critical Reynolds number flow.
In order to investigate the mechanism responsible for the roll moment behavior, experiments were conducted to investigate the behavior of the flowfields over the fore-body and wings of the model using the synchronous measurement and control technique of wing rock/PIV/dynamic pressure, and couple of these information with the behavior of the model motion.

J. Aerosp. Technol. Manag., São José dos Campos, Vol.8, No 3, pp.307-318, Jul.-Sep., 2016
311Experimental Investigation on Limit Cycle Wing Rock Effect on Wing Body Configuration Induced by Forebody Vortices
EFFECT OF THE TIP PERTURBATION AND FLOW STRUCTURES OVER THE WING BODY
Recently, Deng et al. (2002) and Chen (2003) have completed a series of investigations about the tip-perturbation effect and characteristics of asymmetric vortices flow over slender body. Their experiments results showed that the behaviors and structure of asymmetric vortices over a slender body were mainly controlled by artificial perturbation on the tip of slender body compared with geometrical minute irregularities on the model from the machining tolerances. There were 4 sensitive circumferential locations at which bi-stable vortices over slender body were switched by the artificial perturbation (Fig. 7a).
The behaviors of multi-vortices flow structure were inves-tigated by Deng et al. (2003) and Wang (2003) in detail. From their discussions, it was clearly shown that the asymmetric vortices flow patterns at regular state were developed and evolved along the slender body axis, which closely correlates with
908070605040302010
00.0 0.5 1.0 1.5 2.0 2.5 3.0 3.5
0.00.000
0.005
0.010
0.015
0.020
0.5 1.0 1.5 2.0 2.5
Re × 10–6
ϕ max
[deg
]ω
3.0 3.5
α = 52.5o
α = 52.5o
ω = ωL / 2U∞
ω : Oscillation frequencyω: Reduced frequencyL: length of the modelU∞: flow speed
2
1
0Cy
–1
–20 90 180
γ [deg]
270 360
PerturbationACDE
RVP
LVP2
1
0Cy
–1
–20 42 6 8
γ [deg]
γ
10 12
RVP
G
BVL1
VR1
VR2
VL2
VL3
CA
EG
Asymmetric vortices
Vortex street like
Karman
Five vortices
Four vortices
Twin vortices
Inception region developed regionTriple vortices
I
HF
IE
D
CBA
LVP
Figure 6. Variations of wing rock with Reynolds number. (a) Limit cycle amplitude; (b) Limit cycle reduced frequency.
Figure 7. (a) Asymmetric vortices pattern variation with tip perturbation circumferential angle (Deng et al. 2002); (b) Cy ~ x/D with tip perturbation of slender body (Deng et al. 2003); (c) Physical model of multi-vortices structure (Wang 2003).
behaviors of sectional side force distribution. The asymmetric vortices flowfield could be zoned into different regions with the specific features, which included asymmetric twin vortices inception region and fully developed region, asymmetric triple vortices region, 4 vortices region, 5 vortices region and Karman vor- tices street like region shown in Fig. 7b. Consequently, a physical model of asymmetric vortices structure at regular state can be concluded with detailed zonal analysis shown in Fig. 7c.
The Tip Perturbation EffectFigure 8a presents the longitudinal sectional-side-force
distribution of the wing-body model for all the roll angles with an interval of 15 degrees. In the figure, Cy ~ x/D curves — where Cy is the side force of the model, x is the axial distance from the tip of the model, and D means diameter of the afterbody — were collapsed into 2 families which were clearly shown in the 2 mirrored bi-stable states similar to the asymmetric fore-body vortices over the slender body. Left vortices on fore-body (LVF) were referred to that the left one of asymmetric vortices was located in the lower position while the right one was in the higher position when the flow was observed from the x direction, and so was right vortices on fore-body (RVF). The fore-body vortices exhibited twin symmetric vortices at ϕ = 0° due to the response between the artificial perturbation and asymmetric vortices. The pressure distributions and PIV pictures shown in Figs. 8b and 8c and also demonstrated the character of the bi-stable states.
Following the sectional-side-force distribution in Fig. 8a, the flow regions over the wing-body could be divided into different regions: asymmetric twin vortices (A-B), asymmetric triple vortices region (B-C), wings region (C-D) and after-body region (D-E). The present paper discusses the flow pattern development for RVF regular state at ϕ = 30°.
The Cy ~ x/D curves in region A-B presented the asymmetric twin vortices were gradually developing from the A station and fully developed near the B station. The pressure distributions

J. Aerosp. Technol. Manag., São José dos Campos, Vol.8, No 3, pp.307-318, Jul.-Sep., 2016
312Rong Z, Deng X, Ma B, Wang B
and PIV results showed that in this region the flow pattern over the model was clearly twin asymmetric vortices (RVF), as seen
in Fig. 9a, and the strength of the asymmetric vortices appeared to increase from x/D = 0.5 to x/D = 2.5 (Fig. 9b).
0o
4o
7o
11o
14o
20o
30o
49o
–4o
–7o
–11o
–14o
–20o
–30o
–52o
0o
4o
7o
11o
14o
20o
30o
49o
–4o
–7o
–11o
–14o
–20o
–30o
–52o
7.356.35LVP
RVP
α = 52.5o Re = 9 × 10⁴ α = 52.5o Re = 9 × 10⁴ x/D =2.5
C y
B
A CD E
5.354.353.352.521.50.5 1
0–2.0–1.5
–1.0–0.5
0.00.5
1.01.52.0
C p
–2.0–2.5–3.0
–1.5–1.0–0.5
0.00.51.01.5
1 2 3 4 5 6 7 8 0 60 120 180
θ [deg]x/D240 300 360
200
180160140
120100
80
6040
50 100 150 200X-mm
Y-m
m
200
180160140
120100
80
6040
50 100 150 200X-mm
Y-m
m
140
120
100
80
60
4060 100 140 160
X-mm
Y-m
m
80 120
sec 2.5_so-30
VL1
VL1 VL1VR1
VR1
VR1
sec 2.5_so0 sec 2.5_so30
–3.00 60 120 180
θ [deg]240 300 360
C p
–2.0–2.5
–1.5–1.0–0.5
0.00.51.01.5
0.511.5
2.52
α = 52.5o Re = 9 × 10⁴ sec 1sec 0.5
sec 2.5sec 2sec 1.5 200
180160140
120100
80
6040
50 100 150 200X-mm
Y-m
m
140
120
100
80
60
4080 100 140 160
X-mm
Y-m
m
60 120
100
90
80
60
50
4090 100 140 150
X-mm
70Y-m
m
110 120 130
150
100
50
50 100 150X-mm
Y-m
m
150
100
50
50 100 150X-mm
Y-m
m
Figure 8. (a) Cy ~ x/D with roll angle of wing body; (b) Pressure distributions with roll angle at x/D = 2.5 (Cp is the pressure coefficient); (c) PIV results with roll angle at x/D = 2.5.
Figure 9. (a) Pressure distributions with different sections at ϕ = 30°; (b) PIV results with different sections at ϕ = 30°.
(a)
(a)
(b)
(b)
(b)
(c)

J. Aerosp. Technol. Manag., São José dos Campos, Vol.8, No 3, pp.307-318, Jul.-Sep., 2016
313Experimental Investigation on Limit Cycle Wing Rock Effect on Wing Body Configuration Induced by Forebody Vortices
M
0 60 120 180θ [deg] y [mm]
240 300 360 18012060–60–120–180 0
C p
C p
–2.5
–1.5
1.00.50.0
–0.5–1.0–1.5–2.0
–0.5
1.5
0.5
1.5
0 60 120 180θ [deg]
240 300 360
C p
–2.5
–1.5
–0.5
0.5
1.5α = 52.5o
7,35303.35Re = 9 × 10⁴α = 52.5o Re = 9 × 10⁴α = 52.5o Re = 9 × 10⁴ x/D - W2
550
50X-mm
500450400350300250
Y-m
m
150 250 350 450X-mm
500400300200100
Y-m
m
100 200 300 400 500
300
X-mm
250200
150100
50
Y-m
m
100 150 200 250
VL1
VR2
VR2
VR1VL1
Figure 10. Pressure distribution and PIV results.
In the region B-C, the sectional side force decreased with x/D from the B station (Cy maximum) to the C station (near zero) shown in Fig. 8a. As the fore-body vortices developed in the downstream direction, a triple vortices system exhibited at x/D = 3.35.The highly located vortices LVF1 was breakaway from the surface and a new vortices LVF2 (the new left vortices on the forebody) created beneath LVF1 indicated by pressure distribution and PIV picture shown in Figs. 10a and 10b.
With the growth of the triple vortices over the wings, the separated shear layer feeding vorticity was blocked by the wing and the left vorticity remained in the flowfield. As was known to all, the leading edge vortices on the lowly-swept wing were already breakdown at this high angle of attack. The flowfield over the S8 section measured by PIV was shown in Figs. 10c and 10d (region C-D). Two strong vortices sheets were induced by the fore-body vortices near the surface of model (LVF1 and RVF2) and an anti-clockwise rolling moment which could drive the model oscillating in negative direction when the model was free to roll was generated.
In afterbody region (D-E), the sectional side force decayed to or near zero shown in Fig. 8a. The pressure distribution and PIV picture appeared similar to the Karman vortices street like the region (Wang 2003) in Figs. 10e and 10f.
From above detailed discussions, the spatial vortices flow over evolved along the wing body was clearly indicated in Fig. 11a, which included asymmetric twin vortices region, asymmetric triple vortices region, unsteady flow region over the wings and unsteady flow region over the afterbody. Consequently, the spatial flow structure rebuilt by 2D-DPIV results has completed,
and quasi-quantificational description about the evolution of spatial vortices flow could be obtained in Fig. 11b.
V∞
LVPB
A
2.01.51.00.50.0
–0.5–1.0–1.5–2.0
0 1 2 3 4 5 6
x/D
C y
7 8
E
α
C D
Figure 11. (a) Spatial flow structure shown by Cy distribution; (b) Spatial flow structure shown by PIV.
FLOW CHARACTERISTICS AND MECHANISMCross-section Flow and its Evolution
Figure 12 shows the Cy distribution at x/D = 2.5 during the limit cycle motion simulation; the results differed greatly from the static case where the Cy ~ϕ curves were undergoing hysteresis loops near ϕ = 0°. When the model rolls past ϕ = 0° in positive direction, Cy remains positive; as the model continues to roll,
(a)
(a)
(b)
(c) (e)
(b) (d) (f)

J. Aerosp. Technol. Manag., São José dos Campos, Vol.8, No 3, pp.307-318, Jul.-Sep., 2016
314Rong Z, Deng X, Ma B, Wang B
Cy changes from a great positive value to 0, and then continues to negative values. As the role of the inertia, Cy returned the positive maximum platform after an overshooting. The model followed to roll from positive maximum platform to ϕ = 0°, and Cy retained the same value. When the model started to roll in the range of negative angles, the forebody vortices experienced a similar evolution.
-4(-) -7(-) -11(-) -14(-) -20(-) -30(-) -40(-) -52 -40(-) -30(-) -20(-) -14(-)-11(-) -7(-) -4(-)
0 4(+) 7(+) 11(+) 14(+) 20(+) 30(+) 40(+) 49 40(-) 30(-) 20(-) 14(-) 11(-) 7(-) 4(-) 0(-)
α = 52.5o
ϕ = 7o/–7o
Re = 9 × 10⁴
LVP RVP
x/D = 2.5
-2.0-2.5-3.0
-1.5-1.0-0.50.00.51.01.5
C p
0 60 120 180 240 300 360θ [deg]
200
150
100
50
200
150
100
50
200
150
100
50
200
150
100
50
200
150
100
50
200
150
100
50
200
150
100
50
200
150
100
10050
50 150 200 10050 150 200
10050 150 200 10050 150 200
10050 150 200 10050 150 200
10050 150 20010050 150 200
Y-m
mY-
mm
Y-m
mY-
mm
X-mm X-mm
VR1VR1
VR1VR1
VR1
VR1 VR1
VR1
VL1 VL1
VL1 VL1
VL1VL1
VL1 VL1
–80 60 40 20 0 20 40 60-2.0-1.5-1.0-0.5
0.0
0.51.01.5
2.0
80
Cy
x/D
overshooting
α = 52.5o, v = 25 m/s DySt
Figure 12. Chart of side force and vortices forms at x/D = 2.5 during oscillation.
through 0° from negative to positive, the pressure distribution was asymmetric, left vortices are higher and right vortices are lower. To continue rolling, pressure distribution tended to be symmetric until completely symmetrical distribution was exhibited and a peak pressure appeared at the leeward; then the pressure distributions
Figure 13. (a) PIV results and dynamic pressure measurement combined technique (x/D = 2.5); (b) Dynamic pressure measured by PIV and dynamic pressure measurement combined technique (x/D = 2.5).
Further analysis of the forebody vortices characteristics and evolution was to proceed by the combined PIV and dynamic pres-sure measurements results in Fig. 13. Compared to Fig. 8, as a result of forebody vortices evolvement lagged the rolling motion and the response of perturbation did not immediately waken, the pattern of forebody vortices remains the same as RVF when the model rolls past ϕ = 0° and a positive Cy was induced, as shown in Fig. 13a; to continue rolling, the asymmetric degree of vortices came to be weakened, the RVF was lower, and the LVF was upper, until a symmetrical pattern was exhibited. Now Cy equaled to zero. As the model continued to roll, the forebody vortices pattern became LVF-dominated by the tip perturbation until ϕ = 20°. Rolling to the maximum displacement during the wing rock motion, the fore-body vortices were kept to be the LVF. This is the forebody vortices hysteresis process moving from ϕ = 0° to the maximum positive displacement at positive direction. There would be undergoing a similar evolution moving from ϕ = 0° to the maximum negative displacement in negative direction. However, the forebody vortices would keep the LVF at positive angle phase and RVF at negative angle phase, which is consistent with the response of perturbation. It was concluded that the forebody vortices had a close relationship with the tip perturbation during the wing rock motion. Figure 13b displayed the surface pressure distributions at x/D = 2.5 measured in the combined tests synchronized with PIV. The results from the surface pressure can be seen when the rolling angle ϕ is passing
(a)
(b)

J. Aerosp. Technol. Manag., São José dos Campos, Vol.8, No 3, pp.307-318, Jul.-Sep., 2016
315Experimental Investigation on Limit Cycle Wing Rock Effect on Wing Body Configuration Induced by Forebody Vortices
Y-m
mY-
mm
Y-m
mY-
mm
X-mm X-mm
500
400
300
200
200
100
100 300 400 500
500
400
300
200
200
100
100 300 400 500
500
400
300
200
200
100
100 300 400 500
500
400
300
200
200
100
100 300 400 500
500
400
300
200
200
100
100 300 400 500
500
400
300
200
200
100
100 300 400 500
500
400
300
200
200
100
100 300 400 500
500
400
300
200
200
100
100 300 400 500
presented LVF when increasing the roll angle. In conclusion, the forebody vortices characteristics and evolutions shown by pressure distributions were in agreement with the PIV results.
As a result of the pressure taps be on the forebody in the normal direction, roll moment could not be integral by the pressure results. Otherwise, it was found that the forebody vortices could not cause the fuselage rock only in the free-to-roll tests. So, the flowfield over the wings interacted with the forebody vortices was thought to be a driving mechanism of the wing rock motion.
Figure 14 shows that the evolution of the flowfield over wings from ϕ = 0° to the maximum positive displacement in positive direction. When the model rolls past ϕ = 0°, the vortices at forebody remain as the RVF, so in the flowfield over the wing VL1 and VL2 are located at the left side, and VR1 is located at the right side. It was clearly that the vorticity sheet was induced by the VL2 and VR1 with the leading edge of the wing. Due to the VL2 was closer to the wing surface, a larger lift would generate on the left side and
a positive rolling moment would drive the model post rotate at clockwise direction, as the shown pressure distribution. To continue rolling, the new forebody vortice VL2 gradually disappeared and the VL1 moved downward to the surface. However, the VR1 raised upward until the twin forebody vortices became symmetric and the restoring moment was close to 0. Then the forebody vortices pattern switched and in the flowfied over the wing VR2 appeared, so the VR2 was closer to the wing surface and a negative rolling moment would drive the model post rotate at counterclockwise direction; the model was driven to decelerate to roll until the maximum negative displacement. PIV results also revealed a great deal about the behavior of the flowfield on the oscillating wing. However, PIV alone cannot quantify how the unsteady flowfield generates the wing rock motion. For these reasons, unsteady surface pressures were measured on S8 station of wing undergoing wing rock. The pressure results and section rolling moment integrated by the pressure distribution on the S8 station, as shown in Fig. 14. Although the moment coefficient was obtained at only one chord-wise station, all of the non-linearity seen in the actual roll moment curve was captured. The data show the region of instability, the damping lobes and slope depression at the larger roll angles. The pressure distribution of the top surface generated all of the instability in roll moment and very little damping. The bottom surface provided the classical roll damping hysteresis which reduced the instability caused by the flowfied over the top surface.
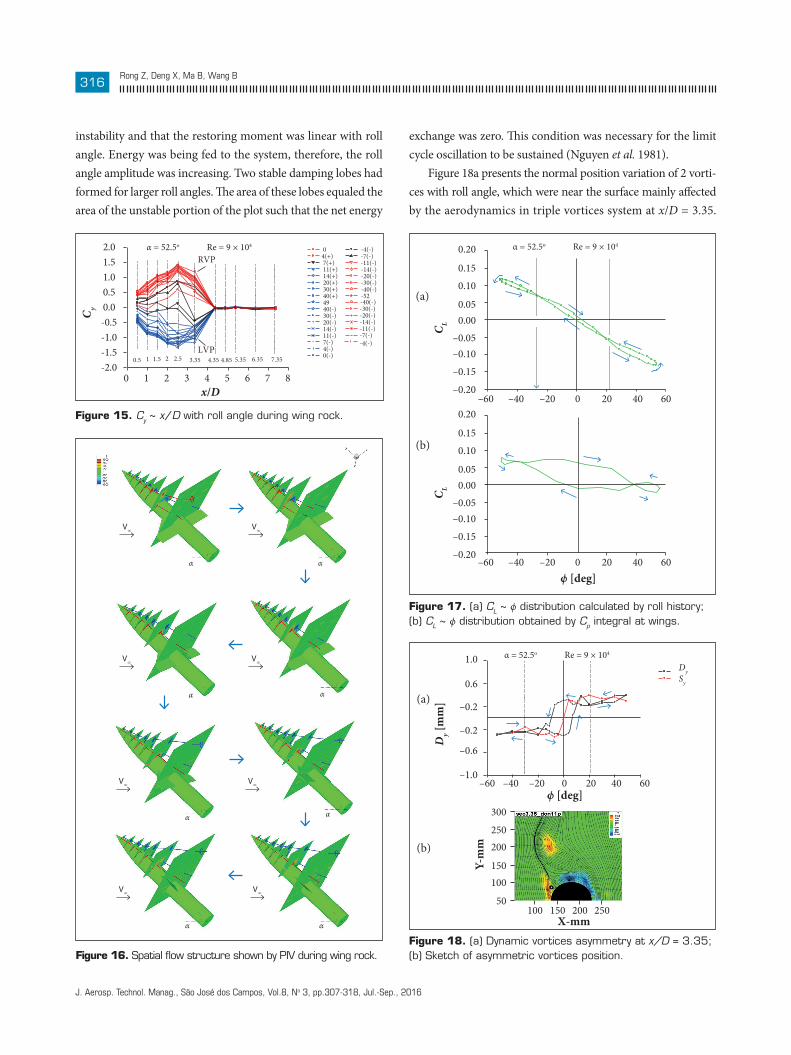
Spatial Vortices Flow and its Evolution In Fig. 15, the Cy ~ x/D curves during the limit cycle oscillation
show that the main contribution of Cy remained to obtain from forebody sections. The magnitude of Cy increased gradually from the tip to section x/D = 2.5, and the maximum of Cy appeared at x/D = 2.5 and then Cy gradually reduced to zero. The hysteresis of Cy ~ x/D could be clearly recognized as the result of forebody switching lag. The hysteresis of the spatial flow structure during the whole oscillation measured by PIV was seen in Fig. 16. When the model was rolling past ϕ = 7°, the forebody vortices and flow over wings were almost symmetrical simultaneously.
Analysis of the Flow Mechanism The rolling moment CL = I · ϕ ̈, where ϕ ̈represents angular
acceleration, yielded the typical wing rock hysteresis loops when plotted as a function of roll angle (Fig. 17a). Another achievement of rolling moment can be obtained by the integral of ΔCp at the regions of wings (S7/S8/S9), where ΔCp = Cpdown − Cpup (Fig. 17b). Note the clockwise loop in the plots which indicated a dynamic
Figure 14. PIV results and dynamic pressure measurement combined technique (S8).
J. Aerosp. Technol. Manag., São José dos Campos, Vol.8, No 3, pp.307-318, Jul.-Sep., 2016
316Rong Z, Deng X, Ma B, Wang B
V∞
α
V∞
α
V∞
α
V∞
α
V∞
α
V∞
α
V∞
α
V∞
α
Figure 16. Spatial flow structure shown by PIV during wing rock.
Figure 15. Cy ~ x/D with roll angle during wing rock.
0 1 2 3 4 5 6 7 8-2.0-1.5-1.0-0.50.00.51.01.52.0
LVP
RVP
7.356.355.354.852.5 4.353.3521.510.5
-4(-) -7(-) -11(-) -14(-) -20(-) -30(-) -40(-) -52 -40(-) -30(-) -20(-) -14(-)-11(-) -7(-) -4(-)
Cy
x/D
0 4(+) 7(+) 11(+) 14(+) 20(+) 30(+) 40(+) 49 40(-) 30(-) 20(-) 14(-) 11(-) 7(-) 4(-) 0(-)
α = 52.5o Re = 9 × 10⁴
–60 –40 –20 0 20 40 60
–60 –40 –20 0ϕ [deg]
20 40 60
–0.20
C L
–0.10
–0.15
–0.05
0.000.05
0.10
0.15
0.20
–0.20
C L
–0.10
–0.15
–0.05
0.000.05
0.10
0.15
0.20
α = 52.5o Re = 9 × 10⁴
α = 52.5o Re = 9 × 10⁴
–60 –40 –20 0ϕ [deg]
20 40 60
Dy [m
m]
–0.6
–1.0
–0.2
–0.2
0.6
1.0DySy
300
X-mm
250200
150100
50
Y-m
m
150100 200 250
Figure 17. (a) CL ~ ϕ distribution calculated by roll history; (b) CL ~ ϕ distribution obtained by Cp integral at wings.
Figure 18. (a) Dynamic vortices asymmetry at x/D = 3.35; (b) Sketch of asymmetric vortices position.
instability and that the restoring moment was linear with roll angle. Energy was being fed to the system, therefore, the roll angle amplitude was increasing. Two stable damping lobes had formed for larger roll angles. The area of these lobes equaled the area of the unstable portion of the plot such that the net energy
exchange was zero. This condition was necessary for the limit cycle oscillation to be sustained (Nguyen et al. 1981).
Figure 18a presents the normal position variation of 2 vorti-ces with roll angle, which were near the surface mainly affected by the aerodynamics in triple vortices system at x/D = 3.35.
(a)
(b)
(a)
(b)
J. Aerosp. Technol. Manag., São José dos Campos, Vol.8, No 3, pp.307-318, Jul.-Sep., 2016
317Experimental Investigation on Limit Cycle Wing Rock Effect on Wing Body Configuration Induced by Forebody Vortices
0.00
–0.06
–0.10–40 ϕ
ϕ
CL
–2020
40
200150
0–150
0
ϕ = 0o
0.00
–0.06
–0.10–40 ϕ
ϕ
CL
–2020
40
200150
0–150
0
ϕ = 4o
0.00
–0.06
–0.10–40 ϕ
ϕ
CL
–2020
40
200150
0–150
0
ϕ = 7o
0.00
–0.06
–0.10–40 ϕ
ϕ
CL
–2020 40
200150
0–150
0
ϕ = 49o
0.00
–0.06
–0.10–40 ϕ
ϕ
CL
–2020
40
200150
0–150
0
ϕ = 20o
0.00
–0.06
–0.10–40 ϕ
ϕ
CL
–2020
40
200150
0–150
0
ϕ = 30o
The presence of the hysteresis lobe was more prominent in the normal direction in this plot; dy was stand by the normal asym-metric in rolling processing between the 2 vortices near the model and defined as dy = yL − yR, where L means left and R, right; sy was stand by the normal asymmetric in static state between the 2 vortices near the model and defined as sy = yL − yR. Figure 18b is a sketch of asymmetric vortices position used to define asym-metric parameters. It can be clearly seen that the hysteresis loop lay roughly within the −20 and +30 roll angle position. A similar look at the roll moment plot (Fig. 19a) shows the same beginning and ending points for the roll moment hysteresis loop and the normal position data show the same agreement.
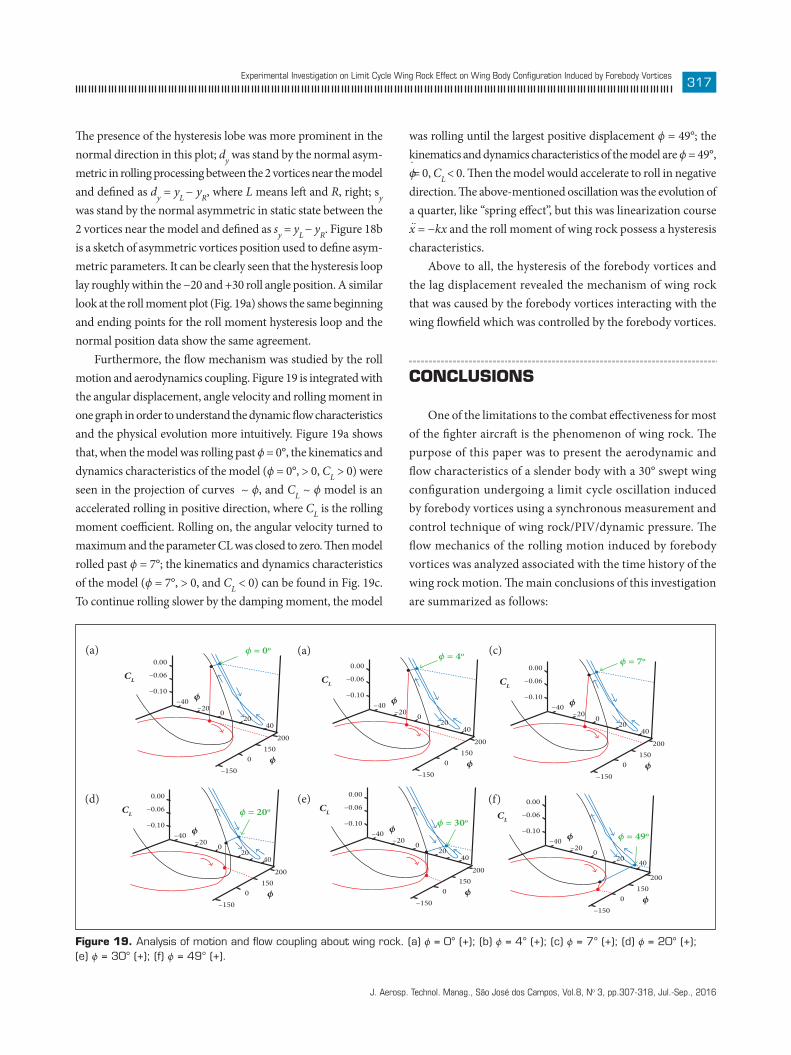
Furthermore, the flow mechanism was studied by the roll motion and aerodynamics coupling. Figure 19 is integrated with the angular displacement, angle velocity and rolling moment in one graph in order to understand the dynamic flow characteristics and the physical evolution more intuitively. Figure 19a shows that, when the model was rolling past ϕ = 0°, the kinematics and dynamics characteristics of the model (ϕ = 0°, > 0, CL > 0) were seen in the projection of curves ~ ϕ, and CL ~ ϕ model is an accelerated rolling in positive direction, where CL is the rolling moment coefficient. Rolling on, the angular velocity turned to maximum and the parameter CL was closed to zero. Then model rolled past ϕ = 7°; the kinematics and dynamics characteristics of the model (ϕ = 7°, > 0, and CL < 0) can be found in Fig. 19c. To continue rolling slower by the damping moment, the model
was rolling until the largest positive displacement ϕ = 49°; the kinematics and dynamics characteristics of the model are ϕ = 49°, ϕ .= 0, CL < 0. Then the model would accelerate to roll in negative
direction. The above-mentioned oscillation was the evolution of a quarter, like “spring effect”, but this was linearization course x ¨ = −kx and the roll moment of wing rock possess a hysteresis characteristics.
Above to all, the hysteresis of the forebody vortices and the lag displacement revealed the mechanism of wing rock that was caused by the forebody vortices interacting with the wing flowfield which was controlled by the forebody vortices.
CONCLUSIONS
One of the limitations to the combat effectiveness for most of the fighter aircraft is the phenomenon of wing rock. The purpose of this paper was to present the aerodynamic and flow characteristics of a slender body with a 30° swept wing configuration undergoing a limit cycle oscillation induced by forebody vortices using a synchronous measurement and control technique of wing rock/PIV/dynamic pressure. The flow mechanics of the rolling motion induced by forebody vortices was analyzed associated with the time history of the wing rock motion. The main conclusions of this investigation are summarized as follows:
Figure 19. Analysis of motion and flow coupling about wing rock. (a) ϕ = 0° (+); (b) ϕ = 4° (+); (c) ϕ = 7° (+); (d) ϕ = 20° (+); (e) ϕ = 30° (+); (f) ϕ = 49° (+).
(a) (c)(a)
(d) (f)(e)

J. Aerosp. Technol. Manag., São José dos Campos, Vol.8, No 3, pp.307-318, Jul.-Sep., 2016
318Rong Z, Deng X, Ma B, Wang B
• In sub-critical Reynolds number flow at angle of attack of 52.5°, the model exhibits a limited cycle oscillation motion when the artificial tip perturbations locate near the azimuthal angles of 0° and 180° on the tip.
• Asymmetric vortices over forebody of wing body appeared to be 2 mirrored bi-stable states similar to the asymmetric forebody vortices over the slender body, and the flow regions over the wing body along the x direction can be divided into different regions: asymmetric twin vortices, asymmetric triple vortices region, wings region and afterbody region.
• Limit cycle oscillation of the wing body configuration is caused by the forebody vortices interacting with the wing flowfield, which was controlled by the forebody vortices. The surface pressure distributions and the DPIV results during the rolling motion revealed that the asymmetric twin vortices over the forebody switching from LVP to RVP would exhibit a hysteresis evolvement during the wing rock motion. At the wing region, the
asymmetric triple vortices over the forebody interacted with the flowfield over the wing appeared to induce the instability and damping moments; the flowfield at the bottom of the wing was found to provide a majority of damping moment. In general, the wind tunnel tests confirmed that the main flow phenomena responsible for wing rock of the wing body configuration were determined by the forebody vortices and interacted with these and flowfield on the wing.
ACKNOWLEDGEMENTS
The project is supported by the National Natural Science Foundation of China (NSFC), under Grant No. 10702004, and partly supported by NSFC under Grant No. 11502234, as well as the Zhejiang Provincial Natural Science Foundation under grant No. LY14A020002.
REFERENCESBrandon JM, Nguyen LT (1988) Experimental study of effects of forebody geometry on high angle-of-attack stability. J Aircraft 25(7):591-597. doi: 10.2514/3.45628
Cao BC (2008) Dynamic pressure measurement technology in the wind tunnel and its application in the investigation of wing-rock phenomenon (Master’s thesis). Beijing: Beihang University. In Chinese.
Chen X (2003) Perturbation effect and active control on behaviors of asymmetric vortices over slender body (PhD thesis). Beijing: Beihang University. In Chinese.
Dantec Company (2000) Flow manager software and introduction to PIV instrumentation. Skovlunde: Dantec Company.
Deng X, Chen X, Wang Y, Liu P (2002) Influence of tip perturbations on behaviors of asymmetric vortices over slender body. AIAA 2002-4710.
Deng X, Wang G, Chen X, Wang Y, Liu P, Xi Z (2003) A physical model of asymmetric vortices flow structure in regular state over slender body at high angle of attack. Sci China E 46(6):561-573. doi: 10.1360/02ye0164
Deng XY, Tian W, Ma BF, Wang YK (2008) Recent progress on the study of asymmetric vortex flow over slender bodies. Acta Mech Sin 24(5):475-487. doi: 10.1007/s10409-008-0197-3
Ericsson LE (1989) Wing rock generated by forebody vortices. J Aircraft 26(2):110-116. doi: 10.2514/3.45731
Ericsson L, Beyers M (2003) The challenge of determining combat aircraft wing rock through subscale testing. Proceedings of the 41st Aerospace Sciences Meeting and Exhibit, Aerospace Sciences Meetings; Reno, USA.
Katz J (1999) Wing/vortex interactions and wing rock. Progr Aero Sci 35(7):727-750. doi: 10.1016/S0376-0421(99)00004-4
Lamont PJ (1982) Pressures around an inclined ogive cylinder with laminar, transitional, or turbulent separation. AIAA J 20(11):1492-1499. doi: 10.2514/3.51212
Ma BF, Deng XY, Rong Z, Wang B (2015) The self-excited rolling oscillations induced by fore-body vortices. Aero Sci Tech 47:299-313. doi: 10.1016/j.ast.2015.10.003
Nelson RC, Pelletier A (2003) The unsteady aerodynamics of slender wings and aircraft undergoing large amplitude maneuvers. Progress in Aerospace Sciences 39(2-3):185-248. doi: 10.1016/S0376-0421(02)00088-X
Nguyen LT, Yip LP, Chambers JR (1981) Self-induced wing rock of slender delta wings. Proceedings of the Atmospheric Flight Mechanics Conference; Albuquerque, USA.
Quast T (1991) A study of high alpha dynamics and flow visualization for a 2.5% model of the F-18 HARV undergoing wing rock (Master’s thesis). South Bend: University of Notre Dame.
Rong Z, Deng XY, Wang B, Ma BF (2010) The development of a synchronous measurement and control technique of wing rock/PIV/dynamic pressure and application to the study of wing rock. Acta Aerodynamica Sinica 28(2):180-187.
Ross AJ, Nguyen LT (1988) Some observations regarding wing rock oscillations at high angles of attack. AIAA Paper 88-4371-CP.
Scanivalve Corporation (1992) Hyscan 2000 pressure system. Liberty Lake: Scanivalve Corporation.
Wang B, Huang CD, Ma BF, Deng XY (2009) The control method of precise reproduction of the wing rock motion. Journal of Experiments in Fluid Mechanics 23(1):79-104.
Wang G (2003) Experimental study of flowfield structure around an ogive-cylinder (PhD thesis). Beijing: Beihang University. In Chinese