Embed Size (px)
Citation preview
Mahal S.K. and A.J. Alimin / International Energy Journal 20 (2020) 67 – 86
www.rericjournal.ait.ac.th
67
Abstract – Electric power and water play a pivotal role in all aspects of daily life. In attempts to provide renewable energy-sourced systems for the concurrent generation of power and fresh water, a few studies have been conducted over the last two decades to combine solar chimney power plant (SCPP) with fresh water production systems (FWPS). These studies have mostly been theoretical approaches with significant feasibility limitations. In this article, a novel solar-powered hybrid generator of power and fresh water is presented, where SCPP has been combined with liquid desiccant system( LDS) to simultaneously produce power and fresh water. This combination utilizes the advantages of LDS of calcium chloride to turn the SCPP working air humidity into fresh water. A pilot plant of this technology was designed, constructed, and tested on an hourly basis over ten randomly selected days in October-December 2018. Consequently, its concept of operation was proven. It was concluded that using this technology and under daily averages of solar irradiance of 500 W/m2 and atmospheric air humidity ratio of 0.019 (kg water vapour/ kg dry air), a combination of power generation capacity higher than 50 MW could economically produce power and fresh water. Furthermore, an average of 5.6 l/hr of fresh water could be produced per 1 kg/s of SCPP working air. Nevertheless, the current technology enables using a wide controllable range (0%-100%) of SCPP produced power to generate fresh water. Keywords – electric power, fresh water, hybrid generator, liquid desiccant, solar chimney.
1 1. INTRODUCTION
The utmost significance of electric power and fresh water is represented by the crucial role they play in all aspects of every day’s human life [1],[2],[3]. Over the last century, the production processes of both power and fresh water have dominantly been driven using fossil fuels. The use of fossil fuels has shown challenging issues, which are mainly the damage they cause to the environment and the depletion of their sources. Furthermore, attaining the worldwide intensive growing demand for those two crucial resources has necessitated the switching to sustainable energy sources for the purposes of producing them. Among various utilized sustainable and environmentally safe energy resources, solar energy has been found as the most dependable and affordable renewable energy resource [1]. Solar updraft tower (SUT), or solar chimney power plant (SCPP), represents one of the means that have been developed and implemented to convert solar energy into electric power. In 1980’s [4],[5],[6], a number of studies were carried out to upgrade a basic design of SUT that had been introduced centuries ago by Leonardo Da Vinci [4]. Haaf et al. [4],[5] presented the design and testing results of Manzanares pilot SCPP in Spain, which launched operation in 1982. Those results have been considered as a foundation of this developing technology and benchmark for all the subsequent related
*Faculty of Mechanical and Manufacturing Engineering, Universiti Tun Hussein Onn Malaysia, Parit Raja, Batu Pahat, 86400 Johor, Malaysia. 1Corresponding author: Tel: +60 167958256, Fax: + 60 74536080. Email: [email protected].
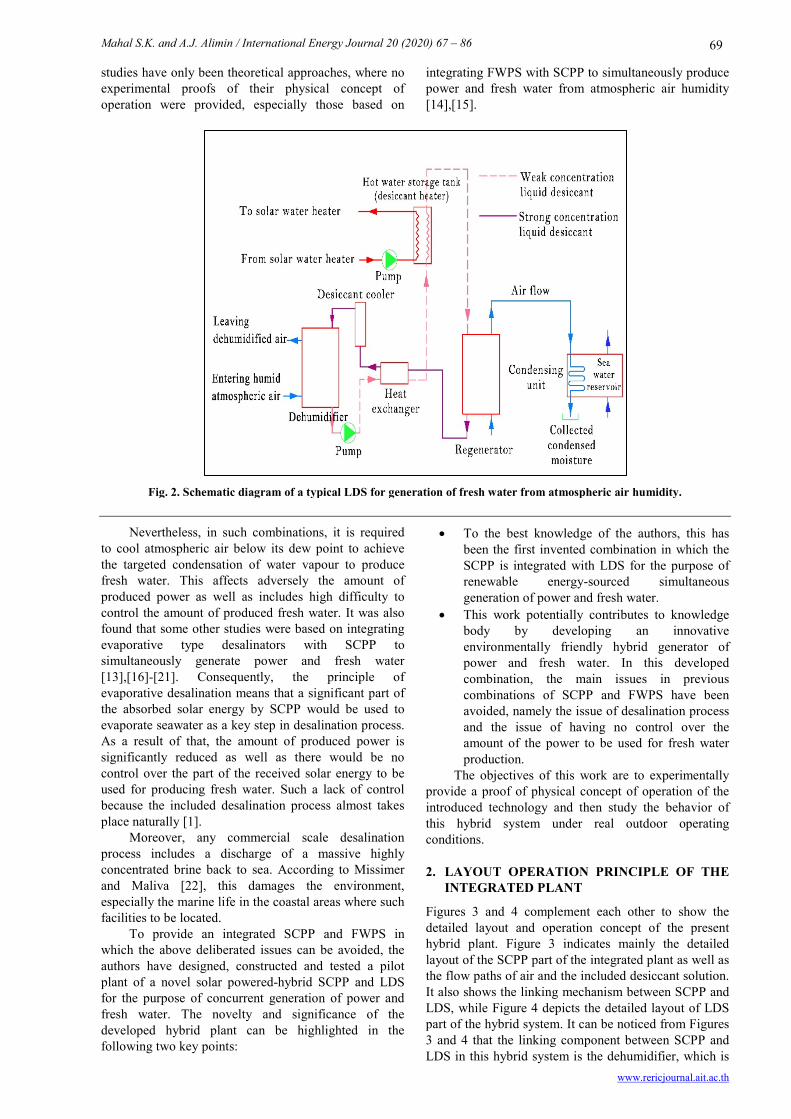
studies. The physical concept of operation as well as the configuration of a typical SUT are shown in Figure 1. The plant consists of three main components, namely, solar collector, chimney tower and ducted type wind turbine. The collector is of a circular geometry with a radius abbreviated as RC and a canopy made of pellucid material fixed above the ground at a certain height abbreviated as hC. The chimney tower is a circular duct of a radius abbreviated as RT and a height abbreviated as HT. The tower could be constructed of either steel or concrete structure [4]. The wind turbine is typically of horizontal axis type (air flow is parallel to rotation axis), coupled to an electrical generator at its lower shaft end. The collector receives solar radiation, and due to greenhouse effects, the ground underneath the transparent canopy is heated. In the meantime, it heats the adjacent mass of air, which is induced to move, via natural convection mechanism, from collector perimeter towards the plant tower inlet where a decreasing pressure gradient is maintained by the chimney pipe [6],[7]. In other words, the collector and chimney pipe complement each other to create and maintain the targeted air flow throughout the plant’s passages, in such a manner that the collector provides the temperature rise required to make the flowing air stream lower in density as it advances towards chimney inlet, while the chimney pipe with the pressure difference between its top (outlet) and bottom (inlet), due to altitude difference, provides the needed decreasing pressure gradient [2],[4]. Moreover, at inlet of the chimney pipe where the wind turbine is located, the surge of the effectuated large volume of air will lead to a strong upwind. This upwind would drive the turbine, which in its turn rotates a coupled electrical generator and thus produces electricity [4],[6].
Experimental Investigation on a Novel Integrated Solar Chimney and Liquid Desiccant System for Simultaneous
Power and Fresh Water Generation
Sabah K. Mahal* and Ahmad J. Alimin*,1
www.rericjournal.ait.ac.th
Mahal S.K. and A.J. Alimin / International Energy Journal 20 (2020) 67 – 86
www.rericjournal.ait.ac.th
68
With respect to water scarcity worldwide, desalination represents the most widely used measure to help achieve the possible quantities of the demanded fresh water. However, desalination process can only be used in coastal areas where the seawater is available. In addition to that, there are serious environmental and economic challenges encountered in all types of desalination systems [1]. Consequently, there have globally been strategic plans to develop fresh water generation technologies characterized of being environmentally safe, economically viable and renewable energy- sourced. Atmosphere represents a large reservoir with approximately 37.5x10¹⁵ gallons of water in an invisible
vapour form [1]. One of most promising technologies is the utilization of solar-powered liquid desiccant system (LDS) to turn atmospheric air humidity into fresh water [8]-[12]. Liquid desiccants are aqueous solutions of a high affinity for water vapour, such as glycol, lithium bromide (LiBr), lithium chloride (LiCl), and calcium chloride (CaCl2) [8]. The high affinity property of those solutions for water vapour is the key in creating systems that dehumidify air without the need to cool it below dew point temperature. Hence, such systems save energy and environment, especially if combined in optimal manner with SCPP for the purpose of fresh water production from the atmospheric humidity [2],[3].
Fig. 1. Schematic diagram of a typical SCPP.
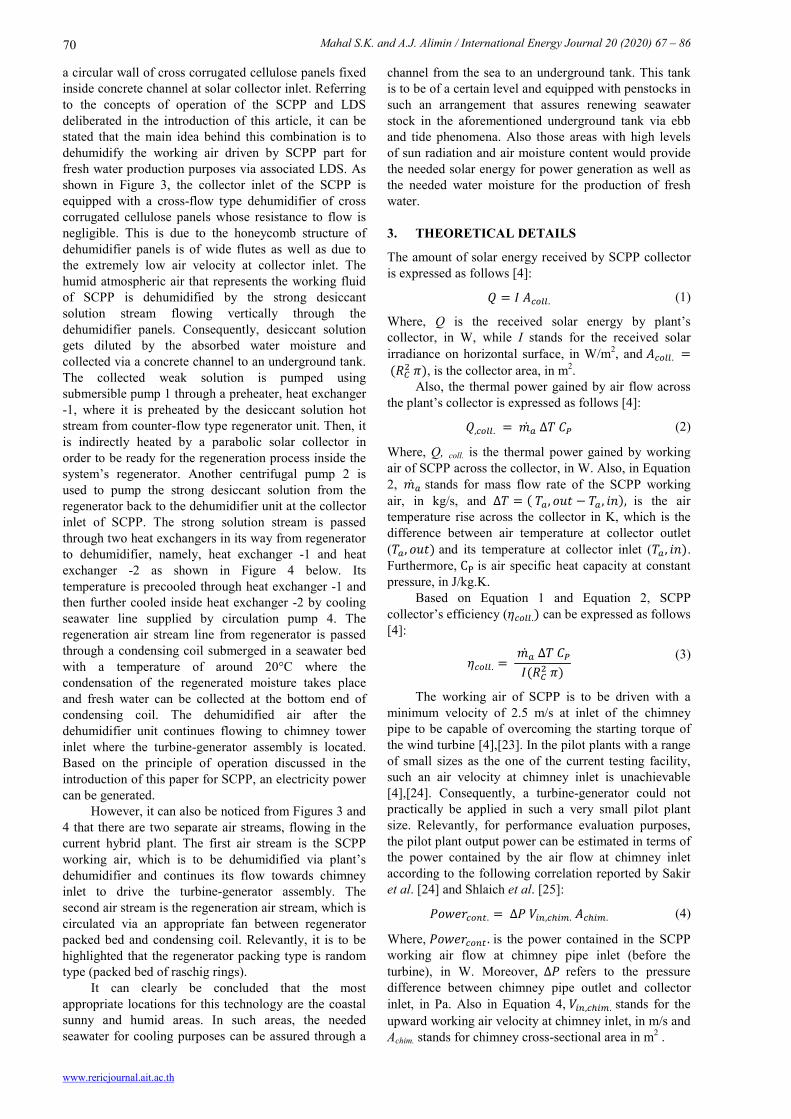
Furthermore, liquid desiccants can be considered as natural disinfectants because of their ability to remove airborne microorganisms, bacteria and viruses aside from removing odors without using expensive filters [8]. The schematic diagram shown in Figure 2 demonstrates the operation principle of collecting fresh water from atmospheric air humidity using liquid desiccants.
As shown in Figure 2, the typical LDS consists of two main units, which are the dehumidifier and regenerator. It is also composed of heat exchangers, circulating pumps, desiccant cooler and desiccant solar heater.
The strong desiccant solution absorbs the moisture contained in the humid air while flowing against each other in the system’s dehumidifier. After the weak solution leaves the dehumidifier, it enters a heat exchanger in order to be warmed up. A hot water storage tank with internal heat exchanger is used to furtherly
heat up the solution before entering the regenerator. A suitable solar water heater is applied to heat up the storage tank. In the regenerator, the hot weak solution desorbs the water vapour to counter flow dry air stream. The condensation of the water vapour contained by this air stream and the collection of the resulting distilled water is achieved via a cooling coil plunged in a cold seawater bed. Relevantly, it is worth to mention that seawater available naturally with temperatures around 20°C can be used as means for the needed cooling in the LDS operation [10].
Since 2006, the concept of integrating SUT and fresh water production systems (FWPS) has been investigated by numerous researchers to specify such a hybrid plant with optimum utilization and performance efficiencies [13]. However, the literature survey has shown that only few studies have been carried out in this topic [2],[3]. It was found that most of the conducted
Mahal S.K. and A.J. Alimin / International Energy Journal 20 (2020) 67 – 86
www.rericjournal.ait.ac.th
69
studies have only been theoretical approaches, where no experimental proofs of their physical concept of operation were provided, especially those based on
integrating FWPS with SCPP to simultaneously produce power and fresh water from atmospheric air humidity [14],[15].
Fig. 2. Schematic diagram of a typical LDS for generation of fresh water from atmospheric air humidity.
Nevertheless, in such combinations, it is required to cool atmospheric air below its dew point to achieve the targeted condensation of water vapour to produce fresh water. This affects adversely the amount of produced power as well as includes high difficulty to control the amount of produced fresh water. It was also found that some other studies were based on integrating evaporative type desalinators with SCPP to simultaneously generate power and fresh water [13],[16]-[21]. Consequently, the principle of evaporative desalination means that a significant part of the absorbed solar energy by SCPP would be used to evaporate seawater as a key step in desalination process. As a result of that, the amount of produced power is significantly reduced as well as there would be no control over the part of the received solar energy to be used for producing fresh water. Such a lack of control because the included desalination process almost takes place naturally [1]. Moreover, any commercial scale desalination process includes a discharge of a massive highly concentrated brine back to sea. According to Missimer and Maliva [22], this damages the environment, especially the marine life in the coastal areas where such facilities to be located. To provide an integrated SCPP and FWPS in which the above deliberated issues can be avoided, the authors have designed, constructed and tested a pilot plant of a novel solar powered-hybrid SCPP and LDS for the purpose of concurrent generation of power and fresh water. The novelty and significance of the developed hybrid plant can be highlighted in the following two key points:
• To the best knowledge of the authors, this has been the first invented combination in which the SCPP is integrated with LDS for the purpose of renewable energy-sourced simultaneous generation of power and fresh water.
• This work potentially contributes to knowledge body by developing an innovative environmentally friendly hybrid generator of power and fresh water. In this developed combination, the main issues in previous combinations of SCPP and FWPS have been avoided, namely the issue of desalination process and the issue of having no control over the amount of the power to be used for fresh water production.
The objectives of this work are to experimentally provide a proof of physical concept of operation of the introduced technology and then study the behavior of this hybrid system under real outdoor operating conditions.
2. LAYOUT OPERATION PRINCIPLE OF THE INTEGRATED PLANT
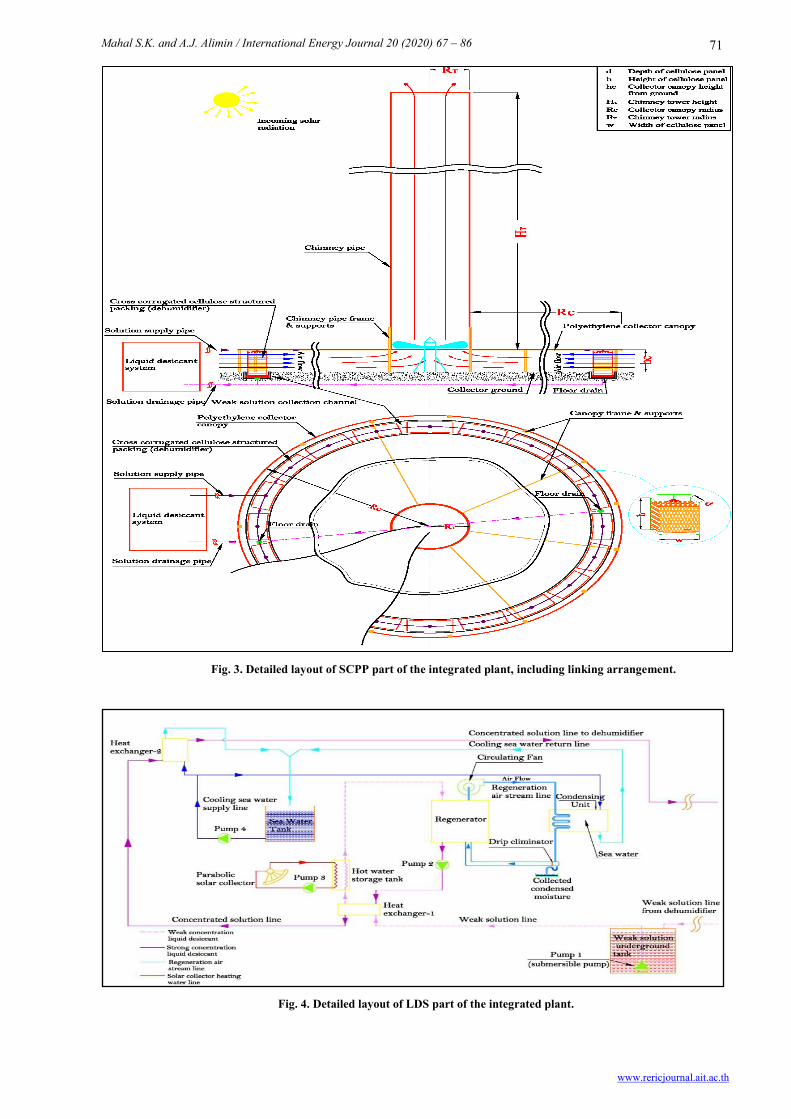
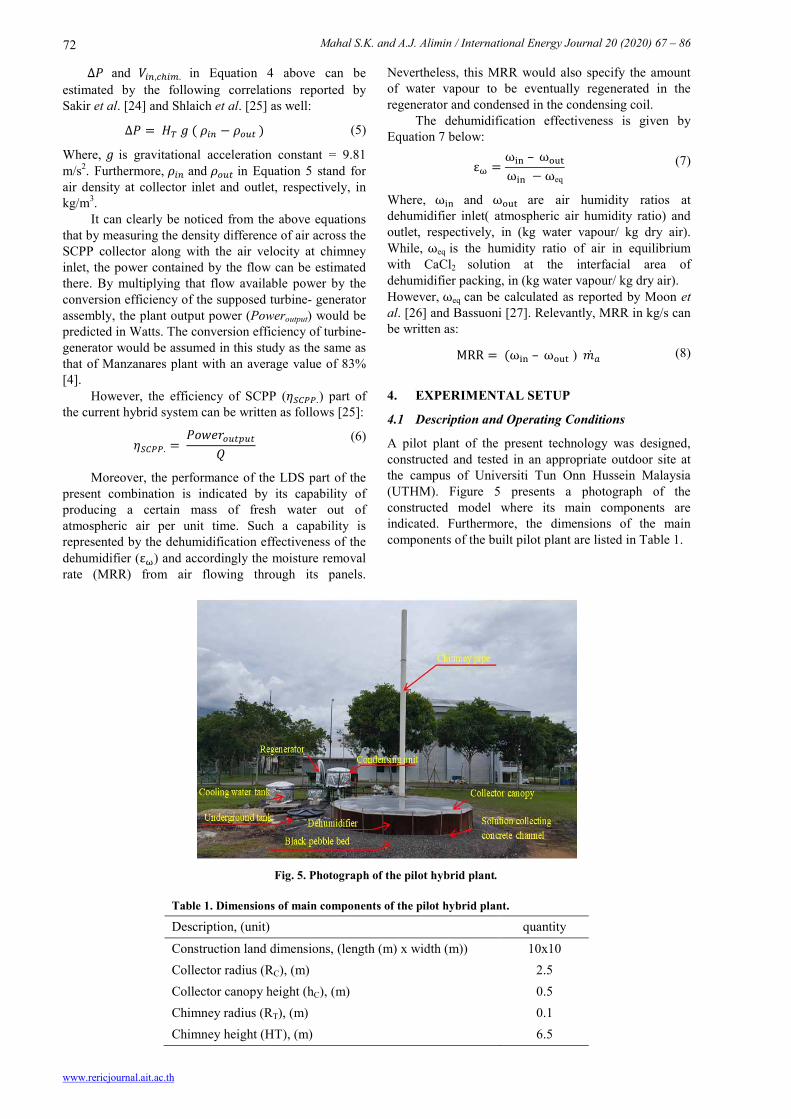
Figures 3 and 4 complement each other to show the detailed layout and operation concept of the present hybrid plant. Figure 3 indicates mainly the detailed layout of the SCPP part of the integrated plant as well as the flow paths of air and the included desiccant solution. It also shows the linking mechanism between SCPP and LDS, while Figure 4 depicts the detailed layout of LDS part of the hybrid system. It can be noticed from Figures 3 and 4 that the linking component between SCPP and LDS in this hybrid system is the dehumidifier, which is
Mahal S.K. and A.J. Alimin / International Energy Journal 20 (2020) 67 – 86
www.rericjournal.ait.ac.th
70
a circular wall of cross corrugated cellulose panels fixed inside concrete channel at solar collector inlet. Referring to the concepts of operation of the SCPP and LDS deliberated in the introduction of this article, it can be stated that the main idea behind this combination is to dehumidify the working air driven by SCPP part for fresh water production purposes via associated LDS. As shown in Figure 3, the collector inlet of the SCPP is equipped with a cross-flow type dehumidifier of cross corrugated cellulose panels whose resistance to flow is negligible. This is due to the honeycomb structure of dehumidifier panels is of wide flutes as well as due to the extremely low air velocity at collector inlet. The humid atmospheric air that represents the working fluid of SCPP is dehumidified by the strong desiccant solution stream flowing vertically through the dehumidifier panels. Consequently, desiccant solution gets diluted by the absorbed water moisture and collected via a concrete channel to an underground tank. The collected weak solution is pumped using submersible pump 1 through a preheater, heat exchanger -1, where it is preheated by the desiccant solution hot stream from counter-flow type regenerator unit. Then, it is indirectly heated by a parabolic solar collector in order to be ready for the regeneration process inside the system’s regenerator. Another centrifugal pump 2 is used to pump the strong desiccant solution from the regenerator back to the dehumidifier unit at the collector inlet of SCPP. The strong solution stream is passed through two heat exchangers in its way from regenerator to dehumidifier, namely, heat exchanger -1 and heat exchanger -2 as shown in Figure 4 below. Its temperature is precooled through heat exchanger -1 and then further cooled inside heat exchanger -2 by cooling seawater line supplied by circulation pump 4. The regeneration air stream line from regenerator is passed through a condensing coil submerged in a seawater bed with a temperature of around 20°C where the condensation of the regenerated moisture takes place and fresh water can be collected at the bottom end of condensing coil. The dehumidified air after the dehumidifier unit continues flowing to chimney tower inlet where the turbine-generator assembly is located. Based on the principle of operation discussed in the introduction of this paper for SCPP, an electricity power can be generated. However, it can also be noticed from Figures 3 and 4 that there are two separate air streams, flowing in the current hybrid plant. The first air stream is the SCPP working air, which is to be dehumidified via plant’s dehumidifier and continues its flow towards chimney inlet to drive the turbine-generator assembly. The second air stream is the regeneration air stream, which is circulated via an appropriate fan between regenerator packed bed and condensing coil. Relevantly, it is to be highlighted that the regenerator packing type is random type (packed bed of raschig rings). It can clearly be concluded that the most appropriate locations for this technology are the coastal sunny and humid areas. In such areas, the needed seawater for cooling purposes can be assured through a
channel from the sea to an underground tank. This tank is to be of a certain level and equipped with penstocks in such an arrangement that assures renewing seawater stock in the aforementioned underground tank via ebb and tide phenomena. Also those areas with high levels of sun radiation and air moisture content would provide the needed solar energy for power generation as well as the needed water moisture for the production of fresh water.
3. THEORETICAL DETAILS
The amount of solar energy received by SCPP collector is expressed as follows [4]:
𝑄 = 𝐼 𝐴𝑐𝑜𝑙𝑙. (1)
Where, Q is the received solar energy by plant’s collector, in W, while I stands for the received solar irradiance on horizontal surface, in W/m2, and 𝐴𝑐𝑜𝑙𝑙. = (𝑅𝐶2 𝜋), is the collector area, in m2. Also, the thermal power gained by air flow across the plant’s collector is expressed as follows [4]:
𝑄,𝑐𝑜𝑙𝑙. = 𝑚𝑎̇ ∆𝑇 𝐶𝑃 (2)
Where, Q, coll. is the thermal power gained by working air of SCPP across the collector, in W. Also, in Equation 2, 𝑚𝑎̇ stands for mass flow rate of the SCPP working air, in kg/s, and ∆𝑇 = ( 𝑇𝑎, 𝑜𝑢𝑡 − 𝑇𝑎 , 𝑖𝑛), is the air temperature rise across the collector in K, which is the difference between air temperature at collector outlet (𝑇𝑎, 𝑜𝑢𝑡) and its temperature at collector inlet (𝑇𝑎 , 𝑖𝑛). Furthermore, CP is air specific heat capacity at constant pressure, in J/kg.K. Based on Equation 1 and Equation 2, SCPP collector’s efficiency (𝜂𝑐𝑜𝑙𝑙.) can be expressed as follows [4]:
𝜂𝑐𝑜𝑙𝑙. = 𝑚𝑎̇ ∆𝑇 𝐶𝑃𝐼(𝑅𝐶2 𝜋)
(3)
The working air of SCPP is to be driven with a minimum velocity of 2.5 m/s at inlet of the chimney pipe to be capable of overcoming the starting torque of the wind turbine [4],[23]. In the pilot plants with a range of small sizes as the one of the current testing facility, such an air velocity at chimney inlet is unachievable [4],[24]. Consequently, a turbine-generator could not practically be applied in such a very small pilot plant size. Relevantly, for performance evaluation purposes, the pilot plant output power can be estimated in terms of the power contained by the air flow at chimney inlet according to the following correlation reported by Sakir et al. [24] and Shlaich et al. [25]:
𝑃𝑜𝑤𝑒𝑟𝑐𝑜𝑛𝑡. = ∆𝑃 𝑉𝑖𝑛,𝑐ℎ𝑖𝑚. 𝐴𝑐ℎ𝑖𝑚. (4)
Where, 𝑃𝑜𝑤𝑒𝑟𝑐𝑜𝑛𝑡 . is the power contained in the SCPP working air flow at chimney pipe inlet (before the turbine), in W. Moreover, ∆𝑃 refers to the pressure difference between chimney pipe outlet and collector inlet, in Pa. Also in Equation 4, 𝑉𝑖𝑛,𝑐ℎ𝑖𝑚. stands for the upward working air velocity at chimney inlet, in m/s and Achim. stands for chimney cross-sectional area in m2 .
Mahal S.K. and A.J. Alimin / International Energy Journal 20 (2020) 67 – 86
www.rericjournal.ait.ac.th
71
Fig. 1. Fig. 3. Detailed layout of SCPP part of the integrated plant, including linking arrangement.
Fig. 4. Detailed layout of LDS part of the integrated plant.
Mahal S.K. and A.J. Alimin / International Energy Journal 20 (2020) 67 – 86
www.rericjournal.ait.ac.th
72
∆𝑃 and 𝑉𝑖𝑛,𝑐ℎ𝑖𝑚. in Equation 4 above can be estimated by the following correlations reported by Sakir et al. [24] and Shlaich et al. [25] as well:
∆𝑃 = 𝐻𝑇 𝑔 ( 𝜌𝑖𝑛 − 𝜌𝑜𝑢𝑡 ) (5)
Where, 𝑔 is gravitational acceleration constant = 9.81 m/s2. Furthermore, 𝜌𝑖𝑛 and 𝜌𝑜𝑢𝑡 in Equation 5 stand for air density at collector inlet and outlet, respectively, in kg/m3. It can clearly be noticed from the above equations that by measuring the density difference of air across the SCPP collector along with the air velocity at chimney inlet, the power contained by the flow can be estimated there. By multiplying that flow available power by the conversion efficiency of the supposed turbine- generator assembly, the plant output power (Poweroutput) would be predicted in Watts. The conversion efficiency of turbine- generator would be assumed in this study as the same as that of Manzanares plant with an average value of 83% [4]. However, the efficiency of SCPP (𝜂𝑆𝐶𝑃𝑃.) part of the current hybrid system can be written as follows [25]:
𝜂𝑆𝐶𝑃𝑃. = 𝑃𝑜𝑤𝑒𝑟𝑜𝑢𝑡𝑝𝑢𝑡
𝑄
(6)
Moreover, the performance of the LDS part of the present combination is indicated by its capability of producing a certain mass of fresh water out of atmospheric air per unit time. Such a capability is represented by the dehumidification effectiveness of the dehumidifier (εω) and accordingly the moisture removal rate (MRR) from air flowing through its panels.
Nevertheless, this MRR would also specify the amount of water vapour to be eventually regenerated in the regenerator and condensed in the condensing coil. The dehumidification effectiveness is given by Equation 7 below:
εω =ωin – ωout
ωin − ωeq (7)
Where, ωin and ωout are air humidity ratios at dehumidifier inlet( atmospheric air humidity ratio) and outlet, respectively, in (kg water vapour/ kg dry air). While, ωeq is the humidity ratio of air in equilibrium with CaCl2 solution at the interfacial area of dehumidifier packing, in (kg water vapour/ kg dry air). However, ωeq can be calculated as reported by Moon et al. [26] and Bassuoni [27]. Relevantly, MRR in kg/s can be written as:
MRR = (ωin – ωout ) 𝑚𝑎̇ (8)
4. EXPERIMENTAL SETUP
4.1 Description and Operating Conditions
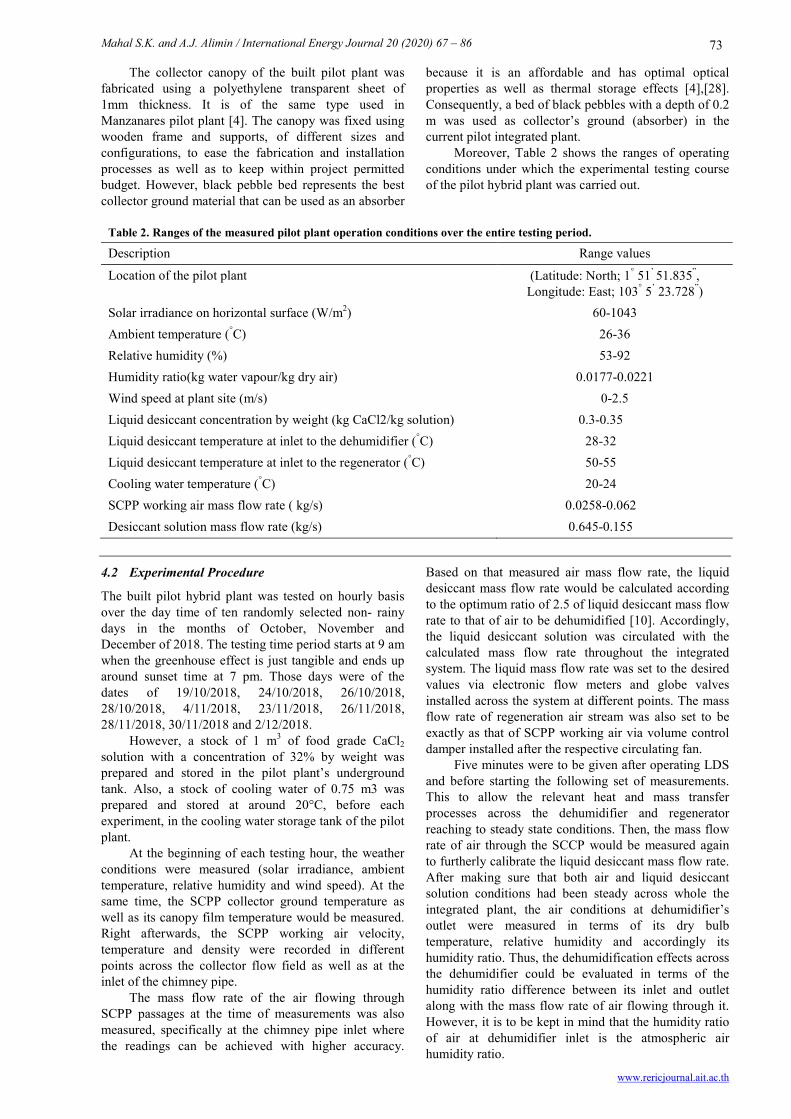
A pilot plant of the present technology was designed, constructed and tested in an appropriate outdoor site at the campus of Universiti Tun Onn Hussein Malaysia (UTHM). Figure 5 presents a photograph of the constructed model where its main components are indicated. Furthermore, the dimensions of the main components of the built pilot plant are listed in Table 1.
Fig. 5. Photograph of the pilot hybrid plant.
Table 1. Dimensions of main components of the pilot hybrid plant.
Description, (unit) quantity
Construction land dimensions, (length (m) x width (m)) 10x10 Collector radius (RC), (m) 2.5 Collector canopy height (hC), (m) 0.5 Chimney radius (RT), (m) 0.1 Chimney height (HT), (m) 6.5
Mahal S.K. and A.J. Alimin / International Energy Journal 20 (2020) 67 – 86
www.rericjournal.ait.ac.th
73
The collector canopy of the built pilot plant was fabricated using a polyethylene transparent sheet of 1mm thickness. It is of the same type used in Manzanares pilot plant [4]. The canopy was fixed using wooden frame and supports, of different sizes and configurations, to ease the fabrication and installation processes as well as to keep within project permitted budget. However, black pebble bed represents the best collector ground material that can be used as an absorber
because it is an affordable and has optimal optical properties as well as thermal storage effects [4],[28]. Consequently, a bed of black pebbles with a depth of 0.2 m was used as collector’s ground (absorber) in the current pilot integrated plant. Moreover, Table 2 shows the ranges of operating conditions under which the experimental testing course of the pilot hybrid plant was carried out.
Table 2. Ranges of the measured pilot plant operation conditions over the entire testing period. Description Range values
Location of the pilot plant (Latitude: North; 1° 51’ 51.835”, Longitude: East; 103° 5’ 23.728”)
Solar irradiance on horizontal surface (W/m2) 60-1043 Ambient temperature (°C) 26-36 Relative humidity (%) 53-92 Humidity ratio(kg water vapour/kg dry air) 0.0177-0.0221 Wind speed at plant site (m/s) 0-2.5 Liquid desiccant concentration by weight (kg CaCl2/kg solution) 0.3-0.35 Liquid desiccant temperature at inlet to the dehumidifier (°C) 28-32 Liquid desiccant temperature at inlet to the regenerator (°C) 50-55 Cooling water temperature (°C) 20-24 SCPP working air mass flow rate ( kg/s) 0.0258-0.062 Desiccant solution mass flow rate (kg/s) 0.645-0.155
4.2 Experimental Procedure
The built pilot hybrid plant was tested on hourly basis over the day time of ten randomly selected non- rainy days in the months of October, November and December of 2018. The testing time period starts at 9 am when the greenhouse effect is just tangible and ends up around sunset time at 7 pm. Those days were of the dates of 19/10/2018, 24/10/2018, 26/10/2018, 28/10/2018, 4/11/2018, 23/11/2018, 26/11/2018, 28/11/2018, 30/11/2018 and 2/12/2018. However, a stock of 1 m3 of food grade CaCl2 solution with a concentration of 32% by weight was prepared and stored in the pilot plant’s underground tank. Also, a stock of cooling water of 0.75 m3 was prepared and stored at around 20°C, before each experiment, in the cooling water storage tank of the pilot plant. At the beginning of each testing hour, the weather conditions were measured (solar irradiance, ambient temperature, relative humidity and wind speed). At the same time, the SCPP collector ground temperature as well as its canopy film temperature would be measured. Right afterwards, the SCPP working air velocity, temperature and density were recorded in different points across the collector flow field as well as at the inlet of the chimney pipe. The mass flow rate of the air flowing through SCPP passages at the time of measurements was also measured, specifically at the chimney pipe inlet where the readings can be achieved with higher accuracy.
Based on that measured air mass flow rate, the liquid desiccant mass flow rate would be calculated according to the optimum ratio of 2.5 of liquid desiccant mass flow rate to that of air to be dehumidified [10]. Accordingly, the liquid desiccant solution was circulated with the calculated mass flow rate throughout the integrated system. The liquid mass flow rate was set to the desired values via electronic flow meters and globe valves installed across the system at different points. The mass flow rate of regeneration air stream was also set to be exactly as that of SCPP working air via volume control damper installed after the respective circulating fan. Five minutes were to be given after operating LDS and before starting the following set of measurements. This to allow the relevant heat and mass transfer processes across the dehumidifier and regenerator reaching to steady state conditions. Then, the mass flow rate of air through the SCCP would be measured again to furtherly calibrate the liquid desiccant mass flow rate. After making sure that both air and liquid desiccant solution conditions had been steady across whole the integrated plant, the air conditions at dehumidifier’s outlet were measured in terms of its dry bulb temperature, relative humidity and accordingly its humidity ratio. Thus, the dehumidification effects across the dehumidifier could be evaluated in terms of the humidity ratio difference between its inlet and outlet along with the mass flow rate of air flowing through it. However, it is to be kept in mind that the humidity ratio of air at dehumidifier inlet is the atmospheric air humidity ratio.
Mahal S.K. and A.J. Alimin / International Energy Journal 20 (2020) 67 – 86
www.rericjournal.ait.ac.th
74
Furthermore, the regeneration air stream conditions in terms of humidity ratio difference across the regenerator and condensing coil were adjusted to be the same as that measured across the dehumidifier. This adjustment was carried out by varying the solution temperature after the heater along with adjusting the mass flow rate of cooling water. However, the solution concentration and temperature before and after both dehumidifier and regenerator were continuously measured. The solution temperature was monitored via a number of thermometers installed at different points across the system, while the concentration was recorded by measuring the density of its extracted samples. Keeping the dehumidification and regeneration rates equal assures that the regenerated and produced mass of water at a certain time is exactly the same as that absorbed from the atmospheric air during the same time. Consequently, if the dehumidification rate is higher than the regeneration rate, then the solution would get diluted with time. Conversely, if the
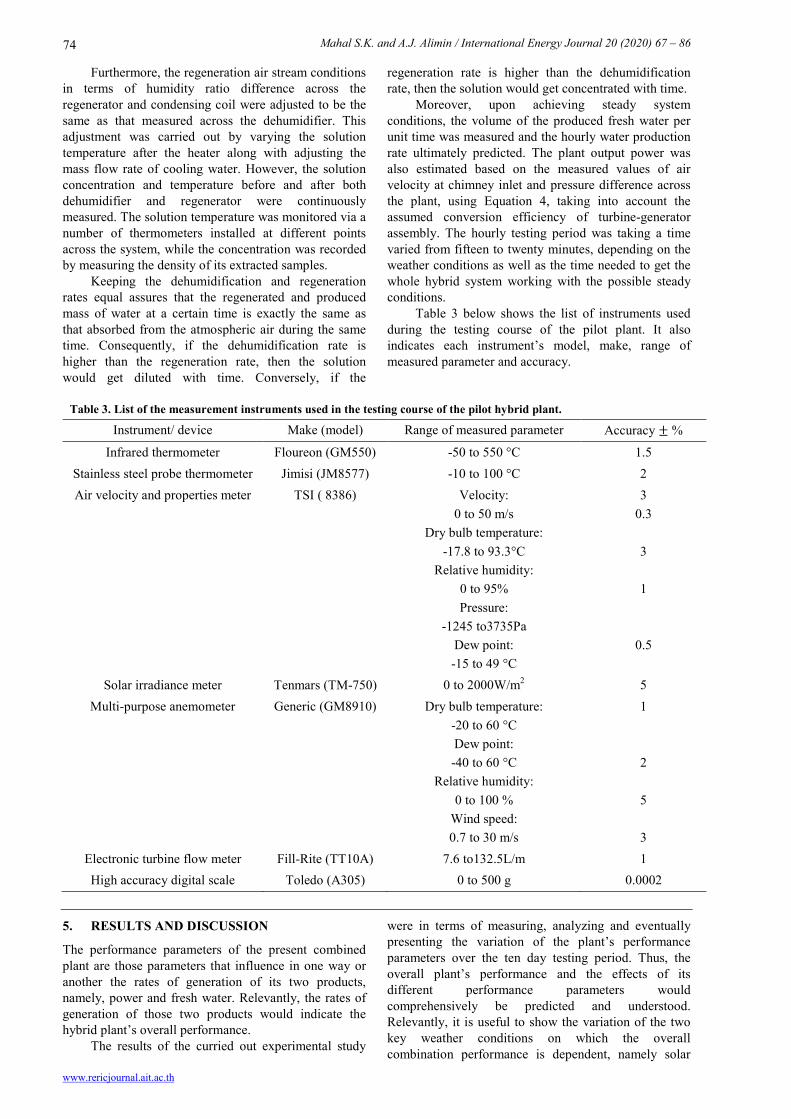
regeneration rate is higher than the dehumidification rate, then the solution would get concentrated with time. Moreover, upon achieving steady system conditions, the volume of the produced fresh water per unit time was measured and the hourly water production rate ultimately predicted. The plant output power was also estimated based on the measured values of air velocity at chimney inlet and pressure difference across the plant, using Equation 4, taking into account the assumed conversion efficiency of turbine-generator assembly. The hourly testing period was taking a time varied from fifteen to twenty minutes, depending on the weather conditions as well as the time needed to get the whole hybrid system working with the possible steady conditions. Table 3 below shows the list of instruments used during the testing course of the pilot plant. It also indicates each instrument’s model, make, range of measured parameter and accuracy.
Table 3. List of the measurement instruments used in the testing course of the pilot hybrid plant.
Instrument/ device Make (model) Range of measured parameter Accuracy ± %
Infrared thermometer Floureon (GM550) -50 to 550 °C 1.5 Stainless steel probe thermometer Jimisi (JM8577) -10 to 100 °C 2 Air velocity and properties meter TSI ( 8386)
Velocity: 0 to 50 m/s
Dry bulb temperature: -17.8 to 93.3°C
Relative humidity: 0 to 95% Pressure:
-1245 to3735Pa Dew point: -15 to 49 °C
3 0.3
3
1
0.5
Solar irradiance meter Tenmars (TM-750) 0 to 2000W/m2 5 Multi-purpose anemometer
Generic (GM8910)
Dry bulb temperature: -20 to 60 °C Dew point: -40 to 60 °C
Relative humidity: 0 to 100 %
Wind speed: 0.7 to 30 m/s
1
2
5
3 Electronic turbine flow meter Fill-Rite (TT10A) 7.6 to132.5L/m 1 High accuracy digital scale Toledo (A305) 0 to 500 g 0.0002
5. RESULTS AND DISCUSSION
The performance parameters of the present combined plant are those parameters that influence in one way or another the rates of generation of its two products, namely, power and fresh water. Relevantly, the rates of generation of those two products would indicate the hybrid plant’s overall performance. The results of the curried out experimental study
were in terms of measuring, analyzing and eventually presenting the variation of the plant’s performance parameters over the ten day testing period. Thus, the overall plant’s performance and the effects of its different performance parameters would comprehensively be predicted and understood. Relevantly, it is useful to show the variation of the two key weather conditions on which the overall combination performance is dependent, namely solar
Mahal S.K. and A.J. Alimin / International Energy Journal 20 (2020) 67 – 86
www.rericjournal.ait.ac.th
75
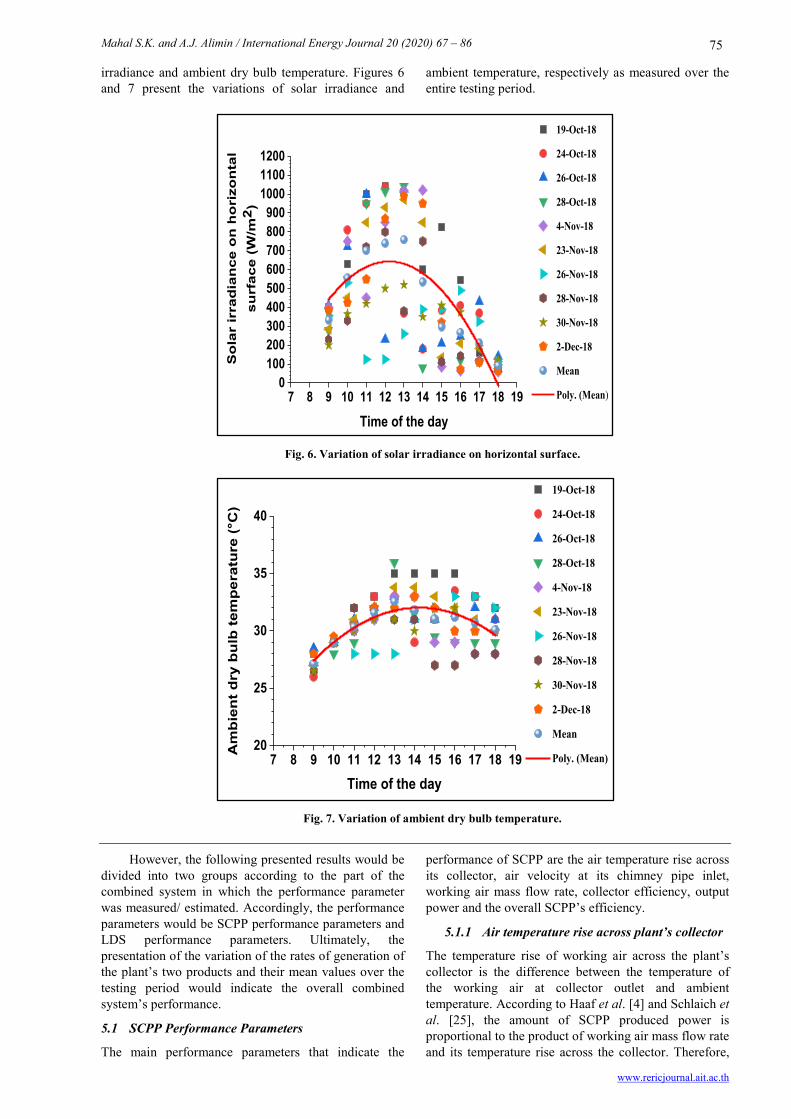
irradiance and ambient dry bulb temperature. Figures 6 and 7 present the variations of solar irradiance and
ambient temperature, respectively as measured over the entire testing period.
Fig. 2. Fig. 6. Variation of solar irradiance on horizontal surface.
Fig. 3. Fig. 7. Variation of ambient dry bulb temperature.
However, the following presented results would be divided into two groups according to the part of the combined system in which the performance parameter was measured/ estimated. Accordingly, the performance parameters would be SCPP performance parameters and LDS performance parameters. Ultimately, the presentation of the variation of the rates of generation of the plant’s two products and their mean values over the testing period would indicate the overall combined system’s performance.
5.1 SCPP Performance Parameters
The main performance parameters that indicate the
performance of SCPP are the air temperature rise across its collector, air velocity at its chimney pipe inlet, working air mass flow rate, collector efficiency, output power and the overall SCPP’s efficiency.
5.1.1 Air temperature rise across plant’s collector
The temperature rise of working air across the plant’s collector is the difference between the temperature of the working air at collector outlet and ambient temperature. According to Haaf et al. [4] and Schlaich et al. [25], the amount of SCPP produced power is proportional to the product of working air mass flow rate and its temperature rise across the collector. Therefore,
7 8 9 10 11 12 13 14 15 16 17 18 190
100200300400500600700800900
100011001200
19-Oct-18
24-Oct-18
26-Oct-18
28-Oct-18
4-Nov-18
23-Nov-18
26-Nov-18
28-Nov-18
30-Nov-18
2-Dec-18
Mean
Poly. (Mean)
So
lar
irra
dia
nce
on
ho
rizo
nta
lsu
rfac
e (W
/m2 )
Time of the day
7 8 9 10 11 12 13 14 15 16 17 18 1920
25
30
35
40
19-Oct-18
24-Oct-18
26-Oct-18
28-Oct-18
4-Nov-18
23-Nov-18
26-Nov-18
28-Nov-18
30-Nov-18
2-Dec-18
Mean
Poly. (Mean)Am
bie
nt
dry
bu
lb t
emp
erat
ure
(°C
)
Time of the day
Mahal S.K. and A.J. Alimin / International Energy Journal 20 (2020) 67 – 86
www.rericjournal.ait.ac.th
76
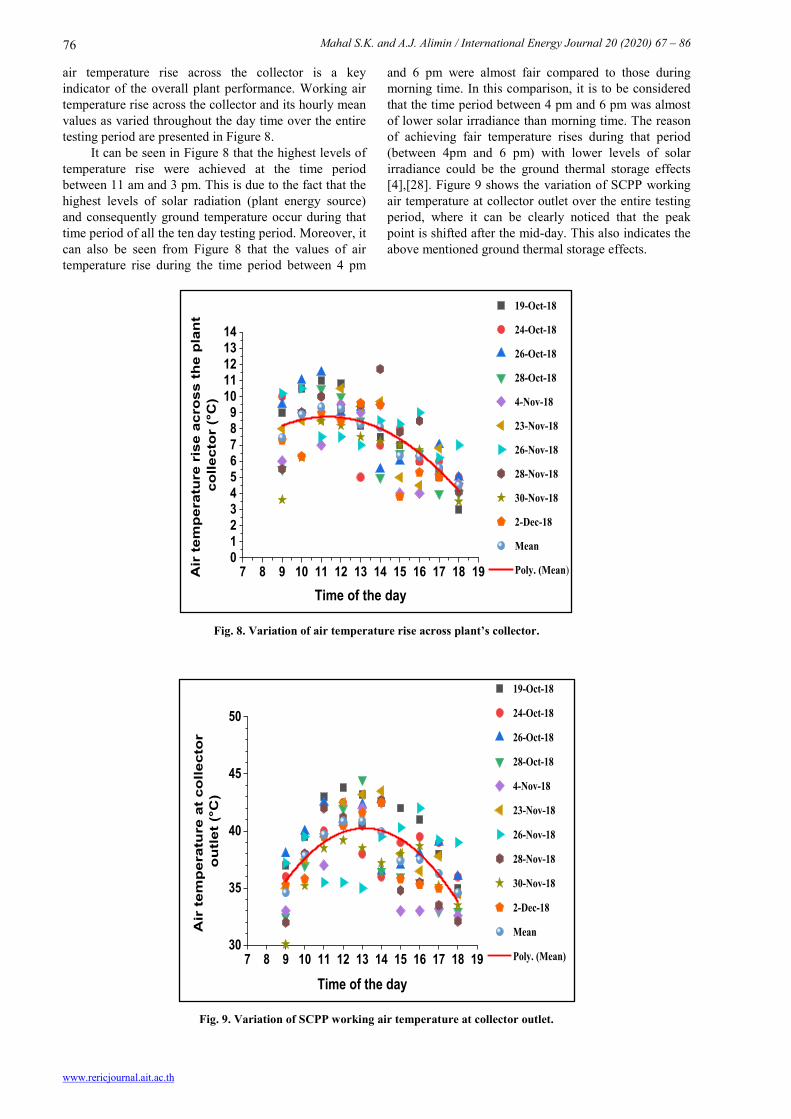
air temperature rise across the collector is a key indicator of the overall plant performance. Working air temperature rise across the collector and its hourly mean values as varied throughout the day time over the entire testing period are presented in Figure 8. It can be seen in Figure 8 that the highest levels of temperature rise were achieved at the time period between 11 am and 3 pm. This is due to the fact that the highest levels of solar radiation (plant energy source) and consequently ground temperature occur during that time period of all the ten day testing period. Moreover, it can also be seen from Figure 8 that the values of air temperature rise during the time period between 4 pm
and 6 pm were almost fair compared to those during morning time. In this comparison, it is to be considered that the time period between 4 pm and 6 pm was almost of lower solar irradiance than morning time. The reason of achieving fair temperature rises during that period (between 4pm and 6 pm) with lower levels of solar irradiance could be the ground thermal storage effects [4],[28]. Figure 9 shows the variation of SCPP working air temperature at collector outlet over the entire testing period, where it can be clearly noticed that the peak point is shifted after the mid-day. This also indicates the above mentioned ground thermal storage effects.
Fig. 8. Variation of air temperature rise across plant’s collector.
Fig. 9. Variation of SCPP working air temperature at collector outlet.
7 8 9 10 11 12 13 14 15 16 17 18 190123456789
1011121314
19-Oct-18
24-Oct-18
26-Oct-18
28-Oct-18
4-Nov-18
23-Nov-18
26-Nov-18
28-Nov-18
30-Nov-18
2-Dec-18
Mean
Poly. (Mean)Air
tem
per
atu
re r
ise
acro
ss t
he
pla
nt
colle
cto
r (°
C)
Time of the day
7 8 9 10 11 12 13 14 15 16 17 18 1930
35
40
45
50
19-Oct-18
24-Oct-18
26-Oct-18
28-Oct-18
4-Nov-18
23-Nov-18
26-Nov-18
28-Nov-18
30-Nov-18
2-Dec-18
Mean
Poly. (Mean)
Air
tem
per
atu
re a
t co
llect
or
ou
tlet
(°C
)
Time of the day
Mahal S.K. and A.J. Alimin / International Energy Journal 20 (2020) 67 – 86
www.rericjournal.ait.ac.th
77
Nevertheless, it can be noticed from Figure 8 that the maximum value of temperature rise across the collector of 11.7°C was recorded on 28/11/2018 at 2 pm, while the lowest value of 3°C was on 19/10/2018 at 6 pm. It can also be seen from Figure 8 that the mean value of temperature rise at 9 am is higher than at 6 pm. This is due to the mean value of solar irradiance at 9 am is relatively higher as well as the mean value of ambient temperature at 9 am is lower than that at 6 pm.
5.1.2 Air velocity at chimney pipe inlet
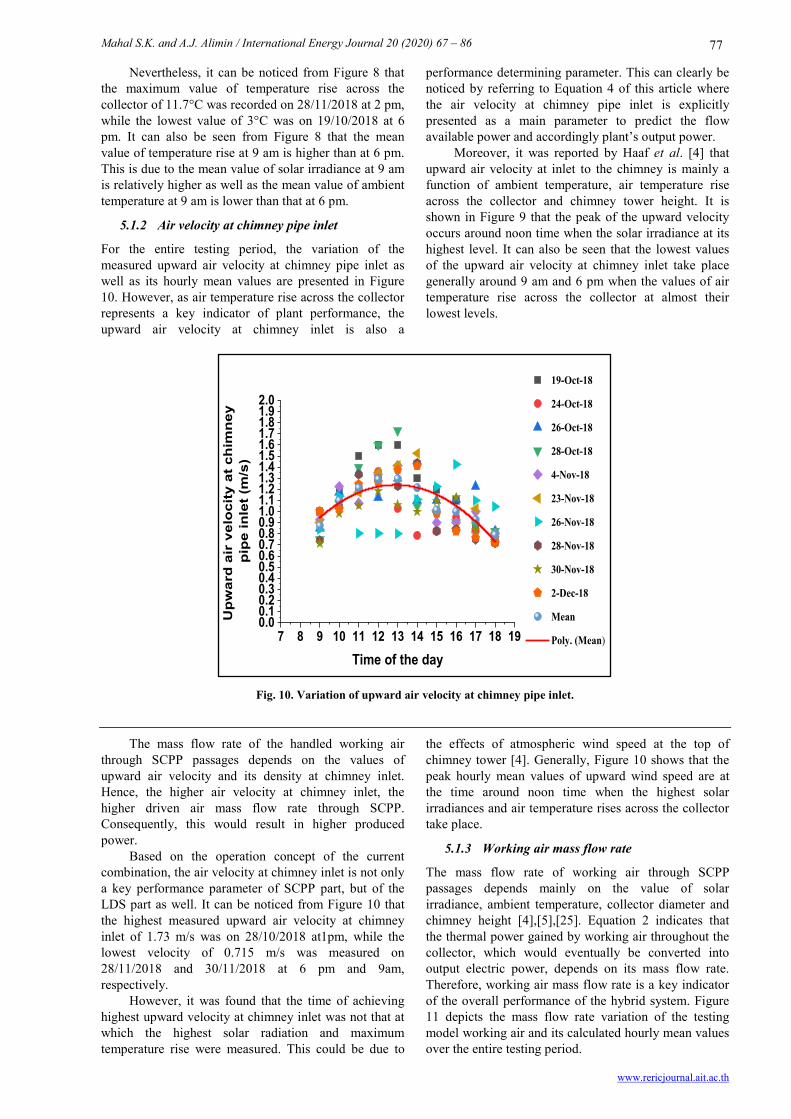
For the entire testing period, the variation of the measured upward air velocity at chimney pipe inlet as well as its hourly mean values are presented in Figure 10. However, as air temperature rise across the collector represents a key indicator of plant performance, the upward air velocity at chimney inlet is also a
performance determining parameter. This can clearly be noticed by referring to Equation 4 of this article where the air velocity at chimney pipe inlet is explicitly presented as a main parameter to predict the flow available power and accordingly plant’s output power. Moreover, it was reported by Haaf et al. [4] that upward air velocity at inlet to the chimney is mainly a function of ambient temperature, air temperature rise across the collector and chimney tower height. It is shown in Figure 9 that the peak of the upward velocity occurs around noon time when the solar irradiance at its highest level. It can also be seen that the lowest values of the upward air velocity at chimney inlet take place generally around 9 am and 6 pm when the values of air temperature rise across the collector at almost their lowest levels.
Fig. 10. Variation of upward air velocity at chimney pipe inlet.
The mass flow rate of the handled working air through SCPP passages depends on the values of upward air velocity and its density at chimney inlet. Hence, the higher air velocity at chimney inlet, the higher driven air mass flow rate through SCPP. Consequently, this would result in higher produced power. Based on the operation concept of the current combination, the air velocity at chimney inlet is not only a key performance parameter of SCPP part, but of the LDS part as well. It can be noticed from Figure 10 that the highest measured upward air velocity at chimney inlet of 1.73 m/s was on 28/10/2018 at1pm, while the lowest velocity of 0.715 m/s was measured on 28/11/2018 and 30/11/2018 at 6 pm and 9am, respectively. However, it was found that the time of achieving highest upward velocity at chimney inlet was not that at which the highest solar radiation and maximum temperature rise were measured. This could be due to
the effects of atmospheric wind speed at the top of chimney tower [4]. Generally, Figure 10 shows that the peak hourly mean values of upward wind speed are at the time around noon time when the highest solar irradiances and air temperature rises across the collector take place.
5.1.3 Working air mass flow rate
The mass flow rate of working air through SCPP passages depends mainly on the value of solar irradiance, ambient temperature, collector diameter and chimney height [4],[5],[25]. Equation 2 indicates that the thermal power gained by working air throughout the collector, which would eventually be converted into output electric power, depends on its mass flow rate. Therefore, working air mass flow rate is a key indicator of the overall performance of the hybrid system. Figure 11 depicts the mass flow rate variation of the testing model working air and its calculated hourly mean values over the entire testing period.
7 8 9 10 11 12 13 14 15 16 17 18 190.00.10.20.30.40.50.60.70.80.91.01.11.21.31.41.51.61.71.81.92.0
19-Oct-18
24-Oct-18
26-Oct-18
28-Oct-18
4-Nov-18
23-Nov-18
26-Nov-18
28-Nov-18
30-Nov-18
2-Dec-18
Mean
Poly. (Mean)
Up
war
d a
ir v
elo
city
at
chim
ney
p
ipe
inle
t (m
/s)
Time of the day
Mahal S.K. and A.J. Alimin / International Energy Journal 20 (2020) 67 – 86
www.rericjournal.ait.ac.th
78
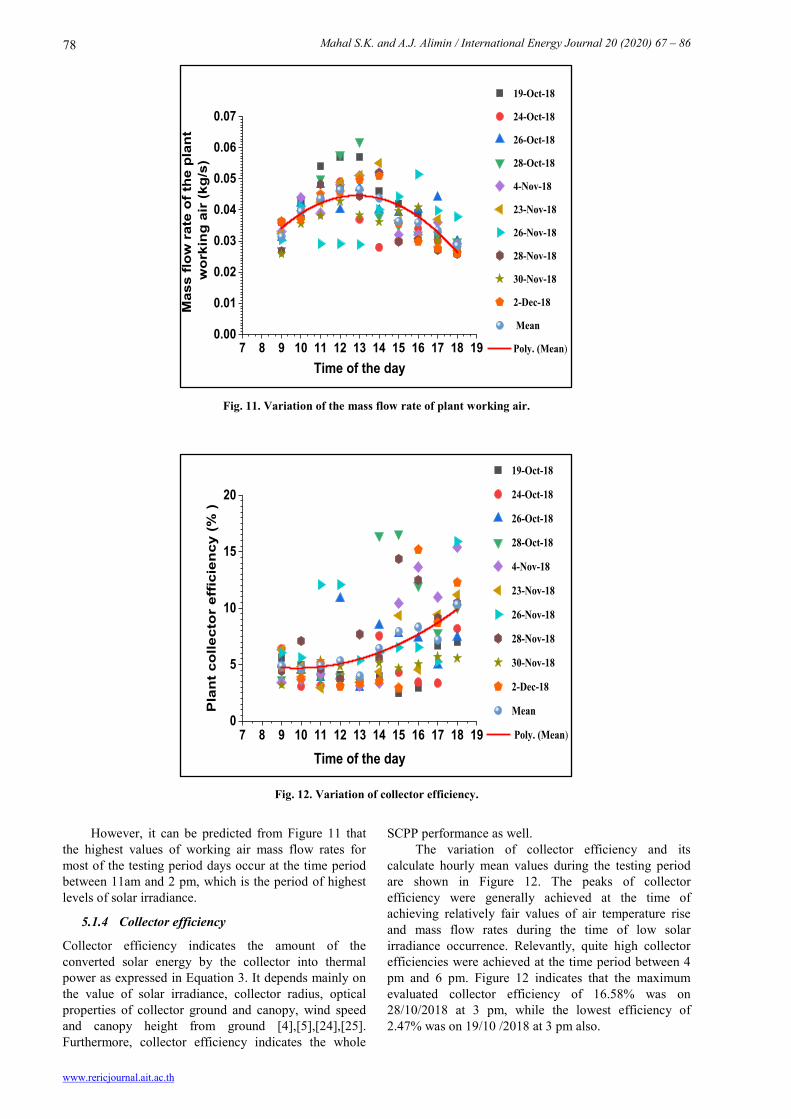
Fig. 11. Variation of the mass flow rate of plant working air.
Fig. 12. Variation of collector efficiency.
However, it can be predicted from Figure 11 that the highest values of working air mass flow rates for most of the testing period days occur at the time period between 11am and 2 pm, which is the period of highest levels of solar irradiance.
5.1.4 Collector efficiency
Collector efficiency indicates the amount of the converted solar energy by the collector into thermal power as expressed in Equation 3. It depends mainly on the value of solar irradiance, collector radius, optical properties of collector ground and canopy, wind speed and canopy height from ground [4],[5],[24],[25]. Furthermore, collector efficiency indicates the whole
SCPP performance as well. The variation of collector efficiency and its calculate hourly mean values during the testing period are shown in Figure 12. The peaks of collector efficiency were generally achieved at the time of achieving relatively fair values of air temperature rise and mass flow rates during the time of low solar irradiance occurrence. Relevantly, quite high collector efficiencies were achieved at the time period between 4 pm and 6 pm. Figure 12 indicates that the maximum evaluated collector efficiency of 16.58% was on 28/10/2018 at 3 pm, while the lowest efficiency of 2.47% was on 19/10 /2018 at 3 pm also.
7 8 9 10 11 12 13 14 15 16 17 18 190.00
0.01
0.02
0.03
0.04
0.05
0.06
0.07
19-Oct-18
24-Oct-18
26-Oct-18
28-Oct-18
4-Nov-18
23-Nov-18
26-Nov-18
28-Nov-18
30-Nov-18
2-Dec-18
Mean
Poly. (Mean)
Mas
s fl
ow
rat
e o
f th
e p
lan
t w
ork
ing
air
(kg
/s)
Time of the day
7 8 9 10 11 12 13 14 15 16 17 18 190
5
10
15
20
19-Oct-18
24-Oct-18
26-Oct-18
28-Oct-18
4-Nov-18
23-Nov-18
26-Nov-18
28-Nov-18
30-Nov-18
2-Dec-18
Mean
Poly. (Mean)
Pla
nt
colle
cto
r ef
fici
ency
(%
)
Time of the day
Mahal S.K. and A.J. Alimin / International Energy Journal 20 (2020) 67 – 86
www.rericjournal.ait.ac.th
79
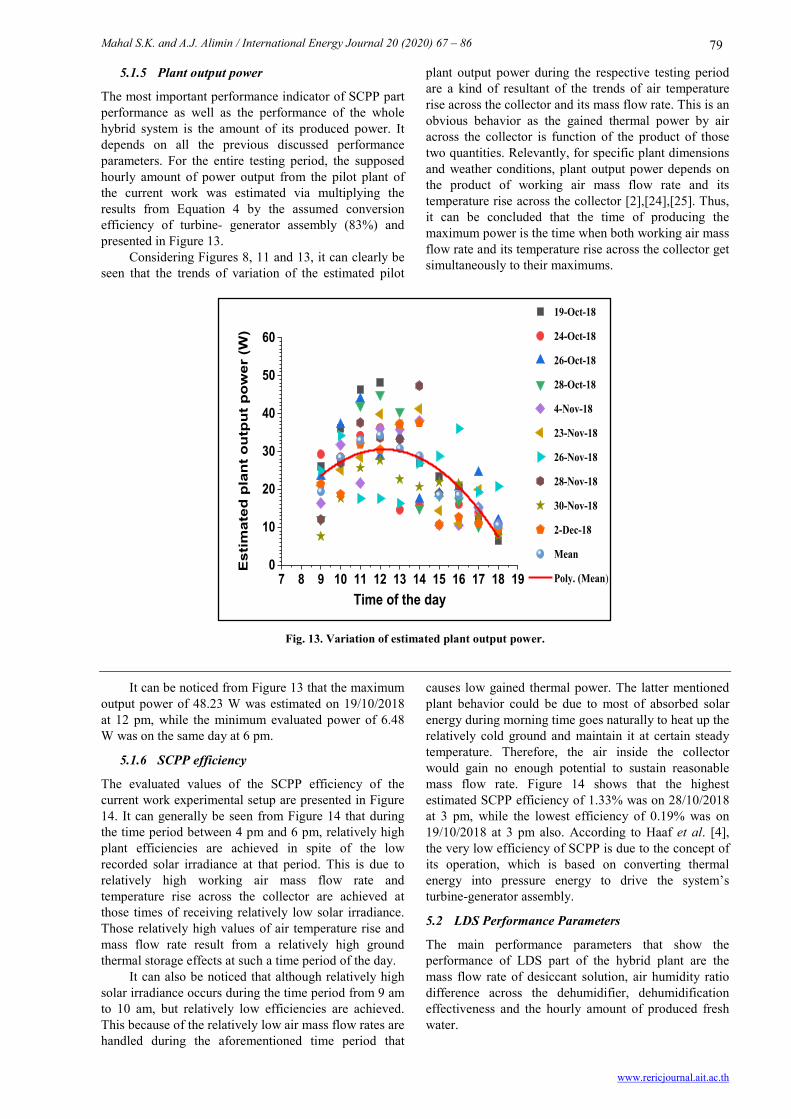
5.1.5 Plant output power
The most important performance indicator of SCPP part performance as well as the performance of the whole hybrid system is the amount of its produced power. It depends on all the previous discussed performance parameters. For the entire testing period, the supposed hourly amount of power output from the pilot plant of the current work was estimated via multiplying the results from Equation 4 by the assumed conversion efficiency of turbine- generator assembly (83%) and presented in Figure 13. Considering Figures 8, 11 and 13, it can clearly be seen that the trends of variation of the estimated pilot
plant output power during the respective testing period are a kind of resultant of the trends of air temperature rise across the collector and its mass flow rate. This is an obvious behavior as the gained thermal power by air across the collector is function of the product of those two quantities. Relevantly, for specific plant dimensions and weather conditions, plant output power depends on the product of working air mass flow rate and its temperature rise across the collector [2],[24],[25]. Thus, it can be concluded that the time of producing the maximum power is the time when both working air mass flow rate and its temperature rise across the collector get simultaneously to their maximums.
Fig. 13. Variation of estimated plant output power.
It can be noticed from Figure 13 that the maximum output power of 48.23 W was estimated on 19/10/2018 at 12 pm, while the minimum evaluated power of 6.48 W was on the same day at 6 pm.
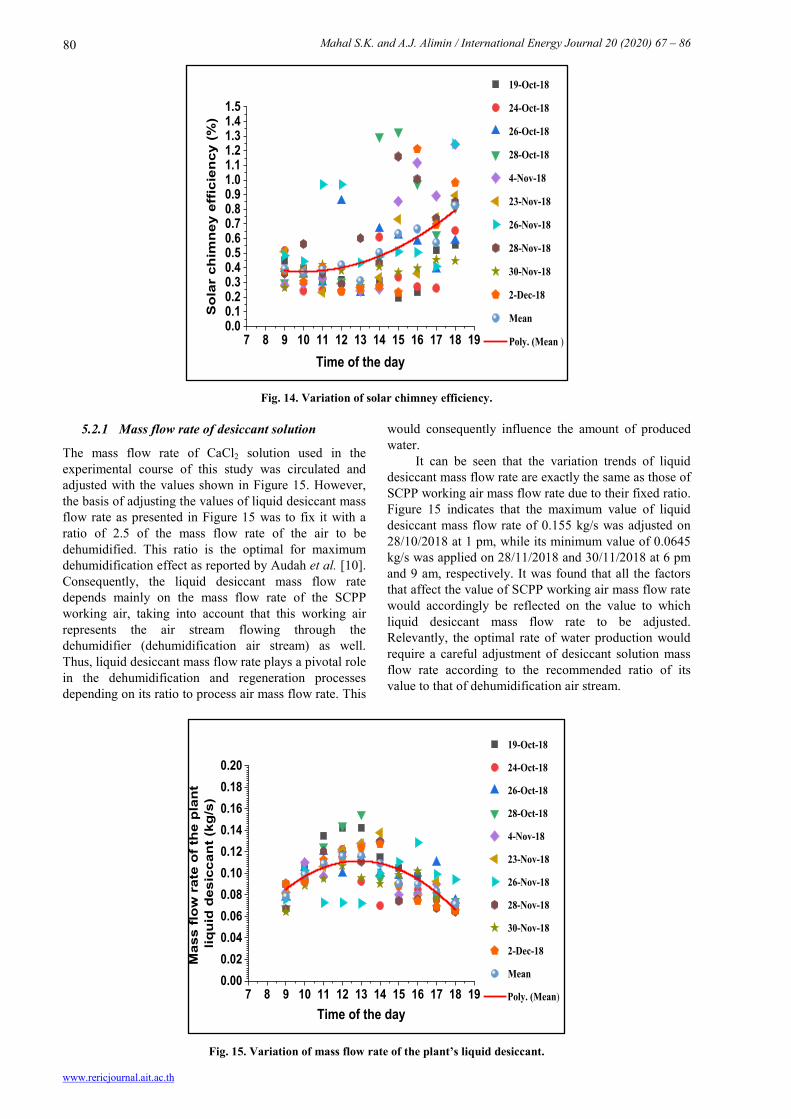
5.1.6 SCPP efficiency
The evaluated values of the SCPP efficiency of the current work experimental setup are presented in Figure 14. It can generally be seen from Figure 14 that during the time period between 4 pm and 6 pm, relatively high plant efficiencies are achieved in spite of the low recorded solar irradiance at that period. This is due to relatively high working air mass flow rate and temperature rise across the collector are achieved at those times of receiving relatively low solar irradiance. Those relatively high values of air temperature rise and mass flow rate result from a relatively high ground thermal storage effects at such a time period of the day. It can also be noticed that although relatively high solar irradiance occurs during the time period from 9 am to 10 am, but relatively low efficiencies are achieved. This because of the relatively low air mass flow rates are handled during the aforementioned time period that
causes low gained thermal power. The latter mentioned plant behavior could be due to most of absorbed solar energy during morning time goes naturally to heat up the relatively cold ground and maintain it at certain steady temperature. Therefore, the air inside the collector would gain no enough potential to sustain reasonable mass flow rate. Figure 14 shows that the highest estimated SCPP efficiency of 1.33% was on 28/10/2018 at 3 pm, while the lowest efficiency of 0.19% was on 19/10/2018 at 3 pm also. According to Haaf et al. [4], the very low efficiency of SCPP is due to the concept of its operation, which is based on converting thermal energy into pressure energy to drive the system’s turbine-generator assembly.
5.2 LDS Performance Parameters
The main performance parameters that show the performance of LDS part of the hybrid plant are the mass flow rate of desiccant solution, air humidity ratio difference across the dehumidifier, dehumidification effectiveness and the hourly amount of produced fresh water.
7 8 9 10 11 12 13 14 15 16 17 18 190
10
20
30
40
50
60
19-Oct-18
24-Oct-18
26-Oct-18
28-Oct-18
4-Nov-18
23-Nov-18
26-Nov-18
28-Nov-18
30-Nov-18
2-Dec-18
Mean
Poly. (Mean)
Est
imat
ed p
lan
t o
utp
ut
po
wer
(W
)
Time of the day
Mahal S.K. and A.J. Alimin / International Energy Journal 20 (2020) 67 – 86
www.rericjournal.ait.ac.th
80
Fig. 14. Variation of solar chimney efficiency.
5.2.1 Mass flow rate of desiccant solution
The mass flow rate of CaCl2 solution used in the experimental course of this study was circulated and adjusted with the values shown in Figure 15. However, the basis of adjusting the values of liquid desiccant mass flow rate as presented in Figure 15 was to fix it with a ratio of 2.5 of the mass flow rate of the air to be dehumidified. This ratio is the optimal for maximum dehumidification effect as reported by Audah et al. [10]. Consequently, the liquid desiccant mass flow rate depends mainly on the mass flow rate of the SCPP working air, taking into account that this working air represents the air stream flowing through the dehumidifier (dehumidification air stream) as well. Thus, liquid desiccant mass flow rate plays a pivotal role in the dehumidification and regeneration processes depending on its ratio to process air mass flow rate. This
would consequently influence the amount of produced water. It can be seen that the variation trends of liquid desiccant mass flow rate are exactly the same as those of SCPP working air mass flow rate due to their fixed ratio. Figure 15 indicates that the maximum value of liquid desiccant mass flow rate of 0.155 kg/s was adjusted on 28/10/2018 at 1 pm, while its minimum value of 0.0645 kg/s was applied on 28/11/2018 and 30/11/2018 at 6 pm and 9 am, respectively. It was found that all the factors that affect the value of SCPP working air mass flow rate would accordingly be reflected on the value to which liquid desiccant mass flow rate to be adjusted. Relevantly, the optimal rate of water production would require a careful adjustment of desiccant solution mass flow rate according to the recommended ratio of its value to that of dehumidification air stream.
Fig. 15. Variation of mass flow rate of the plant’s liquid desiccant.
7 8 9 10 11 12 13 14 15 16 17 18 190.00.10.20.30.40.50.60.70.80.91.01.11.21.31.41.5
19-Oct-18
24-Oct-18
26-Oct-18
28-Oct-18
4-Nov-18
23-Nov-18
26-Nov-18
28-Nov-18
30-Nov-18
2-Dec-18
Mean
Poly. (Mean )
So
lar
chim
ney
eff
icie
ncy
(%
)
Time of the day
7 8 9 10 11 12 13 14 15 16 17 18 190.000.020.040.060.080.100.120.140.160.180.20
19-Oct-18
24-Oct-18
26-Oct-18
28-Oct-18
4-Nov-18
23-Nov-18
26-Nov-18
28-Nov-18
30-Nov-18
2-Dec-18
Mean
Poly. (Mean)
Mas
s fl
ow
rat
e o
f th
e p
lan
t liq
uid
des
icca
nt
(kg
/s)
Time of the day
Mahal S.K. and A.J. Alimin / International Energy Journal 20 (2020) 67 – 86
www.rericjournal.ait.ac.th
81
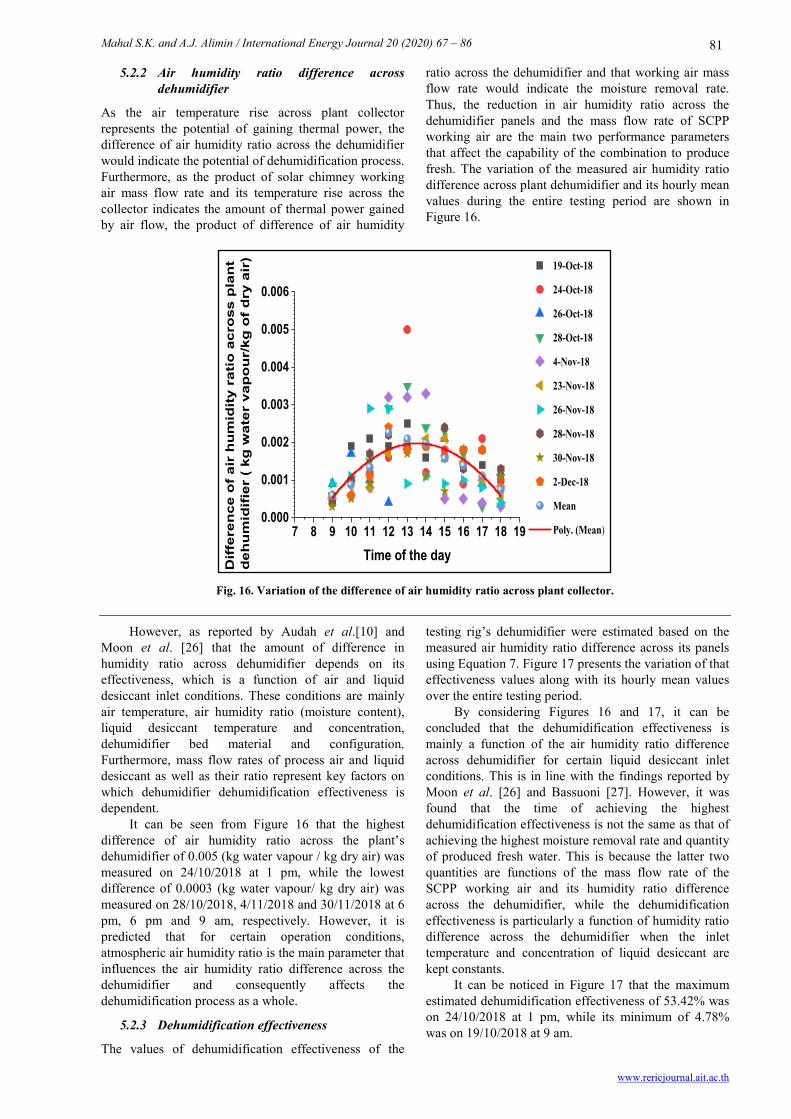
5.2.2 Air humidity ratio difference across dehumidifier
As the air temperature rise across plant collector represents the potential of gaining thermal power, the difference of air humidity ratio across the dehumidifier would indicate the potential of dehumidification process. Furthermore, as the product of solar chimney working air mass flow rate and its temperature rise across the collector indicates the amount of thermal power gained by air flow, the product of difference of air humidity
ratio across the dehumidifier and that working air mass flow rate would indicate the moisture removal rate. Thus, the reduction in air humidity ratio across the dehumidifier panels and the mass flow rate of SCPP working air are the main two performance parameters that affect the capability of the combination to produce fresh. The variation of the measured air humidity ratio difference across plant dehumidifier and its hourly mean values during the entire testing period are shown in Figure 16.
Fig. 16. Variation of the difference of air humidity ratio across plant collector.
However, as reported by Audah et al.[10] and Moon et al. [26] that the amount of difference in humidity ratio across dehumidifier depends on its effectiveness, which is a function of air and liquid desiccant inlet conditions. These conditions are mainly air temperature, air humidity ratio (moisture content), liquid desiccant temperature and concentration, dehumidifier bed material and configuration. Furthermore, mass flow rates of process air and liquid desiccant as well as their ratio represent key factors on which dehumidifier dehumidification effectiveness is dependent. It can be seen from Figure 16 that the highest difference of air humidity ratio across the plant’s dehumidifier of 0.005 (kg water vapour / kg dry air) was measured on 24/10/2018 at 1 pm, while the lowest difference of 0.0003 (kg water vapour/ kg dry air) was measured on 28/10/2018, 4/11/2018 and 30/11/2018 at 6 pm, 6 pm and 9 am, respectively. However, it is predicted that for certain operation conditions, atmospheric air humidity ratio is the main parameter that influences the air humidity ratio difference across the dehumidifier and consequently affects the dehumidification process as a whole.
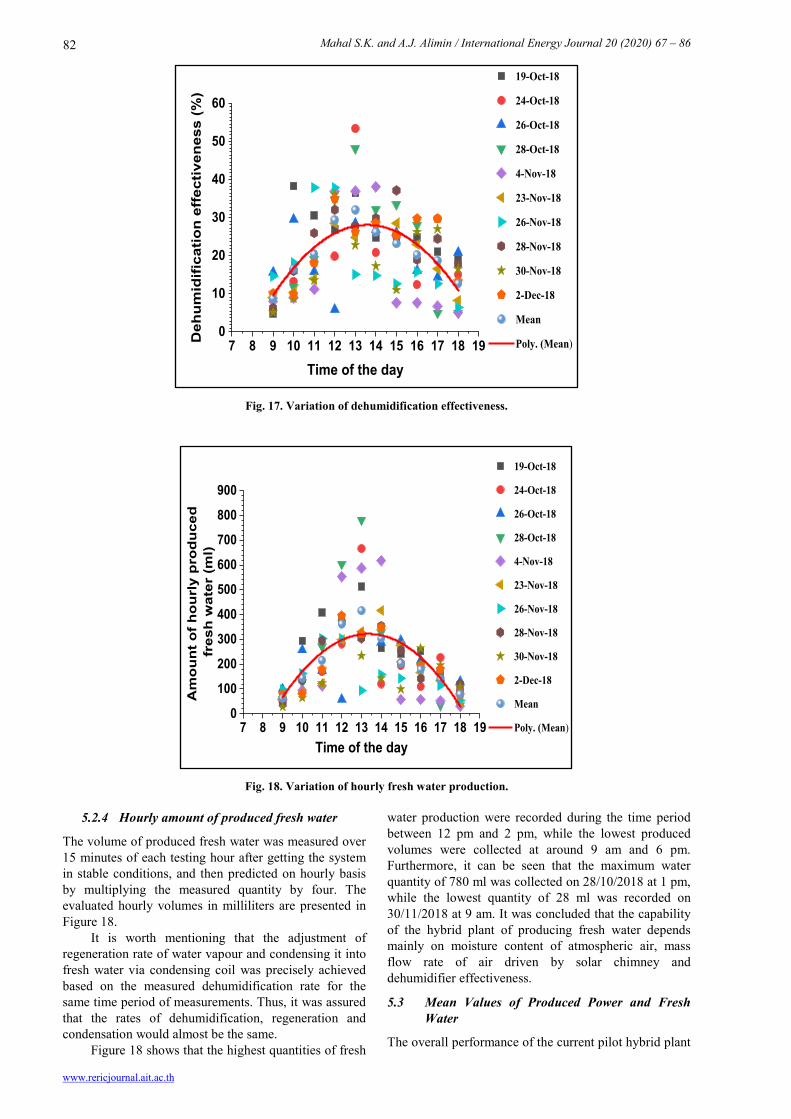
5.2.3 Dehumidification effectiveness
The values of dehumidification effectiveness of the
testing rig’s dehumidifier were estimated based on the measured air humidity ratio difference across its panels using Equation 7. Figure 17 presents the variation of that effectiveness values along with its hourly mean values over the entire testing period. By considering Figures 16 and 17, it can be concluded that the dehumidification effectiveness is mainly a function of the air humidity ratio difference across dehumidifier for certain liquid desiccant inlet conditions. This is in line with the findings reported by Moon et al. [26] and Bassuoni [27]. However, it was found that the time of achieving the highest dehumidification effectiveness is not the same as that of achieving the highest moisture removal rate and quantity of produced fresh water. This is because the latter two quantities are functions of the mass flow rate of the SCPP working air and its humidity ratio difference across the dehumidifier, while the dehumidification effectiveness is particularly a function of humidity ratio difference across the dehumidifier when the inlet temperature and concentration of liquid desiccant are kept constants. It can be noticed in Figure 17 that the maximum estimated dehumidification effectiveness of 53.42% was on 24/10/2018 at 1 pm, while its minimum of 4.78% was on 19/10/2018 at 9 am.
7 8 9 10 11 12 13 14 15 16 17 18 190.000
0.001
0.002
0.003
0.004
0.005
0.006
19-Oct-18
24-Oct-18
26-Oct-18
28-Oct-18
4-Nov-18
23-Nov-18
26-Nov-18
28-Nov-18
30-Nov-18
2-Dec-18
Mean
Poly. (Mean)
Dif
fere
nce
of
air
hu
mid
ity
rati
o a
cro
ss p
lan
t d
ehu
mid
ifie
r (
kg w
ater
vap
ou
r/kg
of
dry
air
)
Time of the day
Mahal S.K. and A.J. Alimin / International Energy Journal 20 (2020) 67 – 86
www.rericjournal.ait.ac.th
82
Fig. 17. Variation of dehumidification effectiveness.
Fig. 18. Variation of hourly fresh water production.
5.2.4 Hourly amount of produced fresh water
The volume of produced fresh water was measured over 15 minutes of each testing hour after getting the system in stable conditions, and then predicted on hourly basis by multiplying the measured quantity by four. The evaluated hourly volumes in milliliters are presented in Figure 18. It is worth mentioning that the adjustment of regeneration rate of water vapour and condensing it into fresh water via condensing coil was precisely achieved based on the measured dehumidification rate for the same time period of measurements. Thus, it was assured that the rates of dehumidification, regeneration and condensation would almost be the same. Figure 18 shows that the highest quantities of fresh
water production were recorded during the time period between 12 pm and 2 pm, while the lowest produced volumes were collected at around 9 am and 6 pm. Furthermore, it can be seen that the maximum water quantity of 780 ml was collected on 28/10/2018 at 1 pm, while the lowest quantity of 28 ml was recorded on 30/11/2018 at 9 am. It was concluded that the capability of the hybrid plant of producing fresh water depends mainly on moisture content of atmospheric air, mass flow rate of air driven by solar chimney and dehumidifier effectiveness.
5.3 Mean Values of Produced Power and Fresh Water
The overall performance of the current pilot hybrid plant
7 8 9 10 11 12 13 14 15 16 17 18 190
10
20
30
40
50
60
19-Oct-18
24-Oct-18
26-Oct-18
28-Oct-18
4-Nov-18
23-Nov-18
26-Nov-18
28-Nov-18
30-Nov-18
2-Dec-18
Mean
Poly. (Mean)Deh
um
idif
icat
ion
eff
ecti
ven
ess
(%)
Time of the day
7 8 9 10 11 12 13 14 15 16 17 18 190
100
200
300
400
500
600
700
800
900
19-Oct-18
24-Oct-18
26-Oct-18
28-Oct-18
4-Nov-18
23-Nov-18
26-Nov-18
28-Nov-18
30-Nov-18
2-Dec-18
Mean
Poly. (Mean)
Am
ou
nt
of
ho
url
y p
rod
uce
d
fres
h w
ater
(m
l)
Time of the day
Mahal S.K. and A.J. Alimin / International Energy Journal 20 (2020) 67 – 86
www.rericjournal.ait.ac.th
83
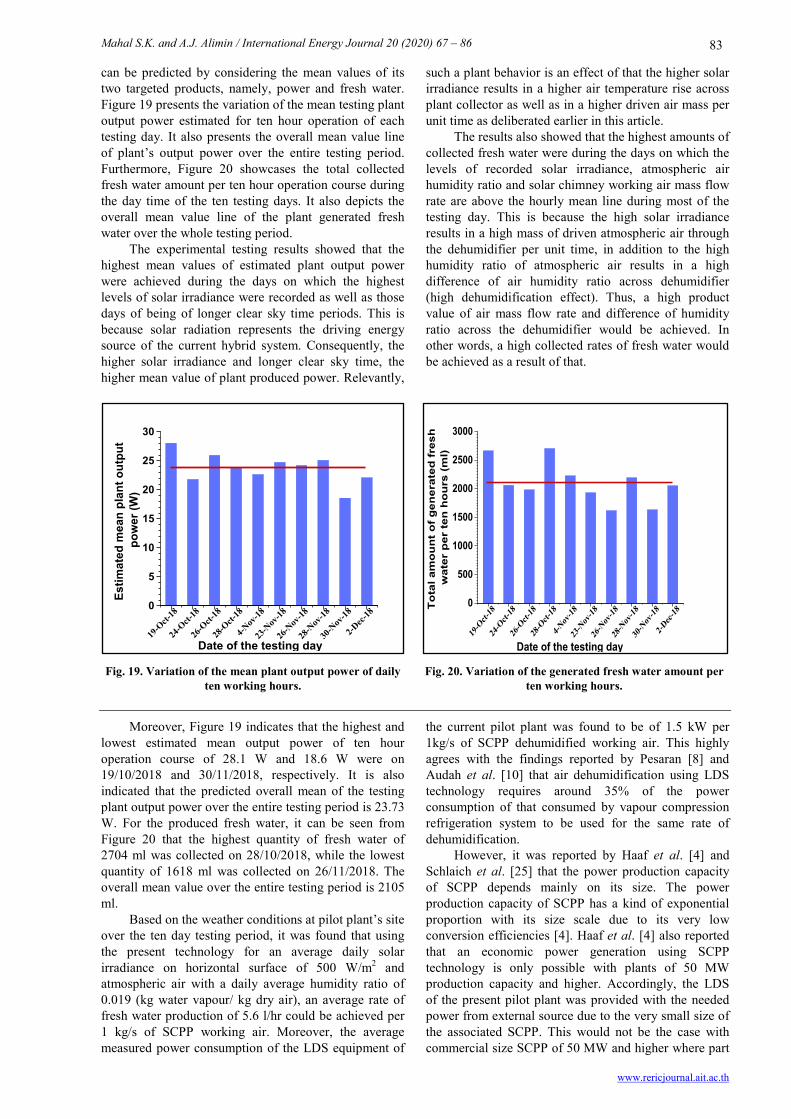
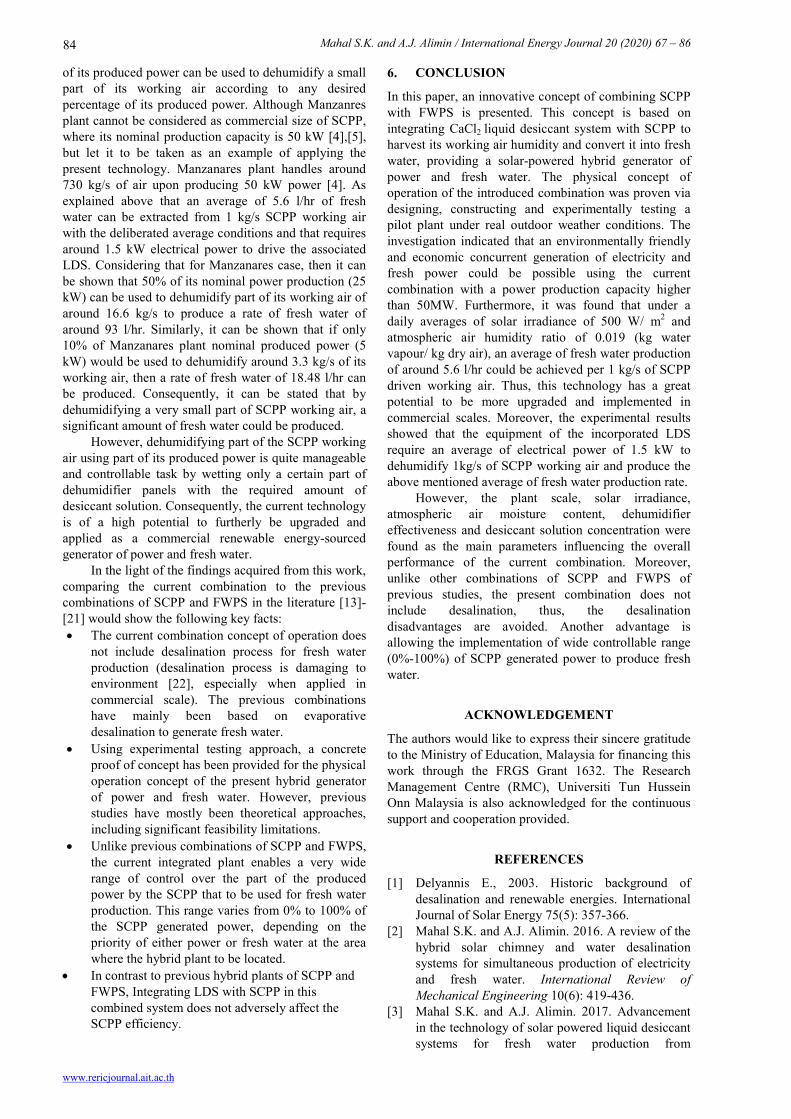
can be predicted by considering the mean values of its two targeted products, namely, power and fresh water. Figure 19 presents the variation of the mean testing plant output power estimated for ten hour operation of each testing day. It also presents the overall mean value line of plant’s output power over the entire testing period. Furthermore, Figure 20 showcases the total collected fresh water amount per ten hour operation course during the day time of the ten testing days. It also depicts the overall mean value line of the plant generated fresh water over the whole testing period. The experimental testing results showed that the highest mean values of estimated plant output power were achieved during the days on which the highest levels of solar irradiance were recorded as well as those days of being of longer clear sky time periods. This is because solar radiation represents the driving energy source of the current hybrid system. Consequently, the higher solar irradiance and longer clear sky time, the higher mean value of plant produced power. Relevantly,
such a plant behavior is an effect of that the higher solar irradiance results in a higher air temperature rise across plant collector as well as in a higher driven air mass per unit time as deliberated earlier in this article. The results also showed that the highest amounts of collected fresh water were during the days on which the levels of recorded solar irradiance, atmospheric air humidity ratio and solar chimney working air mass flow rate are above the hourly mean line during most of the testing day. This is because the high solar irradiance results in a high mass of driven atmospheric air through the dehumidifier per unit time, in addition to the high humidity ratio of atmospheric air results in a high difference of air humidity ratio across dehumidifier (high dehumidification effect). Thus, a high product value of air mass flow rate and difference of humidity ratio across the dehumidifier would be achieved. In other words, a high collected rates of fresh water would be achieved as a result of that.
Fig. 19. Variation of the mean plant output power of daily
ten working hours. Fig. 20. Variation of the generated fresh water amount per
ten working hours.
Moreover, Figure 19 indicates that the highest and lowest estimated mean output power of ten hour operation course of 28.1 W and 18.6 W were on 19/10/2018 and 30/11/2018, respectively. It is also indicated that the predicted overall mean of the testing plant output power over the entire testing period is 23.73 W. For the produced fresh water, it can be seen from Figure 20 that the highest quantity of fresh water of 2704 ml was collected on 28/10/2018, while the lowest quantity of 1618 ml was collected on 26/11/2018. The overall mean value over the entire testing period is 2105 ml. Based on the weather conditions at pilot plant’s site over the ten day testing period, it was found that using the present technology for an average daily solar irradiance on horizontal surface of 500 W/m2 and atmospheric air with a daily average humidity ratio of 0.019 (kg water vapour/ kg dry air), an average rate of fresh water production of 5.6 l/hr could be achieved per 1 kg/s of SCPP working air. Moreover, the average measured power consumption of the LDS equipment of
the current pilot plant was found to be of 1.5 kW per 1kg/s of SCPP dehumidified working air. This highly agrees with the findings reported by Pesaran [8] and Audah et al. [10] that air dehumidification using LDS technology requires around 35% of the power consumption of that consumed by vapour compression refrigeration system to be used for the same rate of dehumidification. However, it was reported by Haaf et al. [4] and Schlaich et al. [25] that the power production capacity of SCPP depends mainly on its size. The power production capacity of SCPP has a kind of exponential proportion with its size scale due to its very low conversion efficiencies [4]. Haaf et al. [4] also reported that an economic power generation using SCPP technology is only possible with plants of 50 MW production capacity and higher. Accordingly, the LDS of the present pilot plant was provided with the needed power from external source due to the very small size of the associated SCPP. This would not be the case with commercial size SCPP of 50 MW and higher where part
19-O
ct-18
24-O
ct-18
26-O
ct-18
28-O
ct-18
4-Nov
-18
23-N
ov-18
26-N
ov-18
28-N
ov-18
30-N
ov-18
2-Dec-
180
5
10
15
20
25
30
Estim
ated
mea
n pl
ant o
utpu
t p
ower
(W)
Date of the testing day19
-Oct-
18
24-O
ct-18
26-O
ct-18
28-O
ct-18
4-Nov
-18
23-N
ov-18
26-N
ov-18
28-N
ov-18
30-N
ov-18
2-Dec
-180
500
1000
1500
2000
2500
3000T
ota
l am
ou
nt
of
gen
erat
ed f
resh
w
ater
per
ten
ho
urs
(m
l)
Date of the testing day
Mahal S.K. and A.J. Alimin / International Energy Journal 20 (2020) 67 – 86
www.rericjournal.ait.ac.th
84
of its produced power can be used to dehumidify a small part of its working air according to any desired percentage of its produced power. Although Manzanres plant cannot be considered as commercial size of SCPP, where its nominal production capacity is 50 kW [4],[5], but let it to be taken as an example of applying the present technology. Manzanares plant handles around 730 kg/s of air upon producing 50 kW power [4]. As explained above that an average of 5.6 l/hr of fresh water can be extracted from 1 kg/s SCPP working air with the deliberated average conditions and that requires around 1.5 kW electrical power to drive the associated LDS. Considering that for Manzanares case, then it can be shown that 50% of its nominal power production (25 kW) can be used to dehumidify part of its working air of around 16.6 kg/s to produce a rate of fresh water of around 93 l/hr. Similarly, it can be shown that if only 10% of Manzanares plant nominal produced power (5 kW) would be used to dehumidify around 3.3 kg/s of its working air, then a rate of fresh water of 18.48 l/hr can be produced. Consequently, it can be stated that by dehumidifying a very small part of SCPP working air, a significant amount of fresh water could be produced. However, dehumidifying part of the SCPP working air using part of its produced power is quite manageable and controllable task by wetting only a certain part of dehumidifier panels with the required amount of desiccant solution. Consequently, the current technology is of a high potential to furtherly be upgraded and applied as a commercial renewable energy-sourced generator of power and fresh water. In the light of the findings acquired from this work, comparing the current combination to the previous combinations of SCPP and FWPS in the literature [13]-[21] would show the following key facts: • The current combination concept of operation does
not include desalination process for fresh water production (desalination process is damaging to environment [22], especially when applied in commercial scale). The previous combinations have mainly been based on evaporative desalination to generate fresh water.
• Using experimental testing approach, a concrete proof of concept has been provided for the physical operation concept of the present hybrid generator of power and fresh water. However, previous studies have mostly been theoretical approaches, including significant feasibility limitations.
• Unlike previous combinations of SCPP and FWPS, the current integrated plant enables a very wide range of control over the part of the produced power by the SCPP that to be used for fresh water production. This range varies from 0% to 100% of the SCPP generated power, depending on the priority of either power or fresh water at the area where the hybrid plant to be located.
• In contrast to previous hybrid plants of SCPP and FWPS, Integrating LDS with SCPP in this combined system does not adversely affect the SCPP efficiency.
6. CONCLUSION
In this paper, an innovative concept of combining SCPP with FWPS is presented. This concept is based on integrating CaCl2 liquid desiccant system with SCPP to harvest its working air humidity and convert it into fresh water, providing a solar-powered hybrid generator of power and fresh water. The physical concept of operation of the introduced combination was proven via designing, constructing and experimentally testing a pilot plant under real outdoor weather conditions. The investigation indicated that an environmentally friendly and economic concurrent generation of electricity and fresh power could be possible using the current combination with a power production capacity higher than 50MW. Furthermore, it was found that under a daily averages of solar irradiance of 500 W/ m2 and atmospheric air humidity ratio of 0.019 (kg water vapour/ kg dry air), an average of fresh water production of around 5.6 l/hr could be achieved per 1 kg/s of SCPP driven working air. Thus, this technology has a great potential to be more upgraded and implemented in commercial scales. Moreover, the experimental results showed that the equipment of the incorporated LDS require an average of electrical power of 1.5 kW to dehumidify 1kg/s of SCPP working air and produce the above mentioned average of fresh water production rate. However, the plant scale, solar irradiance, atmospheric air moisture content, dehumidifier effectiveness and desiccant solution concentration were found as the main parameters influencing the overall performance of the current combination. Moreover, unlike other combinations of SCPP and FWPS of previous studies, the present combination does not include desalination, thus, the desalination disadvantages are avoided. Another advantage is allowing the implementation of wide controllable range (0%-100%) of SCPP generated power to produce fresh water.
ACKNOWLEDGEMENT
The authors would like to express their sincere gratitude to the Ministry of Education, Malaysia for financing this work through the FRGS Grant 1632. The Research Management Centre (RMC), Universiti Tun Hussein Onn Malaysia is also acknowledged for the continuous support and cooperation provided.
REFERENCES
[1] Delyannis E., 2003. Historic background of desalination and renewable energies. International Journal of Solar Energy 75(5): 357-366.
[2] Mahal S.K. and A.J. Alimin. 2016. A review of the hybrid solar chimney and water desalination systems for simultaneous production of electricity and fresh water. International Review of Mechanical Engineering 10(6): 419-436.
[3] Mahal S.K. and A.J. Alimin. 2017. Advancement in the technology of solar powered liquid desiccant systems for fresh water production from
Mahal S.K. and A.J. Alimin / International Energy Journal 20 (2020) 67 – 86
www.rericjournal.ait.ac.th
85
atmospheric humidity. International Review of Mechanical Engineering 11(3): 191-199.
[4] Haaf W., Friedrich K., Mayr G., and Schlaich J., 1983. Solar chimneys - Part i: principle and construction of the pilot plant in Manzanares. International Journal of Solar Energy 2(1): 3-20.
[5] Haaf W., 1984. Solar chimneys – Part II: preliminary test results from the Manzanares pilot plant. International Journal of Solar Energy 2(2): 141-161.
[6] Padki M.M. and S.A. Sherif. 1988. Fluid dynamics of solar chimneys. ASME, Fluid Engineering Division 70: 43-46.
[7] Jones I.S.F., 2011. Engineering strategies for greenhouse gas mitigation. Cambridge University Press.
[8] Pesaran A., 1994. A review of desiccant dehumidification technology. National Renewable Energy Laboratory under Contract No. DE-AC36-83CH10093.
[9] Kabeel A.E., 2007. Water production from air using multi-shelves solar glass pyramid system. Renewable Energy 32(1): 157-172.
[10] Audah N., Ghaddar N., and Ghali K., 2011. Optimized solar-powered liquid desiccant system to supply building fresh water and cooling needs. Applied Energy 88: 3726–3736.
[11] Kumar M. and A. Yadav. 2015. Experimental investigation of design parameters of solar glass desiccant box type system for water production from atmospheric air. Journal of Renewable and Sustainable Energy 7(3): 033122.
[12] Kumar M. and A. Yadav. 2015. Experimental investigation of solar powered water production from atmospheric air by using composite desiccant material CaCl 2/saw wood. Desalination 367: 216-222.
[13] Yiping W., Zhenlei F., Li Z., Zhiyong Y., Junhong W., and Lijun H., 2006. Study on the integrated utilization of seawater by solar chimney. Acta Energiae Solaris Sinica 27(4): 382.
[14] Kashiwa B.A. and C.B. Kashiwa. 2008. The solar cyclone: A solar chimney for harvesting atmospheric water. Energy 33(2): 331–339.
[15] Ming T., Gong T., de Richter R.K., Liu W., and Koonsrisuk A., 2016. Freshwater generation from a solar chimney power plant. Energy Conversion and Management 113:189-200.
[16] Zhou X., Xiao B., Liu W., Guo X., Yang J., and Fan J., 2010. Comparison of classical solar chimney power system and combined solar chimney system for power generation and seawater desalina¬tion. Desalination 250(1): 249–256.
[17] Zuo L., Zheng Y., Li Z., and Sha Y., 2011. Solar chimneys integrated with sea water desalination. Desalination 276(1): 207–213.
[18] Zuo L., Yuan Y., Li Z., and Zheng Y., 2012. Experimental research on solar chimneys integrated with seawater desalination under practical weather condition. Desalination 298: 22–33.
[19] Zuo L., Yuan Y., Li Z., and Liu W., 2012. Numerical analysis of flow heat transfer characteristics in solar chimneys integrated with seawater desalination. In the Proceedings of International Conference On Sustainable Power Generation and Supply, Hangzhou, pp.1-7.
[20] Niroomand N. and M. Amidpour. 2013. New combination of solar chimney for power generation and seawater desalination. Desalination and Water Treatment .51(40-42): 7401-7411.
[21] Zuo L., Liu Z., Zhou X., Ding L., Chen J., Qu N., and Yuan Y., 2019. Preliminary study of wind supercharging solar chimney power plant combined with seawater desalination by indirect condensation freshwater production. Desalination 455: 79-88.
[22] Missimer T.M. and R.G. Maliva. 2018. Environmental issues in seawater reverse osmosis desalination: Intakes and outfalls. Desalination 434: 198-215.
[23] Noll E.M. 1981. Wind/Solar Energy, 2nd edition. Indiana: Howard W. Sam and Co., Inc.
[24] Sakir T., Piash K.B., and Akhter S., 2014. Design , construction and performance test of a small chimney power plant. Global Journal of Researches in Engineering 14(1-A): 21-28.
[25] Schlaich J., Bergermann R., Schiel W., and Weinrebe G., 2005. Design of commercial solar updraft tower systems – utilization of solar induced convective flows for power generation. Journal of Solar Energy Engineering 127(1): 117–124.
[26] Moon C.G., Bansal P.K and Jain S., 2009. New mass transfer performance data of a cross-flow liquid desiccant dehumidification system," International Journal of Refrigeration 32(3): 524-533.
[27] Bassuoni M.M., 2014. A simple analytical method to estimate all exit parameters of a cross-flow air dehumidifier using liquid desiccant. Journal Of Advanced Research 5(2): 175-182.
[28] Miqdam T.C. and A.K. Hussein 2011. Basement kind effects on air temperature of a solar chimney in Baghdad-Iraq weather. International Journal of Applied Sciences 2(2): 12-20.

Mahal S.K. and A.J. Alimin / International Energy Journal 20 (2020) 67 – 86
www.rericjournal.ait.ac.th
86