Embed Size (px)
Citation preview

Purdue UniversityPurdue e-Pubs
International Compressor Engineering Conference School of Mechanical Engineering
2018
Experimental Investigation of the Transient Flow inRoots BlowerShuaihui SunXi'an University of Technology, China, People's Republic of;Centre for Compressor Technology, City, University of London,EC1V 0HB, UK, [email protected]
Ahmed [email protected]
Christoph BruekerCentre for Compressor Technology, City, University of London, EC1V 0HB, UK, [email protected]
Amar LetoFaculty of Mechanical Engineering, Džemal Bijedić University of Mostar, University Campus,88104, Bosnia & Herzegovina,[email protected]
Mohsen GhavamiCentre for Compressor Technology, City, University of London, EC1V 0HB, UK, [email protected]
See next page for additional authors
Follow this and additional works at: https://docs.lib.purdue.edu/icec
This document has been made available through Purdue e-Pubs, a service of the Purdue University Libraries. Please contact [email protected] foradditional information.Complete proceedings may be acquired in print and on CD-ROM directly from the Ray W. Herrick Laboratories at https://engineering.purdue.edu/Herrick/Events/orderlit.html
Sun, Shuaihui; Kovacevic, Ahmed; Brueker, Christoph; Leto, Amar; Ghavami, Mohsen; Rane, Sham Ramchandra; and Singh,Gursharanjit, "Experimental Investigation of the Transient Flow in Roots Blower" (2018). International Compressor EngineeringConference. Paper 2615.https://docs.lib.purdue.edu/icec/2615

AuthorsShuaihui Sun, Ahmed Kovacevic, Christoph Brueker, Amar Leto, Mohsen Ghavami, Sham Ramchandra Rane,and Gursharanjit Singh
This conference paper is available at Purdue e-Pubs: https://docs.lib.purdue.edu/icec/2615

1465, Page 1
24th International Compressor Engineering Conference at Purdue, July 9-12, 2018
Experimental Investigation of the Transient Flow in Roots Blower
Shuaihui SUN*1,2, Ahmed KOVACEVIC2*, Christoph BRUECKER2,
Amar LETO3, Mohsen GHAVAMI2, Sham RANE4, Gursharanjit SINGH2
1Xi’an University of Technology, No.5, South Jinhua Road, 710048, CHINA. 2Centre for Compressor Technology, City University London, EC1V0HB, UK.
3Faculty of Mechanical Engineering, Džemal Bijedić University of Mostar,
University Campus,88104, Bosnia & Herzegovina 4Department of Engineering Science, University of Oxford, OX1 2JD, UK.
* Corresponding Author
ABSTRACT
Rotary positive displacement machines are common method to pump flow in various process industries. Their
performance highly depends on the operational clearances. It is widely believed that computational fluid dynamics
(CFD) can help understanding and reducing internal leakage flows. However, Developments of grid generating tools
for use of CFD in rotary positive displacement machines have not yet been fully validated. Thereby arising a need to
validate these models that help in better understanding of the leakage flows. Roots blower is a good representative of
positive displacement machines and as such is convenient for optical access to analyse flows in in such machines.
This paper describes the setup of the experimental test rig with the optical Roots blower in the Centre for
Compressor Technology at City, University of London and the first results obtained using three different flow
visualization methods. These are namely i) the high-speed camera (HC), ii) the continuous time resolved PIV (CPIV)
and iii) the instantaneous PIV obtained with double pulse PIV laser and double shutter camera (IPIV). Test results
from these three tests are compared and discussed in the paper. The CPIV test shows the movement of the vortex
and the general shape of the flow field clearly but is not sufficient to calculate velocity vectors of high-velocity
particles due to the limitation of the laser and camera. The IPIV test can produce quantitative velocity vector images
of the internal flow but needs improvement to look into the leakage flow. The work described in this paper is a part
of the large project set to evaluate characteristics of the internal flow in rotary positive displacement machines and
to characterize leakage flows. The objective is to enable further improvements in 3D CFD analysis of leakage flows
in rotary positive displacement machines and ultimately lead to the improvement in the performance of rotary
positive displacement machines.
1. INTRODUCTION
Rotary positive displacement machines are widely used in many industrial fields. Depending on the application they
may contain one or more rotating rotors and a stator. Typical representatives of a single rotor machines are
progressive cavity pumps and single screw compressors. Twin rotor machines are more common. These can be
designed with straight lobes such as in Roots blowers or with helical lobes such as in screw compressors, expanders
and pumps. Such machines can handle single fluids in the form of gas, vapour or liquid or multi-phase fluids mixed
from any combination of single phase fluids and solids and may operate above or under atmospheric pressures.
Single and multiphase pumps are often configured with multiple rotors. In all these machines, gaps between rotating
and stationary parts have to be maintained to allow a safe and reliable operation but are desired to be minimal in
order to reduce leakage flows which play critical role in the performance. The challenge is to maintain the size of the
gaps due to deformations of the machine elements which could be caused by thermal of physical loads.
Many researchers have studied leakage flows through clearance gaps in rotary positive displacement machines both
experimentally and numerically. Numerical methods are mostly based either on chamber modelling (Stosic et al.
2005), or computational fluid dynamics (CFD) model (Kovacevic et al. 2007). In chamber models, it is usually
assumed that the momentum change in the main domain is negligible due to the internal energy being dominant
1465, Page 2
24th International Compressor Engineering Conference at Purdue, July 9-12, 2018
while the velocity of the leaking fluid is obtained based on the assumption of the isentropic flow through the nozzle.
A CFD model allows more accurate calculation of velocities both in the main domain and in the leakage paths by
numerically solving governing conservation equations for mass, energy and momentum. This is subject to the
availability of an accurate numerical mesh which can precisely capture flows in both, the main flow domain and in
clearances. The latest developments in the grid generation for screw machines described in detail in Sham and
Kovacevic (2017) have led to the mesh which can be used in all flow calculations and for all different machines
described earlier by us of variety of commercially available solvers. The size of the mesh, the speed of its generation
as well as the speed of calculation by commercial solvers is great and well suitable for industry. However, the
question still remains if this mesh is sufficiently fine for full capture of the flow in clearances. The exact nature of
the flow into the clearance is still widely unknown. This is partly due to the inherent variable clearances, unsteady
flow field and uncertainties associated with standard CFD modelling.
Numerical procedures for calculation of performance using either chamber models or 3D CFD are usually validated
by measurements of the integral parameters such as the total mass flow rate and power as shown in recent studies by
Kovacevic and Sham (2017). However, unless the local velocities are measured, the leakage models cannot be fully
validated. In addition, even the velocity distribution in the main flow of a rotary positive displacement machine has
not been studied in detail experimentally. Therefore, for the full validation of numerical calculations it is required to
obtain accurate measurements of the flow field both in the main working domain and in the clearance gaps of a
rotary positive displacement machine.
Attempts were made in the past to evaluate local flows in screw compressors using optical methods. Firstly, the
Laser Doppler Velocimetry (LDV) measurements in the working chamber close to discharge and in the discharge
chamber of an oil free compressor were reported by Gueratto et al. (2007) while the measurement of the flow in the
suction chamber of an oil free compressor with water injection were reported by Kovacevic et al. (2014). However,
neither of these gave a full insight into the flow within the working domain of the compressor and in clearances.
Screw machines with helical rotors are difficult to modify so that an optical access is provided for assessment of
flow. The alternative may be a Roots blower which has similar characteristics of the flow as screw machines but the
presence of straight rotors provides an easy access to the flow visualization.
Roots blowers usually have two straight rotors with an involute profile and two or more lobes in each. The rotors
rotate in opposite directions within the casing and form the working chamber between the rotors and casing. Roots
blowers do not have internal compression as the volume of the chamber remains constant while rotating. The
increase of the pressure is external to the rotors due to the backflow from the high-pressure side. Recently, Liu et al.
(2013; 2014) established the CFD simulation model of the Roots blower with commercial software SC/TETRA and
validated it by measurements of mass flow rate while Sun et al. (2018; 2017) established it with Ansys FLUENT
and validated it with pressure distribution in working chamber. In addition, the leakage flow in a two-lobe Roots
blower was predicted using a stationary mesh in CFD and the results were compared with the experimental leakage
mass flow rate (Ashish et al. 2006). To the author’s knowledge, no attempts to experimentally determine velocities
using optical methods have been reported on Roots blower.
This paper describes the setup of the experimental test rig with the optical Roots blower in the Centre for
Compressor Technology at City, University of London and the first results obtained using three different flow
visualization methods, namely, i) the high-speed camera (HC), ii) the continuous time resolved PIV (CPIV) and iii)
the instantaneous PIV obtained with double pulse PIV laser and double shutter camera(IPIV). These test results are
compared and discussed while citing advantages and disadvantages towards presenting the flow field of the main
and the leakage flows. The work described in this paper is a part of the large project set to evaluate characteristics of
the internal flow in rotary positive displacement machines and to characterize leakage flows with the objective to
lead to further improvements in 3D CFD analysis of leakage flows in rotary positive displacement machines and
ultimately lead to the improvement in the performance of rotary positive displacement machines.
2. EXPERIMENTAL SETUP
2.1 Roots blower test rig The present study covers a Roots blower that employs two-lobe rotors mounted on parallel shafts rotating in the
opposite direction to transfer air as the working fluid. This Roots blower prototype was mounted on a test rig with

1465, Page 3
24th International Compressor Engineering Conference at Purdue, July 9-12, 2018
varying pressure ratios and speed to allow measurements of pressures, temperature and mass flow rate. The layout of
the test rig is shown in Figure 1a. An inverter (A) was used to regulate the rotational speed of the electric motor (B).
A pulley system (C) transfers torque to the shaft system of Roots blower while an encoder (D)-Baumer
16.25W3600-B2-5 was installed at the end of the shaft system to obtain the velocity of the Roots blower. The
encoder generates 3600 pulses for each rotation with a tolerance of 10%. The total frequency of the pulses when the
shaft is running is used to determine the rotational velocity of the shaft. A torque meter model (E) TP-5KMCB with
an accuracy of 0.2% was used to measure the torque of the Roots blower. The temperatures of fluid were measured
by the K-type thermocouples with an accuracy of ±2.2℃. Piezoelectric transducers were used to measure suction
pressure and discharge pressure with the accuracy of 0.6%. Differential pressure piezoelectric sensor, PDCR 2120,
with an accuracy of 0.6%, was used to test pressure drop caused by orifice plate. All of data from the transducers
were acquired by LabView with custom applications that can interact with signals and data from transducers. The
discharge pressure of the Roots blower was controlled by the discharge valve (J).
Figure 1: Roots blower test rig and diagram of visualizing test
A - inverter, B – electromotor, C- pulleys, D – shaft encoder, E- torque meter, F – Roots blower, G – smoke
tank, H – smoke machine, I – orifice plate, J – valve, K – light source, L – surface mirror, M – camera, N –
position of Laser plane, T1 – suction temperature transducer, P1 – suction pressure transducer, T2 – discharge
temperature transducer, P2 – discharge pressure transducer, T3 – upstream temperature transducer, ΔP –
differential pressure across an orifice plate
To obtain the optical access for visualization of the flow, a standard Howden Roots blower (F) was redesigned. The
optical window made of Plexiglas, shown in Figure 1b, was designed to allow the optical access through two
locations. One window is positioned radially while the other is on the side of the machine. The side window is used
for collecting measurements through the reflection image in the mirror (L) in the Figure 1b. The Figure 1c is the 3D
CAD model of the optical test rig. Figure 1a illustrates the principle of visualizing test. The light source (K) is used
to illuminate the chamber through the radial window. The smoke machine (H) is used to inject smoke into the smoke
tank (G) in order to provide homogeneous mixture of air and smoke. The mixture is then passed to the Roots blower
and through the illuminated chamber. Because the smoke particles have far higher scattering rate than air, the light
scattered by them was bright enough to be captured by the camera through the side window. The camera is
positioned in the front of the machine where the torque meter was located, and the recording is done through the
surface mirror mounted on the frame to reflect the light scattered from the smoke particles into the camera (M).
Hence, the movement of the particles was recorded by the camera. The size of the smoke particle is small enough to
follow the air flow, so the movement of the particles can represent the flow field in the chamber.
1465, Page 4
24th International Compressor Engineering Conference at Purdue, July 9-12, 2018
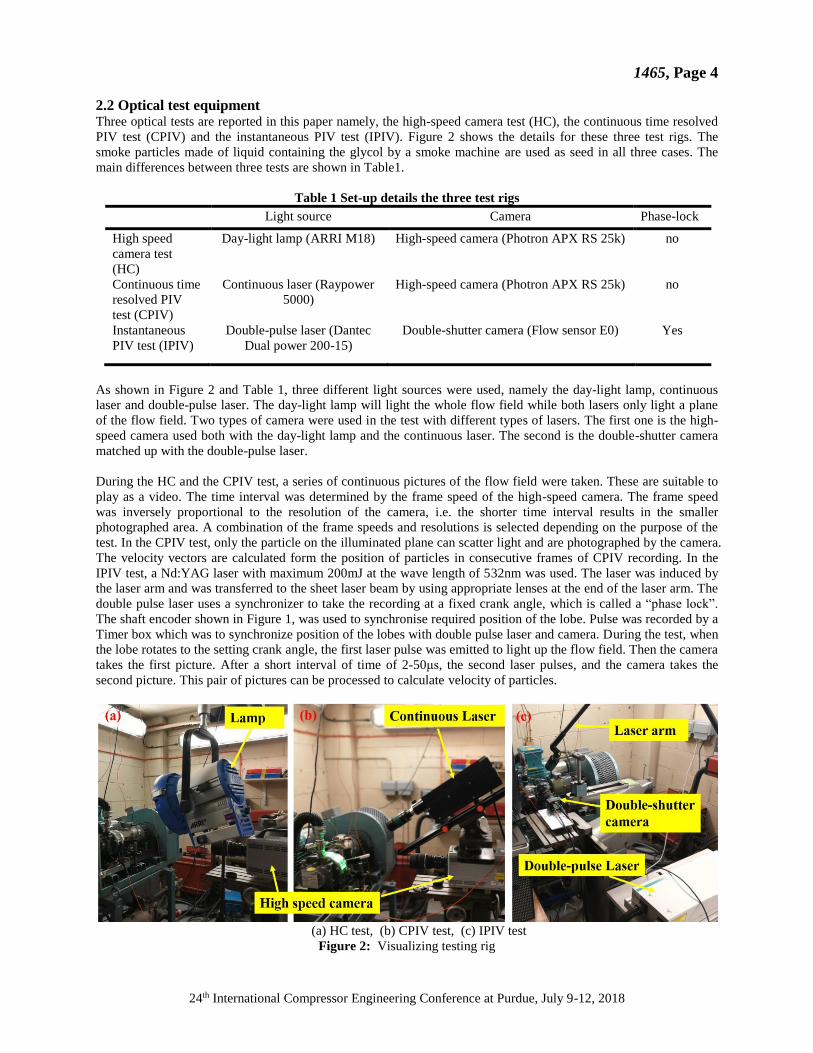
2.2 Optical test equipment Three optical tests are reported in this paper namely, the high-speed camera test (HC), the continuous time resolved
PIV test (CPIV) and the instantaneous PIV test (IPIV). Figure 2 shows the details for these three test rigs. The
smoke particles made of liquid containing the glycol by a smoke machine are used as seed in all three cases. The
main differences between three tests are shown in Table1.
Table 1 Set-up details the three test rigs
Light source Camera Phase-lock
High speed
camera test
(HC)
Day-light lamp (ARRI M18) High-speed camera (Photron APX RS 25k) no
Continuous time
resolved PIV
test (CPIV)
Continuous laser (Raypower
5000)
High-speed camera (Photron APX RS 25k) no
Instantaneous
PIV test (IPIV)
Double-pulse laser (Dantec
Dual power 200-15)
Double-shutter camera (Flow sensor E0) Yes
As shown in Figure 2 and Table 1, three different light sources were used, namely the day-light lamp, continuous
laser and double-pulse laser. The day-light lamp will light the whole flow field while both lasers only light a plane
of the flow field. Two types of camera were used in the test with different types of lasers. The first one is the high-
speed camera used both with the day-light lamp and the continuous laser. The second is the double-shutter camera
matched up with the double-pulse laser.
During the HC and the CPIV test, a series of continuous pictures of the flow field were taken. These are suitable to
play as a video. The time interval was determined by the frame speed of the high-speed camera. The frame speed
was inversely proportional to the resolution of the camera, i.e. the shorter time interval results in the smaller
photographed area. A combination of the frame speeds and resolutions is selected depending on the purpose of the
test. In the CPIV test, only the particle on the illuminated plane can scatter light and are photographed by the camera.
The velocity vectors are calculated form the position of particles in consecutive frames of CPIV recording. In the
IPIV test, a Nd:YAG laser with maximum 200mJ at the wave length of 532nm was used. The laser was induced by
the laser arm and was transferred to the sheet laser beam by using appropriate lenses at the end of the laser arm. The
double pulse laser uses a synchronizer to take the recording at a fixed crank angle, which is called a “phase lock”.
The shaft encoder shown in Figure 1, was used to synchronise required position of the lobe. Pulse was recorded by a
Timer box which was to synchronize position of the lobes with double pulse laser and camera. During the test, when
the lobe rotates to the setting crank angle, the first laser pulse was emitted to light up the flow field. Then the camera
takes the first picture. After a short interval of time of 2-50μs, the second laser pulses, and the camera takes the
second picture. This pair of pictures can be processed to calculate velocity of particles.
(a) HC test, (b) CPIV test, (c) IPIV test
Figure 2: Visualizing testing rig

1465, Page 5
24th International Compressor Engineering Conference at Purdue, July 9-12, 2018
2.3 Test setup All three tests are performed at similar operating conditions shown in the Table 2. The inlet pressure fluctuated with
the atmosphere pressure. The discharge pressure was controlled by the discharge valve to obtain the similar pressure
ratio during the test. The speed and the pressure ratio in the test are lower than the design parameters, so the main
flow and leakage velocity will be lower, which is beneficial for visualizing the results.
Table 2 Operating conditions for the Roots blower tests
Inlet
pressure/
bar
Inlet
temperature/
K
Outlet
pressure/
bar
Outlet
temperat
ure/K
Pressure
ratio
Speed/rp
m
Mass
flow rate/
kg/s
HC test 1.011 298.4 1.075 304.5 1.063 464 0.00118
CPIV test 0.986 300.1 1.048 303.1 1.063 464 0.00111
IPIV test 0.975 300.6 1.045 306.2 1.072 464 0.00103
The camera frame speed for the HC test was 10000fps with the resolution of 768*368 pixels. The recording would
start after the release of the smoke into the blower. Usually, the time duration of recording is 1 second which would
be sufficient for 6 cycles of rotors under the current rotation speed to be captured. During the CPIV test, the laser
beam plane was 0.5cm inside the chamber from the window, as shown in Figure 1. The frame speed of the camera
was 10000fps while the resolution was 512*512 pixels. The continuous pictures were recorded for 1 second which
captured 6 rotor cycles. In the IPIV test, the time interval between the two pulses of laser varied from 2 to 50μs
which was dependent on the maximum velocity in the flow field. The resolution of the double shutter camera was
2048*2048 pixels and it was independent of the time interval of the laser. The test captured a pair of pictures at the
same angle with the phase-lock at every pair of laser shots. Because the rotor has two symmetrical lobes, one
completed circle including suction and discharge process takes up 180 °. The full cycle was divided into six steps
with the interval of 30 °. The crank angle when the lobe is vertical is defined as 0 °, the crank angle of shooting
position would be 10, 40, 70, 100, 130 and 160° in respectively. Figure 3 shows the rotor positions at the crank
angle of 10 and 70 °.
The HC and IPIV results were processed in Dantec Dynamic studio using the adaptive PIV approach. The CPIV
results were processed by the in-house code using the adaptive PIV approach with window refinement. The scale
coefficient represents the magnification of the picture and is defined as the ratio of the length of the rotor tip step
shown in Figure 3 to the number of pixels taken from the image which represent that step in the rotor. The scale
coefficient is used to convert the pixel velocity to the instantaneous velocity of particles in the flow field.
Figure 3: Rotor position at 10o and 70o
3. EXPERIMENTAL RESULTS
3.1 Visualization of the flow field Figure 4 shows the original figures from the IPIV test at the shooting position of 10 ° and 70 °. The tracked particles

1465, Page 6
24th International Compressor Engineering Conference at Purdue, July 9-12, 2018
can be distinguished easily in both pictures. At the crank angle of 10 °, the windows show the front of the lobe
which has just closed the suction. At the crank angle of 70 °, the window shows the area behind the lobe connected
to the suction chamber. These are two most interesting position for analysis. Two shadows are visible in the frames,
one at the top left of the window and another on the right side of the window which reduce the visible flow field.
Figure 4: Original pictures of tracer particle from IPIV test
Figure 5 shows a group of snapshots taken by high speed camera in the HC test (left) and CPIV test (right). It is not
easy to identify a single smoke particle in the HC test these pictures, but the flow pattern can be visualised by the
density of the smoke in each position. It can be observed from the first picture that smoke near the lobe rotates anti-
clockwise. This is a vortex caused by the back flow from the tip-leakage clearance, which can be identified in the
video of the HC results. This vortex is 3 dimensional, in addition to the rotation in the plane of the picture, it also
spins perpendicularly. It was captured in the HC because the ambient light allows for particles in different planes to
be visible.
Figure 5 (right) shows the CPIV pictures at angles of 70° to 72°. These images are sharper than the HC images and
particles can be observed more clearly however the third dimension cannot be captured due to the plane illumination
by the sheet laser for CPIV. The fluid close to the outside wall mainly flows from right to left indicating the
backflow induced by the tip-leakage flow. The leakage flow is not visible due to the reflection from the surfaces and
due to light scattering as indicated by the yellow line in the top right image in Figure 5. Furthermore, the window
inside the red line was scratched which additionally prevents taking a clear image of the flow field near the outside
casing wall, especially the tip-leakage flow. The lobe, bolts and the inner surface of the chamber were painted matt-
black and the scratches were polished before the final IPIV tests were obtained. As shown in Figure 4, the scratches
area disappeared during the IPIV test while the reflection area become much narrower. In the CPIV test (Figure 5
right) it was noticed that the vortex appears behind the lobe and rotates anti-clockwise as indicated by the yellow
circle. The shape and the position of the vortex changes with the rotation quickly.
3.2 Velocity field
The instantaneous velocity vectors at the crank angle of 10° and 70° were calculated from IPIV test. The mean
velocity vectors are obtained by averaging the instantaneous velocity vectors from all 120 measured cycles. To
compare with the IPIV results, the pictures at the crank angle 10 and 70 ° of every cycle from the HC and CPIV
results were founded and processed to obtain the instantaneous velocity vector. The HC pictures were also processed
in Dantec Dynamic studio using the adaptive PIV approach. The HC average velocity vector was calculated by
averaging 4 instantaneous velocity vector fields at the same position, and the CPIV average velocity was computed
using 6 readings at the same position.
Figure 6 shows instantaneous and average velocity fields at the crank angle of 10°. All images were plotted in the
same coordinates system. Images on the left side of the figure show instantaneous while the mean velocities are

1465, Page 7
24th International Compressor Engineering Conference at Purdue, July 9-12, 2018
Figure 5: Original pictures from HC test (left) and CPIV test (right)
plotted on the right side. Figure 6 a) and b) show result from HC test, Figure 6 c) and d) are CPIV while Figure 6 e)
and f) are IPIV test. The instantaneous velocity vector distributions in the overlapped area of three figures show
different patterns. IPIV test shows the vortex in area C which cannot be seen in HC and CPIV test. In addition, in the
area A in the HC test and in area B of the CPIV test, the velocity magnitudes were approximately equal to 0. For the
HC test, the reason could be the image processing software which was unable to identify the movement of particles
and fails to calculate the correct speed. For the CPIV, it is most likely because of the reflection which was shown in
Figure 5. In addition to that it was identified that the time resolved PIV (CPIV) did not have sufficient resolution to
accurately track particles and ensure that the same particles are related in consecutive frames. In the IPIV test, a
powerful laser was used with the full resolution of 2048*2048 which allowed taking a full image of the polished
window. Therefore, all of the particles in the full flow field are bright enough to be identified and to calculate their
velocity vectors except in the right bottom corner where the shadow covers the image (see Figure 4). Therefore, the
IPIV velocity vector picture is believed to have best quality out of three and is most likely to show the real flow field.
Figures on the right show the average velocity field.
The average velocity fields are similar. The velocity magnitudes are also in the same range. Comparing the
instantaneous and average flow, the average velocity vector distributions of HC and CPIV results are not
significantly different from the instantaneous values except the maximum velocity magnitude is reduced. The
average IPIV vector distribution is different from the instantaneous one. The vortex disappears, the maximum

1465, Page 8
24th International Compressor Engineering Conference at Purdue, July 9-12, 2018
velocity decreases and the average velocity magnitude increases. Because the average IPIV velocity vector
distribution is an average of 120 instantaneous vector field at the same position, the turbulence statistics will remove
the turbulent fluctuation and instantaneous motions of the flow. Hence, the average IPIV vector field is reasonable,
which represents that the fluid in the chamber is pushed by the lobe. It can also be observed that the fluid at the area
D flows upwards, which is actually the beginning of the tip-leakage flow at the upstream of the clearance.
Figure 6: Instantaneous and average velocity field at the crank angle of 10 °

1465, Page 9
24th International Compressor Engineering Conference at Purdue, July 9-12, 2018
Figure 7: Transient and average velocity field at the crank angle of 70 °
Figure 7 shows instantaneous and average velocity field at the crank angle of 70°. In all pictures, the fluid near the
lobe follows the direction of movement of the lobe at the velocity of the lobe. CPIV and IPIV indicate that the flow
direction and the vortex moving in the opposite direction of the lobe movement. This is the back flow induced by
the tip-leakage flow which was also shown in Figure 5. It should be noticed that the velocity magnitude for IPIV is
much higher than CPIV which indicates that the time resolved PIV did not have sufficient resolution to capture the
fast-moving particles accurately. The maximum instantaneous velocity reached 10.3m/s in the area D. It is believed
that the IPIV tests gives reasonable results, because the leakage velocity at the downstream of the tip clearance is
high, which will in turn result in the high velocity of backflow. The reason for low speed in area B and C in Figure
8c is that the frame speed of the camera is not sufficient to capture the movement of the high-velocity particle. For
the IPIV test, the time interval of the two pulses of laser is 15μs. The frame speed is about 66000 fps which is far
higher than 10000fps used in CPIV test. Particles in the CPIV pictures cannot be correlated correctly because

1465, Page 10
24th International Compressor Engineering Conference at Purdue, July 9-12, 2018
particles in the first picture may move far away in the second correlated picture. Hence, the CPIV test in this paper
can show the variation of vortex and flow pattern but is not suitable to calculate the velocity vector when the flow
speed is high. The power of continuous laser, the resolution and frame speed of the camera used in this test limit the
capability of the CPIV test. In spite of these limitations, the CPIV results could show the dynamics of the flow
during rotation of the lobe and the richness of vortices present in the flow which is not possible with IPIV. Therefore,
both quantitative measurement methods have the individual advantages and disadvantages for use in such highly
unsteady flows. The flow in the area E of IPIV is the downstream tip leakage flow shows low velocity. It is not clear
if this is because of the recirculation or the error in measurements due to the reflection form the surface.
Higher resolution that needs microscope lens and shorter laser time interval will be used to capture the velocity
vector of the leakage flow in and around the tip clearance in the future which may give an additional insight into the
leakage flows in the Roots blower.
4. CONCLUSIONS
Three different flow visualization tests were performed, and their results are compared and discussed in the paper.
The HC test shows the 3-dimensinal flow pattern of the flow, but it is difficult to identify the particles in the picture
and to resolve such flow velocities. The CPIV test can resolve flow pattern and the movement of the vortex clearly,
and its results can be processed to calculate the velocity of the particles. However, because of the limitation of the
power of continuous laser and the capability of the high-speed camera, the CPIV test cannot capture the movement
of the high-speed particles, especially in the leakage clearance and at the downstream of it. The IPIV test can capture
velocity vectors and magnitude can be calculated. The instantaneous velocity distribution shows the vortex and
turbulent flow pattern while the average velocity distribution shows the main flow direction before and after the lobe.
Nevertheless, the velocity vector in the leakage clearance and the area at the exit of the clearance haven’t been
obtained successfully due to the high velocity of particles and the low resolution of the camera. The future work will
be focused on the IPIV test in and around the tip-leakage clearance to characterize leakage flows with the objective
to lead to further improvements in 3D CFD analysis of leakage flows and ultimately lead to the improvement in the
performance of rotary positive displacement machines.
REFERENCES
Ashish M. Joshi, David I. Blekhman, James D. Felske, John A. Lordi, & C.Mollendorf, J. (2006). Clearance
Analysis and Leakage Flow CFD Model of a Two-LobeMulti-Recompression Heater. International Journal of
Rotating Machinery, 1-10.
Guerrato D, Nouri J.M, Stosic N., Arcoumanis, C., Smith I.K. (2007a). Flow Development in the Discharge
Chamber of a Screw Compressor. Int. Conf. on Compressors and their Systems, IMEchE, September 2007, London.
Huang, Z. F., & Liu, Z. X. (2009). Numerical study of a positive displacement blower. Proceedings of the Institution
of Mechanical Engineers Part C-Journal of Mechanical Engineering Science, 223(10), 2309-2316.
Kovačević, A. (2005). Boundary Adaptation in Grid Generation for CFD Analysis of Screw Compressors, Int. J.
Numer. Methods Eng., 64(3): 401-426.
Kovačević, A., Stošić, N. & Smith, I. K. (2007). Screw compressors - Three-dimensional computational fluid
dynamics and solid fluid interaction, ISBN 3-540-36302-5, Springer-Verlag Berlin Heidelberg New York.
Kovačević, A, Rane S. (2017). Algebraic generation of single domain computational grid for twin screw machines
Part II – Validation, Advances in Engineering Software, 107, 31-43, doi: 10.1016/j.advengsoft.2017.03.001
Kovacevic, A., Arjeneh, M., Rane, S., Stosic, N., Gavaises, M. (2014). Flow Visualization at Suction of a Twin
Screw Compressor, in International Conference on Screw Compressor 2014, Dortmund, TU Dortmund University.
Liu, X. M., & Lu, J. (2014). Unsteady Flow Simulations in a Three-lobe Positive Displacement Blower. Chinese
Journal of Mechanical Engineering, 27(3), 575-583.
Liu, X. M., Lu, J., Gao, R. H., & Xi, G. (2013). Numerical Investigation of the Aerodynamic Performance Affected
by Spiral Inlet and Outlet in a Positive Displacement Blower. Chinese Journal of Mechanical Engineering, 26(5),
957-966.
Rane, S., Kovačević, A. (2017). Algebraic generation of single domain computational grid for twin screw machines.
Part I. Implementation, Advances in Engineering Software, 107, pp. 38-50.
Rane, S. (2015). Grid Generation and CFD analysis of variable Geometry Screw Machines, PhD thesis, City,
University of London, London.

1465, Page 11
24th International Compressor Engineering Conference at Purdue, July 9-12, 2018
Stošić, N., Smith, I. K. & Kovačević, A. (2005). Screw Compressors: Mathematical Modelling and Performance
Calculation, Springer Verlag, Berlin, ISBN: 3-540-24275-9.
Sun, S. K., Jia, X. H., Xing, L. F., & Peng, X. Y. (2018). Numerical study and experimental validation of a Roots
blower with backflow design. Engineering Applications of Computational Fluid Mechanics, 12(1), 282-292.
doi:10.1080/19942060.2017.1419148
Sun, S. K., Zhao, B., Jia, X. H., & Peng, X. Y. (2017). Three-dimensional numerical simulation and experimental
validation of flows in working chambers and inlet/outlet pockets of Roots pump. Vacuum, 137, 195-204.
doi:10.1016/j.vacuum.2017.01.005
ACKNOWLEDGEMENT
The author would like to thank Howden Compressors for allowing authors to use and modify one of the Howden
Roots blowers in this experiment.
The authors gratefully acknowledge financial support from China Scholarship Council to allow the researcher from
China to perform this work at City, University of London.
Authors are thankful to Mr Robert Jaryczewski and Dr Ivan Zadrazil from Dantec for help in setting and
demonstrating their equipment used for the part of this work.