Embed Size (px)
Citation preview
is ofin thedis-rance
ss, noledge.preset
withre,vari-
°C tothemple-riesidandettingd. Notab-the
ading.ics ofledge,amicsove-tting
D. Attinger
Z. Zhao
D. Poulikakos
Laboratory of Thermodynamicsin Emerging Technologies,
Institute of Energy Technology,Swiss Federal Institute of
Technology (ETH),8092 Zurich, Switzerland
An Experimental Study of MoltenMicrodroplet Surface Depositionand Solidification: TransientBehavior and Wetting AngleDynamicsThe basic problem of the impact and solidification of molten droplets on a substratecentral importance to a host of processes. An important and novel such processarea of micromanufacturing is solder jetting where microscopic solder droplets arepensed for the attachment of microelectronic components. Despite the recent appeaof a few numerical studies focusing on the complex transient aspects of this proceanalogous experimental results have been reported to date to the best of our knowSuch a study is reported in this paper. Eutectic solder (63Sn37Pb) was melted to asuperheat and used in a specially designed droplet generator to produce dropletsdiameters in the range 50–100mm. In a first series of experiments, the size, temperatuand impacting speed of the molten droplets were maintained constant. The primaryable was the temperature of the substrate that was controlled in the range from 48135°C. The dynamics of molten solder microdroplet impact and solidification onsubstrate was investigated using a flash microscopy technique. The time for the cotion of solidification from the moment of a solder droplet impact on the substrate vabetween 150ms and 350ms. The dynamic interaction between the oscillation in the liquregion and the rapid advance of the solidification front was visualized, quantified,presented in this paper. In a second series of experiments, the evolution of the wangle between the spreading drop and the substrate was recorded and analyzequantitative agreement with Hoffman’s correlation for wetting was found. It was eslished that the wetting angle dynamics is strongly coupled with the evolution ofdroplet free surface. Two successive regimes were distinguished during the spreThe influence of the initial impact velocity and substrate temperature on the dynamthe measured wetting angle was described in both regimes. To the best of our knowthis study presents the first published experimental results on the transient fluid dynand solidification of molten microdroplets impacting on a substrate at the abmentioned time and length scales that are directly relevant to the novel solder jetechnology.@S0022-1481~00!01403-1#
Keywords: Droplet, Heat Transfer, Manufacturing, Microscale, Visualization
n
m
ngle
olidi-ntrate
cs istooddlenu-
odelsure-
dereen
ngbe-
cesthed9
1 IntroductionScientific research interest on droplet-surface interactions
recently increased, driven by a need for an in-depth understanof new aspects of droplet impact phenomena that are importaemerging technologies such as spray deposition~@1,2#! and pi-coliter size solder droplet dispensing. Picoliter size droplet dpensing ~the application to which the present work is directrelevant! is used for advanced surface mount technologies~SMT!in the packaging of electronic microchips. In this technologmonodispersed arrays of molten metal microdroplets~25–100mmin diameter! are printed on a substrate, each microdroplet~orbump! forming an electrical connection. Important advantagespicoliter size droplet dispensing over other bumping technologare the flexibility and low cost, because neither masks nor screare required~@3,4#!.
Many physical phenomena related to the prediction of bushape and metallic properties are not well understood. Therstill a lack of basic understanding and modeling capabilities
Contributed by the Heat Transfer Division for publication in the JOURNAL OFHEAT TRANSFER. Manuscript received by the Heat Transfer Division, Oct. 25, 19revision received, Apr. 11, 2000. Associate Technical Editor: T. Avedisian.
544 Õ Vol. 122, AUGUST 2000 Copyright ©
hasdingt to
is-ly
y,
ofiesens
pe isfor
phenomena, such as the dynamic behavior of the wetting abetween the substrate and the droplet~@5#!, the thermal contactresistance between splat and substrate as well as the rapid sfication phenomenon~@6#!, including heterogeneous nucleatioand recalescence, as well as the possible remelting of the subs~@7#!. These are typical mesoscopic phenomena, whose physioften related to microscopic phenomena and cannot be undersusing the classical continuum approach. A common way to hanthese mesoscopic phenomena is to match experiments withmerical or analytical models in order to estimate the needed mparameters. Using this approach, several temperature meaments under relatively large~mm size! solidifying droplets havebeen performed and matched with numerical simulations in orto estimate the values of the thermal contact resistance betwthe splat and the substrate~@8–10#! or to estimate the nucleationtemperature~@8#!.
The evolution of the wetting angle during droplet spreadialso contains largely unresolved physics. The wetting anglehavior at the molecular level is governed by intermolecular for~@11#!. The relation, if any, between the molecular angle andmacroscopic angle~visible with a low-power microscope, anmeasured in the present study! is also not well established~@12#!.
9;
2000 by ASME Transactions of the ASME
e
hfebtl
taf
rs
r
ha
i
h
e
id
ti
-
h
i
m
-
os
ii
o
h
.t
thepletsd so-ad-
, and
Thein as
eenphy
ult-e
thetech-ase
ofon-seth-
ofthents.inretricoffaceand.mati-
ting.su-dend
tionent,
Empirical correlations, such as Hoffman’s law~@13#!, express thedynamic evolution of the macroscopic wetting anglea as a func-tion of the capillary number Ca and of the equilibrium wettinangleaeq , for steady flows under conditions of negligible Webnumber~@12#!. In the impact of a droplet on a flat surface, thfluid dynamics is unsteady and the Weber number based oncontact line velocity is not negligible. Therefore, the motion of tdroplet free surface near the contact line and the dynamics obulk fluid may influence the value of the wetting angle. Furthmore, in a molten droplet impact, there is the additional contrition of heat transfer, which can drastically change flow properby glassification, or can even arrest the motion of the contactby solidification. Fukai et al.@14# and Pasandideh-Fard et al.@9#used experimentally measured advancing and receding weangles in their numerical models to study the effects of surfwetting on the spreading and recoiling motion of a droplet aimpingement on a dry surface. However, since these anglessubstrate temperatures have been measured for rather largetems, with respect to both time and space scales, the quearises if the conclusions can be applied to smaller scales ofkind found in picoliter size solder droplet dispensing and spcasting.
A promising approach to obtain direct insight in the thermphysics of picoliter-size molten droplet impact is the high-spevisualization of such a process. If it were possible to observe, wenough time and space resolution, the spreading and solidificadynamics of picoliter solder droplet impact, in addition to tdirect information that the experiments would provide, a compson with numerical studies of the same problem, such as thosWaldvogel and Poulikakos@15# and by Xiong et al.@16#, wouldbe feasible. Such experiments are reported in the present papkey finding of the above two papers is that a strong couploccurs between heat transfer, fluid dynamics, and phase chaleading to a wavy surface of the solder bumps. Although twavy surface appears in both numerical and experimental stu~the latter yielding only the shape of the completely solidifimicrobump!, there is still a significant discrepancy between nmerical results and final shape micrographs~@16#!. A visualizationof the microdroplet in motion accompanied by relevant quanttive measurements contributes significantly to the understanof this phenomenon.
A variety of visualization techniques have been applied inexperimental investigations of droplet impact dynamics, includhigh-speed camera techniques~@17–21#!, flash photography~@22–24#!, and flash videography~@25–26#!. There is one basic distinction between high-speed camera and flash techniques: the forecords the highest number of frames from a single event, wthe latter reconstructs the event by patching together sevframes taken at different instants from several reproducevents. In our case, the expected short duration of the phenenon~of the order of 100 microseconds! prevented the use of moshigh-speed cameras. For example, even a very fast CCD casuch as the Kodak EKTAPRO~40, 500 partial frames per seconand available in our laboratory! could only give a rough qualitative recording of the phenomenon. Intensified CCD cameras ha time delay between two frames smaller than 50 ns and chave solved the time resolution problem. However, this expentechnology only allows recording a limited number of frames~8 to30! of a single event~@27#! so that the reconstruction problematof one event from several reproducible events would have arin this case as well. The high-speed 16-mm camera techniquenot been considered because of its complex machinery, high cand difficulty of implementation~@28#!.
In contrast with the methods discussed above, the flash phoraphy and flash videography techniques are stroboscopic metwhereby a variable number of short-pulse illuminations~1 to 10pulses! are produced at specific instants during each eventrecorded by a 35-mm camera or a CCD camera, respectivelygenerating a sequence of identical drops and practically iden
Journal of Heat Transfer
gretheether-u-iesine
tingce
terandsys-tiontheay
o-edithtioneri-
e by
er. Angnge,is
diesd
u-
ta-ing
heng
rmerile
eralbleom-t
erad
aveuldive
csenhassts,
tog-ods
andBy
ical
impact events per drop, one can capture different stages ofprocess in each event and piece together from images of drotaken at progressive stages the entire impact, spreading, anlidification process. Key parameters describing the droplet spreing process, i.e., splat/substrate contact area, splat diameterthickness as well as the wetting angle~@9#!, can be subsequentlymeasured from the recorded pictures of spreading droplets.flash techniques rely therefore on the generation of dropletshighly repeatable manner~@22,25,24,26#! since the impact procesis reconstructed from images of several impact events.
Good quality images of a droplet spreading process have breported in the literature using short-duration flash photogra~@22,9#! for millimeter-size droplets, and flash videography~@26#!for droplet diameters of the order of 60mm to about 1 mm. Toexemplify, the study of Pasandideh-Fard et al.@9# reports a visu-alization of impact and solidification of relatively large~approx. 2mm! liquid metal tin drops on a cold substrate. Hence, the resing Weber number value of We571 does not correspond to threlatively low Weber domain (4,We,10) encountered in pi-coliter size solder droplet dispensing that is the focus ofpresent research. In the present study a flash videographynique, coupled with a digital grabbing of the images for the eof postprocessing, is developed and implemented.
2 Experimental Setup
2.1 Molten Solder Microdroplet Deposition System. Toinvestigate the dynamic process of impact and solidificationpicoliter size molten metal droplet on the surface of a semicductor device, a molten solder microdroplet jetting device wasup at ETH Zurich with technical assistance from MicroFab Tecnologies Inc.~Dallas, TX!. The method used for the generationmonodispersed picoliter-size droplets of solder at demand withpotential of use in the manufacturing of electronic componewas described in~@3#! and ~@29#!, and is summarized as follows
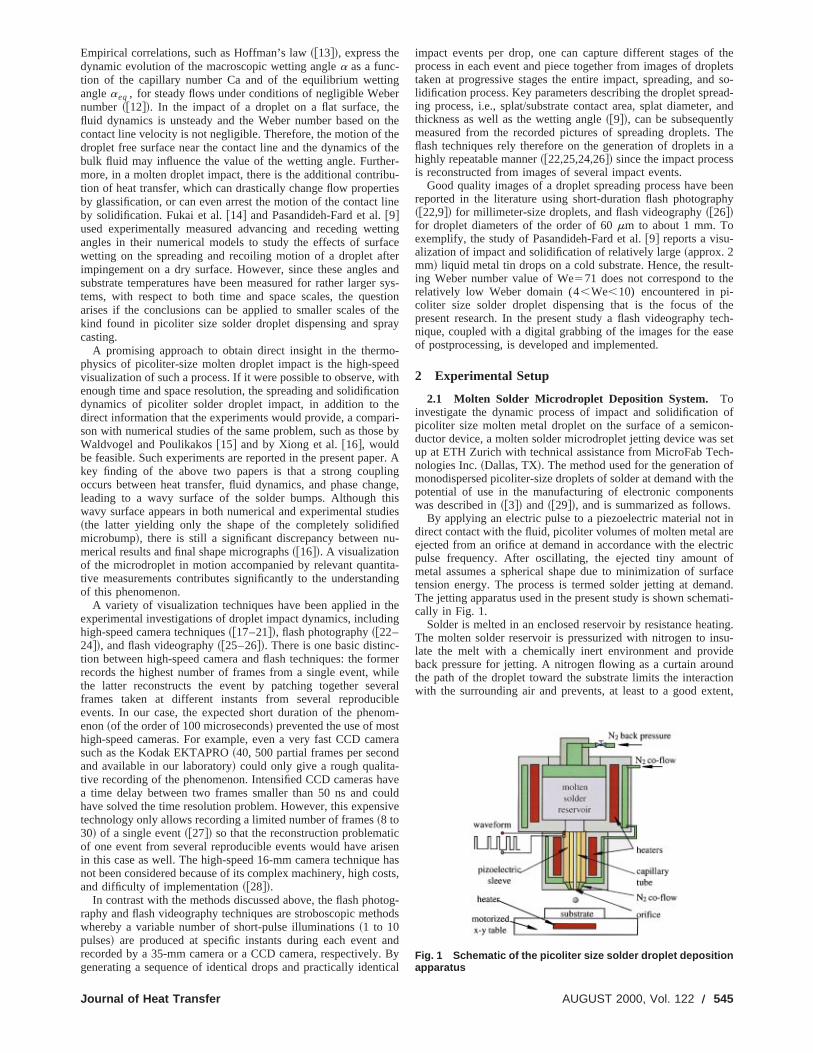
By applying an electric pulse to a piezoelectric material notdirect contact with the fluid, picoliter volumes of molten metal aejected from an orifice at demand in accordance with the elecpulse frequency. After oscillating, the ejected tiny amountmetal assumes a spherical shape due to minimization of surtension energy. The process is termed solder jetting at demThe jetting apparatus used in the present study is shown schecally in Fig. 1.
Solder is melted in an enclosed reservoir by resistance heaThe molten solder reservoir is pressurized with nitrogen to inlate the melt with a chemically inert environment and proviback pressure for jetting. A nitrogen flowing as a curtain arouthe path of the droplet toward the substrate limits the interacwith the surrounding air and prevents, at least to a good ext
Fig. 1 Schematic of the picoliter size solder droplet depositionapparatus
AUGUST 2000, Vol. 122 Õ 545
a
t
l
xo-
y
p
fa
srp
t
u
n
e
y
nm.
u
rd
ofonds
sivedture
esre-lder
droplet oxidation. Molten solder temperatures in the reservoirthe capillary tube are both monitored by thermocouples and ctrolled through the heaters. The waveform of the drive pulsesolder jetting is electronically generated and digitally controlleBy varying the waveform, the diameter and the velocity of ejecsolder droplets can be altered in the ranges of 50–100mm and1–2.5 m/s, respectively. The alloy used in this study is a eutetin lead solder~63 percent Sn-37 percent Pb! with 99.99 percentpurity, specially developed for solder jetting by Witmetaal B. VHolland. Delay time between droplet ejection can be changedvarying the waveform driver frequency for droplet generatioHowever, the repeatability of droplet diameter and ejection veity is greatly improved when the frequency of droplet ejectionmaintained constant during the experiment. In the present studdroplet generation frequency of 12 Hz was used.
After ejection from the orifice, a solder droplet travels appromately 1 mm and impacts the substrate mounted horizontallymotorized x-y precision stage~Photon Control PTS 1000, England!. The substrate in the present study is a semiconductorfer ~EM Marin, Switzerland! cut to a die size of approximatel10350 mm. The wafer consists of the following layers from toto bottom: 0.1-mm-thick Au, 0.3-mm Ti90W alloy, 1-mm siliconnitride ~conductivityl52.33(120.11) Wm21K21, heat capacityrcp52.62(120.22)* 1026 Jm23 K21! ~@30#! and 675-mmP-silicon. The substrate wafer slide is mounted on a heated coplate with a thin layer of thermal interface paste~HTC Electro-lube, England! between the wafer and the copper plate, withl50.84 Wm21 K21. The wafer top (T2,0) and bottom (T3,0) surfaceinitial temperatures are measured with two K-type thermocoup~Omega 304 SS9!, the former being epoxied on the wafer with1-mm-size island of conductive epoxy~AV138M/HV998 Novar-tis, Switzerland! with l50.6 Wm21 K21. The bead diameter othe thermocouples is 250mm. The copper plate temperature wPID-controlled to varyT2,0 between 48°C and 135°C. Since thwafer slides used in printing have to be frequently replaced,temperature measurements are carried out on another waferpermanently deposited on the copper plate, and moved undeprinthead at the same conditions as the wafer slide where droimpact. Both radiation from the metallic parts of the printing dvice and convection from the co-flow increased significantlywafer temperatures. Thex-y stage motion~2 mm/s! is so slow thatthe thermocouples reach a steady-state value before passingthe jet orifice and maintain it after passing by the jet orificTherefore the transient temperature effect is considered tonegligible.
2.2 Visualization of Solder Droplet Deposition Using FlashVideography. As described in the Introduction, the techniquused for the visualization of droplet impact and solidification isflash videography technique~@26#! where only one image is takeat one instant during the impact and solidification process for edrop studied. The imaging system used to record the droplet dsition process is shown schematically in Fig. 2.
Backlighting for the first series of experiments is provided bXenon flash light unit~Hamamatsu L4634!. The flash energy is0.15 J/flash and the duration of each burst of flash is 1ms withless than 200 ns jittering. The time resolution of the sequerecording is set to 5ms. A Fresnel lens is used to provide uniforand intensified~focused! backlighting field for the microscopeThe droplet images are magnified using a microscope objec~Microtech Zoom 70, USA! with 293optical magnification on theCCD matrix plane, which provides a space resolution of 1.2mmin the object plane. The conditions for the wetting angle measment are slightly different from the first experiments in this papThe optical magnification is increased up to 36 times. In ordecapture the fast kinematics during the beginning of the sprea~with contact line velocities of the order of 2 to 4 m/s!, a fasterXenon flash light unit~FX-HSPS, Wedel, Germany! is employed.It provides a shorter flash duration of 150 ns with less than 60
546 Õ Vol. 122, AUGUST 2000
ndon-ford.ed
ctic
.,by
n.oc-isy, a
i-n a
wa-
p
per
lesa
sethelide,thelets
e-he
ndere.be
ea
achpo-
a
ce
tive
re-er.toing
ns
jittering, with a flash energy of 0.1 J/burst. The time resolutionthe sequence recording is also increased up to 300 nanosecduring the first stage of the spreading.
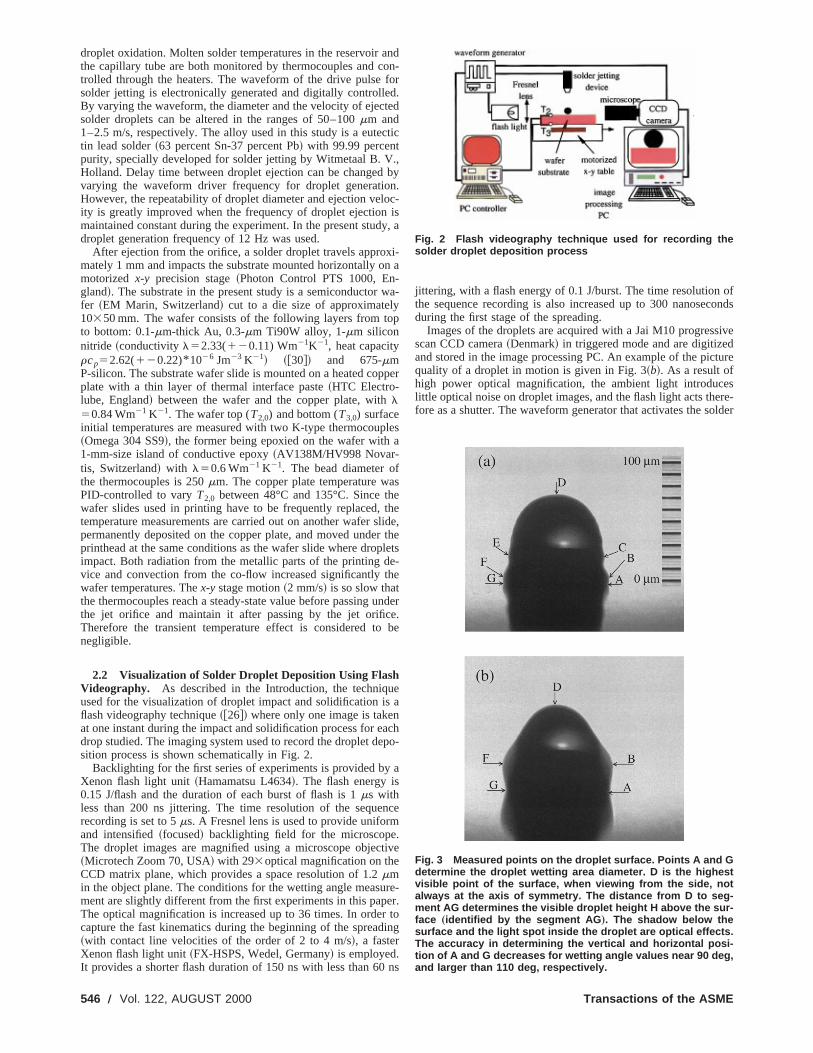
Images of the droplets are acquired with a Jai M10 progresscan CCD camera~Denmark! in triggered mode and are digitizeand stored in the image processing PC. An example of the picquality of a droplet in motion is given in Fig. 3~b!. As a result ofhigh power optical magnification, the ambient light introduclittle optical noise on droplet images, and the flash light acts thefore as a shutter. The waveform generator that activates the so
Fig. 2 Flash videography technique used for recording thesolder droplet deposition process
Fig. 3 Measured points on the droplet surface. Points A and Gdetermine the droplet wetting area diameter. D is the highestvisible point of the surface, when viewing from the side, notalways at the axis of symmetry. The distance from D to seg-ment AG determines the visible droplet height H above the sur-face „identified by the segment AG …. The shadow below thesurface and the light spot inside the droplet are optical effects.The accuracy in determining the vertical and horizontal posi-tion of A and G decreases for wetting angle values near 90 deg,and larger than 110 deg, respectively.
Transactions of the ASME

,g
i
o
lr
im
e
rt
r
ue
n
e
at
.
te
a
tol-
d inase
t ofted
e by
achn thisvo--
nr aund
i-
aseareatofby
es
jetting device sends a signal with a preset delay to trigger the fllight when a solder droplet hits the substrate. To record the pgressive stages of solder droplet spreading and solidificationdelay time between droplet ejection and a burst of back lightinincreased between successive images.
In order to provide a free impact surface for each impingdroplet, the motorizedx-y stage is maintained at a constant linespeed of 2 mm/s in the focal plane of the microscope durexperimental runs. This translation velocity of 2 mm/s is abthree orders of magnitude smaller than the impact velocity ofm/s. In a reference frame attached to the translation stage,motion corresponds to a deviation from the vertical directionthe impact smaller than 0.1 degrees, thus negligible.
2.3 Image Analysis and Discussion of the ExperimentaUncertainties. Image analysis is carried out using an image pcessing software~Optimas 6.2, Media Cybernetics, USA! that al-lows the measurement of droplet area and the motion analysselected points for a sequence of images. Figure 3 shows asurement example of droplet wetting area diameter~distance be-tween A and G! and droplet height~distance from point D tosegment AG!. It should be emphasized that such measuremeinvolve uncertainties, due to the human identification of the msured points. In the case of clearly defined points such as in3~b!, 20 measurements of the points on the same image yiestandard deviation~in percentage of the initial droplet diamete!of 0.06, 0.54, 0.91, 0.44 and 0.16 percent for the vertical posiof D, the distance between D and segment AG, and the positiothe single points A and G, as well as the wetting area diamerespectively. It is worth noting that a wetting anglea larger than110 deg can cause significant optical blurring~as in Fig. 4, 30ms!,and therefore increase the error for the wetting area diamete
The choice of a flash videography technique that consistsbuilding an impact sequence from a series of single pictures, eof them taken from a different droplet requires a highly reprodible process. There are several factors that can influence thproducibility of droplet release and solidification. We examinewith the setup used for the first series of experiments, two possperturbation sources, i.e., the stability in the drop position avelocity as well as the importance of the wafer heating due toheat released by solidification of the previous drop.
The positions of the top, bottom, left, and right extreme poiof 99 solder droplets in the same conditions as in the experimhave been measured with a constant delay between ejectionflash. The standard deviation in the horizontal position of thetreme right and left position is, respectively, 1.32 percent and 1percent of the diameter~80 mm!, and the standard deviation in thvertical position for the top and bottom points is 2.2 perce~61.76 mm! and 1.72 percent, respectively. The maximum stdard deviation in the vertical position corresponds to a jitter indroplet ejection of61.17 ms. Since this error is markedly largethan the error due to the human identification of the measupoints, the major cause of uncertainties in the measuremendue to the needed repeatability of the visualization technique
The magnitude of wafer slide heating due to the heat releaby solidification of the previous drop has been evaluated inways. First, we estimated the final increase in the wafer tempture after the impact of a series of droplets that corresponds toexperimental conditions. Then, we estimated if the transient loheat release of a previous drop would affect the initial conditiofor the actual drop. The final temperature increase was estimas follows. Assuming that the heat released by the drops increthe wafer temperature uniformly, we express the temperaturecreaseDT of a typical wafer slide~10 mm by 50 mm surface!:
DT5nEQ
(i
r iVicpi
(1)
Journal of Heat Transfer
ashro-theis
ngaringut
1.5thisof
o-
s ofea-
ntsa-
Fig.ld a
ionn ofter,
.of
achc-re-
d,iblendthe
tsentandx-
.46entn-herredts is
sedwora-ourcalnsted
asesin-
wheren, EQ , r, V, andcp are the number of droplets, the heareleased by droplet solidification and subcooling, the density, vume, and heat capacity of each layeri of the wafer. In the casewhere 300 droplets~i.e., 3 sequences of 100 drops! at 210°Cimpact a wafer slide of the same composition as the one usethe experiments, we maintain that the wafer temperature increDT is less than 0.1K, and is thus negligible. The transient effecthe previous droplet impact on the actual drop can be calculaaccurately numerically, but we obtained an acceptable estimatassuming that the entireEQ is released at timet50 in a half-sphere of an infinite radius. In other words, we consider that edroplet acts as an instantaneous heat source on the surface. Icase, an analytical relation exists for the temporal and local elution of the temperature~@31#!. Considering a pitch distance between droplets of 166 micrometers~corresponding to a printingfrequency of 12 Hz!, the maximum transient temperature variatiodue to heat released by the previously impacting droplet fodistance of 166 micrometers from the heating source, was foto be 0.03 K in a gold hemisphere and 0.13 K in a silicon hemsphere, and is thus negligible.
A further difference between the experiments and the ideal cof a spherical droplet impinging on a substrate is that therestill small residual shape oscillations from the ejection processthe instant of impact. Hence, the droplet shape at the timeimpact is not absolutely spherical. This error can be estimatedobserving the maximum error in nonsphericity on the pictur
Fig. 4 Spreading, oscillations, and freezing of a solder dropleton a flat substrate. Initial conditions: v 0Ä1.54 mÕs, d 0Ä80 mm, T1,0Ä210°C, T2,0Ä48°C.
AUGUST 2000, Vol. 122 Õ 547
ofi
t
efl
rethee 5
,en ino-
and
n ofan
ibedrfaceas
.1ldsere
or-
tact
on ofiselsotant
s of-plet
ver
ndwith
right before impact: At the distance used for printing, the diameoscillation amplitude was65 percent of the droplet diameter. Aseries of measurements showed that the phase lag betweeoscillations of the horizontal diameter and the vertical diameequalsp, thus this oscillation should not influence the measument of droplet size, based on the visible area. Accordingly,measurement of droplet velocity before impact was based onmotion of the two points at the extreme left and right of thdroplet. Their height is a bit more difficult to determine than, fexample, the height of the bottom point of the droplet, but it donot oscillate in the vertical direction.
3 Results
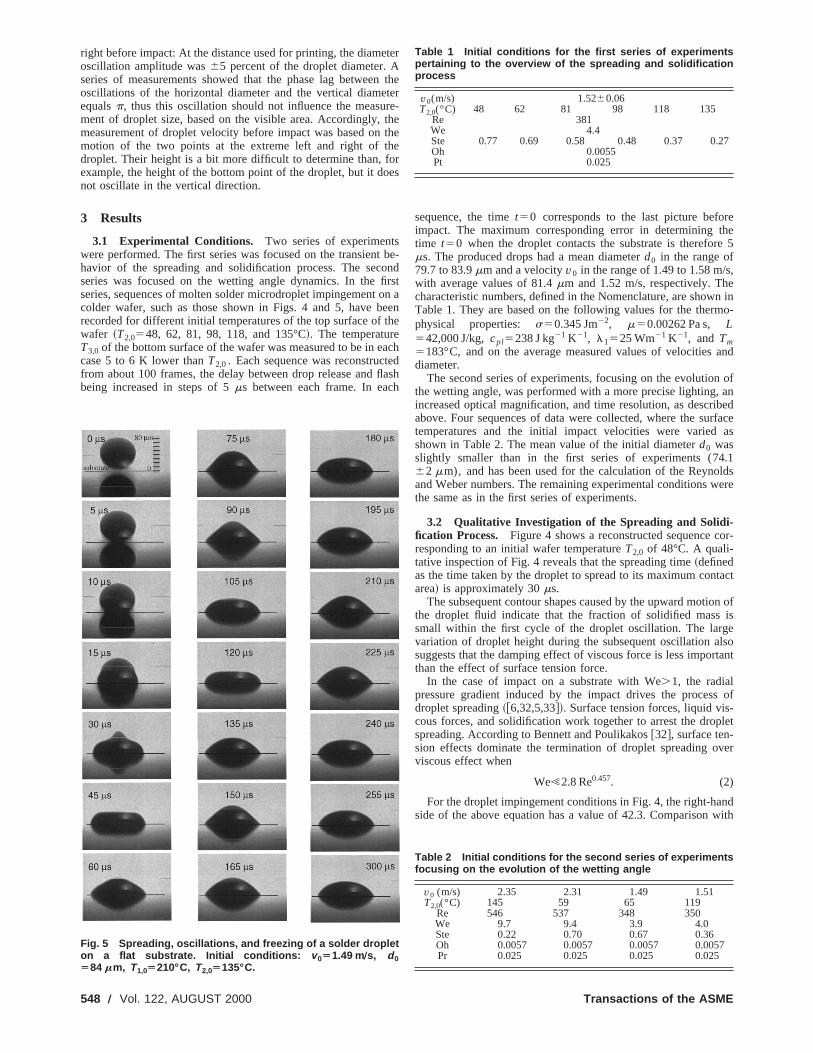
3.1 Experimental Conditions. Two series of experimentswere performed. The first series was focused on the transienthavior of the spreading and solidification process. The secseries was focused on the wetting angle dynamics. In theseries, sequences of molten solder microdroplet impingementcolder wafer, such as those shown in Figs. 4 and 5, have brecorded for different initial temperatures of the top surface ofwafer ~T2,0548, 62, 81, 98, 118, and 135°C!. The temperatureT3,0 of the bottom surface of the wafer was measured to be in ecase 5 to 6 K lower thanT2,0. Each sequence was reconstructfrom about 100 frames, the delay between drop release andbeing increased in steps of 5ms between each frame. In eac
Fig. 5 Spreading, oscillations, and freezing of a solder dropleton a flat substrate. Initial conditions: v 0Ä1.49 mÕs, d 0Ä84 mm, T1,0Ä210°C, T2,0Ä135°C.
548 Õ Vol. 122, AUGUST 2000
ter
n theterre-thethee
ores
be-ndrst
on aeenhe
achdash
h
sequence, the timet50 corresponds to the last picture befoimpact. The maximum corresponding error in determiningtime t50 when the droplet contacts the substrate is thereforms. The produced drops had a mean diameterd0 in the range of79.7 to 83.9mm and a velocityv0 in the range of 1.49 to 1.58 m/swith average values of 81.4mm and 1.52 m/s, respectively. Thcharacteristic numbers, defined in the Nomenclature, are showTable 1. They are based on the following values for the thermphysical properties: s50.345 Jm22, m50.00262 Pa s, L542,000 J/kg,cpl5238 J kg21 K21, l1525 Wm21 K21, and Tm5183°C, and on the average measured values of velocitiesdiameter.
The second series of experiments, focusing on the evolutiothe wetting angle, was performed with a more precise lighting,increased optical magnification, and time resolution, as descrabove. Four sequences of data were collected, where the sutemperatures and the initial impact velocities were variedshown in Table 2. The mean value of the initial diameterd0 wasslightly smaller than in the first series of experiments (7462 mm), and has been used for the calculation of the Reynoand Weber numbers. The remaining experimental conditions wthe same as in the first series of experiments.
3.2 Qualitative Investigation of the Spreading and Solidi-fication Process. Figure 4 shows a reconstructed sequence cresponding to an initial wafer temperatureT2,0 of 48°C. A quali-tative inspection of Fig. 4 reveals that the spreading time~definedas the time taken by the droplet to spread to its maximum conarea! is approximately 30ms.
The subsequent contour shapes caused by the upward motithe droplet fluid indicate that the fraction of solidified masssmall within the first cycle of the droplet oscillation. The largvariation of droplet height during the subsequent oscillation asuggests that the damping effect of viscous force is less importhan the effect of surface tension force.
In the case of impact on a substrate with We.1, the radialpressure gradient induced by the impact drives the procesdroplet spreading~@6,32,5,33#!. Surface tension forces, liquid viscous forces, and solidification work together to arrest the drospreading. According to Bennett and Poulikakos@32#, surface ten-sion effects dominate the termination of droplet spreading oviscous effect when
We!2.8 Re0.457. (2)
For the droplet impingement conditions in Fig. 4, the right-haside of the above equation has a value of 42.3. Comparison
Table 1 Initial conditions for the first series of experimentspertaining to the overview of the spreading and solidificationprocess
v0(m/s) 1.5260.06T2,0(°C) 48 62 81 98 118 135
Re 381We 4.4Ste 0.77 0.69 0.58 0.48 0.37 0.27Oh 0.0055Pt 0.025
Table 2 Initial conditions for the second series of experimentsfocusing on the evolution of the wetting angle
v0 (m/s) 2.35 2.31 1.49 1.51T2,0(°C) 145 59 65 119
Re 546 537 348 350We 9.7 9.4 3.9 4.0Ste 0.22 0.70 0.67 0.36Oh 0.0057 0.0057 0.0057 0.0057Pr 0.025 0.025 0.025 0.025
Transactions of the ASME
Journal o
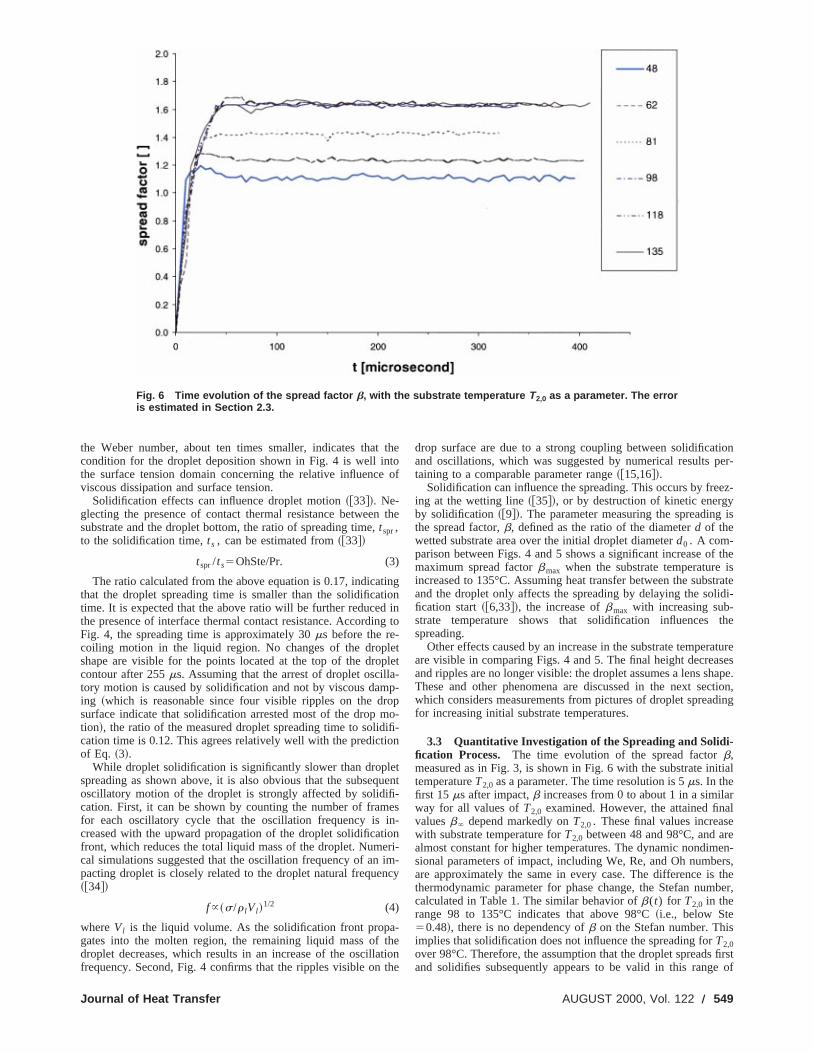
Fig. 6 Time evolution of the spread factor b, with the substrate temperature T2,0 as a parameter. The erroris estimated in Section 2.3.
t
t
lpa
o
e
fi
i
n
t
tionper-
ez-
is
f theistrate
lidi-
the
aturesesape.
ction,ding
itial
raleeen-
ers,theber,
firstof
the Weber number, about ten times smaller, indicates thatcondition for the droplet deposition shown in Fig. 4 is well inthe surface tension domain concerning the relative influenceviscous dissipation and surface tension.
Solidification effects can influence droplet motion~@33#!. Ne-glecting the presence of contact thermal resistance betweensubstrate and the droplet bottom, the ratio of spreading time,tspr,to the solidification time,ts , can be estimated from~@33#!
tspr/ts5OhSte/Pr. (3)
The ratio calculated from the above equation is 0.17, indicathat the droplet spreading time is smaller than the solidificattime. It is expected that the above ratio will be further reducedthe presence of interface thermal contact resistance. AccordinFig. 4, the spreading time is approximately 30ms before the re-coiling motion in the liquid region. No changes of the dropshape are visible for the points located at the top of the drocontour after 255ms. Assuming that the arrest of droplet oscilltory motion is caused by solidification and not by viscous daming ~which is reasonable since four visible ripples on the drsurface indicate that solidification arrested most of the drop mtion!, the ratio of the measured droplet spreading time to solidcation time is 0.12. This agrees relatively well with the predictiof Eq. ~3!.
While droplet solidification is significantly slower than droplspreading as shown above, it is also obvious that the subseqoscillatory motion of the droplet is strongly affected by solidication. First, it can be shown by counting the number of framfor each oscillatory cycle that the oscillation frequency iscreased with the upward propagation of the droplet solidificatfront, which reduces the total liquid mass of the droplet. Numecal simulations suggested that the oscillation frequency of anpacting droplet is closely related to the droplet natural freque~@34#!
f }~s/r lVl !1/2 (4)
whereVl is the liquid volume. As the solidification front propagates into the molten region, the remaining liquid mass ofdroplet decreases, which results in an increase of the oscillafrequency. Second, Fig. 4 confirms that the ripples visible on
f Heat Transfer
theoof
the
ingionin
g to
etlet-p-
opo-
ifi-n
tuent-esn-ionri-im-cy
-hetionthe
drop surface are due to a strong coupling between solidificaand oscillations, which was suggested by numerical resultstaining to a comparable parameter range~@15,16#!.
Solidification can influence the spreading. This occurs by freing at the wetting line~@35#!, or by destruction of kinetic energyby solidification~@9#!. The parameter measuring the spreadingthe spread factor,b, defined as the ratio of the diameterd of thewetted substrate area over the initial droplet diameterd0 . A com-parison between Figs. 4 and 5 shows a significant increase omaximum spread factorbmax when the substrate temperatureincreased to 135°C. Assuming heat transfer between the subsand the droplet only affects the spreading by delaying the sofication start~@6,33#!, the increase ofbmax with increasing sub-strate temperature shows that solidification influencesspreading.
Other effects caused by an increase in the substrate temperare visible in comparing Figs. 4 and 5. The final height decreaand ripples are no longer visible: the droplet assumes a lens shThese and other phenomena are discussed in the next sewhich considers measurements from pictures of droplet spreafor increasing initial substrate temperatures.
3.3 Quantitative Investigation of the Spreading and Solidi-fication Process. The time evolution of the spread factorb,measured as in Fig. 3, is shown in Fig. 6 with the substrate intemperatureT2,0 as a parameter. The time resolution is 5ms. In thefirst 15ms after impact,b increases from 0 to about 1 in a similaway for all values ofT2,0 examined. However, the attained finvaluesb` depend markedly onT2,0. These final values increaswith substrate temperature forT2,0 between 48 and 98°C, and aralmost constant for higher temperatures. The dynamic nondimsional parameters of impact, including We, Re, and Oh numbare approximately the same in every case. The difference isthermodynamic parameter for phase change, the Stefan numcalculated in Table 1. The similar behavior ofb(t) for T2,0 in therange 98 to 135°C indicates that above 98°C~i.e., below Ste50.48!, there is no dependency ofb on the Stefan number. Thisimplies that solidification does not influence the spreading forT2,0over 98°C. Therefore, the assumption that the droplet spreadsand solidifies subsequently appears to be valid in this range
AUGUST 2000, Vol. 122 Õ 549
550 Õ Vo
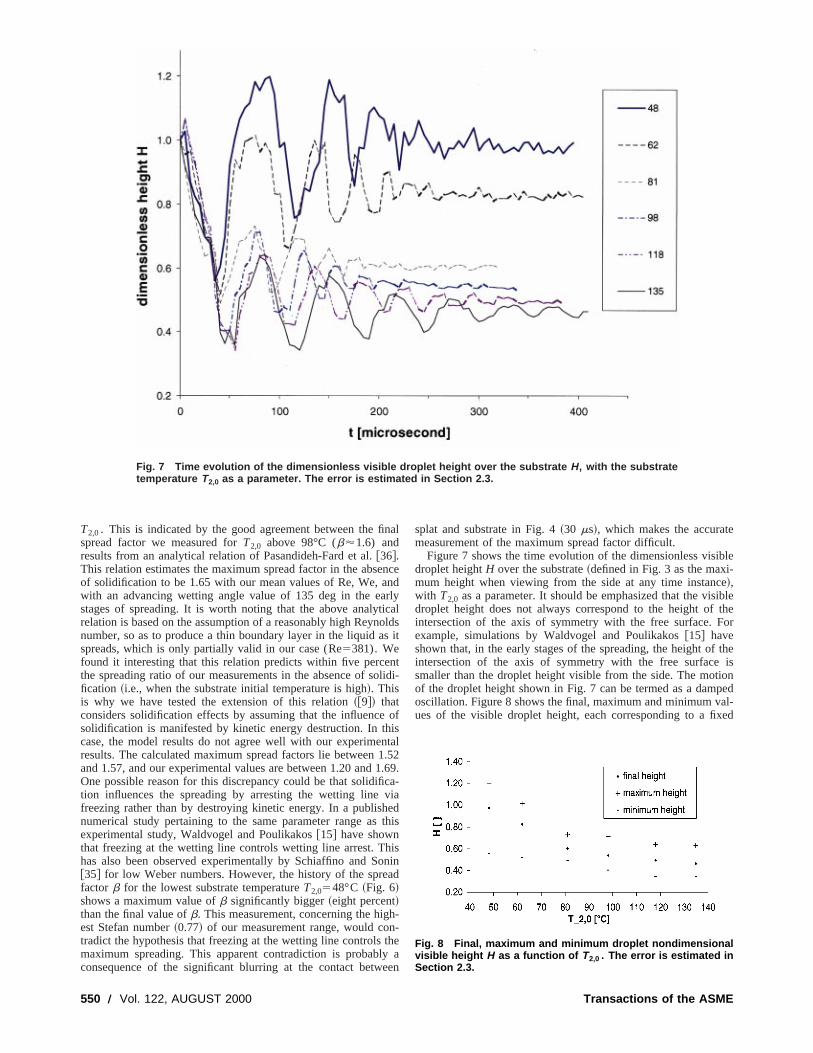
Fig. 7 Time evolution of the dimensionless visible droplet height over the substrate H, with the substratetemperature T2,0 as a parameter. The error is estimated in Section 2.3.
e
i
hn11
ho
n
y
e
ble-eibletheor
theis
ionpedal-xed
T2,0. This is indicated by the good agreement between the fispread factor we measured forT2,0 above 98°C (b'1.6) andresults from an analytical relation of Pasandideh-Fard et al.@36#.This relation estimates the maximum spread factor in the absof solidification to be 1.65 with our mean values of Re, We, awith an advancing wetting angle value of 135 deg in the eastages of spreading. It is worth noting that the above analytrelation is based on the assumption of a reasonably high Reynnumber, so as to produce a thin boundary layer in the liquid aspreads, which is only partially valid in our case (Re5381). Wefound it interesting that this relation predicts within five percethe spreading ratio of our measurements in the absence of sofication ~i.e., when the substrate initial temperature is high!. Thisis why we have tested the extension of this relation~@9#! thatconsiders solidification effects by assuming that the influencesolidification is manifested by kinetic energy destruction. In tcase, the model results do not agree well with our experimeresults. The calculated maximum spread factors lie betweenand 1.57, and our experimental values are between 1.20 andOne possible reason for this discrepancy could be that solidifition influences the spreading by arresting the wetting linefreezing rather than by destroying kinetic energy. In a publishnumerical study pertaining to the same parameter range asexperimental study, Waldvogel and Poulikakos@15# have shownthat freezing at the wetting line controls wetting line arrest. Thas also been observed experimentally by Schiaffino and S@35# for low Weber numbers. However, the history of the sprefactor b for the lowest substrate temperatureT2,0548°C ~Fig. 6!shows a maximum value ofb significantly bigger~eight percent!than the final value ofb. This measurement, concerning the higest Stefan number~0.77! of our measurement range, would cotradict the hypothesis that freezing at the wetting line controlsmaximum spreading. This apparent contradiction is probablconsequence of the significant blurring at the contact betw
l. 122, AUGUST 2000
nal
ncendrlycaloldss it
ntlidi-
ofistal.52.69.ca-viaedthis
isnin
ad
h--
thea
een
splat and substrate in Fig. 4~30 ms!, which makes the accuratmeasurement of the maximum spread factor difficult.
Figure 7 shows the time evolution of the dimensionless visidroplet heightH over the substrate~defined in Fig. 3 as the maximum height when viewing from the side at any time instanc!,with T2,0 as a parameter. It should be emphasized that the visdroplet height does not always correspond to the height ofintersection of the axis of symmetry with the free surface. Fexample, simulations by Waldvogel and Poulikakos@15# haveshown that, in the early stages of the spreading, the height ofintersection of the axis of symmetry with the free surfacesmaller than the droplet height visible from the side. The motof the droplet height shown in Fig. 7 can be termed as a damoscillation. Figure 8 shows the final, maximum and minimum vues of the visible droplet height, each corresponding to a fi
Fig. 8 Final, maximum and minimum droplet nondimensionalvisible height H as a function of T2,0 . The error is estimated inSection 2.3.
Transactions of the ASME
u
9
c
y
.
inthebeen
urved
am-atebytsent
olu--afer
forure-al
di-ex-po-taltly
hisd ise
substrate temperature. The maximum visible height is measfrom the beginning of first recoiling, and the final visible heightmeasured by averaging the height of the ten last frames of evisualization series. The final maximum and minimum valuesthe visible droplet height decrease monotonically withT2,0. Attemperatures below 98°C, the monotonical decrease of fiheight with substrate temperature can be correlated with thecrease ofbmax with substrate temperature~Fig. 6!.
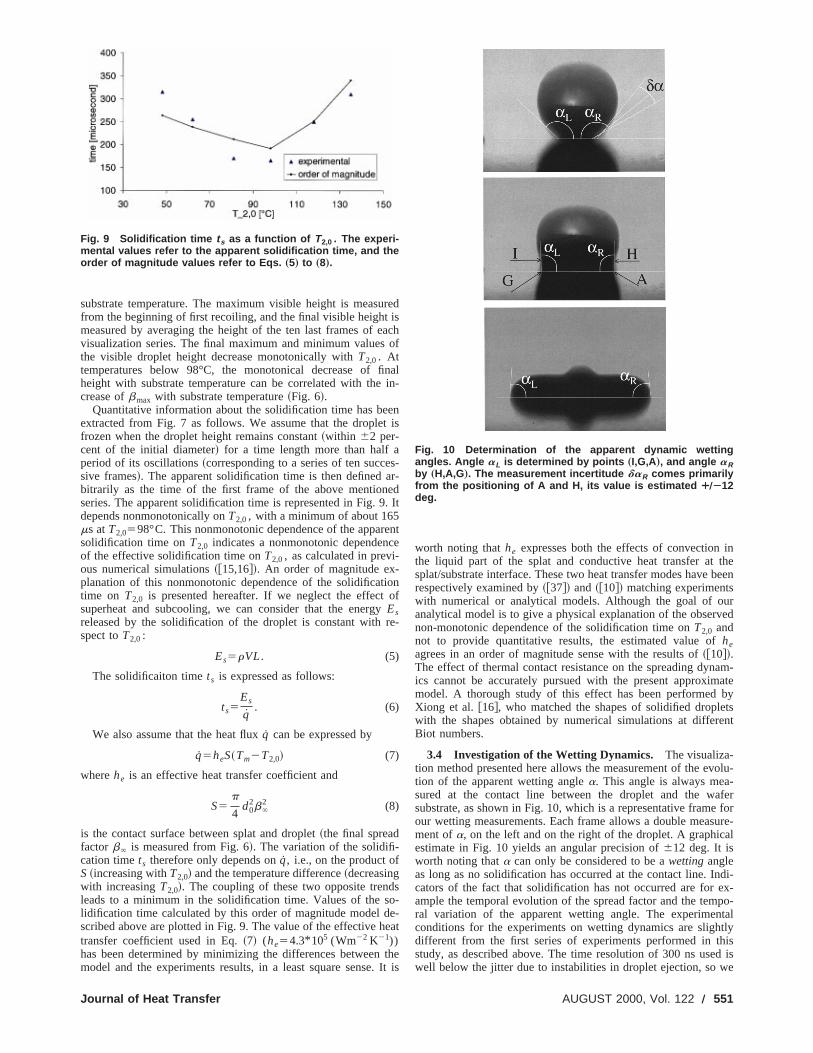
Quantitative information about the solidification time has beextracted from Fig. 7 as follows. We assume that the droplefrozen when the droplet height remains constant~within 62 per-cent of the initial diameter! for a time length more than half aperiod of its oscillations~corresponding to a series of ten succesive frames!. The apparent solidification time is then defined abitrarily as the time of the first frame of the above mentionseries. The apparent solidification time is represented in Fig.depends nonmonotonically onT2,0, with a minimum of about 165ms atT2,0598°C. This nonmonotonic dependence of the apparsolidification time onT2,0 indicates a nonmonotonic dependenof the effective solidification time onT2,0, as calculated in previ-ous numerical simulations~@15,16#!. An order of magnitude ex-planation of this nonmonotonic dependence of the solidificattime on T2,0 is presented hereafter. If we neglect the effectsuperheat and subcooling, we can consider that the energEsreleased by the solidification of the droplet is constant withspect toT2,0:
Es5rVL. (5)
The solidificaiton timets is expressed as follows:
ts5Es
q̇. (6)
We also assume that the heat fluxq̇ can be expressed by
q̇5heS~Tm2T2,0! (7)
wherehe is an effective heat transfer coefficient and
S5p
4d0
2b`2 (8)
is the contact surface between splat and droplet~the final spreadfactor b` is measured from Fig. 6!. The variation of the solidifi-cation timets therefore only depends onq̇, i.e., on the product ofS~increasing withT2,0! and the temperature difference~decreasingwith increasingT2,0!. The coupling of these two opposite trendleads to a minimum in the solidification time. Values of the slidification time calculated by this order of magnitude model dscribed above are plotted in Fig. 9. The value of the effective htransfer coefficient used in Eq.~7! (he54.3* 105 (Wm22 K21))has been determined by minimizing the differences betweenmodel and the experiments results, in a least square sense
Fig. 9 Solidification time t s as a function of T2,0 . The experi-mental values refer to the apparent solidification time, and theorder of magnitude values refer to Eqs. „5… to „8….
Journal of Heat Transfer
redisachof
nalin-
ent is
s-r-
ed. It
ente
ionof
re-
so-e-eat
theIt is
worth noting thathe expresses both the effects of convectionthe liquid part of the splat and conductive heat transfer atsplat/substrate interface. These two heat transfer modes haverespectively examined by~@37#! and~@10#! matching experimentswith numerical or analytical models. Although the goal of oanalytical model is to give a physical explanation of the obsernon-monotonic dependence of the solidification time onT2,0 andnot to provide quantitative results, the estimated value ofheagrees in an order of magnitude sense with the results of~@10#!.The effect of thermal contact resistance on the spreading dynics cannot be accurately pursued with the present approximmodel. A thorough study of this effect has been performedXiong et al. @16#, who matched the shapes of solidified droplewith the shapes obtained by numerical simulations at differBiot numbers.
3.4 Investigation of the Wetting Dynamics. The visualiza-tion method presented here allows the measurement of the evtion of the apparent wetting anglea. This angle is always measured at the contact line between the droplet and the wsubstrate, as shown in Fig. 10, which is a representative frameour wetting measurements. Each frame allows a double measment ofa, on the left and on the right of the droplet. A graphicestimate in Fig. 10 yields an angular precision of612 deg. It isworth noting thata can only be considered to be awettingangleas long as no solidification has occurred at the contact line. Incators of the fact that solidification has not occurred are forample the temporal evolution of the spread factor and the temral variation of the apparent wetting angle. The experimenconditions for the experiments on wetting dynamics are slighdifferent from the first series of experiments performed in tstudy, as described above. The time resolution of 300 ns usewell below the jitter due to instabilities in droplet ejection, so w
Fig. 10 Determination of the apparent dynamic wettingangles. Angle aL is determined by points „I,G,A…, and angle aRby „H,A,G…. The measurement incertitude daR comes primarilyfrom the positioning of A and H, its value is estimated ¿ÕÀ12deg.
AUGUST 2000, Vol. 122 Õ 551
552 Õ Vol.
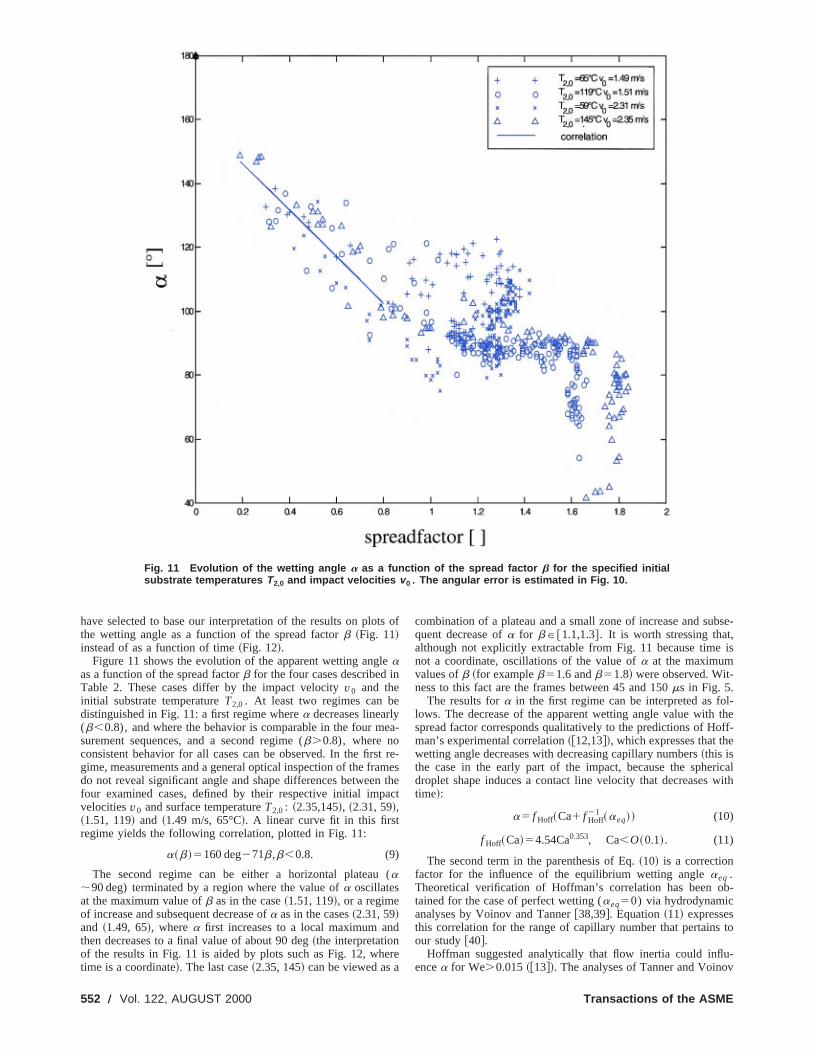
Fig. 11 Evolution of the wetting angle a as a function of the spread factor b for the specified initialsubstrate temperatures T2,0 and impact velocities v 0 . The angular error is estimated in Fig. 10.
t
en
t
bse-
is
l-the
off-e
ricalwith
b-
to
u-v
have selected to base our interpretation of the results on plothe wetting angle as a function of the spread factorb ~Fig. 11!instead of as a function of time~Fig. 12!.
Figure 11 shows the evolution of the apparent wetting anglaas a function of the spread factorb for the four cases described iTable 2. These cases differ by the impact velocityv0 and theinitial substrate temperatureT2,0. At least two regimes can bedistinguished in Fig. 11: a first regime wherea decreases linearly(b,0.8), and where the behavior is comparable in the four msurement sequences, and a second regime (b.0.8), where noconsistent behavior for all cases can be observed. In the firsgime, measurements and a general optical inspection of the frado not reveal significant angle and shape differences betweenfour examined cases, defined by their respective initial impvelocitiesv0 and surface temperatureT2,0: ~2.35,145!, ~2.31, 59!,~1.51, 119! and ~1.49 m/s, 65°C!. A linear curve fit in this firstregime yields the following correlation, plotted in Fig. 11:
a~b!5160 deg271b,b,0.8. (9)
The second regime can be either a horizontal plateaua;90 deg) terminated by a region where the value ofa oscillatesat the maximum value ofb as in the case~1.51, 119!, or a regimeof increase and subsequent decrease ofa as in the cases~2.31, 59!and ~1.49, 65!, wherea first increases to a local maximum anthen decreases to a final value of about 90 deg~the interpretationof the results in Fig. 11 is aided by plots such as Fig. 12, whtime is a coordinate!. The last case~2.35, 145! can be viewed as a
122, AUGUST 2000
s of
ea-
re-mesthe
act
(
d
ere
combination of a plateau and a small zone of increase and suquent decrease ofa for [email protected],1.3#. It is worth stressing that,although not explicitly extractable from Fig. 11 because timenot a coordinate, oscillations of the value ofa at the maximumvalues ofb ~for exampleb51.6 andb51.8! were observed. Wit-ness to this fact are the frames between 45 and 150ms in Fig. 5.
The results fora in the first regime can be interpreted as folows. The decrease of the apparent wetting angle value withspread factor corresponds qualitatively to the predictions of Hman’s experimental correlation~@12,13#!, which expresses that thwetting angle decreases with decreasing capillary numbers~this isthe case in the early part of the impact, because the sphedroplet shape induces a contact line velocity that decreasestime!:
a5 f Hoff~Ca1 f Hoff21 ~aeq!! (10)
f Hoff~Ca!54.54Ca0.353, Ca,O~0.1!. (11)
The second term in the parenthesis of Eq.~10! is a correctionfactor for the influence of the equilibrium wetting angleaeq .Theoretical verification of Hoffman’s correlation has been otained for the case of perfect wetting (aeq50) via hydrodynamicanalyses by Voinov and Tanner@38,39#. Equation~11! expressesthis correlation for the range of capillary number that pertainsour study@40#.
Hoffman suggested analytically that flow inertia could inflencea for We.0.015~@13#!. The analyses of Tanner and Voino
Transactions of the ASME
Journal of He
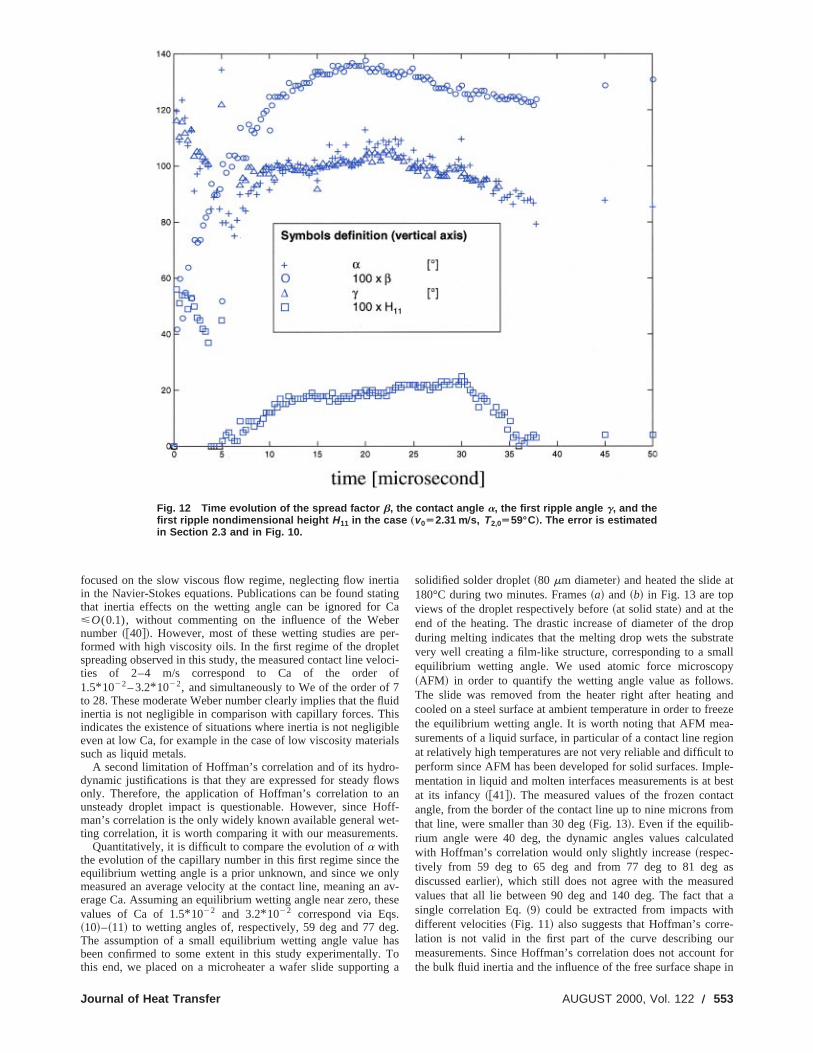
Fig. 12 Time evolution of the spread factor b, the contact angle a, the first ripple angle g, and thefirst ripple nondimensional height H11 in the case „v 0Ä2.31 mÕs, T2,0Ä59°C…. The error is estimatedin Section 2.3 and in Fig. 10.
r
ee
ii
oaoe
t
.e
t
roprateallpys.andeeze-
iont tople-bestct
om
ted
asd
at ah-
urt fore in
focused on the slow viscous flow regime, neglecting flow inein the Navier-Stokes equations. Publications can be found stathat inertia effects on the wetting angle can be ignored for<O(0.1), without commenting on the influence of the Webnumber~@40#!. However, most of these wetting studies are pformed with high viscosity oils. In the first regime of the droplspreading observed in this study, the measured contact line veties of 2–4 m/s correspond to Ca of the order1.5* 1022– 3.2* 1022, and simultaneously to We of the order ofto 28. These moderate Weber number clearly implies that the flinertia is not negligible in comparison with capillary forces. Thindicates the existence of situations where inertia is not negligeven at low Ca, for example in the case of low viscosity matersuch as liquid metals.
A second limitation of Hoffman’s correlation and of its hydrodynamic justifications is that they are expressed for steady flonly. Therefore, the application of Hoffman’s correlation tounsteady droplet impact is questionable. However, since Hman’s correlation is the only widely known available general wting correlation, it is worth comparing it with our measuremen
Quantitatively, it is difficult to compare the evolution ofa withthe evolution of the capillary number in this first regime sinceequilibrium wetting angle is a prior unknown, and since we onmeasured an average velocity at the contact line, meaning anerage Ca. Assuming an equilibrium wetting angle near zero, thvalues of Ca of 1.5* 1022 and 3.2* 1022 correspond via Eqs~10!–~11! to wetting angles of, respectively, 59 deg and 77 dThe assumption of a small equilibrium wetting angle value hbeen confirmed to some extent in this study experimentally.this end, we placed on a microheater a wafer slide supportin
at Transfer
tiatingCaerr-t
loci-of7uidisbleals
-wsnff-t-
ts.
helyav-
ese
g.asTog a
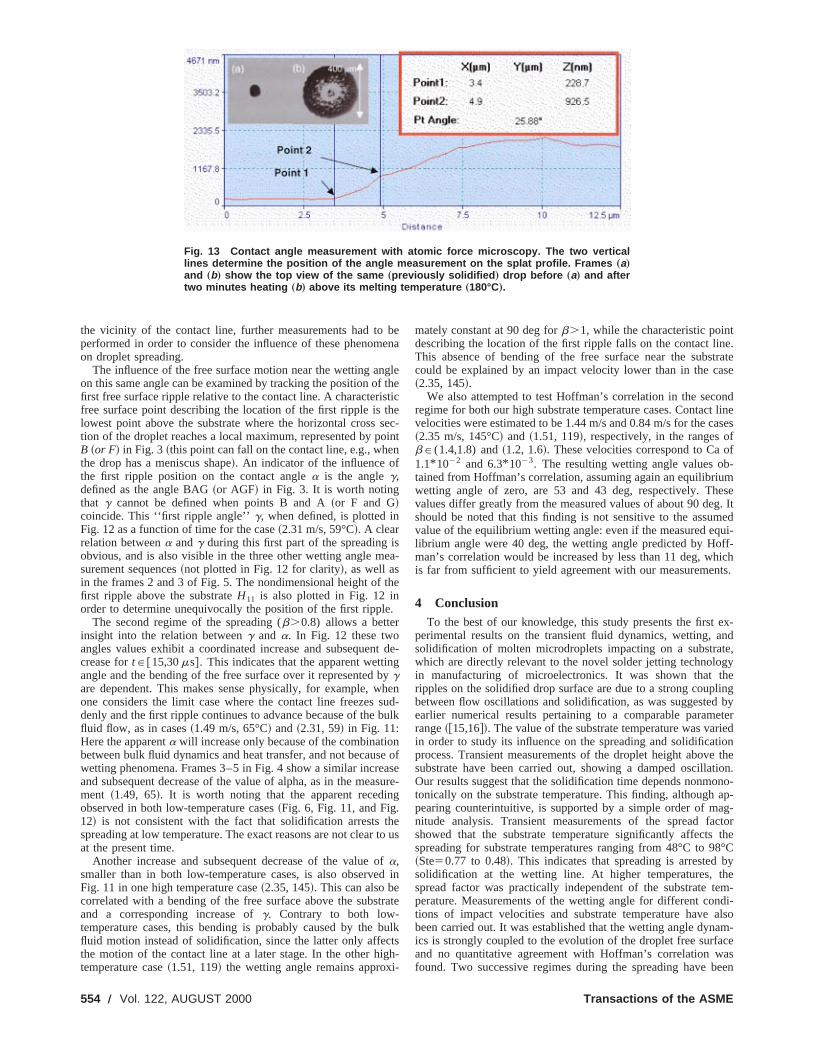
solidified solder droplet~80 mm diameter! and heated the slide a180°C during two minutes. Frames~a! and ~b! in Fig. 13 are topviews of the droplet respectively before~at solid state! and at theend of the heating. The drastic increase of diameter of the dduring melting indicates that the melting drop wets the substvery well creating a film-like structure, corresponding to a smequilibrium wetting angle. We used atomic force microsco~AFM! in order to quantify the wetting angle value as followThe slide was removed from the heater right after heatingcooled on a steel surface at ambient temperature in order to frthe equilibrium wetting angle. It is worth noting that AFM measurements of a liquid surface, in particular of a contact line regat relatively high temperatures are not very reliable and difficulperform since AFM has been developed for solid surfaces. Immentation in liquid and molten interfaces measurements is atat its infancy~@41#!. The measured values of the frozen contaangle, from the border of the contact line up to nine microns frthat line, were smaller than 30 deg~Fig. 13!. Even if the equilib-rium angle were 40 deg, the dynamic angles values calculawith Hoffman’s correlation would only slightly increase~respec-tively from 59 deg to 65 deg and from 77 deg to 81 degdiscussed earlier!, which still does not agree with the measurevalues that all lie between 90 deg and 140 deg. The fact thsingle correlation Eq.~9! could be extracted from impacts witdifferent velocities~Fig. 11! also suggests that Hoffman’s correlation is not valid in the first part of the curve describing omeasurements. Since Hoffman’s correlation does not accounthe bulk fluid inertia and the influence of the free surface shap
AUGUST 2000, Vol. 122 Õ 553
554 Õ Vol. 122, A
Fig. 13 Contact angle measurement with atomic force microscopy. The two verticallines determine the position of the angle measurement on the splat profile. Frames „a…and „b… show the top view of the same „previously solidified … drop before „a… and aftertwo minutes heating „b… above its melting temperature „180°C….
fst
s
e
b
sb
s
t
o
t
gi
te.tratese
ndt lineasesfof-meseg. It
edui-ff-ichts.
ex-ndte,gyheling
byeteriedione thetion.no-ap-ag-ctorthe
8°Cbyheem-di-
alsoam-ceaseen
the vicinity of the contact line, further measurements had toperformed in order to consider the influence of these phenomon droplet spreading.
The influence of the free surface motion near the wetting anon this same angle can be examined by tracking the position ofirst free surface ripple relative to the contact line. A characterifree surface point describing the location of the first ripple islowest point above the substrate where the horizontal crosstion of the droplet reaches a local maximum, represented by pB ~or F! in Fig. 3 ~this point can fall on the contact line, e.g., whethe drop has a meniscus shape!. An indicator of the influence ofthe first ripple position on the contact anglea is the angleg,defined as the angle BAG~or AGF! in Fig. 3. It is worth notingthat g cannot be defined when points B and A~or F and G!coincide. This ‘‘first ripple angle’’g, when defined, is plotted inFig. 12 as a function of time for the case~2.31 m/s, 59°C!. A clearrelation betweena andg during this first part of the spreading iobvious, and is also visible in the three other wetting angle msurement sequences~not plotted in Fig. 12 for clarity!, as well asin the frames 2 and 3 of Fig. 5. The nondimensional height offirst ripple above the substrateH11 is also plotted in Fig. 12 inorder to determine unequivocally the position of the first rippl
The second regime of the spreading (b.0.8) allows a betterinsight into the relation betweeng and a. In Fig. 12 these twoangles values exhibit a coordinated increase and subsequencrease fortP@15,30ms#. This indicates that the apparent wettinangle and the bending of the free surface over it representedgare dependent. This makes sense physically, for example, wone considers the limit case where the contact line freezesdenly and the first ripple continues to advance because of thefluid flow, as in cases~1.49 m/s, 65°C! and~2.31, 59! in Fig. 11:Here the apparenta will increase only because of the combinatiobetween bulk fluid dynamics and heat transfer, and not becauwetting phenomena. Frames 3–5 in Fig. 4 show a similar increand subsequent decrease of the value of alpha, as in the meament ~1.49, 65!. It is worth noting that the apparent recedinobserved in both low-temperature cases~Fig. 6, Fig. 11, and Fig.12! is not consistent with the fact that solidification arrestsspreading at low temperature. The exact reasons are not clearat the present time.
Another increase and subsequent decrease of the valuea,smaller than in both low-temperature cases, is also observeFig. 11 in one high temperature case~2.35, 145!. This can also becorrelated with a bending of the free surface above the subsand a corresponding increase ofg. Contrary to both low-temperature cases, this bending is probably caused by thefluid motion instead of solidification, since the latter only affecthe motion of the contact line at a later stage. In the other hitemperature case~1.51, 119! the wetting angle remains approx
UGUST 2000
beena
glethetichesec-ointn
ea-
the
.
t de-gyhenud-ulk
ne ofasesure-g
heto us
fd in
rate
bulktsh-
-
mately constant at 90 deg forb.1, while the characteristic poindescribing the location of the first ripple falls on the contact linThis absence of bending of the free surface near the subscould be explained by an impact velocity lower than in the ca~2.35, 145!.
We also attempted to test Hoffman’s correlation in the secoregime for both our high substrate temperature cases. Contacvelocities were estimated to be 1.44 m/s and 0.84 m/s for the c~2.35 m/s, 145°C! and ~1.51, 119!, respectively, in the ranges obP(1.4,1.8) and~1.2, 1.6!. These velocities correspond to Ca1.1* 1022 and 6.3* 1023. The resulting wetting angle values obtained from Hoffman’s correlation, assuming again an equilibriuwetting angle of zero, are 53 and 43 deg, respectively. Thvalues differ greatly from the measured values of about 90 deshould be noted that this finding is not sensitive to the assumvalue of the equilibrium wetting angle: even if the measured eqlibrium angle were 40 deg, the wetting angle predicted by Homan’s correlation would be increased by less than 11 deg, whis far from sufficient to yield agreement with our measuremen
4 ConclusionTo the best of our knowledge, this study presents the first
perimental results on the transient fluid dynamics, wetting, asolidification of molten microdroplets impacting on a substrawhich are directly relevant to the novel solder jetting technoloin manufacturing of microelectronics. It was shown that tripples on the solidified drop surface are due to a strong coupbetween flow oscillations and solidification, as was suggestedearlier numerical results pertaining to a comparable paramrange~@15,16#!. The value of the substrate temperature was varin order to study its influence on the spreading and solidificatprocess. Transient measurements of the droplet height abovsubstrate have been carried out, showing a damped oscillaOur results suggest that the solidification time depends nonmotonically on the substrate temperature. This finding, althoughpearing counterintuitive, is supported by a simple order of mnitude analysis. Transient measurements of the spread fashowed that the substrate temperature significantly affectsspreading for substrate temperatures ranging from 48°C to 9~Ste50.77 to 0.48!. This indicates that spreading is arrestedsolidification at the wetting line. At higher temperatures, tspread factor was practically independent of the substrate tperature. Measurements of the wetting angle for different contions of impact velocities and substrate temperature havebeen carried out. It was established that the wetting angle dynics is strongly coupled to the evolution of the droplet free surfaand no quantitative agreement with Hoffman’s correlation wfound. Two successive regimes during the spreading have b
Transactions of the ASME
me
l
i
er,
00,ac-Dy-
e-he-So-
alting
lat-
998,s,’’
r-e,’’
-
atic
e
is,ids.
in. J.
-E
n-p:
/
ndted
es.
ter-ted
ith
ofg
ai.,
s:ul-
s:tic
l-
nds. R.
er
,
at-J.
o-
distinguished. The influence of the initial conditions on the evlution of the apparent wetting angle was analyzed in both regim
AcknowledgmentsThis work has been partially supported by the Swiss Natio
Science Foundation~Grant No. 21-49183.96!. The authors wouldlike to acknowledge Stefan Haferl whose experience with atoforce microscopy and valuable advice were a great help for rizing the measurement in Fig. 13.
Nomenclature
Ca 5 capillary number (mvcs21)
cp 5 specific heat~J kg21 K21!d 5 diameter~m!E 5 energy~J!f 5 frequency~s21!h 5 heat transfer coefficient~Wm22K21!H 5 nondimensional height~~visible height!/d0!L 5 latent heat~J kg21!
Oh 5 Ohnesorge number~~We!1/2/Re!Pr 5 Prandtl number (mcpll l
21)q̇ 5 heat transfer rate~W!
Re 5 Reynolds number (rv0d0m21)S 5 surface~m2!
Ste 5 Stefan number (cpl(Tm2T2,0)L21)
t 5 time~s!T 5 temperature~K!V 5 volume ~m3!v 5 velocity ~m s21!
We 5 Weber number (rv02d0s21)
Greek Symbols
a 5 apparent wetting angleb 5 spread factorg 5 first ripple angleD 5 differencel 5 thermal conductivity~Wm21K21!m 5 dynamic viscosity~Pa s!r 5 density~kg m23!s 5 surface energy~Jm22!
Subscripts
0 5 initial1 5 droplet2 5 substrate top surface3 5 substrate bottom surface
11 5 first ripplec 5 contact linee 5 effective
eq 5 equilibriuml 5 liquid
m 5 melting pointmax 5 maximum
s 5 solid, solidificationspr 5 spreading` 5 final, arrested
References@1# Orme, M., 1993, ‘‘A Novel Technique of Rapid Solidification Net-Form Ma
terials Synthesis,’’ J. Mater. Eng. Perform.,2, No. 3, pp. 399–405.@2# Orme, M., Huang, C., and Courter, J., 1996, ‘‘Deposition Strategies for C
trol of Microstructures Microporosity and Surface Roughness in DropBased Solid Freeform Fabrication of Structural Materials,’’Melt Spinning,Strip Casting and Slab Casting, Matthys, E. F., and Truckner, W. G., eds., ThMinerals, Metals and Materials Society, Warrendale, PA, pp. 125–143.
@3# Hayes, D. J., and Wallace, D. B., 1998, ‘‘Solder Jet Printing: Wafer Bumpand CSP Applications,’’ Chip Scale Rev.,2, No. 4, pp. 75–80.
@4# Waldvogel, J. M., Diversiev, G., Poulikakos, D., Megaridis, C. M., AttingeD., Xiong, B., and Wallace, D. B., 1998, ‘‘Impact and Solidification o
Journal of Heat Transfer
o-es.
nal
ical-
-
on-et-
e
ng
r,f
Molten-Metal Droplets on Electronic Substrates,’’ ASME J. Heat Transf120, p. 539.
@5# Haferl, S., Zhao, Z., Giannakouros, J., Attinger, D., and Poulikakos, D., 20‘‘Transport Phenomena in the Impact of a Molten Droplet on a Surface: Mroscopic Phenomenology and Microscopic Considerations, Part I: Fluidnamics,’’ Annu. Rev. Heat Transfer, C. L. Tien, ed.
@6# Attinger, D., Haferl, S., Zhao, Z., and Poulikakos, D., 2000, ‘‘Transport Phnomena in the Impact of a Molten Droplet on a Surface: Macroscopic Pnomenology and Microscopic Considerations, Part II—Heat Transfer andlidification,’’ Annu. Rev. Heat Transfer., C. L. Tien, ed., in press.
@7# Amon, C. H., Schmaltz, K. C., Merz, R., and Prinz, F. B., 1996, ‘‘Numericand Experimental Investigation of Interface Bonding via Substrate Remelof an Impinging Molten Metal Droplet,’’ ASME J. Heat Transfer,118, pp.164–172.
@8# Bennett, T., and Poulikakos, D., 1994, ‘‘Heat Transfer Aspects of SpQuench Solidification: Modeling and Experiment,’’ J. Mater. Sci.,29, pp.2025–2039.
@9# Pasandideh-Fard, M., Bohla, R., Chandra, S., and Mostaghimi, J., 1‘‘Deposition of Tin Droplets on a Steel Plate: Simulations and ExperimentInt. J. Heat Mass Transf.,41, No. 19, pp. 2929–2945.
@10# Wang, G. X., and Matthys, E. F., 1996, ‘‘Experimental Investigation of Intefacial Thermal Conductance for Molten Metal Solidification on a SubstratASME J. Heat Transfer,118, pp. 157–163.
@11# Blake, T. D., and Haynes, J. M., 1969, ‘‘Kinetics of Liquid/Liquid Displacement,’’ J. Colloid Interface Sci.,30, pp. 421–423.
@12# Dussan, E. B., 1979, ‘‘On the Spreading of Liquids on Solid Surfaces: Stand Dynamic Contact Lines,’’ Annu. Rev. Fluid Mech.,11, pp. 371–400.
@13# Hoffman, R. L., 1975, ‘‘A Study of the Advancing Interface, I—InterfacShape in Liquid-Gas Systems,’’ J. Colloid Interface Sci.,50, pp. 228–241.
@14# Fukai, J., Shiba, Y., Yamamoto, T., Miyatake, O., Poulikakos, D., MegaridC. M., and Zhao, Z., 1995, ‘‘Wetting Effects on the Spreading of a LiquDroplet Colliding With a Flat Surface: Experimental and Modeling,’’ PhyFluids,7, No. 2, pp. 236–247.
@15# Waldvogel, J. M., and Poulikakos, D., 1997, ‘‘Solidification PhenomenaPicoliter Size Solder Droplet Deposition on a Composite Substrate,’’ IntHeat Mass Transf.,40, No. 2, pp. 295–309.
@16# Xiong, B., Magaridis, C. M., Poulikakos, D., and Hoang, H., 1998, ‘‘An Investigation of Key Factors Affecting Solder Microdroplet Deposition,’’ ASMJ. Heat Transfer,120, pp. 259–270.
@17# Inada, S., Miyasaka, Y., Mishida, K., and Chandratilleke, G. R., 1983, ‘‘Trasient Temperature Variation of a Hot Wall due to an Impinging Water DroEffect of Subcooling of the Water Drop,’’Proceedings of the Joint ASMEJSME Thermal Engineering Conference, Vol. 1, ASME, New York, pp. 173–182.
@18# Pederson, C. O., 1970, ‘‘An Experimental Study of the Dynamic Behavior aHeat Transfer Characteristics of Water Droplets Impinging Upon a HeaSurface,’’ Int. J. Heat Mass Transf.,13, pp. 369–381.
@19# Savic, P., and Boult, G. T., 1955, ‘‘The Fluid Flow Associated With thImpact of Liquid Drops With Solid Surfaces,’’ Report No. MT-26, Nat. ReCouncil Canada.
@20# Toda, S., 1974, ‘‘A Study of Mist Cooling’’~2nd Report: Theory of MistCooling and Its Fundamental Experiments!, Heat Transfer Japan. Res.,3, No.1, pp. 1–44.
@21# Ueda, T., Enomoto, T., and Kanetsuki, M., 1979, ‘‘Heat Transfer Characistics and Dynamic Behavior of Saturated Droplets Impinging on a HeaVertical Surface,’’ Bull. JSME,22, No. 167, pp. 724–732.
@22# Chandra, S., and Avedisian, C. T., 1991, ‘‘On the Collision of a Droplet Wa Solid Surface,’’ Proc. R. Soc. London, Ser. A,432, pp. 13–41.
@23# Stow, C. D., and Hadfield, M. G., 1981, ‘‘An Experimental InvestigationFluid Flow Resulting From the Impact of a Water Drop With an UnyieldinDry Surface,’’ Proc. R. Soc. London, Ser. A,373, pp. 419–441.
@24# Wachters, L. H., and Westerling, N. A. J., 1966, ‘‘The Heat Transfer FromHot Wall to Impinging Water Drop in the Spherical State,’’ Chem. Eng. Sc21, pp. 1047–1056.
@25# Mundo, C., Sommerfeld, M., and Tropea, C., 1995, ‘‘Droplet-Wall CollisionExperimental Studies of the Deformation and Breakup Process,’’ Int. J. Mtiphase Flow,21, pp. 151–173.
@26# Yarin, A. L., and Weiss, D. A., 1995, ‘‘Impact of Drops on Solid SurfaceSelf-Similar Capillary Waves and Splashing as a New Type of KinemaDiscontinuity,’’ J. Fluid Mech.,283, pp. 141–173.
@27# Ohl, C. D., Philipp, A., and Lauterborn, W., 1995, ‘‘Cavitation Bubble Colapse Studies at 20 Million Frames Per Second,’’ Ann. Phys.~Leipzig!, 4, No.1, pp. 26–34.
@28# Levin, Z., and Hobbs, P. V., 1971, ‘‘Splashing of Water Drops on Solid aWetted Surfaces: Hydrodynamics and Charge Separations,’’ Philos. TranSoc. London, Ser. A,269, pp. 555–585.
@29# Hayes, D. J., Wallace, D. B., and Boldman, M. T., 1992, ‘‘Picoliter SoldDroplet Dispension,’’ISHM Symposium 92 Proceedings, pp. 316–321.
@30# Arx, M. v., 1998, ‘‘Thermal Properties of CMOS Thin Films,’’ Ph.D. thesisETH Zurich.
@31# Poulikakos, D., 1994,Conduction Heat Transfer, Prentice-Hall, EnglewoodCliffs, NJ.
@32# Bennett, T., and Poulikakos, D., 1993, ‘‘Splat-Quench Solidification: Estiming the Maximum Spreading of a Droplet Impacting a Solid Surface,’’Mater. Sci.,28, pp. 963–970.
@33# Schiaffino, S., and Sonin, A. A., 1997, ‘‘Molten Droplet Deposition and Slidification at Low Weber Numbers,’’ Phys. Fluids,9, pp. 3172–3187.
AUGUST 2000, Vol. 122 Õ 555

9
n
9s
lc
al
.,
rce-, Eu-
96,E
@34# Fukai, J., Zhao, Z., Poulikakos, D., Megaridis, C. M., and Miyatake, O., 19‘‘Modeling of the Deformation of a Liquid Droplet Impinging Upon a FlaSurface,’’ Phys. Fluids A,5, pp. 2588–2599.
@35# Schiaffino, S., and Sonin, A. A., 1997, ‘‘Motion and Arrest of a Molten Cotact Line on a Cold Surface: An Experimental Study,’’ Phys. Fluids,9, pp.2217–2226.
@36# Pasandideh-Fard, M., Qiao, Y. M., Chandra, S., and Mostaghimi, J., 1‘‘Capillary Effects During Droplet Impact on a Solid Surface,’’ Phys. Fluid8, pp. S650–S659.
@37# Zarzalejo, L. J., Schmaltz, K. S., and Amon, C. H., 1999, ‘‘Molten DropSolidification and Substrate Remelting in Microcasting, Part I—NumeriModeling and Experimental Varification,’’ Heat Mass Transfer,34, pp. 477–485.
556 Õ Vol. 122, AUGUST 2000
3,t
-
96,,
etal
@38# Tanner, L. H., 1979, ‘‘The Spreading of Silicon Oil Drops on HorizontSurfaces,’’ J. Phys. D: Appl. Phys.,12, pp. 1473–1484.
@39# Voinov, O. V., 1976, ‘‘Hydrodynamics of Wetting,’’ Fluid Dyn.,11, pp. 714–721.
@40# Kistler, S. F., 1993, ‘‘Hydrodynamics of Wetting,’’ Wettability, Berg, J. Ced., Marcel Dekker, New York.
@41# Haferl, S., Poulikakos, D., and Zhao, Z., 1999, ‘‘Employing Scanning FoMicroscopy to Investigate the Dynamic Wetting Behavior of Liquid Microdroplets on Smooth Surfaces: Gathered Experiences,’’ Poster Presentationropean Research Conferences~EURESCO! Solid/Fluid Interfaces: ComplexFluid Interfaces, Castelvecchio Pascoli, Italy.
@42# Waldvogel, J. M., Poulikakos, D., Wallace, D. B., and Marusak, R., 19‘‘Transport Phenomena in Picoliter Size Solder Droplet Dispension,’’ ASMJ. Heat Transfer,118, pp. 148–156.
Transactions of the ASME