Embed Size (px)
Citation preview
1. INTRODUCTION
The creation of arrays of closely spaced hydraulic fractures is an emerging technique for stimulation of horizontal wells in unconventional gas reservoirs [1, 2] and for preconditioning ore bodies for block/panel caving operations [3]. In the unconventional gas applications, which are now most commonly related to shale gas plays, an array of hydraulic fractures is created from multiple perforation clusters that are placed along a horizontal well. In some cases injection is made into several or all of the perforation clusters at the same time (simultaneous fracturing), while in other cases the perforation clusters are sequentially isolated so that injection proceeds into one cluster at a time (sequential or “zipper” fracturing). The horizontal well is typically drilled sub-parallel to the minimum horizontal stress direction, thus promoting hydraulic fracture growth transverse to the wellbore axis. These gas industry fractures are usually driven by water, which often has a friction reducing additive to enable high flow rates through the injection system. In light of the low viscosity fracturing fluid, proppant (typically sand) concentrations in the injected water/sand slurry are typically smaller than in conventional hydraulic fracturing, but the rate of injection is usually higher and treatment duration is
longer so that the total amount of proppant that is placed can be greater than in conventional hydraulic fractures [1].
Like their gas industry counterparts, arrays of hydraulic fractures that are created for preconditioning ore bodies for block/panel caving operations are typically water driven. However, these fractures are most often unpropped because their eventual conductivity to fluid flow is not a primary consideration and placing proppant increases the operational complexity and costs. Often the hydraulic fractures are placed from uncased cored boreholes using inflatable packers. As in the gas industry applications, boreholes that are sub-parallel to the minimum stress direction are favored because these will experience hydraulic fracture growth that is transverse to the wellbore axis, in principle enabling a more closely spaced array and allowing the greatest volume of rock to be treated per borehole.
Perhaps the greatest difference between the gas industry and mining industry hydraulic fractures is the size. Gas industry hydraulic fractures typically entail injection rates on the order of 75-250 L/s (~30-100 bbl/min) to inject 135-1,000 m3 per stage (e.g. [4]), while mining industry fracturing typically uses rates on the order of 5 to 10 L/s (~2 to 4 bbl/min) to inject 8 to 20 m3 per fracture [5]. Based on microseismic data, gas industry
ARMA 11-318 Experimental Investigation of the Interaction among Closely Spaced Hydraulic Fractures
Bunger, A.P., Jeffrey, R.G., Kear, J., and Zhang, X. CSIRO Earth Science and Resource Engineering, Melbourne, Victoria, Australia
Morgan, M. CE Project, Cadia Valley Operations, Newcrest Mining Limited, Orange, New South Wales, Australia
Copyright 2011 ARMA, American Rock Mechanics Association
This paper was prepared for presentation at the 45th US Rock Mechanics / Geomechanics Symposium held in San Francisco, CA, June 26–29, 2011.
This paper was selected for presentation at the symposium by an ARMA Technical Program Committee based on a technical and critical review of the paper by a minimum of two technical reviewers. The material, as presented, does not necessarily reflect any position of ARMA, its officers, or members. Electronic reproduction, distribution, or storage of any part of this paper for commercial purposes without the written consent of ARMA is prohibited. Permission to reproduce in print is restricted to an abstract of not more than 300 words; illustrations may not be copied. The abstract must contain conspicuous acknowledgement of where and by whom the paper was presented.
ABSTRACT: Closely spaced hydraulic fractures are placed during preconditioning of orebodies for cave mining methods and fracture spacing used between stages in horizontal shale gas wells for stimulation continues to be reduced. The question of the effect of the interaction between a new hydraulic fracture and one or more nearby hydraulic fractures is important for both of these application areas. Here we present experimental data from both minethrough and laboratory investigations aimed at verifying model predictions of the deflection of the path of a hydraulic fracture that is influenced by a previously placed, propped hydraulic fracture. In one laboratory case, the minimum stress was zero and, consistent with the model prediction the fracture path curved toward and coalesced with the previously-placed fracture. In another laboratory case and in the field-scale minethrough case, the stress, injection, and propping conditions were such that the model predicted that curving could be neglected. This prediction is consistent with both the laboratory and minethrough data, where in the minethrough we observe subparallel fractures growing at 1.25 m separation over a mapped distance of over 15 m.
fractures are inferred to grow to hundreds of meters in length (e.g. [6]) and in current practice are often spaced around 100 meters apart (e.g. [7, 1]), although both experience and production modeling are driving a trend toward arrays of more closely spaced fractures [8]. In contrast, offset well and minethrough data indicates mining industry fractures grow to 30-80 meters, and these are typically placed 1-2.5 meters apart [5].
Recent modeling efforts have been aimed at determining how closely hydraulic fractures should be placed to one another in these arrays. For the gas industry, this question is primarily addressed through production models (e.g. [8, 9, 10]). For the mining industry this question is primarily addressed through caveability charts and numerical models [11]. Invariably these models assume planar, penny-shaped or bi-wing hydraulic fractures. However, past laboratory experiments suggest that the interaction between closely spaced hydraulic fractures can lead to deflection of their paths [12, 13]. The deflection of the path of a hydraulic fracture as it interacts with one or more previously placed fractures could be detrimental to its effectiveness, leading to near wellbore coalescence and/or non-uniformity of the stimulation or preconditioning. Hence, it is important to delineate the conditions under which planar hydraulic fractures are expected so that the appropriateness of the models that rely on this idealization can be evaluated and so that optimal fracture designs can be carried out.
A recent numerical study [14] has defined parameters controlling hydraulic fracture path deflection as well as the limiting behavior associated with the various controlling parameters taking on large or small values. The predictions of this model were compared in the original paper to Oak Ridge National Laboratory field study [15] and to a shale oil example from the Bakken formation [16, 17]. This paper extends this effort to validate the model predictions. Firstly, we compare the model predictions with new minethrough data from the Cadia East Project currently underway in Australia.
After this, we turn our attention to controlled laboratory experiments carried out in 400 mm blocks of medium-grained gabbro under conditions that were chosen to investigate certain limiting behaviors of the system as predicted by the model and to demonstrate the influence of notching the wellbore prior to injection on the resulting hydraulic fracture array geometry.
2. MODEL PREDICTIONS AND PARAMETERS
The issue of curving interaction between a growing hydraulic fracture and a previously placed hydraulic fracture was recently studied numerically by Bunger et al. [14]. This study made use of a fully coupled, 2D (plane strain) hydraulic fracturing simulator that is described in detail by Zhang et al. [18]. The features of the model that are used by Bunger et al. [14] include:
1. Full coupling between fluid flow and deformation of an elastic, homogeneous, impermeable rock.
2. Crack propagation according to the maximum tensile stress criterion of Erdogan and Sih [19].
3. Potential sliding of existing fracture surfaces (i.e. a previous hydraulic fracture) according to Coulomb’s friction law.
Figure 1: Sketch of the problem considered by Bunger et al. [14].
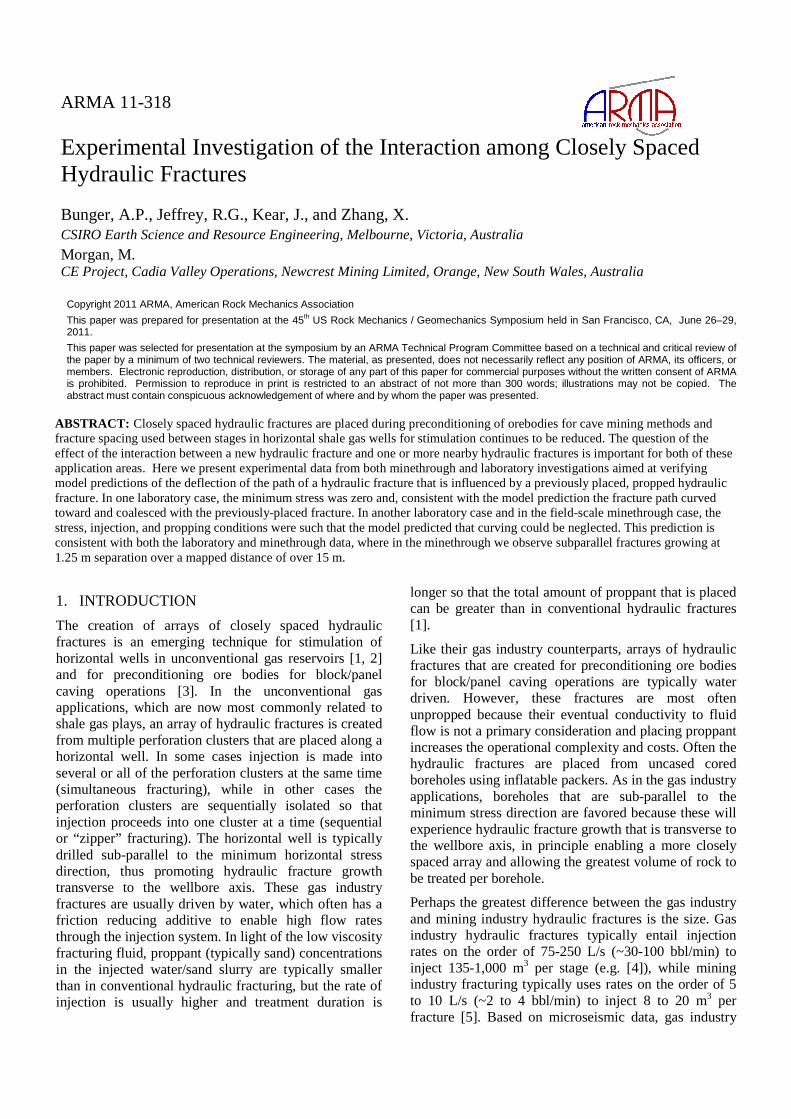
Figure 2: Illustrations of two of the three causes of curving interaction, a) reopening of HF1 causing HF2 to curve towards it, b) sliding on HF1 causing HF2 to curve away from it.
a
b
Bunger et al. [14] consider the problem of a hydraulic fracture (HF2, Figure 1) that initiates from a small notch that is parallel to and at a distance H from a previously placed hydraulic fracture (HF1) which is assumed to have an elliptically shaped propped or residual opening, as illustrated by Figure 1. As HF2 grows, its path is shown to be deflected due to:
1. Reopening of HF1, which cannot sustain tensile stresses that might be induced by HF2, resulting in HF2 curving toward HF1 (Figure 2a)
2. Sliding of HF1 due to shear stresses induced by HF2, resulting in HF2 curving away from HF1 (Figure 2b)
3. The stress field produced due to the propped or residual opening of HF1, resulting in HF2 sharply curving away from HF1 as it nears the tip region (Figure 1)
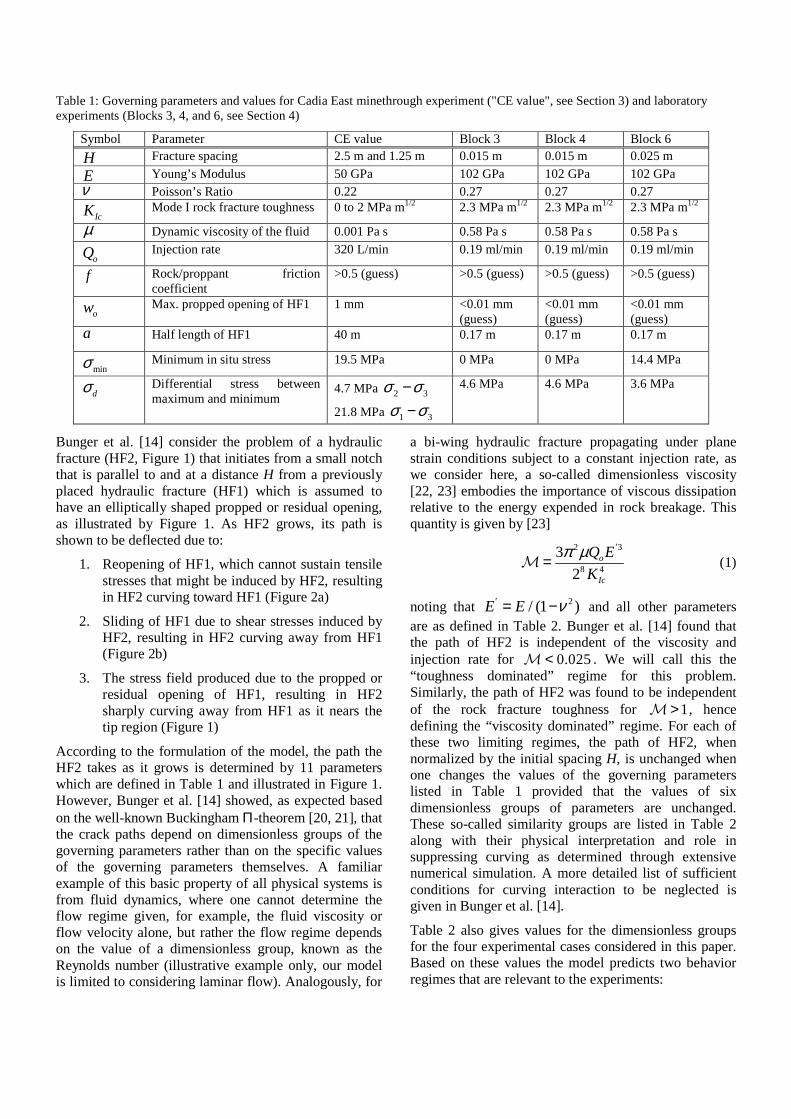
According to the formulation of the model, the path the HF2 takes as it grows is determined by 11 parameters which are defined in Table 1 and illustrated in Figure 1. However, Bunger et al. [14] showed, as expected based on the well-known Buckingham Π-theorem [20, 21], that the crack paths depend on dimensionless groups of the governing parameters rather than on the specific values of the governing parameters themselves. A familiar example of this basic property of all physical systems is from fluid dynamics, where one cannot determine the flow regime given, for example, the fluid viscosity or flow velocity alone, but rather the flow regime depends on the value of a dimensionless group, known as the Reynolds number (illustrative example only, our model is limited to considering laminar flow). Analogously, for
a bi-wing hydraulic fracture propagating under plane strain conditions subject to a constant injection rate, as we consider here, a so-called dimensionless viscosity [22, 23] embodies the importance of viscous dissipation relative to the energy expended in rock breakage. This quantity is given by [23]
2 3
8 4
3
2o
Ic
Q E
K
π µ ′
=M (1)
noting that 2/ (1 )EE ν′ = − and all other parameters are as defined in Table 2. Bunger et al. [14] found that the path of HF2 is independent of the viscosity and injection rate for 0.025<M . We will call this the “toughness dominated” regime for this problem. Similarly, the path of HF2 was found to be independent of the rock fracture toughness for 1>M , hence defining the “viscosity dominated” regime. For each of these two limiting regimes, the path of HF2, when normalized by the initial spacing H, is unchanged when one changes the values of the governing parameters listed in Table 1 provided that the values of six dimensionless groups of parameters are unchanged. These so-called similarity groups are listed in Table 2 along with their physical interpretation and role in suppressing curving as determined through extensive numerical simulation. A more detailed list of sufficient conditions for curving interaction to be neglected is given in Bunger et al. [14].
Table 2 also gives values for the dimensionless groups for the four experimental cases considered in this paper. Based on these values the model predicts two behavior regimes that are relevant to the experiments:
Table 1: Governing parameters and values for Cadia East minethrough experiment ("CE value", see Section 3) and laboratory experiments (Blocks 3, 4, and 6, see Section 4)
Symbol Parameter CE value Block 3 Block 4 Block 6
H Fracture spacing 2.5 m and 1.25 m 0.015 m 0.015 m 0.025 m
E Young’s Modulus 50 GPa 102 GPa 102 GPa 102 GPa ν Poisson’s Ratio 0.22 0.27 0.27 0.27
IcK Mode I rock fracture toughness 0 to 2 MPa m1/2 2.3 MPa m1/2 2.3 MPa m1/2 2.3 MPa m1/2
µ Dynamic viscosity of the fluid 0.001 Pa s 0.58 Pa s 0.58 Pa s 0.58 Pa s
oQ Injection rate 320 L/min 0.19 ml/min 0.19 ml/min 0.19 ml/min
f Rock/proppant friction coefficient
>0.5 (guess) >0.5 (guess) >0.5 (guess) >0.5 (guess)
ow Max. propped opening of HF1 1 mm <0.01 mm (guess)
<0.01 mm (guess)
<0.01 mm (guess)
a Half length of HF1 40 m 0.17 m 0.17 m 0.17 m
minσ Minimum in situ stress 19.5 MPa 0 MPa 0 MPa 14.4 MPa
dσ Differential stress between maximum and minimum
4.7 MPa 2 3σ σ−
21.8 MPa 1 3σ σ−
4.6 MPa 4.6 MPa 3.6 MPa
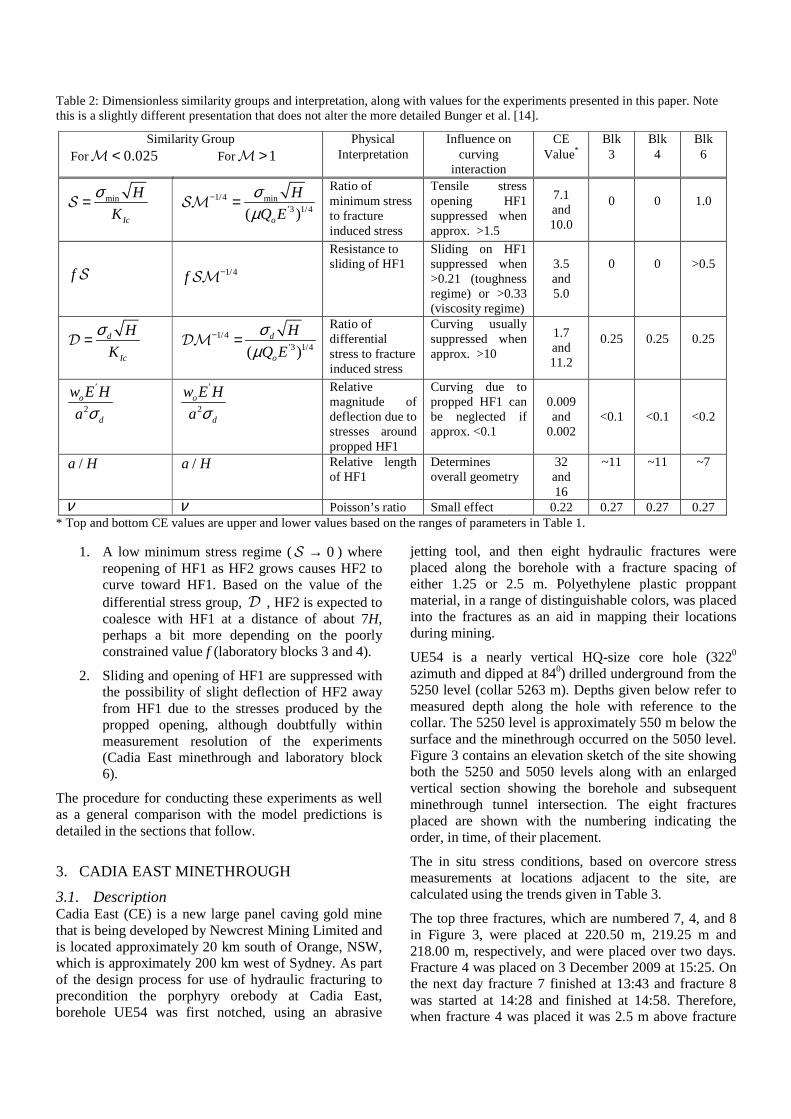
1. A low minimum stress regime ( 0→S ) where reopening of HF1 as HF2 grows causes HF2 to curve toward HF1. Based on the value of the differential stress group, D , HF2 is expected to coalesce with HF1 at a distance of about 7H, perhaps a bit more depending on the poorly constrained value f (laboratory blocks 3 and 4).
2. Sliding and opening of HF1 are suppressed with the possibility of slight deflection of HF2 away from HF1 due to the stresses produced by the propped opening, although doubtfully within measurement resolution of the experiments (Cadia East minethrough and laboratory block 6).
The procedure for conducting these experiments as well as a general comparison with the model predictions is detailed in the sections that follow.
3. CADIA EAST MINETHROUGH
3.1. Description Cadia East (CE) is a new large panel caving gold mine that is being developed by Newcrest Mining Limited and is located approximately 20 km south of Orange, NSW, which is approximately 200 km west of Sydney. As part of the design process for use of hydraulic fracturing to precondition the porphyry orebody at Cadia East, borehole UE54 was first notched, using an abrasive
jetting tool, and then eight hydraulic fractures were placed along the borehole with a fracture spacing of either 1.25 or 2.5 m. Polyethylene plastic proppant material, in a range of distinguishable colors, was placed into the fractures as an aid in mapping their locations during mining.
UE54 is a nearly vertical HQ-size core hole (3220 azimuth and dipped at 840) drilled underground from the 5250 level (collar 5263 m). Depths given below refer to measured depth along the hole with reference to the collar. The 5250 level is approximately 550 m below the surface and the minethrough occurred on the 5050 level. Figure 3 contains an elevation sketch of the site showing both the 5250 and 5050 levels along with an enlarged vertical section showing the borehole and subsequent minethrough tunnel intersection. The eight fractures placed are shown with the numbering indicating the order, in time, of their placement.
The in situ stress conditions, based on overcore stress measurements at locations adjacent to the site, are calculated using the trends given in Table 3.
The top three fractures, which are numbered 7, 4, and 8 in Figure 3, were placed at 220.50 m, 219.25 m and 218.00 m, respectively, and were placed over two days. Fracture 4 was placed on 3 December 2009 at 15:25. On the next day fracture 7 finished at 13:43 and fracture 8 was started at 14:28 and finished at 14:58. Therefore, when fracture 4 was placed it was 2.5 m above fracture
Table 2: Dimensionless similarity groups and interpretation, along with values for the experiments presented in this paper. Note this is a slightly different presentation that does not alter the more detailed Bunger et al. [14].
Similarity Group Physical Influence on CE Blk Blk Blk For 0.025<M For 1>M Interpretation curving
interaction Value* 3 4 6
min
Ic
H
K
σ=S 1/4 min3 1/4( )o
H
Q E
σµ
−′=SM
Ratio of minimum stress to fracture induced stress
Tensile stress opening HF1 suppressed when approx. >1.5
7.1 and 10.0
0
0
1.0
f S
1/4f −SM
Resistance to sliding of HF1
Sliding on HF1 suppressed when >0.21 (toughness regime) or >0.33 (viscosity regime)
3.5 and 5.0
0
0
>0.5
d
Ic
H
K
σ=D 1/43 1/4( )
d
o
H
Q E
σµ
−′=DM
Ratio of differential stress to fracture induced stress
Curving usually suppressed when approx. >10
1.7 and 11.2
0.25
0.25
0.25
2o
d
w E H
a σ
′
2
o
d
w E H
a σ
′
Relative magnitude of deflection due to stresses around propped HF1
Curving due to propped HF1 can be neglected if approx. <0.1
0.009 and
0.002
<0.1
<0.1
<0.2
/a H /a H Relative length of HF1
Determines overall geometry
32 and 16
~11 ~11 ~7
ν ν Poisson’s ratio Small effect 0.22 0.27 0.27 0.27 * Top and bottom CE values are upper and lower values based on the ranges of parameters in Table 1.
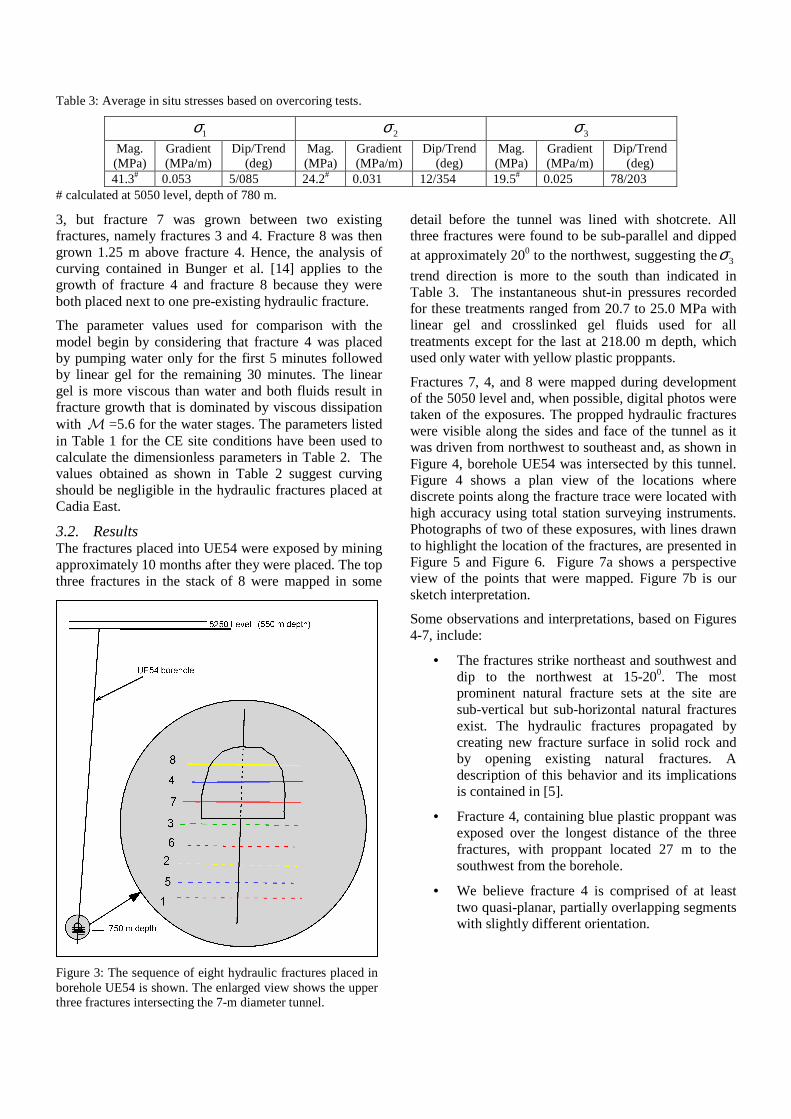
3, but fracture 7 was grown between two existing fractures, namely fractures 3 and 4. Fracture 8 was then grown 1.25 m above fracture 4. Hence, the analysis of curving contained in Bunger et al. [14] applies to the growth of fracture 4 and fracture 8 because they were both placed next to one pre-existing hydraulic fracture.
The parameter values used for comparison with the model begin by considering that fracture 4 was placed by pumping water only for the first 5 minutes followed by linear gel for the remaining 30 minutes. The linear gel is more viscous than water and both fluids result in fracture growth that is dominated by viscous dissipation with M =5.6 for the water stages. The parameters listed in Table 1 for the CE site conditions have been used to calculate the dimensionless parameters in Table 2. The values obtained as shown in Table 2 suggest curving should be negligible in the hydraulic fractures placed at Cadia East.
3.2. Results The fractures placed into UE54 were exposed by mining approximately 10 months after they were placed. The top three fractures in the stack of 8 were mapped in some
detail before the tunnel was lined with shotcrete. All three fractures were found to be sub-parallel and dipped at approximately 200 to the northwest, suggesting the3σ
trend direction is more to the south than indicated in Table 3. The instantaneous shut-in pressures recorded for these treatments ranged from 20.7 to 25.0 MPa with linear gel and crosslinked gel fluids used for all treatments except for the last at 218.00 m depth, which used only water with yellow plastic proppants.
Fractures 7, 4, and 8 were mapped during development of the 5050 level and, when possible, digital photos were taken of the exposures. The propped hydraulic fractures were visible along the sides and face of the tunnel as it was driven from northwest to southeast and, as shown in Figure 4, borehole UE54 was intersected by this tunnel. Figure 4 shows a plan view of the locations where discrete points along the fracture trace were located with high accuracy using total station surveying instruments. Photographs of two of these exposures, with lines drawn to highlight the location of the fractures, are presented in Figure 5 and Figure 6. Figure 7a shows a perspective view of the points that were mapped. Figure 7b is our sketch interpretation.
Some observations and interpretations, based on Figures 4-7, include:
• The fractures strike northeast and southwest and dip to the northwest at 15-200. The most prominent natural fracture sets at the site are sub-vertical but sub-horizontal natural fractures exist. The hydraulic fractures propagated by creating new fracture surface in solid rock and by opening existing natural fractures. A description of this behavior and its implications is contained in [5].
• Fracture 4, containing blue plastic proppant was exposed over the longest distance of the three fractures, with proppant located 27 m to the southwest from the borehole.
• We believe fracture 4 is comprised of at least two quasi-planar, partially overlapping segments with slightly different orientation.
Figure 3: The sequence of eight hydraulic fractures placed in borehole UE54 is shown. The enlarged view shows the upper three fractures intersecting the 7-m diameter tunnel.
Table 3: Average in situ stresses based on overcoring tests.
1σ 2σ 3σ
Mag. (MPa)
Gradient (MPa/m)
Dip/Trend (deg)
Mag. (MPa)
Gradient (MPa/m)
Dip/Trend (deg)
Mag. (MPa)
Gradient (MPa/m)
Dip/Trend (deg)
41.3# 0.053 5/085 24.2# 0.031 12/354 19.5# 0.025 78/203 # calculated at 5050 level, depth of 780 m.
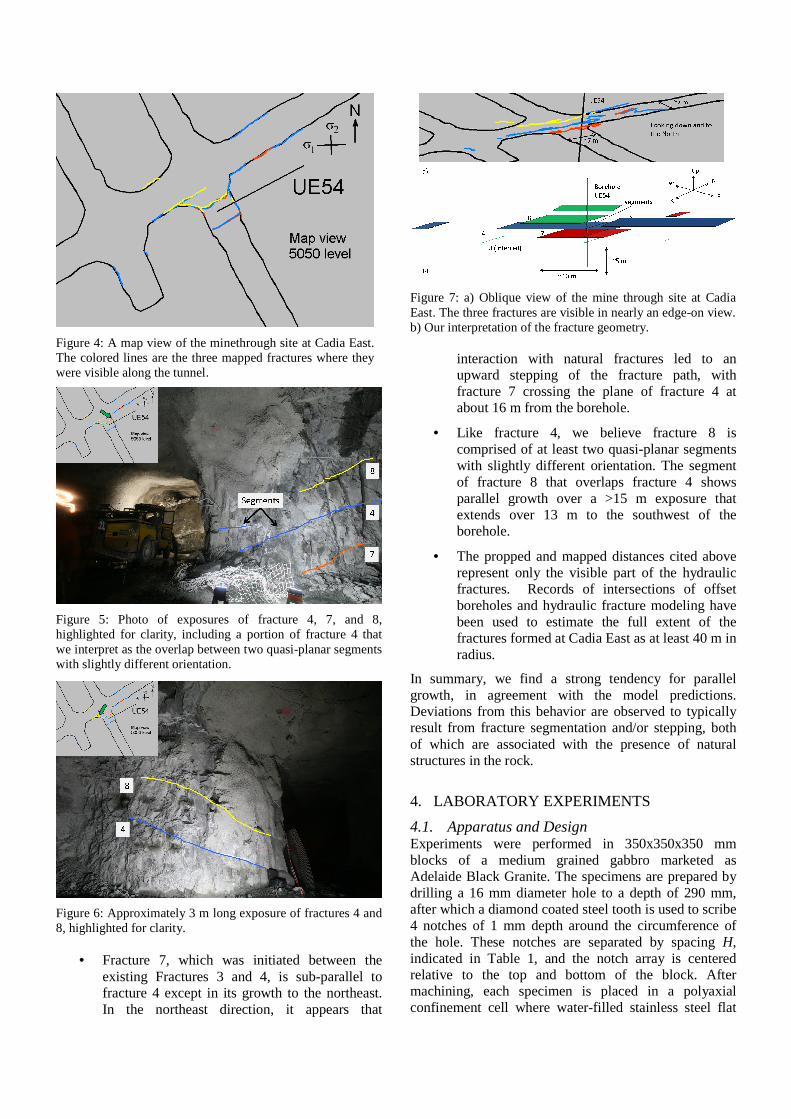
• Fracture 7, which was initiated between the existing Fractures 3 and 4, is sub-parallel to fracture 4 except in its growth to the northeast. In the northeast direction, it appears that
interaction with natural fractures led to an upward stepping of the fracture path, with fracture 7 crossing the plane of fracture 4 at about 16 m from the borehole.
• Like fracture 4, we believe fracture 8 is comprised of at least two quasi-planar segments with slightly different orientation. The segment of fracture 8 that overlaps fracture 4 shows parallel growth over a >15 m exposure that extends over 13 m to the southwest of the borehole.
• The propped and mapped distances cited above represent only the visible part of the hydraulic fractures. Records of intersections of offset boreholes and hydraulic fracture modeling have been used to estimate the full extent of the fractures formed at Cadia East as at least 40 m in radius.
In summary, we find a strong tendency for parallel growth, in agreement with the model predictions. Deviations from this behavior are observed to typically result from fracture segmentation and/or stepping, both of which are associated with the presence of natural structures in the rock.
4. LABORATORY EXPERIMENTS
4.1. Apparatus and Design Experiments were performed in 350x350x350 mm blocks of a medium grained gabbro marketed as Adelaide Black Granite. The specimens are prepared by drilling a 16 mm diameter hole to a depth of 290 mm, after which a diamond coated steel tooth is used to scribe 4 notches of 1 mm depth around the circumference of the hole. These notches are separated by spacing H, indicated in Table 1, and the notch array is centered relative to the top and bottom of the block. After machining, each specimen is placed in a polyaxial confinement cell where water-filled stainless steel flat
Figure 4: A map view of the minethrough site at Cadia East. The colored lines are the three mapped fractures where they were visible along the tunnel.
Figure 5: Photo of exposures of fracture 4, 7, and 8, highlighted for clarity, including a portion of fracture 4 that we interpret as the overlap between two quasi-planar segments with slightly different orientation.
Figure 6: Approximately 3 m long exposure of fractures 4 and 8, highlighted for clarity.
Figure 7: a) Oblique view of the mine through site at Cadia East. The three fractures are visible in nearly an edge-on view. b) Our interpretation of the fracture geometry.
jacks connected to a syringe pump apply equal horizontal (maximum) stresses and a smaller vertical (minimum) stress as listed in Table 1.
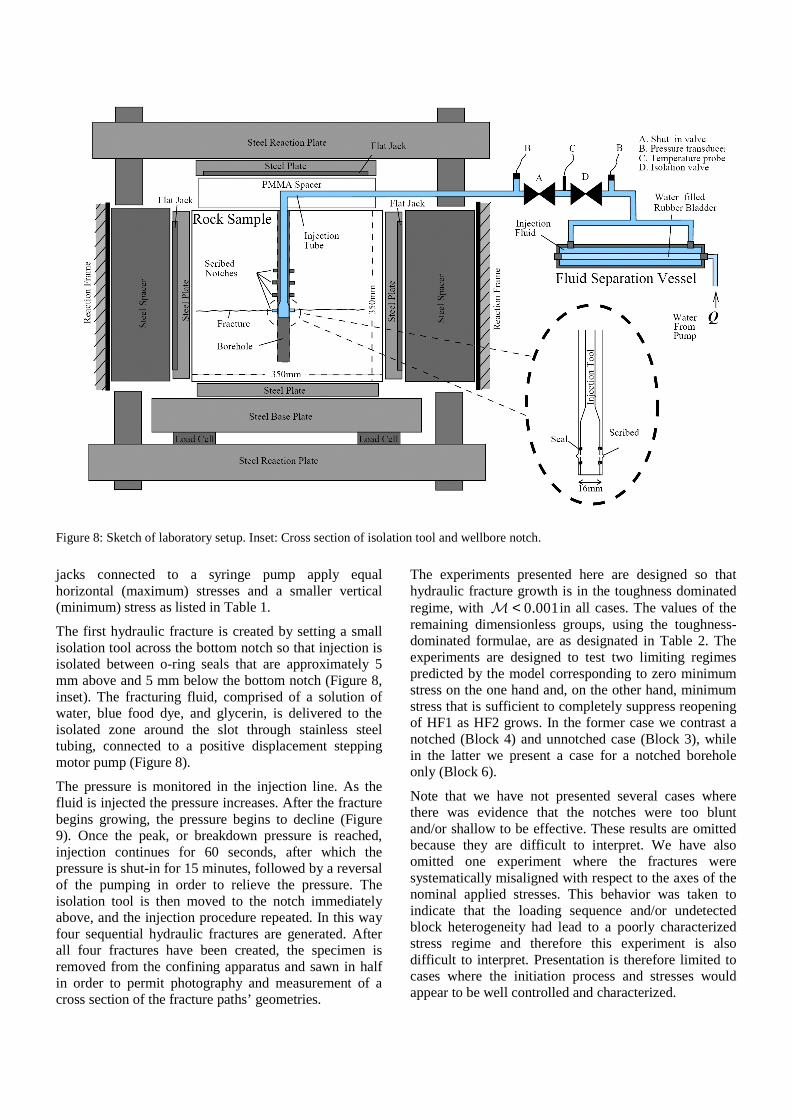
The first hydraulic fracture is created by setting a small isolation tool across the bottom notch so that injection is isolated between o-ring seals that are approximately 5 mm above and 5 mm below the bottom notch (Figure 8, inset). The fracturing fluid, comprised of a solution of water, blue food dye, and glycerin, is delivered to the isolated zone around the slot through stainless steel tubing, connected to a positive displacement stepping motor pump (Figure 8).
The pressure is monitored in the injection line. As the fluid is injected the pressure increases. After the fracture begins growing, the pressure begins to decline (Figure 9). Once the peak, or breakdown pressure is reached, injection continues for 60 seconds, after which the pressure is shut-in for 15 minutes, followed by a reversal of the pumping in order to relieve the pressure. The isolation tool is then moved to the notch immediately above, and the injection procedure repeated. In this way four sequential hydraulic fractures are generated. After all four fractures have been created, the specimen is removed from the confining apparatus and sawn in half in order to permit photography and measurement of a cross section of the fracture paths’ geometries.
The experiments presented here are designed so that hydraulic fracture growth is in the toughness dominated regime, with 0.001<M in all cases. The values of the remaining dimensionless groups, using the toughness-dominated formulae, are as designated in Table 2. The experiments are designed to test two limiting regimes predicted by the model corresponding to zero minimum stress on the one hand and, on the other hand, minimum stress that is sufficient to completely suppress reopening of HF1 as HF2 grows. In the former case we contrast a notched (Block 4) and unnotched case (Block 3), while in the latter we present a case for a notched borehole only (Block 6).
Note that we have not presented several cases where there was evidence that the notches were too blunt and/or shallow to be effective. These results are omitted because they are difficult to interpret. We have also omitted one experiment where the fractures were systematically misaligned with respect to the axes of the nominal applied stresses. This behavior was taken to indicate that the loading sequence and/or undetected block heterogeneity had lead to a poorly characterized stress regime and therefore this experiment is also difficult to interpret. Presentation is therefore limited to cases where the initiation process and stresses would appear to be well controlled and characterized.
Figure 8: Sketch of laboratory setup. Inset: Cross section of isolation tool and wellbore notch.
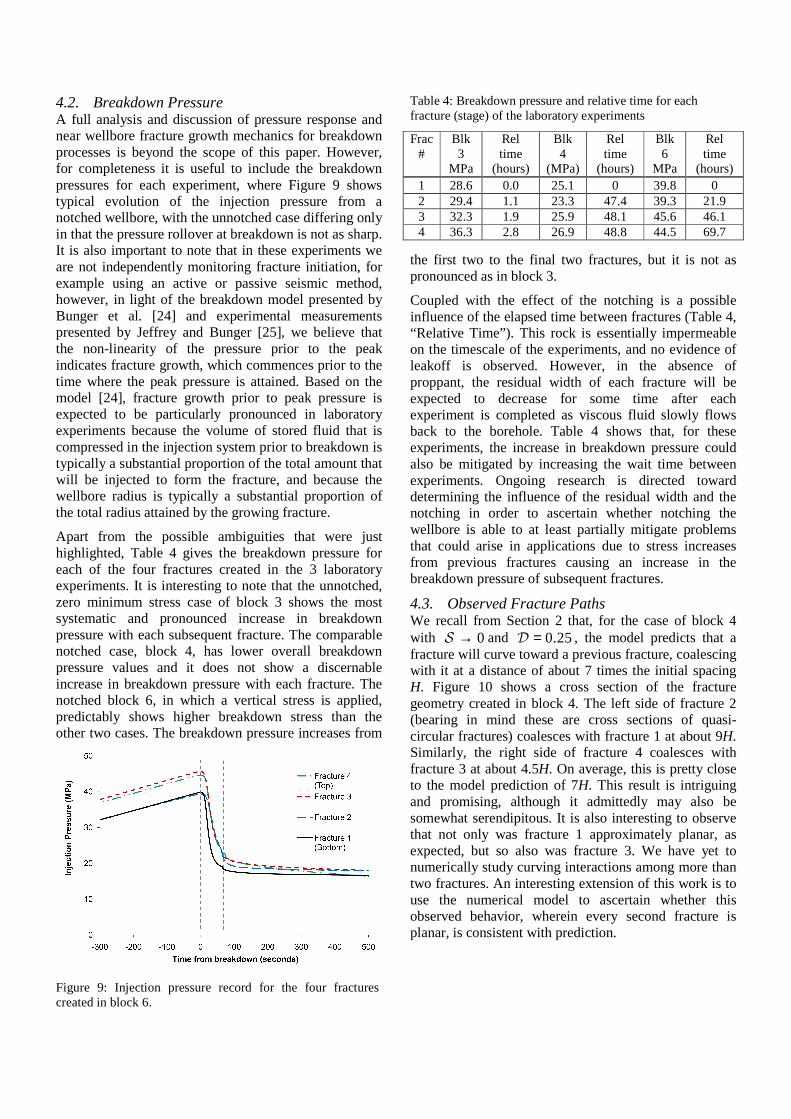
4.2. Breakdown Pressure A full analysis and discussion of pressure response and near wellbore fracture growth mechanics for breakdown processes is beyond the scope of this paper. However, for completeness it is useful to include the breakdown pressures for each experiment, where Figure 9 shows typical evolution of the injection pressure from a notched wellbore, with the unnotched case differing only in that the pressure rollover at breakdown is not as sharp. It is also important to note that in these experiments we are not independently monitoring fracture initiation, for example using an active or passive seismic method, however, in light of the breakdown model presented by Bunger et al. [24] and experimental measurements presented by Jeffrey and Bunger [25], we believe that the non-linearity of the pressure prior to the peak indicates fracture growth, which commences prior to the time where the peak pressure is attained. Based on the model [24], fracture growth prior to peak pressure is expected to be particularly pronounced in laboratory experiments because the volume of stored fluid that is compressed in the injection system prior to breakdown is typically a substantial proportion of the total amount that will be injected to form the fracture, and because the wellbore radius is typically a substantial proportion of the total radius attained by the growing fracture.
Apart from the possible ambiguities that were just highlighted, Table 4 gives the breakdown pressure for each of the four fractures created in the 3 laboratory experiments. It is interesting to note that the unnotched, zero minimum stress case of block 3 shows the most systematic and pronounced increase in breakdown pressure with each subsequent fracture. The comparable notched case, block 4, has lower overall breakdown pressure values and it does not show a discernable increase in breakdown pressure with each fracture. The notched block 6, in which a vertical stress is applied, predictably shows higher breakdown stress than the other two cases. The breakdown pressure increases from
the first two to the final two fractures, but it is not as pronounced as in block 3.
Coupled with the effect of the notching is a possible influence of the elapsed time between fractures (Table 4, “Relative Time”). This rock is essentially impermeable on the timescale of the experiments, and no evidence of leakoff is observed. However, in the absence of proppant, the residual width of each fracture will be expected to decrease for some time after each experiment is completed as viscous fluid slowly flows back to the borehole. Table 4 shows that, for these experiments, the increase in breakdown pressure could also be mitigated by increasing the wait time between experiments. Ongoing research is directed toward determining the influence of the residual width and the notching in order to ascertain whether notching the wellbore is able to at least partially mitigate problems that could arise in applications due to stress increases from previous fractures causing an increase in the breakdown pressure of subsequent fractures.
4.3. Observed Fracture Paths We recall from Section 2 that, for the case of block 4 with 0→S and 0.25=D , the model predicts that a fracture will curve toward a previous fracture, coalescing with it at a distance of about 7 times the initial spacing H. Figure 10 shows a cross section of the fracture geometry created in block 4. The left side of fracture 2 (bearing in mind these are cross sections of quasi-circular fractures) coalesces with fracture 1 at about 9H. Similarly, the right side of fracture 4 coalesces with fracture 3 at about 4.5H. On average, this is pretty close to the model prediction of 7H. This result is intriguing and promising, although it admittedly may also be somewhat serendipitous. It is also interesting to observe that not only was fracture 1 approximately planar, as expected, but so also was fracture 3. We have yet to numerically study curving interactions among more than two fractures. An interesting extension of this work is to use the numerical model to ascertain whether this observed behavior, wherein every second fracture is planar, is consistent with prediction.
Figure 9: Injection pressure record for the four fractures created in block 6.
Table 4: Breakdown pressure and relative time for each fracture (stage) of the laboratory experiments
Frac #
Blk 3
MPa
Rel time
(hours)
Blk 4
(MPa)
Rel time
(hours)
Blk 6
MPa
Rel time
(hours) 1 28.6 0.0 25.1 0 39.8 0 2 29.4 1.1 23.3 47.4 39.3 21.9 3 32.3 1.9 25.9 48.1 45.6 46.1 4 36.3 2.8 26.9 48.8 44.5 69.7
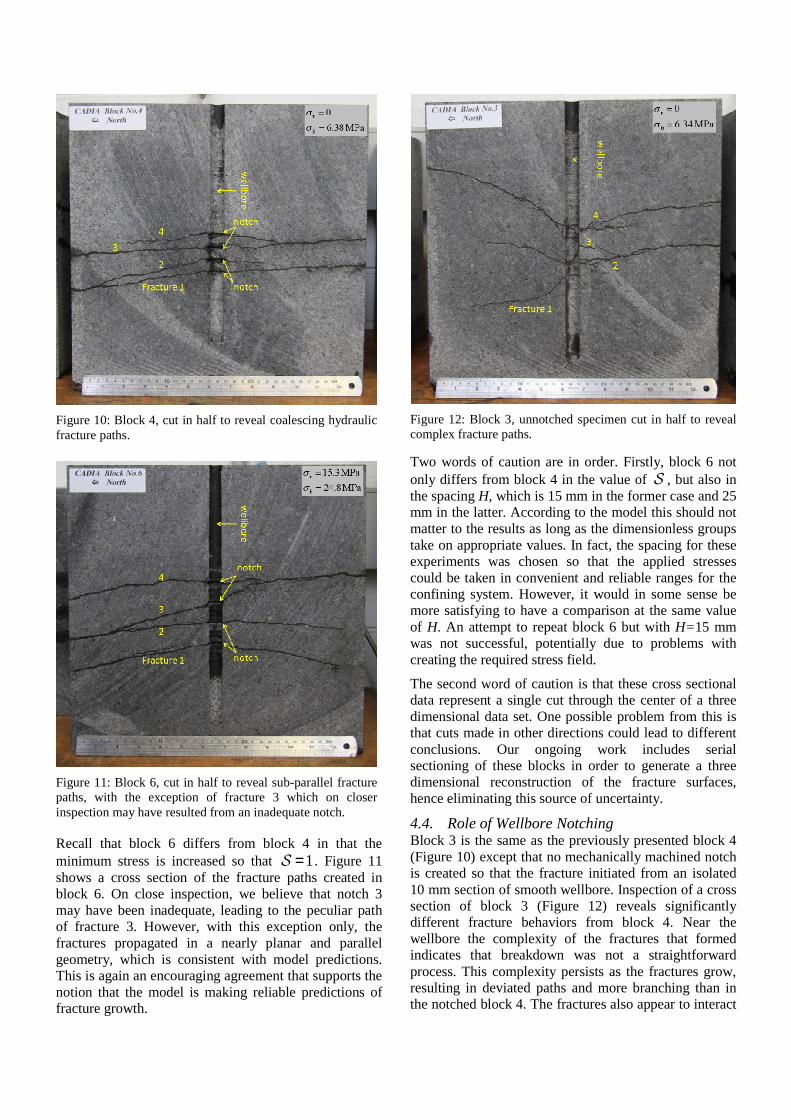
Recall that block 6 differs from block 4 in that the minimum stress is increased so that 1=S . Figure 11 shows a cross section of the fracture paths created in block 6. On close inspection, we believe that notch 3 may have been inadequate, leading to the peculiar path of fracture 3. However, with this exception only, the fractures propagated in a nearly planar and parallel geometry, which is consistent with model predictions. This is again an encouraging agreement that supports the notion that the model is making reliable predictions of fracture growth.
Two words of caution are in order. Firstly, block 6 not only differs from block 4 in the value of S , but also in the spacing H, which is 15 mm in the former case and 25 mm in the latter. According to the model this should not matter to the results as long as the dimensionless groups take on appropriate values. In fact, the spacing for these experiments was chosen so that the applied stresses could be taken in convenient and reliable ranges for the confining system. However, it would in some sense be more satisfying to have a comparison at the same value of H. An attempt to repeat block 6 but with H=15 mm was not successful, potentially due to problems with creating the required stress field.
The second word of caution is that these cross sectional data represent a single cut through the center of a three dimensional data set. One possible problem from this is that cuts made in other directions could lead to different conclusions. Our ongoing work includes serial sectioning of these blocks in order to generate a three dimensional reconstruction of the fracture surfaces, hence eliminating this source of uncertainty.
4.4. Role of Wellbore Notching Block 3 is the same as the previously presented block 4 (Figure 10) except that no mechanically machined notch is created so that the fracture initiated from an isolated 10 mm section of smooth wellbore. Inspection of a cross section of block 3 (Figure 12) reveals significantly different fracture behaviors from block 4. Near the wellbore the complexity of the fractures that formed indicates that breakdown was not a straightforward process. This complexity persists as the fractures grow, resulting in deviated paths and more branching than in the notched block 4. The fractures also appear to interact
Figure 10: Block 4, cut in half to reveal coalescing hydraulic fracture paths.
Figure 11: Block 6, cut in half to reveal sub-parallel fracture paths, with the exception of fracture 3 which on closer inspection may have resulted from an inadequate notch.
Figure 12: Block 3, unnotched specimen cut in half to reveal complex fracture paths.
strongly with each other. The result is a more complex fracture pattern, which some suggest may, at least under some circumstances, be beneficial to gas production (e.g. [1]). However, it is also clear that this complexity is to the detriment of uniformity; much larger sections of unfractured rock exist between the fractures in the unnotched case than in the notched cases. This loss of uniformity could be detrimental to the effectiveness of the treatment, whether the purpose is to provide access to gas reservoir rocks or to precondition an ore body to promote caving and fragmentation. We also recall from Section 4.2 that the breakdown pressure increased the most strongly and systematically from one fracture to the next in this unnotched case. Hence, preliminary evidence suggests that notching the wellbore is expected to promote both uniformity of access to the formation and lower breakdown pressures, particularly as additional fractures are created.
5. CONCLUSIONS
As both the mining and gas industries drive hydraulic fracturing to more closely spaced arrays, the interaction among these fractures is becoming an important consideration for design. Here we have limited consideration to interaction in which a previously placed fracture deviates the path of a subsequent fracture. We have therefore made use of the previously presented model of Bunger et al. [14] for both experimental design and for comparison between the results and predictions. At field scale, that is, with hydraulic fracture lengths of about 40 m and spacing of 1.25 or 2.5 m, we present a new set of minethrough data from the Cadia East project. This data demonstrates parallel growth of these closely spaced hydraulic fractures over a mapped distance of over 15 m, which is consistent with model predictions for relevant values of the governing parameters. Further consistency between model and experiment is demonstrated at the laboratory scale, with confirmation that a subsequent fracture will curve towards a previous fracture when the minimum stress is zero and that this curving is suppressed when the minimum stress is sufficiently large. These experiments, then, taken together with previous comparisons with field experimental data presented by Bunger et al. [14], provide a promising confirmation of the model’s validity.
ACKNOWLEDGMENTS
The authors thank both CSIRO and Newcrest for permission to publish. Both the laboratory and minethrough work reported in this paper were made possible by support from Newcrest Mining.
REFERENCES
1. King, G. E., 2010. Thirty years of gas shale fracturing: What have we learned? In Proceedings SPE Annual Technical Conference and Exhibition. Florence, Italy. SPE 133256.
2. Rodrigues, V. F., L. F. Neumann, D. Torres, C. Guimaraes, and R. S. Torres, 2007. Horizontal well completion and stimulation techniques - A review with emphasis on low-permeability carbonates. In Proceedings SPE Latin American and Caribbean Petroleum Engineering Conference. Buenos Aires, Argentina. SPE 108075.
3. van As, A. and R. Jeffrey, 2000. Caving induced by hydraulic fracturing at Northparkes Mines. In Pacific Rocks 2000 - Proc. 4th North American Rock Mechanics Symposium, eds. J. Girard, M. Liebman, C. Breeds, and T. Doe. Seatle, WA: Balkema, 353–360.
4. Kundert, D. and M. Mullen, 2009. Proper evaluation of shale gas reservoirs leads to a more effective hydraulic-fracture stimulation. In Proceedings SPE Rocky Mountain Petroleum Technology Conference. Denver, Colorado, USA. SPE 123586.
5. Jeffrey, R. G., A. P. Bunger, B. Lecampion, X. Zhang, Z. R. Chen, A. van As, D. Allison, W. D. Beer, J. W. Dudley, E. Siebrits, M. Thiercelin, and M. Mainguy, 2009. Measuring hydraulic fracture growth in naturally fractured rock. In Proceedings SPE Annual Technical Conference and Exhibition. New Orleans, Louisiana, USA. SPE 124919.
6. Daniels, J., G. Waters, J. LeCalvez, J. Lassek, and D. Bentley, 2007. Contacting more of the Barnett Shale through and integration of real-time microseismic monitoring, petrophysics, and hydraulic fracture design. In Proceedings SPE Annual Technical Conference and Exhibition. Anaheim, California, USA. SPE 110562.
7. Vermylen, J. P. and M. D. Zoback, 2011. Hydraulic fracturing, microseismic magnitudes, and stress evolution in the Barnett Shale, Texas, USA. In Proceedings SPE Hydraulic Fracturing Technology Conference and Exhibition. The Woodlands, Texas, USA. SPE 140507.
8. Song, B., M. J. Economides, and C. Ehlig-Economides, 2011. Design of multiple transverse fracture horizontal wells in shale gas reservoirs. In Proceedings SPE Hydraulic Fracturing Technology Conference and Exhibition. The Woodlands, Texas, USA. SPE 140555.
9. Soliman, M. Y., J. L. Hunt, and A. M. El-Raaba, 1990. Fracturing aspects of horizontal wells. J. Pet. Tech. 42(8): 966–973.
10. Sadrpanah, H., T. Charles, and J. Fulton, 2006. Explicit simulation of multiple hydraulic fractures in horizontal wells. In Proceedings SPE Europec/EAGE Annual Conference and Exhibition. Vienna, Austria. SPE 99575.
11. Brown, E. T., 2003. Block Caving Geomechanics. Brisbane: Julius Kruttschnitt Mineral Research Centre.
12. Crosby, D. G., 1999. The Initiation and Propagation of, and Interaction Between, Hydraulic Fractures from Horizontal Wellbores. Ph.D. thesis, University of New South Wales, Australia.
13. Crosby, D. G., M. M. Rahman, M. K. Rahman, and S. S. Rahman, 2002. Single and multiple transverse fracture initiation from horizontal wells. Journal of Petroleum Science and Engineering 35(3-4): 191 – 204.
14. Bunger, A. P., X. Zhang, and R. G. Jeffrey, 2011. Parameters effecting the interaction among closely spaced hydraulic fractures. In Proceedings SPE Hydraulic Fracturing Technology Conference and Exhibition. The Woodlands, Texas, USA. SPE 140426.
15. de Laguna, W., E. G. Struxness, T. Tamara, W. C. McClain, H. O. Weeren, and R. C. Sexton, 1968. Engineering development of hydraulic fracturing as a method for permanent disposal of radioactive wastes. Technical Report ORNL-4259, Oak Ridge National Laboratory, Oak Ridge, Tennessee, USA. Www.ornl.gov/info/reports/1968/3445605101608.pdf.
16. Wiley, C., B. Barree, M. Eberhard, and T. Lantz, 2004. Improved horizontal well stimulations in the Bakken Formation, Williston Basin, Montana. In Proceedings SPE Annual Technical Conference and Exhibition. Houston, Texas, USA. SPE 90697.
17. Olsen, T., E. Gomez, D. McGrady, G. Forrest, A. Perakis, and P. Kaufman, 2009. Stimulation results and completion implications from the consortium multi-well project in the North Dakota Bakken Shale. In Proceedings SPE Annual Technical Conference and Exhibition. New Orleans, Louisiana, USA. SPE 124686.
18. Zhang, X., R. G. Jeffrey, and M. Thiercelin, 2007. Deflection and propagation of fluid-driven fractures at frictional bedding interfaces: A numerical investigation. J. Struct. Geol. 29(3): 396–410.
19. Erdogan, F. and G. Sih, 1963. On the crack extension in plates under plane loading and transverse shear. J Basic Eng - T ASME 85: 519–527.
20. Buckingham, E., 1914. On physically similar systems: Illustrations of the use of dimensional equations. Physical Review 4(4): 365–376.
21. Barenblatt, G., 1996. Scaling, Self-Similarity, and Intermediate Asymptotics, volume 14 of Cambridge Texts in Applied Mathematics. Cambridge UK: Cambridge University Press.
22. Adachi, J., 2001. Fluid-Driven Fracture in Permeable Rock. Ph.D. thesis, University of Minnesota, Minneapolis, MN.
23. Detournay, E., 2004. Propagation regimes of fluid-driven fractures in impermeable rocks. Int. J. Geomechanics 4(1): 1–11.
24. Bunger, A. P., A. Lakirouhani, and E. Detournay, 2010. Modelling the effect of injection system compressibility and viscous fluid flow on hydraulic fracture breakdown pressure. In Proceedings 5th International Symposium on In-situ Rock Stress. Beijing, P.R. China.
25. Jeffrey, R. and A. P. Bunger, 2009. A detailed comparison of experimental and numerical data on hydraulic fracture height growth through stress contrasts. Soc. Pet. Eng. J. 14(3): 413–422.