Embed Size (px)
Citation preview
N A S A TECHNICAL NOTE
EXPERIMENTAL INVESTIGATION OF MACH 3 CRUISE HEATING SIMULATIONS ON A REPRESENTATIVE WING STRUCTURE FOR FLIGHT-LOADS MEASUREMENT
by Roger A. Fields, Frank V. Olinger, and Richard C, Monaghan
Flight Resemch Center Edwards, Cali$ 93523
7 '
?3+ I
N A T I O N A L AERONAUTICS AND SPACE ADMINISTRATION WASHINGTON, D. CY \MARCH 1972 t 7
https://ntrs.nasa.gov/search.jsp?R=19720012272 2018-05-16T22:28:03+00:00Z
TECH LIBRARY KAFB, NY
-.
1. Report No. 2. Government Accession No.
NASA TN D-6749 I ~~
4. Title and Subtitle EXPERIMENTAL INVESTIGATION O F MACH 3 CRUISE HEATING SIMULATIONS ON A REPRESENTATIVE WING STRUCTURE FOR FLIGHT-LOADS MEASUREMENT
7. Author(s)
Roger A. Fields, Frank V. Olinger, and Richard C. Monaghan
9. Performing Organization Name and Address
NASA Flight Research Center P. 0. Box273 Edwards, California 93523
2. Sponsoring Agency Name and Address
National Aeronautics and Space Administration Washington, D. C. 20546
l5. Supplementary Notee
16. Abstract
Illllll111111ll11Ill#lllllllllllllll111Ill OL33b8O
5. Report Date March 1972
6. Performing Organization Code
H-676 8. Performing Organization Report No.
10. Work Unit No.
126-14-18-00-24 11. Contract or Grant No.
13. Type of Report and Period Covered
Technical Note
14. Sponsoring Agency Code
Radiant heating experiments were performed in the laboratory on an instrumented multispar wing structure to investigate (1) how accurately the structural temperatures of a Mach 3 cruise-flight profile could be simulated, (2) what the effects of the heating and heating inaccuracies would be on the responses of strain-gage bridges installed on the structure, and (3) how these responses would affect flight loads measurements.
Test temperatures throughout the structure agreed well with temperatures calculated for a Mach 3 profile. In addition, temperatures produced by two identical tes ts were repeatable to less than 16 K " (+ lo F').
'Thermally induced strain-gage-bridge responses were large enough to be detrimental to a high-speed flight loads program with a goal of establishing aerodynamic loads (exclusive of thermal loads). It was shown that heating simulation can be used effectively for thermal calibration (that is, to provide corrections for a high-temperature environment), and that thermal calibration may not be needed if the simulation data a r e used to carefully select bridges and load equations.
17. Key Words (Suggested by Author(s)) 1 18. Distribution Statement
Radiant heating Heating simulation Unclassified - Unlimited Flight-loads measurement
Unclassified Unclassified ~ 40 $3.00
For Sale by the National Technical Information Service, Springfield, Virginia 22151
L
EXPERIMENTAL INVESTIGATION OF MACH 3 CRUISE HEATING SIMULATIONS ON
A REPRESENTATIVE WING STRUCTURE FOR FLIGHT-LOADS MEASUREMENT
Roger A. Fields, Frank V. Olinger, and Richard C. Monaghan NASA Flight Research Center
INTRODUCTION
A s aircraft speeds approach Mach 3, heating of the aircraft structure presents significant problems. Specifically, the heating produces thermal stress and deformations that must be taken into consideration during aircraft design.
The aerodynamic forces imposed on the lifting and control surfaces of prototype and experimental aircraft are commonly measured during flight to verify design assumptions and calculations, establish flight envelopes, and produce loads data for future aircraft de signs. These aerodynamic forces are usually determined with strain-gage bridge measurements on aircraft structures. However, the bridge responses a re also a function of inertial effects and changes in the temperature of the aircraft structure. Inertial effects can be accounted for, but the unlmown thermal responses may be significant enough to invalidate the desired loads measurements.
A successful method of simulating aerodynamically induced heating by using radiant heating was developed and tested on an x-15 horizontal stabilizer in the studies of references 1and 2. A completely accurate simulation of aerodynamic heating by this method is impracticable, however. Consequently, a comparison was made in reference 1 of the horizontal stabilizer temperatures resulting from heating simulated for an X-15 flight which reached Mach 4 . 6 3 with temperatures measured during the flight. Reference 2 presented the strain-gage-bridge responses resulting from the simulation test. Also presented was the effect of how the inaccuracies in the simulated flight temperatures would affect loads measurements i f the simulation data were used to correct flight measurements.
This report presents the results of laboratory experiments which simulated the heating that calculations indicated would be produced by a Mach 3 cruise flight profile on an X-15 wing. The primary objectives of this investigation were to (1)compare calculated Mach 3 structural temperatures with an experimental laboratory simulation of those temperatures, (2) determine the effects of laboratory simulation e r ro r s on the strain-gage-bridge outputs, and (3) evaluate the effect of temperature on flight-loads measurement.
The heating during these tests was significantly different from that reported in references 1and 2. The tests on the horizontal stabilizer were characterized by high heating rates and high maximum temperatures (645' K (700° F));the tests on the wing were characterized by low heating rates and long-term heating that correspond

to the cruise portion of a Mach 3 flight. The wing, which was multispar, also represented a different type of structure than the stabilizer, which had only one spar.
SYMBOLS
Physical quantities in this report are given in the International System of Units (SI) and parenthetically in U. S. Customary Units. The measurements were taken and the calculations were made in U. S. Customary Units. Factors relating the two systems are presented in reference 3; those used herein a re given in the appendix.
C wing chord length, meters (feet)
h altitude , meters (feet)
M Mach number
dynamic pressure, newtons/square meter (pounds force/square foot)
T temperature, degrees Kelvin (degrees Fahrenheit)
t time, seconds
X distance from leading edge, meters (feet)
Q! angle of attack, degrees
6 strain-gage-bridge output
6cal strain-gage-bridge output due to shunt calibration resistor
60 data reference (zero) for strain-gage bridges
Subsc ript s:
r root
m midspan
S substructure
t tip
W wall or skin
2
TEST SETUP
Test Article
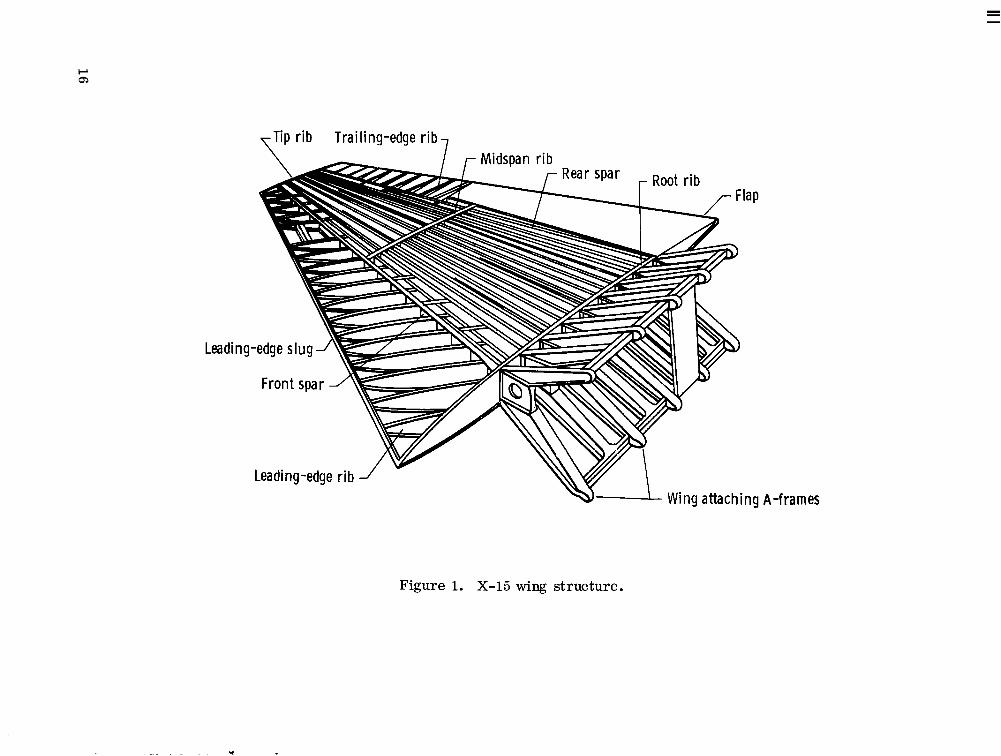
The X-15 wing is a short-span, thin, tapered, low-aspect-ratio, multispar structure. The wing (fig. 1)has three main ribs: a root rib, a midspan rib, and a tip rib. There are 17 spars between the root rib and the midspan r ib and nine spars between the midspan rib and the tip rib. The spars between the root and midspan r ibs contain corrugated webs. The wing structure forward of the front spar and rearward of the rear spar is of conventional r ib construction; the ribs forward of the front spar, however, have corrugated webs. The leading edge is a segmented slug o r heat sink having a constant radius. The wing-to-fuselage attachment consists of five A-frame assemblies which are an integral part of the wing.
The wing skins, tip rib, front spar, and structure forward of the front spar are constructed of Inconel X; the remainder of the wing structure is of a titanium alloy.
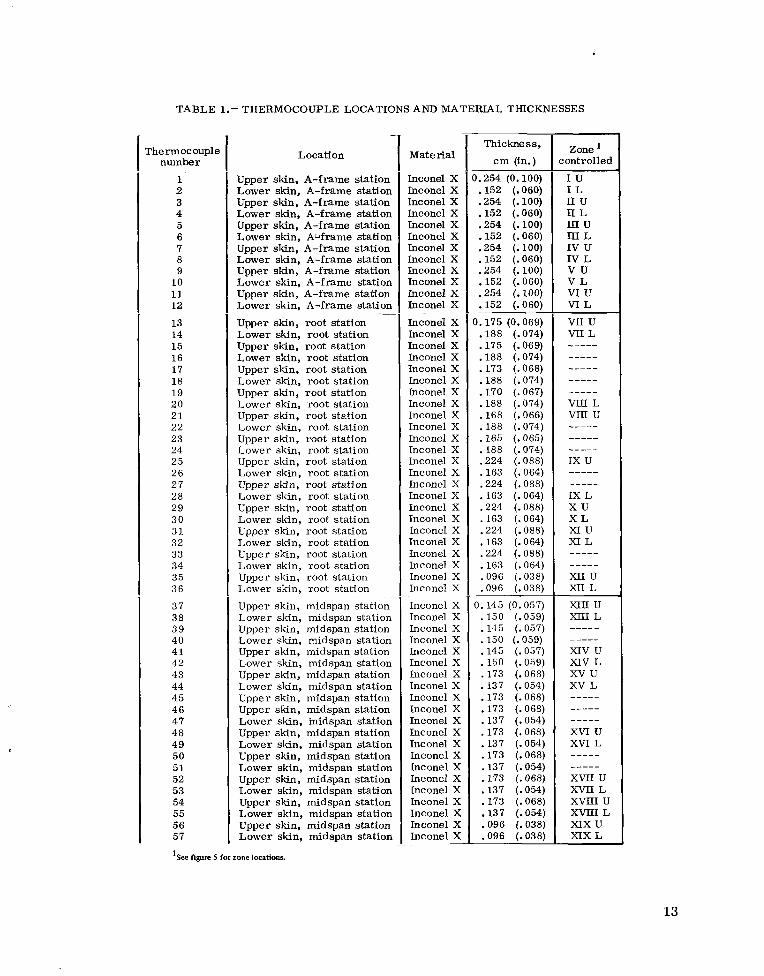
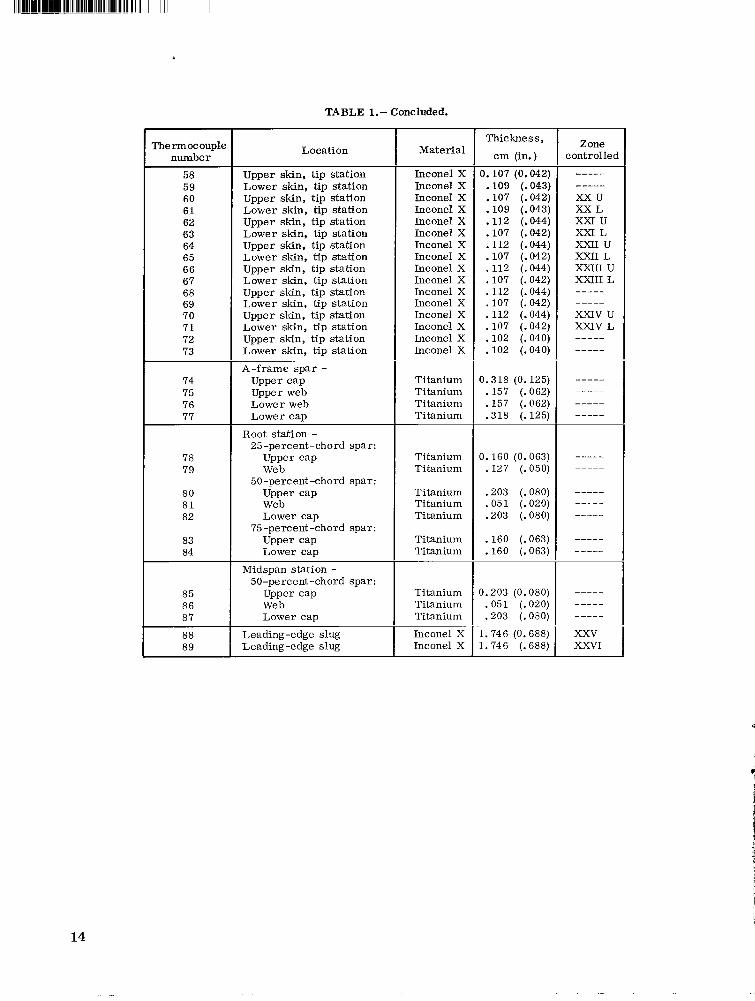
Instrumentation
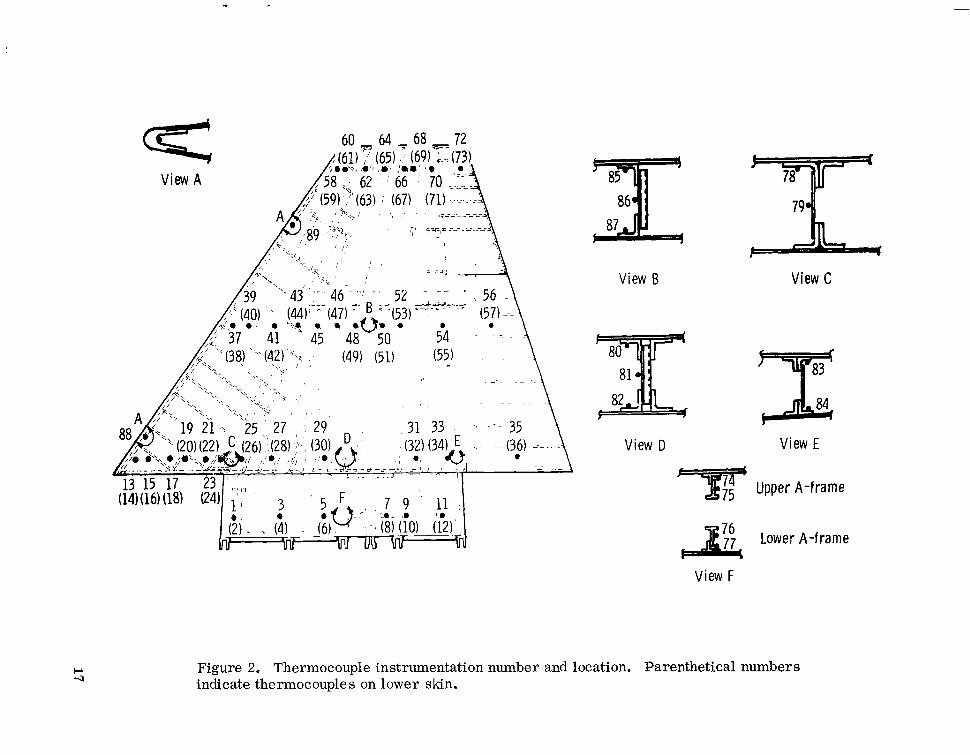
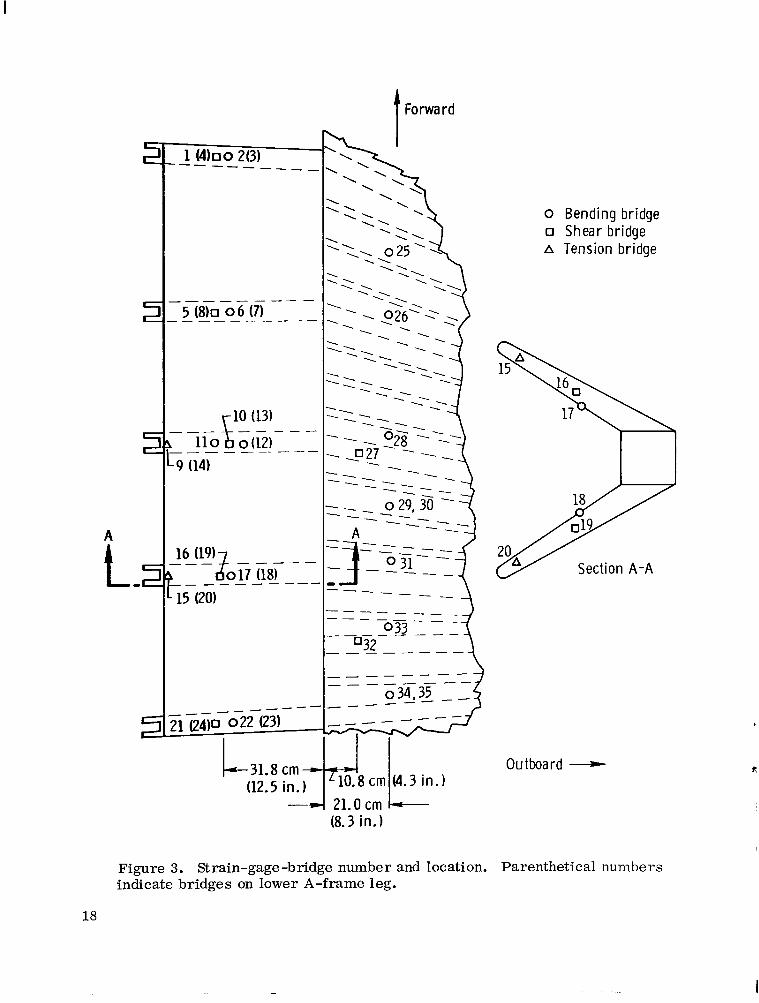
The wing was instrumented' with 89 thermocouples (fig. 2) at four main stations: A-frame, root, midspan, and tip. The wing-material thickness and type at each thermocouple location a r e tabulated in table 1. Strain gages were installed on the wing at two stations (A-frame and root) as shown in figure 3. The gages were installed and wired to form shear, bending, and tension bridges. The strain gages that formed bending bridges at the root station were weldable types; the other strain gages were bonded-foil types.
The thermocouple and strain-gage-bridge data were recorded on the 1200-channel digital data-acqui sition system of the High Temperature Loads Calibration Laboratory (ref. 4)of the Flight Research Center. The system has measurement ranges as sensitive as *5 millivolts full scale with a resolution of 2.5 microvolts.
Heating Equipment
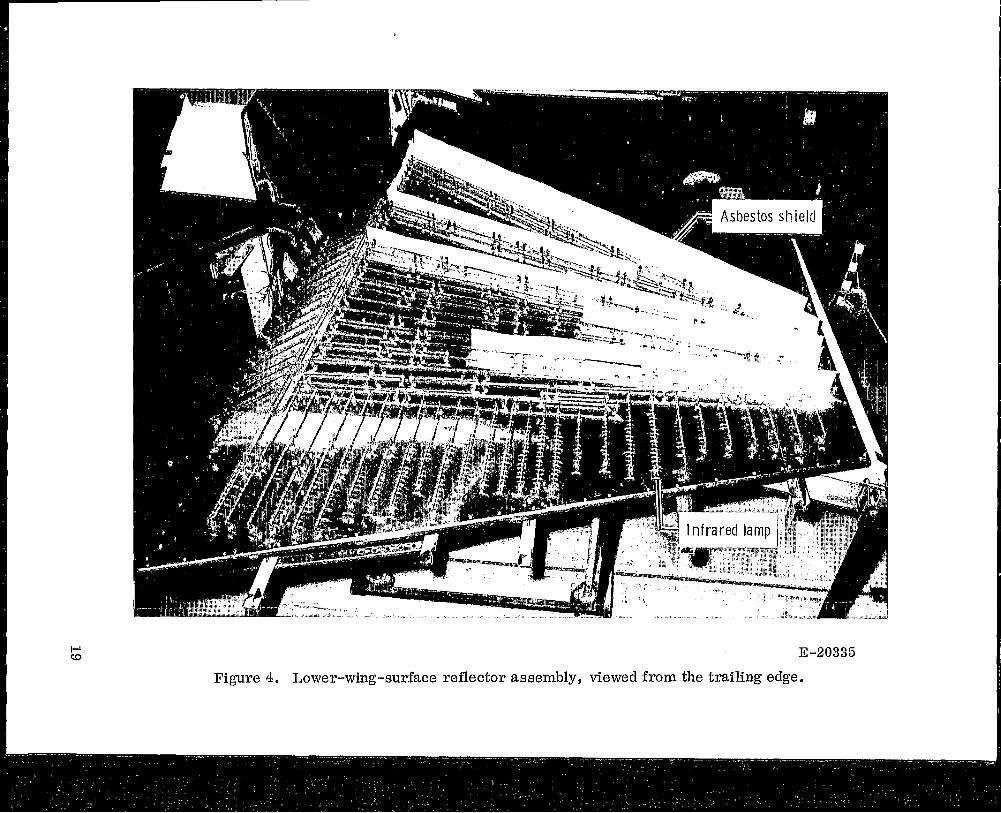
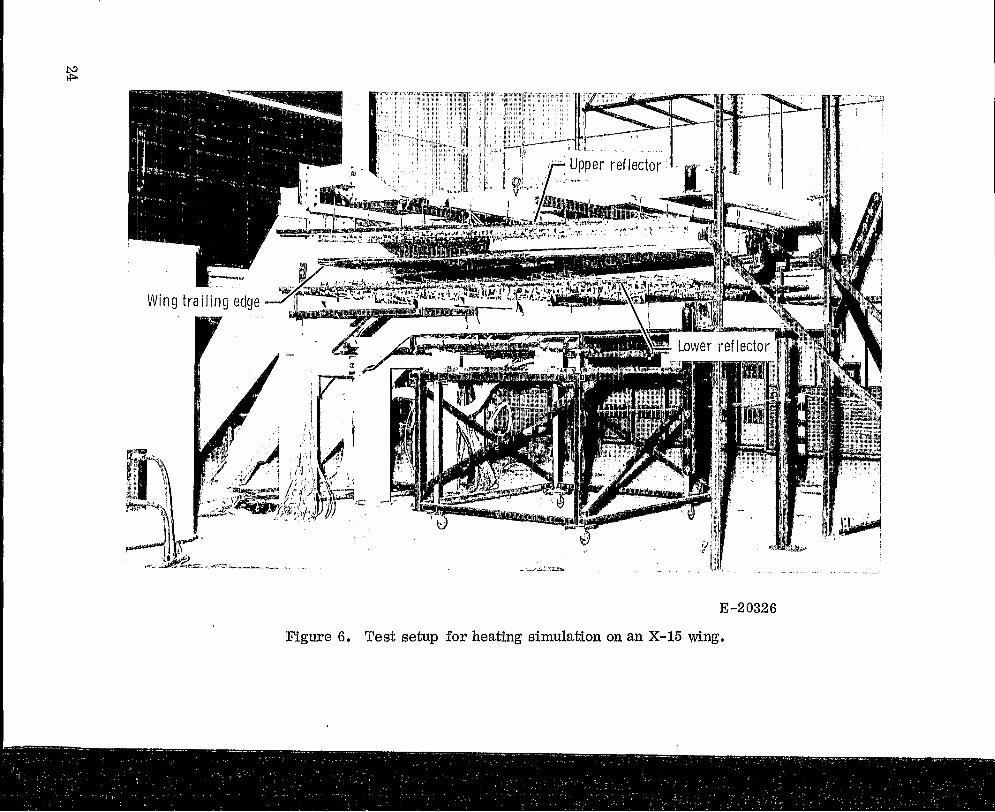
The system used to heat the wing was similar to that used in the X-15 horizontal-stabilizer tests (refs. 1and 2). Infrared heating lamps were mounted on polished stainless-steel reflectors of the same shape and contour as the wing. Figure 4 shows the lower-wing-surface reflector assembly from the trailing edge. The heating lamps were oriented parallel to the leading edge and the spars on the forward portion of the reflector so that the most rapidly changing temperatures could be more closely simulated. The lamps on the aft portion of the reflector were oriented parallel to the aft wing and flap ribs. A separate heater was constructed and attached to the upper-wingsurface reflector to provide additional heating on the wing leading-edge slug.
'The instrumentation, except for that on the A-frame, was installed many years before the tests discussed in this report.
3
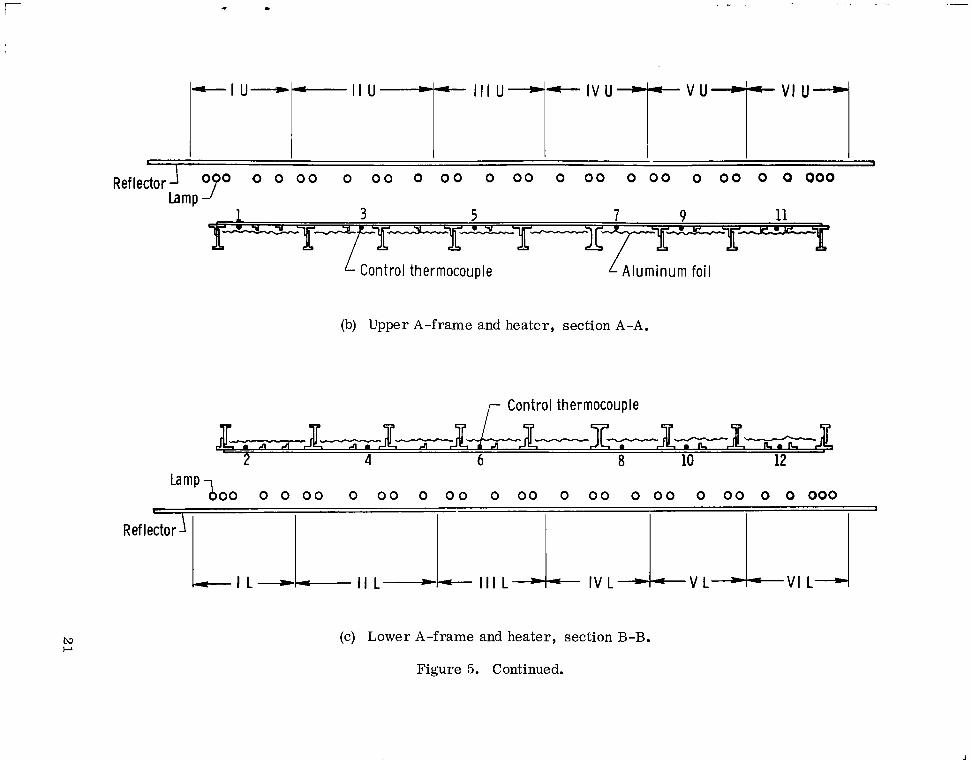
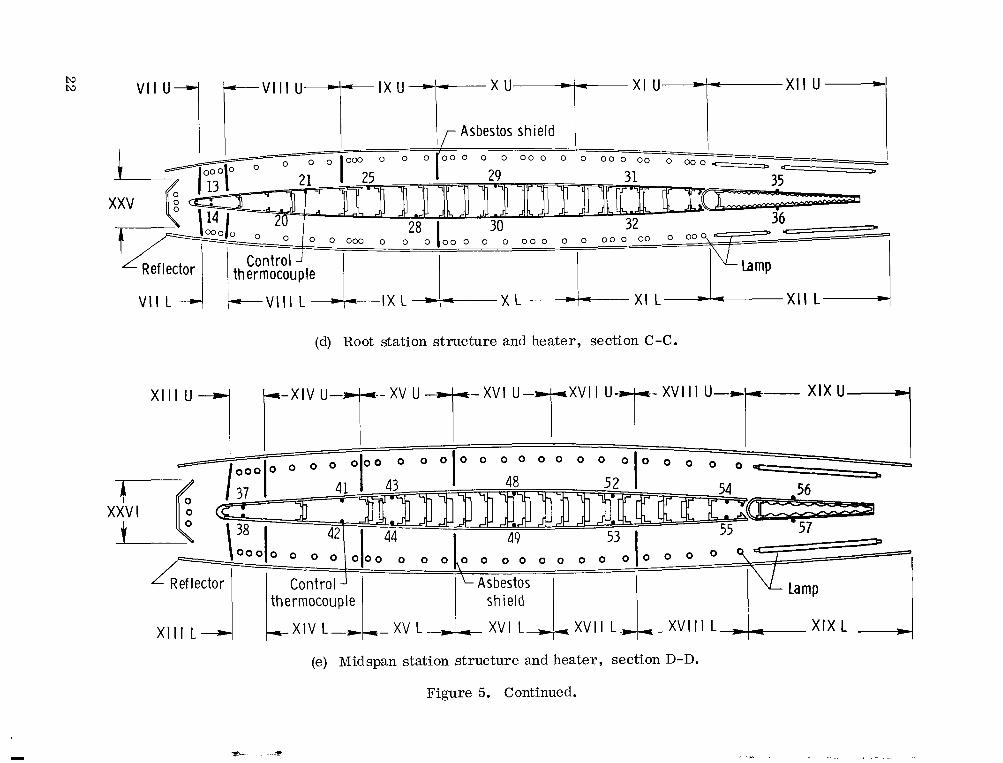
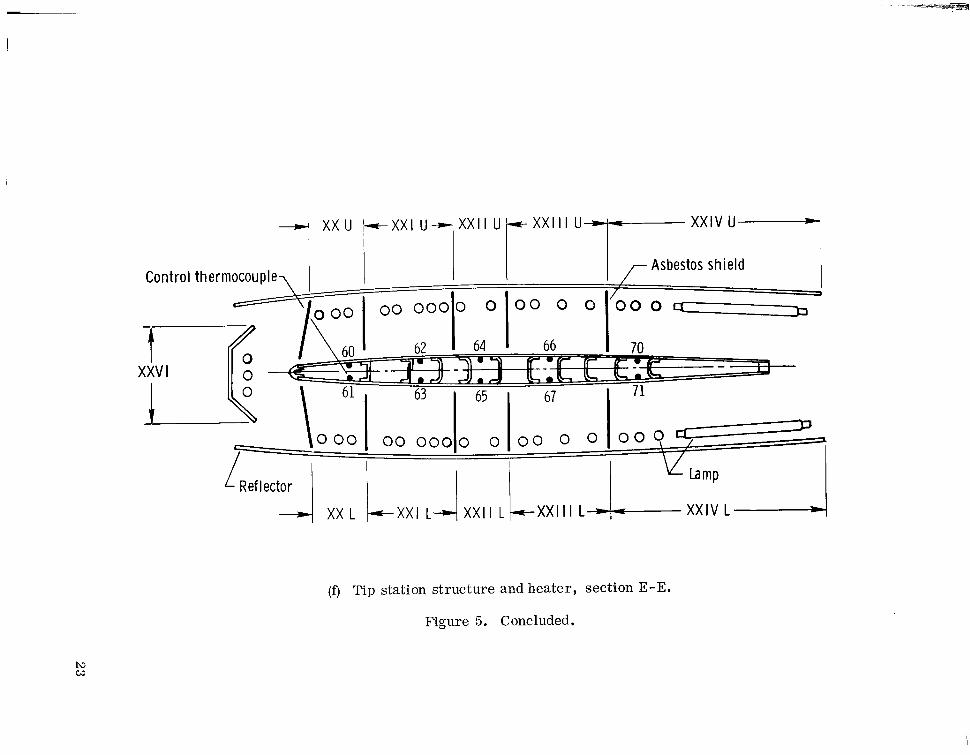
The heating lamps were grouped into zones as shown in figures 5(a) to 5(f); each zone1 was controlled independently by a closed-loop system which used the temperature indicated by a thermocouple in that zone as feedback. The temperature in each zone was maintained by the lamps according to a preprogramed temperature time history.
Figure 6 shows the overall test setup; the trailing edge of the wing is shown sandwiched between the upper- and lower-surface heaters. The wing-surface-toreflector distance is approximately 16 centimeters (6 inches).
TEMPERATURE CALCULATION AND HEATER DEVELOPMENT
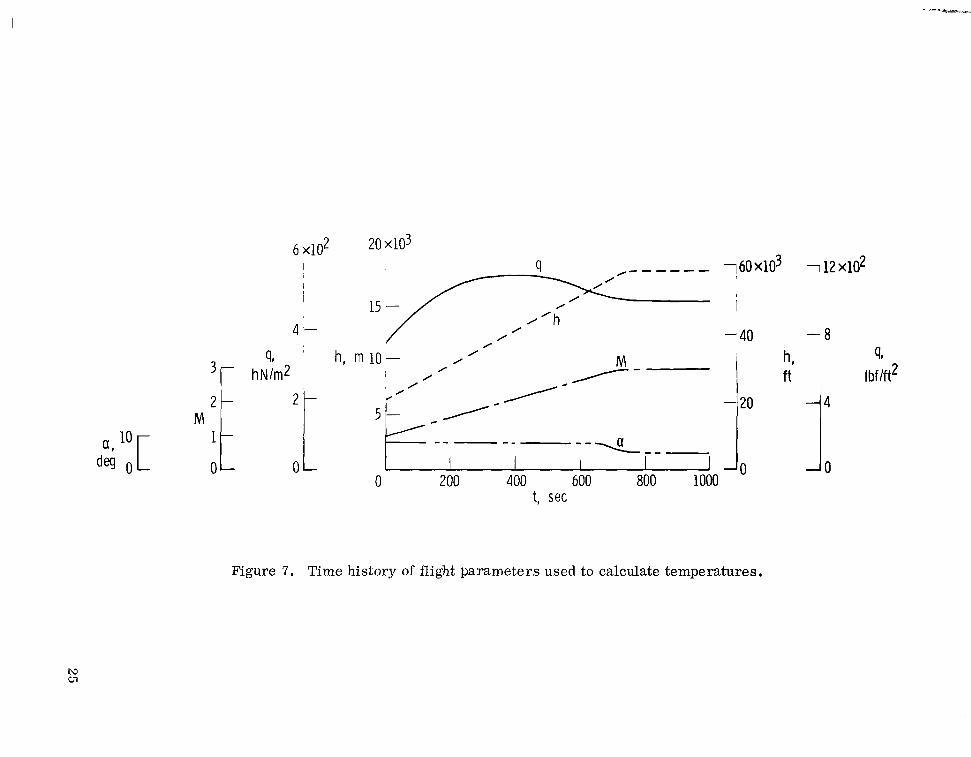
Figure 7 shows the assumed time histories of the flight parameters used to calculate skin temperatures. The flight parameters were considered to be constant beyond 1000 seconds. Only the supersonic portion of the flight profile is shown because aerodynamic heating is negligible for subsonic flight. The structure was assumed to have a uniform temperature of 294" K (70° F) until aerodynamic heating caused an increase, although some cooling to a lower temperature may be encountered in an actual flight. Zero time was taken as the beginning of supersonic flight and corresponds to the beginning of the simulation in the loads laboratory.
Skin temperatures were calculated using the theory of van Driest (ref. 5) and assuming turbulent flow from the leading edge.
Substructure temperatures were calculated by a computer program (thermal analyzer, ref. 6) which used a finite differencing technique to calculate the transient response through the structure. The simplifying assumptions used in the analysis were that: (1)heat conduction was two-dimensional (i.e., without spanwise conduction) and without joint resistance; (2 ) there was no radiation interchange between the skin and spar webs at the attachment structure station (this assumption was made because aluminum foil with fiber glass insulation was placed near the skin and between each spar); and (3) for purposes of approximating internal radiation at the root and midspan stations, all surfaces which exchanged radiation (skin and webs) had an angle geometry factor of 0.14 and an effective emissivity of 0.76.
Chordwise temperature distribution was determined from the calculated temperatures. A preliminary lamp arrangement was used in a lamp flux computer program (ref. 1, appendix C) to determine whether the arrangement would provide the desired I
heating distribution. The lamp arrangement was then modified until the desired heating distribution was obtained for a uniform heat sink. Since the wing structure does not represent a uniform heat sink, the additional heating required by the substructure was provided by concentrating the lamps over the beam caps.
Ii
A control thermocouple was selected for each control zone, and the calculated temperature time history was programed as described in reference 1. E
fi
'U following zone number refers to upper reflector zone; L refers to lower zone. Upper and lower zones were identical. i
4
J
.. .
PRELIMINARY TESTING
Strain-Gage Calibration
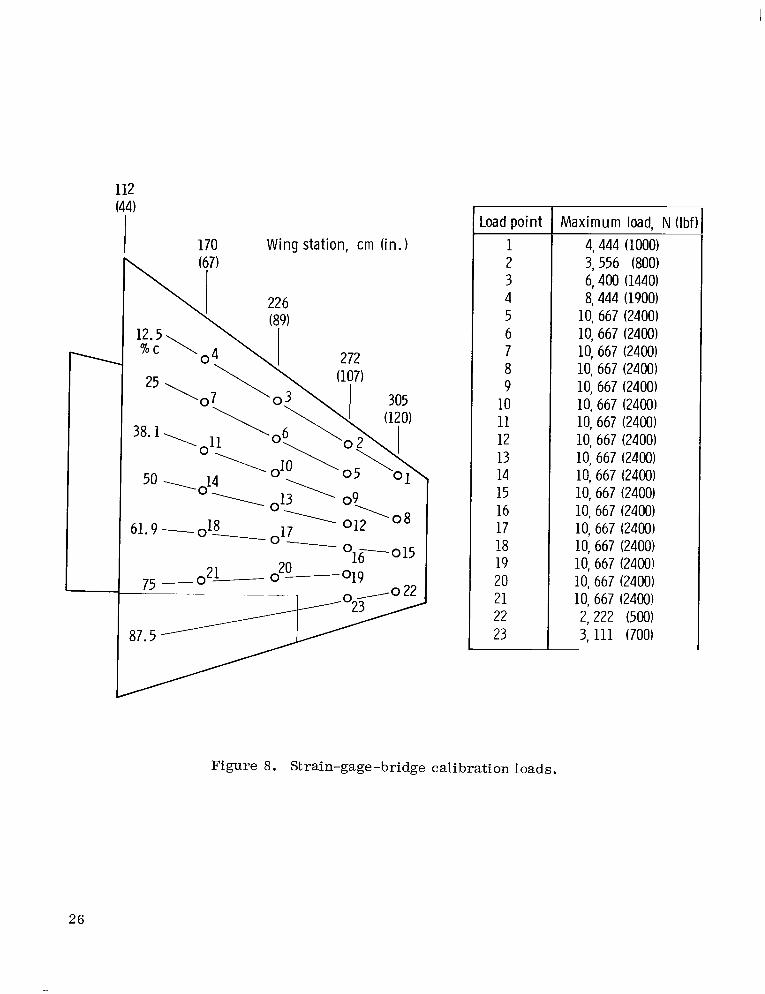
The strain-gage outputs were calibrated for load by applying a series of single-point loads as shown in figure 8. The loads were applied with a hydraulic actuator through a 30-centimeter by 61-centimeter (12-inch by 24-inch) compression load pad. The loads were applied continuously from zero to maximum load and back to zero; the loads and the corresponding strain-gage outputs were recorded simultaneously during the loadings.
Data from the loads calibration were then used in a computer program to calculate coefficients for a large number of shear, bending, and torque equations. The program for deriving these equations was based on the methods of reference 7.
Heating
Preliminary heating tes ts indicated a need for shields between several zones to prevent cross talk.' The need was revealed when several control thermocouples were heated beyond programed temperatures.
Installation of asbestos shields corrected the cross talk problem, but the simulation temperatures measured within each zone by thermocouples other than control thermocouples still showed discrepancies with calculated temperatures. Because heating was simulated by radiation, the uniformity of the test surface emissivity would affect the amount of heat absorbed by the skin.
Figure 9(a) shows the nonuniformity of the wing-surface finish. The inboard portion of the wing had a less uniform surface finish than the outboard portion. Correspondingly, the greatest discrepancies were in the root and midspan zones during the preliminary tests.
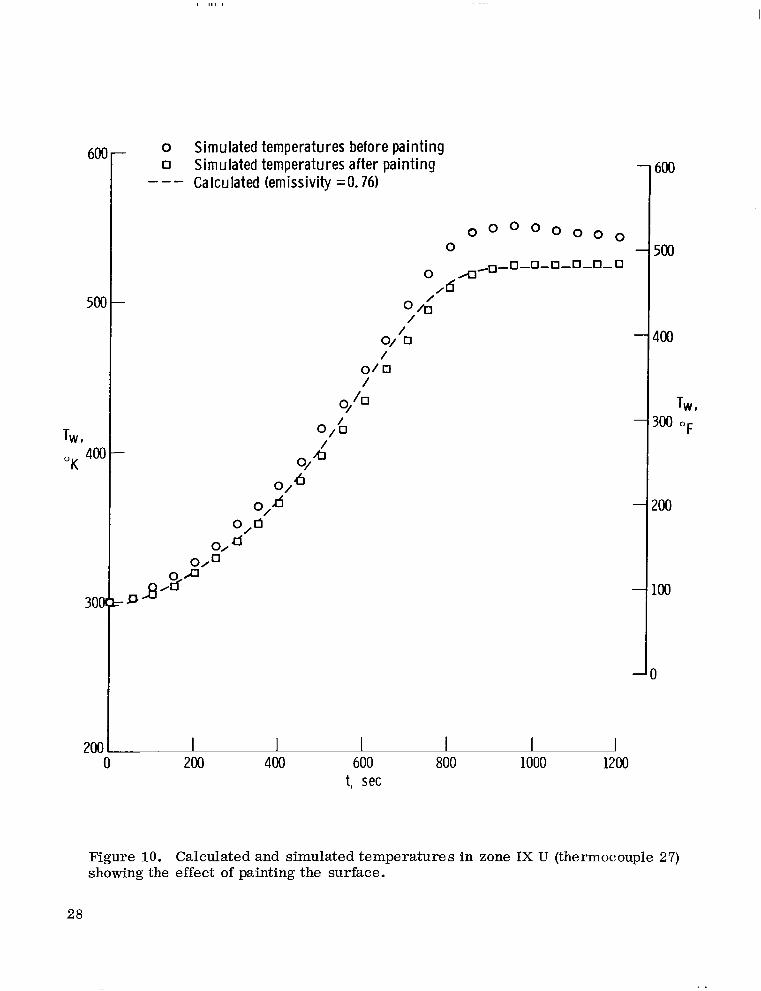
Figure 9(b) shows the wing after i t was painted, and figure 10 shows the effect of the painted surface on measured temperatures. Before painting, control thermocouple 25 was in an a rea with a higher reflectivity than the area in which thermocouple 27 was located. Because the control thermocouple required additional radiant heating to overcome the heat lost by reflection, thermocouple 27 overheated a s shown in figure 10. In other zones, where the control thermocouple was in an area of lower reflectivity than another thermocouple , the situation was reversed. Similar improvement was obtained by painting the surface to obtain uniform emissivity.
In addition to the discrepancies caused by cross talk and surface nonuniformity, preliminary tests showed different trends for noncontrol thermocouples in zone VIII U and zone VI11 L. The upper-surface thermocouples measured higher temperatures than the lower-surface thermocouples. The reflectors were symmetrical , and there - . _. -
'A conditioncaused by a control thermmouple being at a higher temperature than programed because of heating from outside
the subject zone. This causes the power to the zone tamps to remain off until the measured temperature becomes kas than that
programed.
5
were only small differences between the upper and lower skin and spar cap thicknesses, thus the same temperature should have been measured on both surfaces. X-ray photographs of the wing structure in zones VIII U and VIII L showed that the upper-surface control thermocouple was on the skin adjacent to a spar cap, whereas the lower-surface control thermocouple was on the skin midway between the substructure. A different thermocouple was selected as the control thermocouple for the upper surface, which corrected the discrepancy between the upper and lower surfaces. However, the lower-surface thermocouples in zone VIII L nearest the 25-percent-chord spar continued to measure lower temperatures than the thermocouple i n zone IXL nearest the 25-percentchord spar. Consequently, the shield separating zones VI11 L and IX L was removed, which allowed heating resulting from cross talk to raise temperatures in zone VIII L and lower them in zone IX L, Removing the shield did not correct the discrepancy entirely. No further attempt was made to improve the simulation in zones VI11 L and IX L, although the use of precisely located external control thermocouples would have improved the simulation.
TEST PROCEDURE
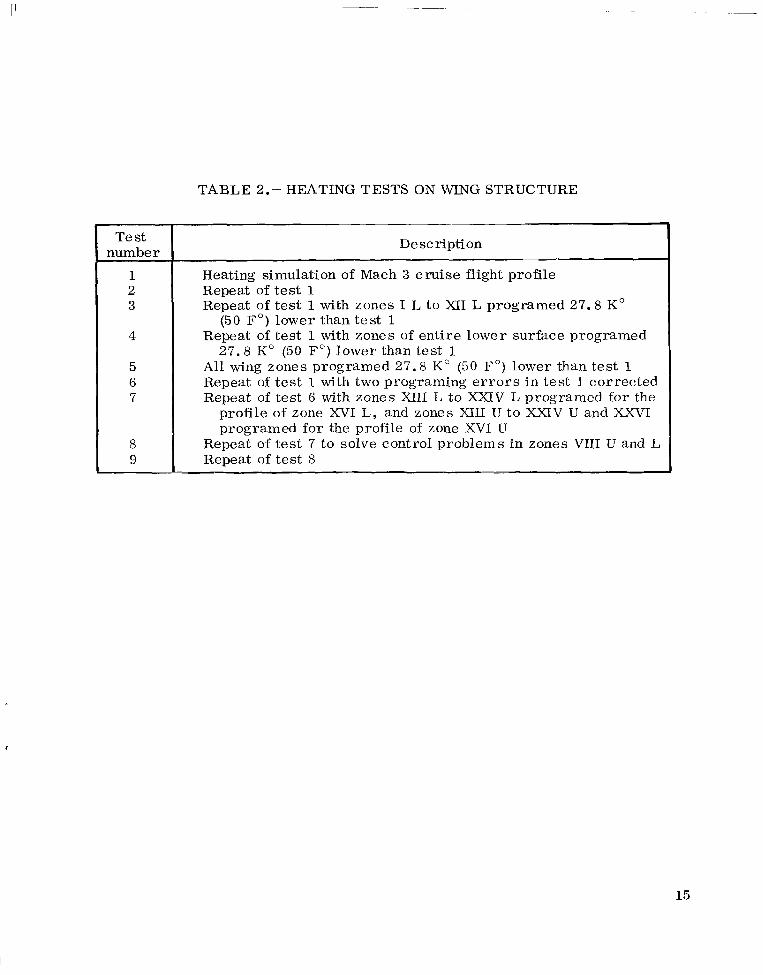
After specific problems had been identified and corrected insofar as possible with a reasonable amount of effort, testing to obtain data was started. Table 2 l ists the heating tests. The first two tests simulated the Mach 3 cruise flight profile. No changes were made in the test setup or the control and recording equipment between these tests in order to establish the repeatability of the tests. The tests consisted of transient heating from approximately 294" K (70" F) to maximum surface temperatures of 500' K to 550° K (440' F to 530" F) in 900 seconds to 1000 seconds and then holding at these temperatures for 800 seconds or until equilibrium was reached. This profile simulated the heating during acceleration to Mach 3 and a portion of supersonic cruise at Mach 3 .
Following these tests, three tests were conducted in which the programed temperature time histories were altered to provide strain-gage-bridge responses to potential testing inaccuracies in the heating simulation. The first (test 3) was the same as the previous two tests except that the maximum temperatures on the lower wing root and A-frame areas were reduced by 27.8 KO (50 F O ) . During test 4, the maximum temperatures on the entire lower wing surface were reduced by 27.8 KO (50 F O ) . All the programed maximum temperatures over the entire wing were reduced by 27.8 KO
(50 Fo)during test 5.
Test 6 was a repetition of test 1to correct two zone profiles which had been slightly in error .
In test 7 the programed temperatures of the wing root and A-frame zones were the same as those of test 6; the remaining upper wing surface zones were programed for the heating of zone XVI U, and the remaining lower wing surface zones were programed for the heating of zone XVI L.
Tests 8 and 9 were essentially repetitions of test 7 with slight modifications in an attempt to solve control problems in zones VIII U and L.
6
RESULTS AND DISCUSSION
Temperatures
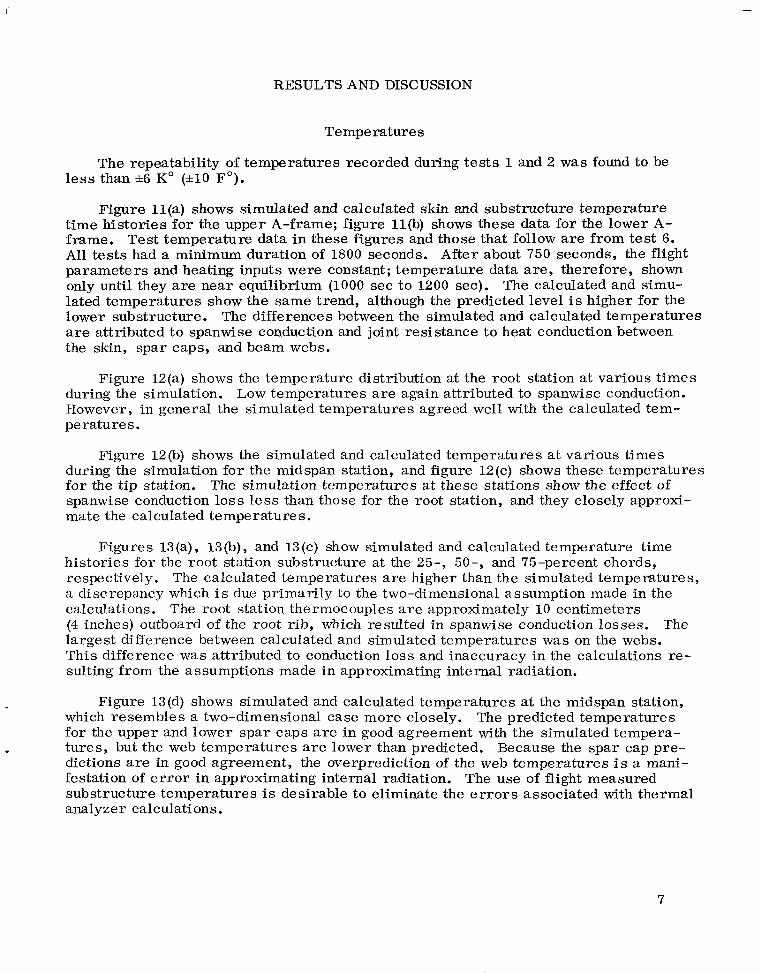
The repeatability of temperatures recorded during tests 1and 2 was found to be less than *6 KO (*lo F O ) .
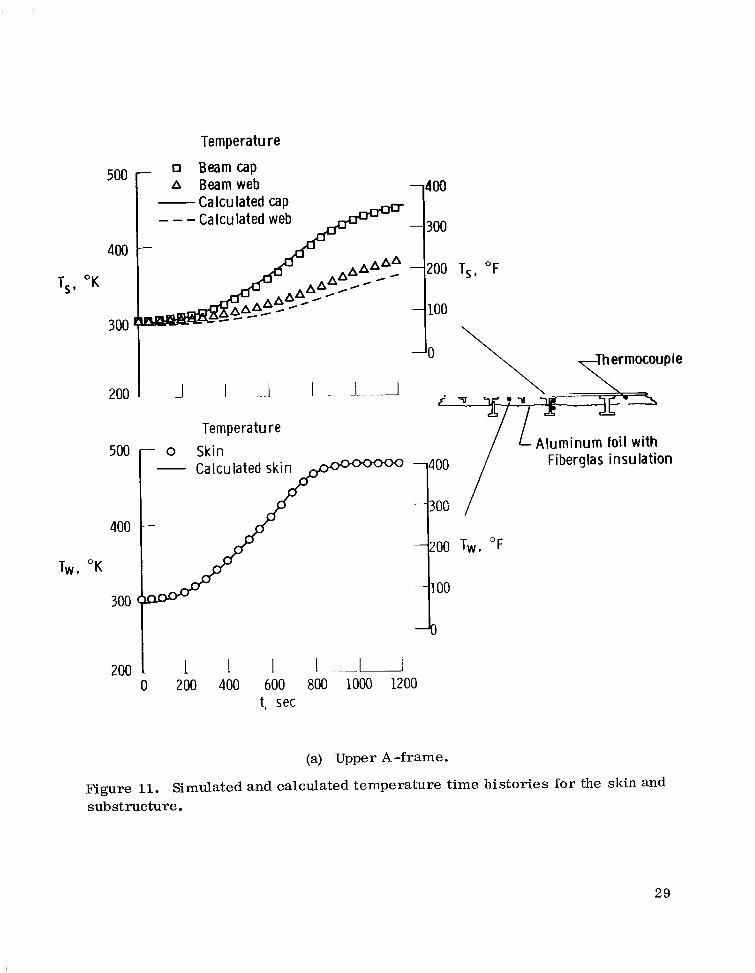
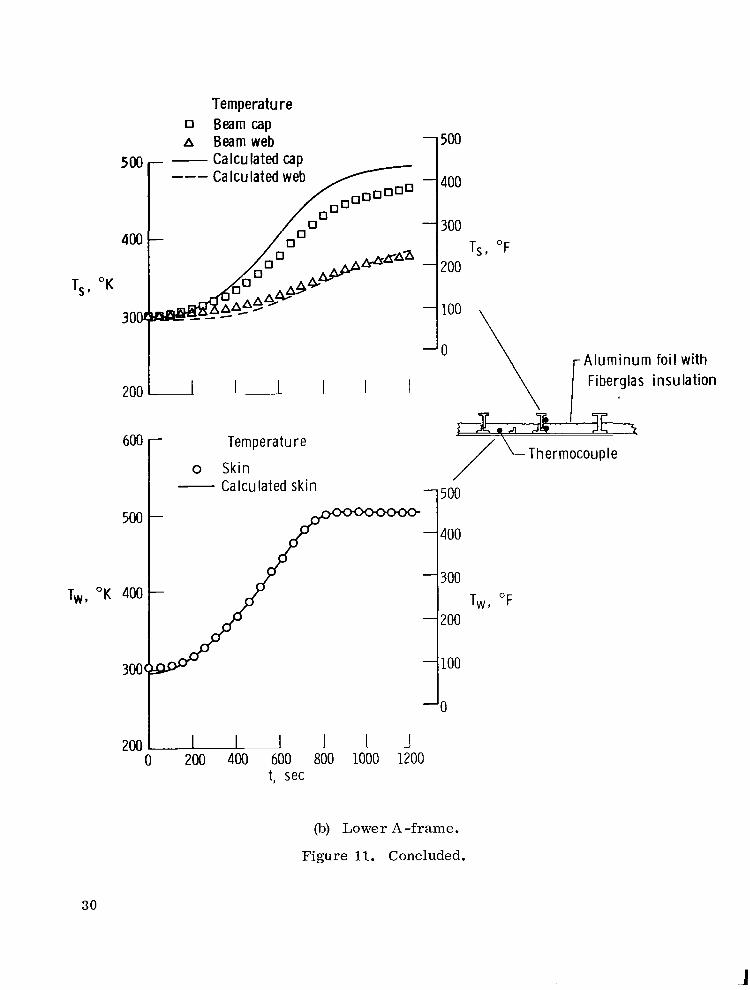
Figure ll(a) shows simulated and calculated skin and substructure temperature time histories for the upper A-frame; figure ll(b) shows these data for the lower A-frame. Test temperature data in these figures and those that follow a re from test 6. All tests had a minimum duration of 1800 seconds. Af te r about 750 seconds, the flight parameters and heating inputs were constant; temperature data are, therefore, shown only until they are near equilibrium (1000 sec to 1200 sec). The calculated and simulated temperatures show the same trend, although the predicted level is higher for the lower substructure. The differences between the simulated and calculated temperatures are attributed to spanwise conduction and joint resistance to heat conduction between the skin, spar caps, and beam webs.
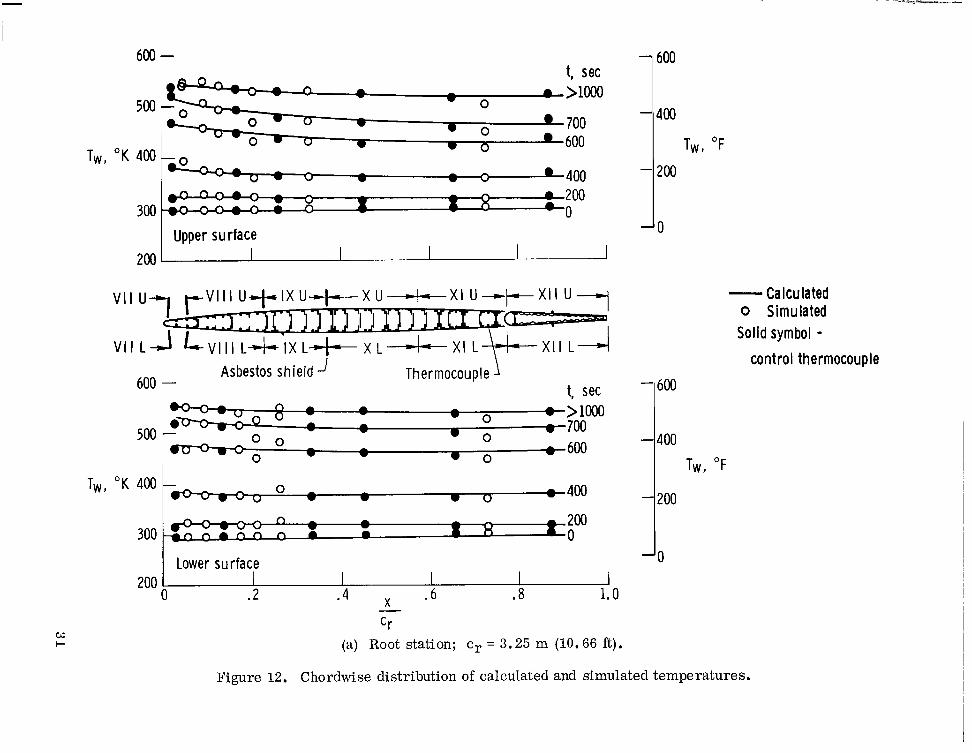
Figure 12(a) shows the temperature distribution at the root station at various times during the simulation. Low temperatures are again attributed to spanwise conduction. However, in general the simulated temperatures agreed well with the calculated temperatures.
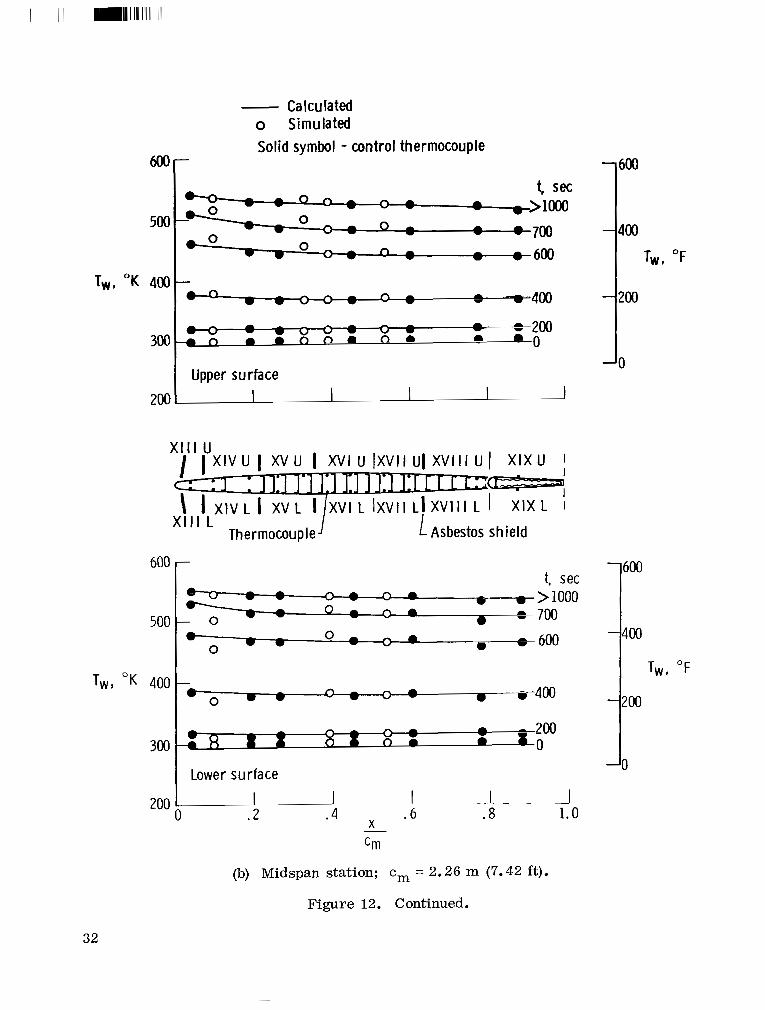
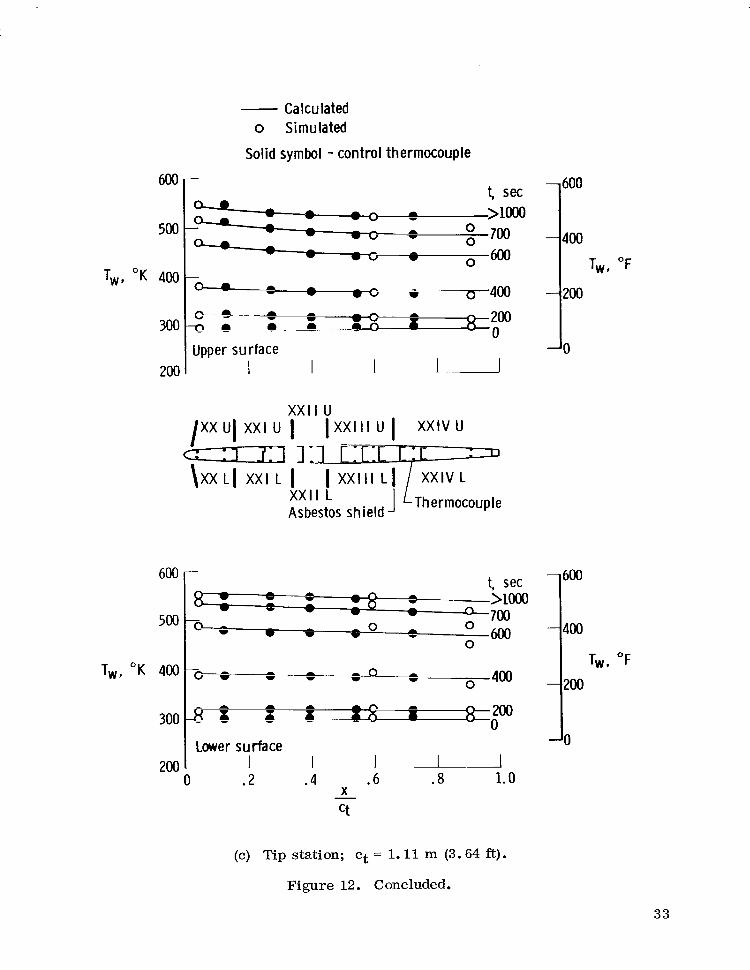
Figure 12@) shows the simulated and calculated temperatures at various times during the simulation for the midspan station, and figure 12(c) shows these temperatures for the tip station. The simulation temperatures at these stations show the effect of spanwise conduction loss less than those for the root station, and they closely approximate the calculated temperatures.
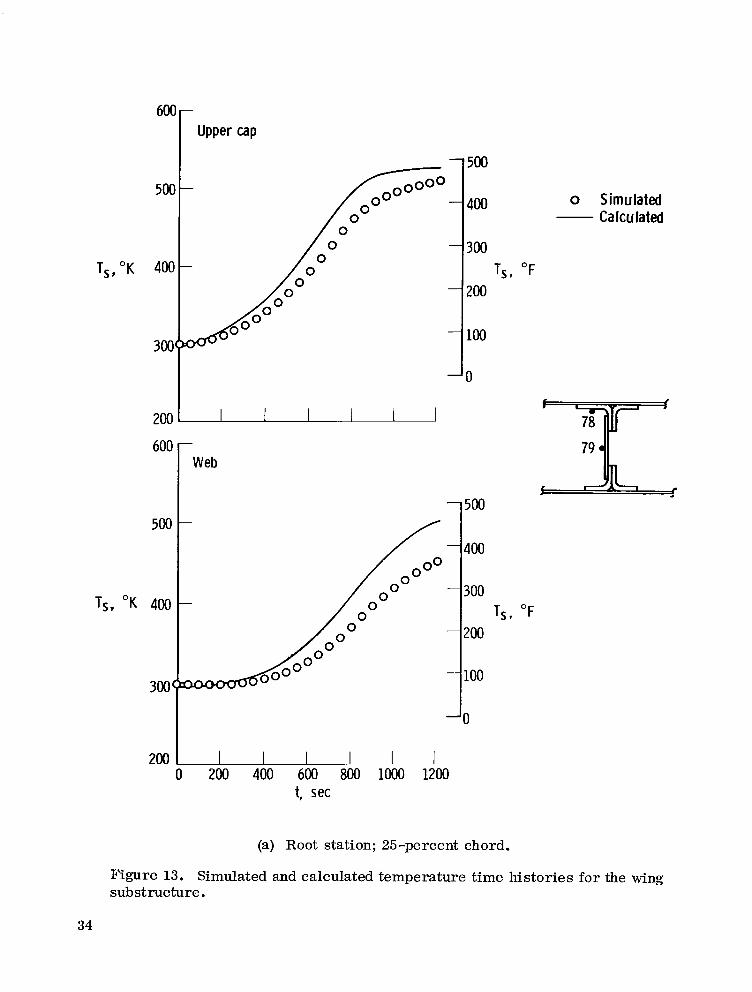
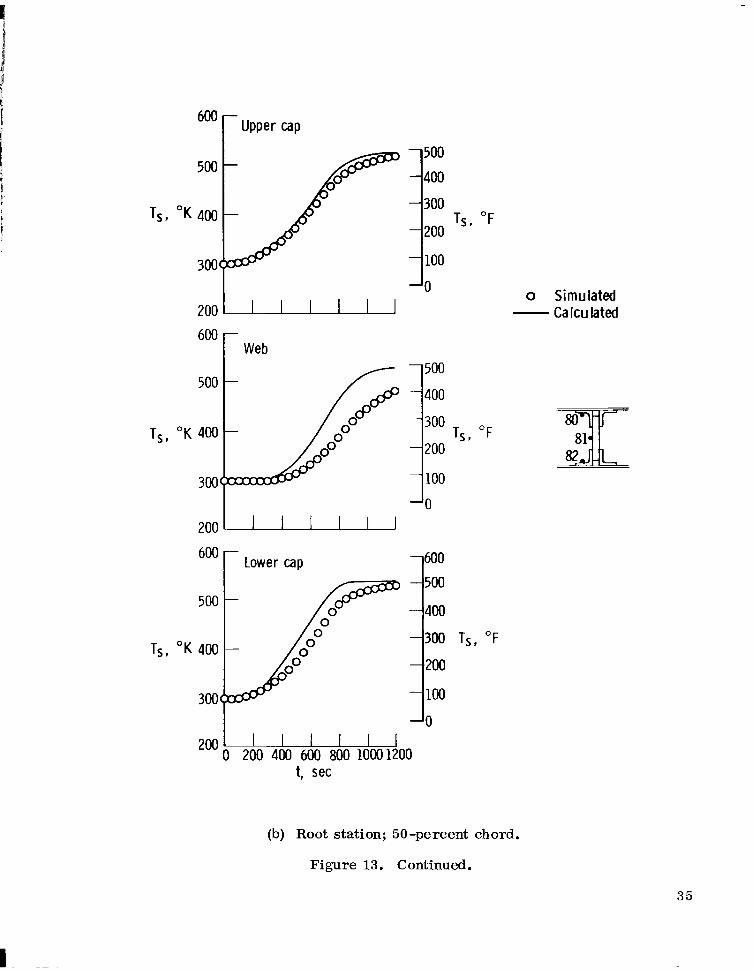
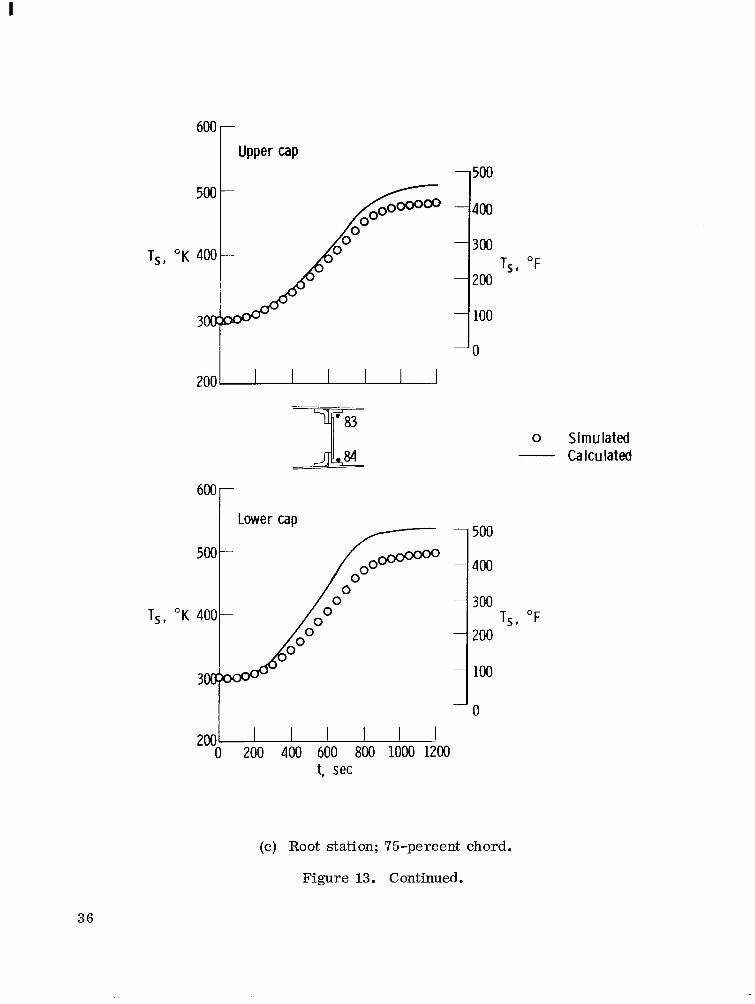
Figures 13(a), 13(b), and 13(c) show simulated and calculated temperature time histories for the root station substructure at the 25-, 50-, and 75-percent chords, respectively. The calculated temperatures are higher than the simulated temperatures, a discrepancy which is due primarily to the two-dimensional assumption made in the calculations. The root station thermocouples are approximately 10 centimeters (4 inches) outboard of the root rib, which resulted in spanwise conduction losses. The largest difference between calculated and simulated temperatures was on the webs. This difference w a s attributed to conduction loss and inaccuracy in the calculations resulting from the assumptions made in approximating internal radiation.
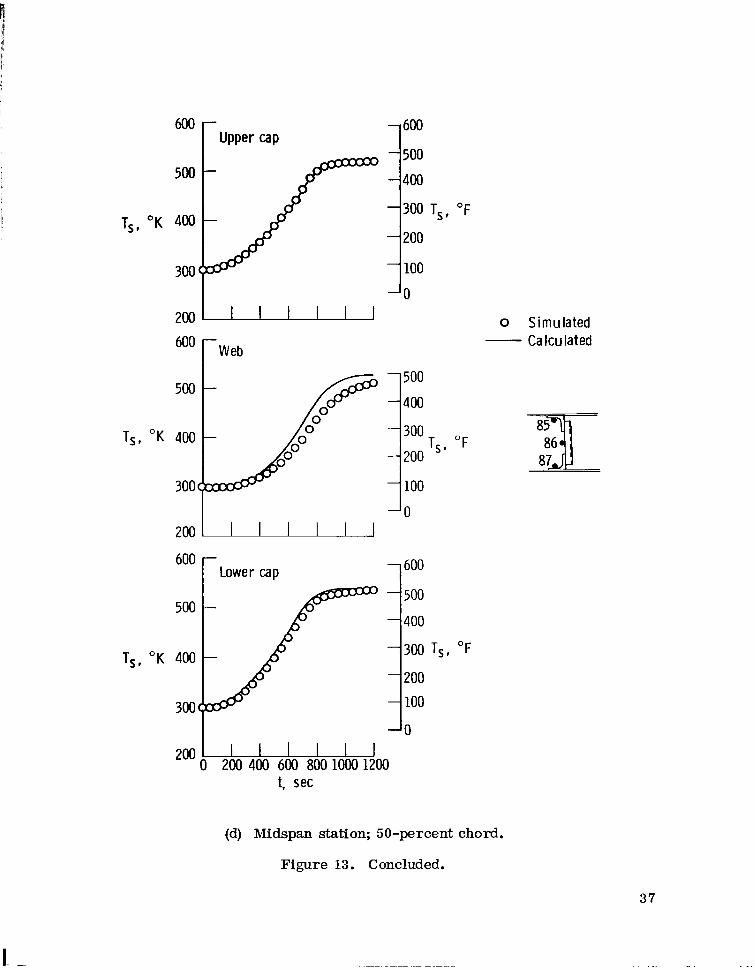
Figure 13(d) shows simulated and calculated temperatures at the midspan station, which resembles a two-dimensional case more closely. The predicted temperaturesfor the upper and lower spar caps are in good agreement with the simulated temperatures, but the web temperatures are lower than predicted. Because the spar cap predictions are in good agreement, the overprediction of the web temperatures is a manifestation of e r ro r in approximating internal radiation. The use of flight measured substructure temperatures is desirable to eliminate the e r r o r s associated with thermal analyzer calculations.
7
-- - - - - -
Strain-Gage Bridges
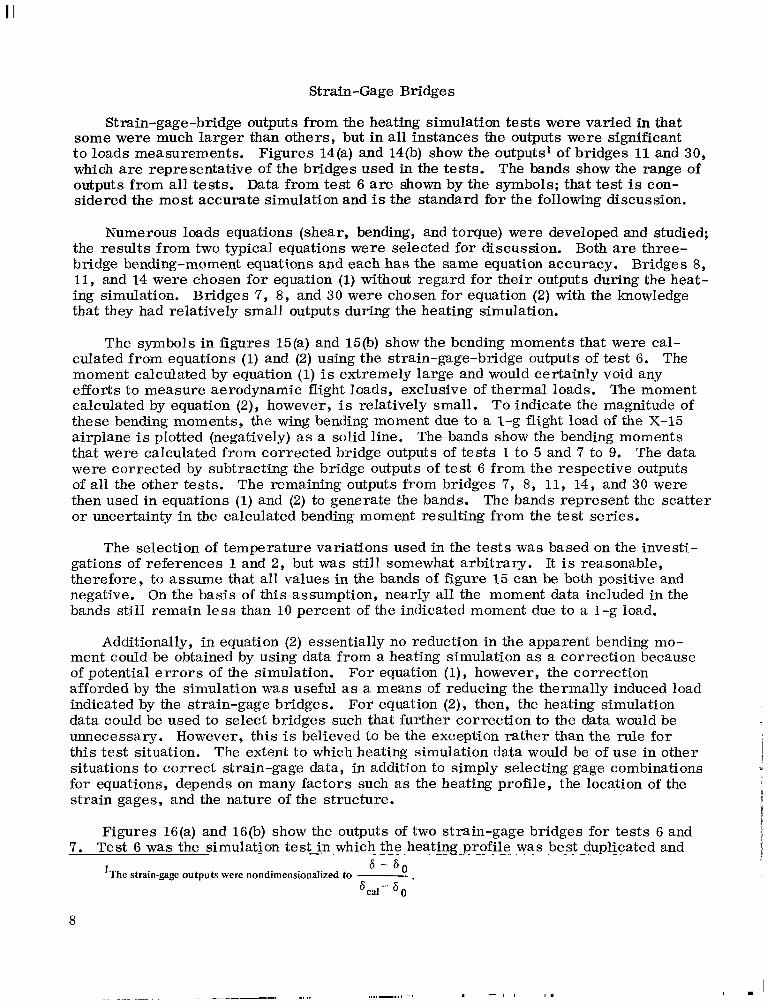
Stmin-gage-bridge outputs from the heating simulation tests were varied in that some were much larger than others, but in all instances the outputs were significant to loads measurements. Figures 14(a) and 14(b) show the outputs1 of bridges 11and 30, which a re representative of the bridges used in the tests. The bands show the range of outputs from all tests. Data from test 6 a re shown by the symbols; that test is considered the most accurate simulation and is the standard for the following discussion.
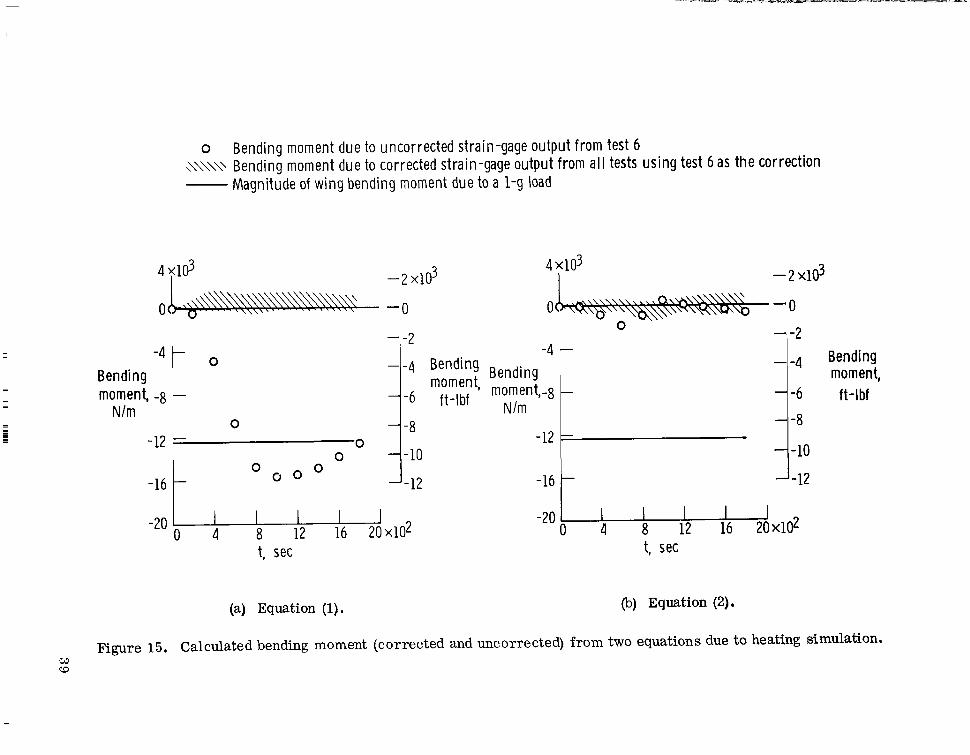
Numerous loads equations (shear, bending, and torque) were developed and studied; the results from two typical equations were selected for discussion. Both a re three-bridge bending-moment equations and each has the same equation accuracy. Bridges 8, 11, and 14 were chosen for equation (1)without regard for their outputs during the heating simulation. Bridges 7, 8, and 30 were chosen for equation (2) with the knowledge that they had relatively small outputs during the heating simulation.
The symbols in figures 15(a) and 15(b) show the bending moments that were calculated from equations (1)and (2) using the strain-gage-bridge outputs of test 6. The moment calculated by equation (1)is extremely large and would certainly void any efforts to measure aerodynamic flight loads, exclusive of thermal loads. The moment calculated by equation (2), however, is relatively small. To indicate the magnitude of these bending moments, the wing bending moment due to a l-g flight load of the X-15 airplane is plotted (negatively) as a solid line. The bands show the bending moments that were calculated from corrected bridge outputs of tests 1to 5 and 7 to 9. The data were corrected by subtracting the bridge outputs of test 6 from the respective outputs of all the other tests. The remaining outputs from bridges 7, 8, 11, 14, and 30 were then used in equations (1)and (2) to generate the bands. The bands represent the scatter or uncertainty in the calculated bending moment resulting from the test series.
The selection of temperature variations used in the tests was based on the investigations of references 1and 2, but was still somewhat arbitrary. It is reasonable, therefore, to assume that all values in the bands of figure 15 can be both positive and negative. On the basis of this assumption, nearly all the moment data included in the bands still remain less than 10 percent of the indicated moment due to a l-g load.
Additionally, in equation (2) essentially no reduction in the apparent bending moment could be obtained by using data from a heating simulation a s a correction because of potential e r r o r s of the simulation. For equation (l), however, the correction afforded by the simulation was useful as a means of reducing the thermally induced load indicated by the strain-gage bridges. For equation (2 ) , then, the heating simulation data could be used to select bridges such that further correction to the data would be unnecessary. However, this is believed to be the exception rather than the rule for this test situation. The extent to which heating simulation data would be of use in other I
I situations to correct strain-gage data, in addition to simply selecting gage combinations for equations, depends on many factors such as the heating profile, the location of the '!strain gages, and the nature of the structure. n
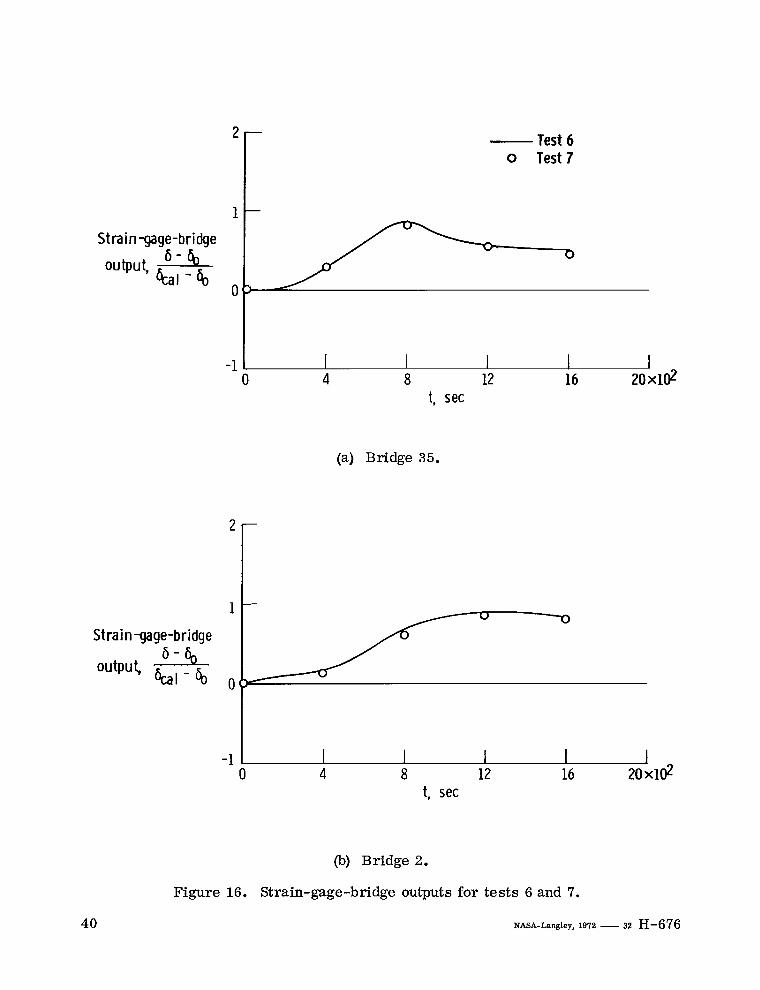
IFigures 16(a) and 16(b) show the outputs of two strain-gage bridges for tests 6 and 4
7. Test 6 was the simulation test in which- the heating-profile - - - - - -- -- was best -duplicated and I s - s o 'The strain-gage outputs were nondimensionalized to
'tal- ' 0
8
in which no intentional control perturbations were made. Test 7 was identical to test 6 at the location of these strain gages (in the root and A-frame zones), but the remaining upper-surface zones were programed for the profile of zone XVI U. Also, the remaining lower-surface zones were programed for the profile of zone XVI L. The close correlation of the respective strain-gage-bridge outputs points out that close duplication of heating profiles at structural areas remote from bridge locations is extraneous. The extent of the heating duplication will depend on the particular test situation.
CONCLUDING REMARKS AND RECOMMENDATIONS
Laboratory experiments were conducted to investigate how accurately the heating of a Mach 3 cruise flight profile could be simulated on a multispar wing structure using radiant heaters and to determine how the heating of the simulation and its inaccuracies affect strain-gage -bridge outputs and loads measurements.
The repeatability of thin-skin and substructure temperatures between two identical heating tests was less than &6 KO (*lo F O ) .
Test temperatures throughout the wing structure were compared with calculated temperatures. Generally, the simulation temperatures closely approximated the calculated values. Some improvement could be obtained by (1) determining that all internal skin thermocouples are not close to substructure attachments and (2) improving the substructure temperature calculations at the root station. It is recommended that control thermocouples be installed externally wherever possible to insure that they are on thin skin and not close to substructure attachments.
These tests also showed that it is desirable for the most accurate temperaturesimulation to be at locations where strain-gage measurements a r e made. Because strain-gage-bridge measurements are usually made at wing root and attachment points, calculated temperatures should be as accurate as possible for simulation purposes. However, the three-dimensionality of the structure a t these locations makes it difficult to predict temperatures accurately. It is recommended that flight-measured temperatures be used for simulations wherever possible and that the surface be painted to achieve a uniform emissivity for heating of this type.
The responses of the strain-gage bridges to the heating-simulation tests were found to be large and varied enough to be significant to aerodynamic loads measurements.
Loads equations consisting of various combinations of strain-gage bridges were studied. It was found that large and intolerable calculated loads resulting from thermal outputs were significantly reduced by using a heating simulation as a thermal correction. FUrther, it was found that the selection of bridges with relatively small thermal outputs resulted in an equation for which the calculated loads due to bridge thermal outputs were minimal; these loads were shown to approach the point at which the calculated load was within the potential e r r o r of the heating simulation. In other words, it was sufficient for this equation to use the simulation data as a guide for selecting bridges and to perform no additional thermal correction.
The dual purpose of the laboratory-heating simulation was, therefore, to aid in
9
L

selecting strain gages and equations for use in a high temperature environment and to provide a thermal correction o r calibration. The extent to which a simulation should be used for either or both of these purposes will depend on many factors such a s the heating profile, the location of the strain gages, and the nature of the structure.
Flight Research Center, National Aeronautics and Space Administration,
Edwards, Calif., November 12,1971.
10
APPENDIX
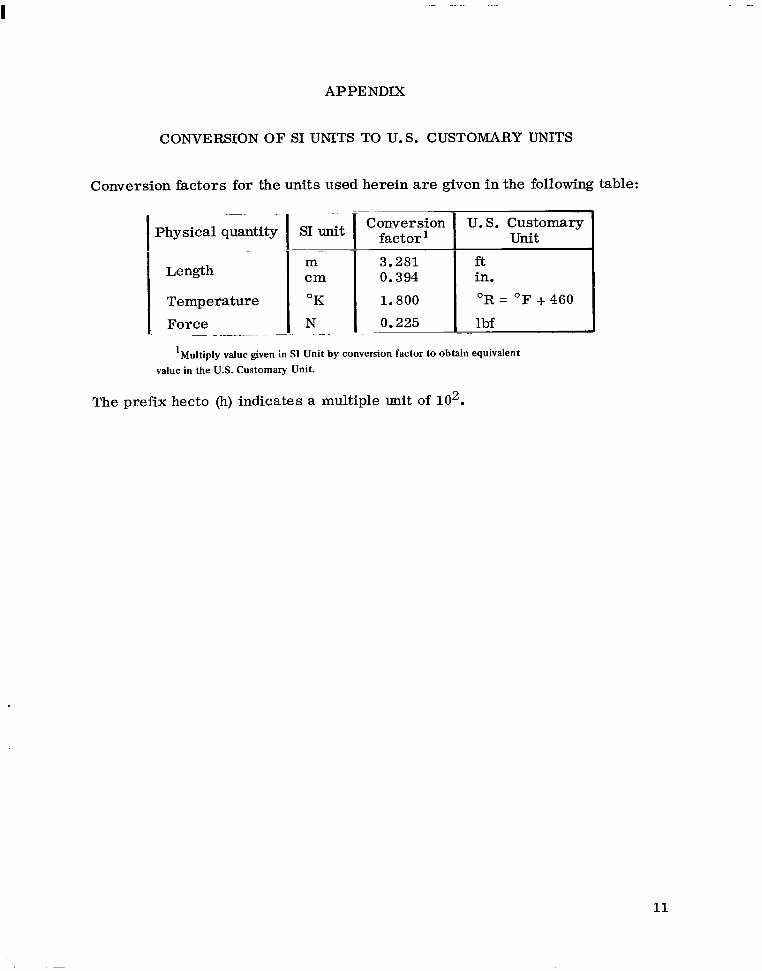
CONVERSION OF SI UNITS TO U.S. CUSTOMARY UNITS
Conversion factors for the units used herein a r e given in the following table:
IPhysical quanti; I SI i t 1 Conversion U. S. Customary
3.281I Length I :m I 0.394
Temperature OK 1.800 OR = O F +460
Force __ _.____1 N-- 1 - 0.225
'Multiply value given in S1 Unit by conversion factor to obtain equivalent value in the U.S. Customary Unit.
The prefix hecto @) indicates a multiple unit of lo2.
11
REFERENCES
1. Fields, Roger A. ;and Vano, Andrew: Evaluation of an Infrared Heating Simulation of a Mach 4.63 Flight on an X-15 Horizontal Stabilizer. NASA TN D-5403, 1969.
2. Fields, Roger A. : A Study of the Accuracy of a Flight-Heating Simulation and Its Effect on Load Measurement. NASA TN D-5741, 1970.
3. Mechtly, E. A.: The International System of Units - Physical Constants and Conversion Factors. NASA SP-7012, 1969.
4. Sefic, Walter J. ; and Anderson, Karl F. : NASA High Temperature Loads Calibration Laboratory. NASA TM X-1868, 1969.
5. van Driest, E. R.: The Problem of Aerodynamic Heating. Aeron. Eng. Rev. , vol. 15, no. 10, Oct. 1956, pp. 26-41.
6. Schultz, H. D. : Thermal Analyzer Computer Program for the Solution of General Heat Transfer Problems. Lockheed-California Company (NASA CR-65581) , 1965.
7. Skopinski, T. H. ;Aiken, William S. , Jr. ;and Huston, Wilber B. : Calibration of Strain-Gage Installations in Aircraft Structures for the Measurement of Flight Loads. NACA Rep. 1178, 1954.
12
5
10
15
20
25
30
35
40
45
50
55
TABLE 1.- THERMOCOUPLE LOCATIONS AND MATERIAL THICKNESSES
rhermoc ouple Locationnumber
1 2 3 4
6 7 8 9
11 12
13 14
16 17 18 19
21 22 23 24
26 27 28 29
31 32 33 34
36
37 38 39
41 42 43 44
46 47 48 49
51 52 53 54
56 57
Upper skin, A-frame station Lower skin, A-frame station Upper skin, A-frame station Lower skin, A-frame station Upper skin, A-frame station Lower skin, Aaframe station Upper skin, A-frame station Lower skin, A-frame station Upper skin, A-frame station Lower skin, A-frame station Upper skin, A-frame station Lower skin, A-frame station __ Upper skin, root station Lower skin, root station Upper skin, root station Lower skin, root station Upper skin, root station Lower skin, root station Upper skin, root station Lower skin, root station Upper skin, root station Lower skin, root station Upper skin, root station Lower skin, root station Upper skin, root station Lower skin, root station Upper skin, root station Lower skin, root station Upper skin, root station Lower skin, root station Upper skin, root station Lower skin, root station Upper skin, root station Lower skin, root station Upper skin, root station Lower skin, root station
. -
Upper skin, midspan station Lower skin, midspan station Upper skin, midspan station Lower skin, midspan station Upper skin, midspan station Lower skin, midspan station Upper skin, midspan station Lower skin, midspan station Upper skin, midspan station Upper skin, midspan station Lower skin, midspan station Upper skin, midspan station Lower skin, midspan station Upper skin, midspan station Lower skin, midspan station Upper skin, midspan station Lower skin, midspan station Upper skin, midspan station Lower skin, midspan station Upper skin, midspan station Lower skin, midspan station
Thickness, Zone ' Mate rial cm (in.) :ontrolled
Inconel X I. 254 (0.100) hconel X .152 (.060) hconel X .254 (.loo) Inconel X .152 (.060) Inconel X .254 (.loo)Inconel X .152 (.060) hconel X .254 (.loo)Inconel X .152 (.060) Inconel X .254 (.loo)tnconel X .152 (.060) hconel X .254 (.loo) hconel X .152 (.060)
Inconel X ). 175 (0.069) Inconel X .188 (.074) Inconel X .175 (.069) Inconel X .188 (.074) Inconel X .173 (.068) Inconel X .188 (.074) tnconel X .170 (.067) Inconel X .188 (.074) Inconel X .168 (.066) Inconel X .188 (.074) Inconel X .165 (.065) Inconel X .188 (.074) Inconel X .224 ( .088) Inconel X .163 (.064) Inconel X .224 (.088) Inconel X .163 (.064) Inconel X .224 (.088) Inconel X .163 (.064) Inconel X .224 (.088) Inconel X .163 (.064) Inconel X .224 (.088) Inconel X .163 (.064) Inconel X 096 (.038) Inconel X 096 (.038)
Inconel X 145 (0.057) Inconel X 150 (.059) Inconel X 145 (.057) Inconel X 150 (.059) Inconel X 145 (.057) Inconel X 150 (.059) Inconel X .173 (.068) Inconel X .137 (.054) Inconel X .173 (.068) Inconel X .173 (.068) Inconel X .137 (.054) Inconel X .173 (.068) Inconel X .137 (.054) Inconel X .173 (.068) Inconel X .137 (.054) Inconel X .173 (.068) Inconel X .137 (.054) Inconel X .173 (.068) Inconel X .137 (.054) Inconel X .096 (.038) Inconel ~ X .096 (.038)
'see figure 5 for zone locations.
13
II 11111111111 I11111111 II III-! I
TABLE 1.- Concluded.
Thermocouple Locationnumber
Material
58 59 60 61 62 63 64 65 66 67 68 69 70
Upper skin, tip station Lower skin, tip station Upper skin, tip station Lower skin, tip station Upper skin, tip station Lower skin, tip station Upper skin, tip station Lower skin, tip station Upper skin, tip station Lower skin, tip station Upper skin, tip station Lower skin, tip station Upper skin, tip station
Inconel X Inconel X Inconel X Inconel X Inconel X Inconel X Inconel X Inconel X Inconel X Inconel X Inconel X Inconel X Inconel X
7 1 Lower skin, tip station Inconel X 72 73
Upper skin, tip station Lower skin, tip station
Inconel X Inconel X
A-frame spar -74 75
Upper capUpper web
Titanium Titanium
76 Lower web Titanium 77 Lower cap Titanium
Root station -
78 79
Upper cap Web
25-percent-chord spar: Titanium Titanium
50-percent -chord spar: 80 81
Upper cap Web
Titanium Titanium
82 Lower cap Titanium 75-percent-chord spar:
83 84
Upper cap Lower cap
Titanium Titanium
Midspan station -50-percent-chord spar :
85 86
Upper cap Web
Titanium Titanium
87 Lower cap Titanium
88 89
Leading-edge slug Leading-edge slug
Inconel X Inconel X
Thickness, Zone cm (in.) control led
0.107 (0.042) . l o 9 (.043) . l o 7 (.042) . l o9 (.043) .112 (.044) . l o 7 (.042) .112 (. 044) . l o 7 (.042) .112 (.044) . l o 7 (.042) .112 (.044) . l o 7 (.042) .112 (.044) . l o 7 (.042) . l o 2 (.040) . l o 2 (.040)
0.318 (0.125) .157 (.062) .157 (.062) .318 (.125)
0.160 (0.063) .127 (.050)
.203 (.080)
.051 (.020) -203 (.080)
.160 (.063) .160 (.063)
3.203 (0.080) .051 (.020) .203 (.080)
1. 746 (0.688) 1.746 (.688)
I ' _-
TABLE 2.- HEATING TESTS ON WING STRUCTURE
Test number Description
~ ~~ ~
1 Heating simulation of Mach 3 cruise flight profile 2 Repeat of test 1 3 Repeat of test 1with zones I L to XI1 L programed 27.8 KO
(50 F") lower than test 1 4 Repeat of test 1with zones of entire lower surface programed
27.8 K" (50 F") lower than test 1 5 Al l wing zones programed 27.8 KO (50 F") lower than test 1 6 Repeat of test 1with two programing e r r o r s i n test 1corrected 7 Repeat of test 6 with zones XI11 L to XXIV L programed for the
profile of zone XVI L, and zones XII U to X X I V U and XXVI programed for the profile of zone XVI U
8 Repeat of test 7 to solve control problems in zones VI11 U and L 9 Repeat of test 8
15
TTip rib Trailing-edge rib -,
Leading-
-Leading-edge rib 1 V lWing attaching A-frames
Figure 1. X-15 wing structure.
View A 87
< 1'I View B View C
View D View E
'T'Upper A-frame
~ w;$4 Lower A-frame
View F
Figure 2. Thermocouple instrumentation number and location. Parenthetical numbers indicate thermocouples on lower skin.
t Forward
c t
c c
r 1 0 (13) c t
L E
_ _ _ _ _ _ - - - 3 21 (24)U 0 2 2 (23)
I k -31 .8 cm
(12.5 in.) *- 21.0 cm I_
(8.3 in.)
o Bending bridge Shear bridge
A Tension bridge
Outboard -Figure 3. Strain-gage-bridge number and location. Parenthetical numbers indicate bridges on lower A-frame leg.
18
E-20335
Figure 4. Lower-wing-surface reflector assembly, viewed from the trailing edge.
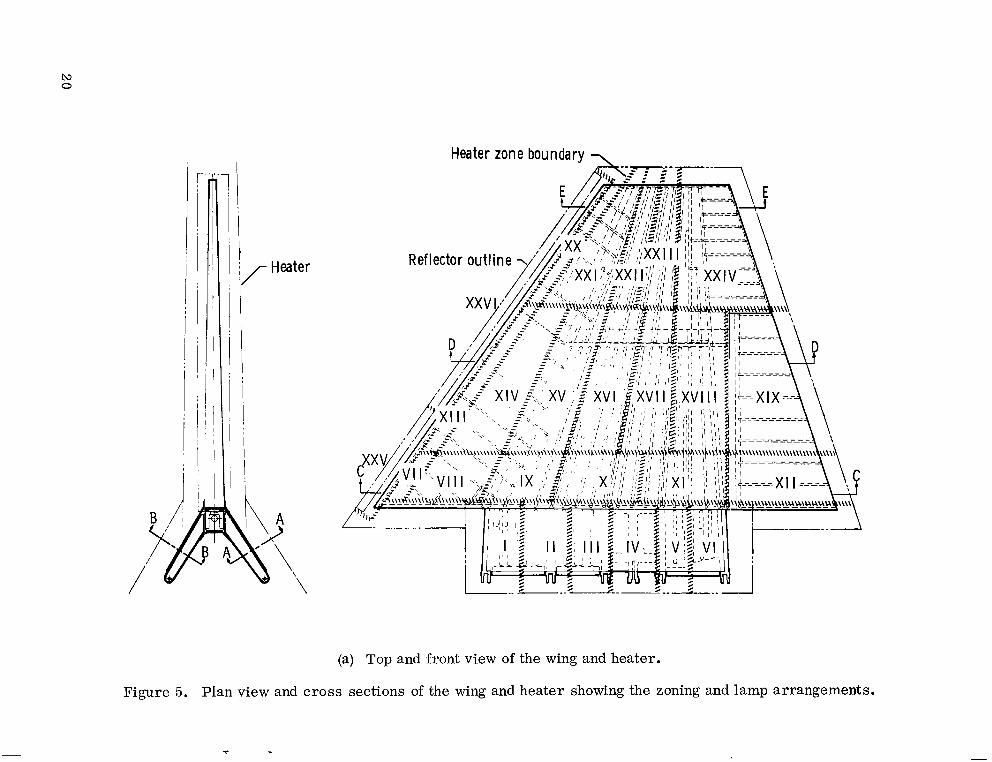
(a) Top and front view of the wing and heater.
Figure 5. Plan view and cross sections of the wing and heater showing the zoning and lamp arrangements.
-e
. . . . . . .r
1 3 5 7 9 11
Control th er mocoup Ie
(b) Upper A-frame and heater, section A-A.
r Control thermocouple
2 4 6 8 10 12
(c) Lower A-frame and heater, section B-B.
Figure 5. Continued.
N N XI1 u-
Asbestos shield
(d) Root station structure and heater, section C-C.
(e) Midspan station structure and heater, section D-D.
Figure 5. Continued.
I
- x x u
Control thermocouple -, X X l V u-
Asbestos shield
4 X X L k X X I L d X X I I L k X X I I I L-+-XXlVL
(0 Tip station structure and heater, section E-E.
Figure 5. Concluded.
E-20326
Figure 6. Test setup for heating simulation on an X-15 wing.
6 x10² 20 xi03 .. -I
0 - - - - - -1 6 0X l O j 12 xlOL
-8
I
4 15
0 -40 h, ft I
i31L2
"'t0
q, Ibf/ft2
91
hNlm*
0 L
Figure 7. Time history of flight parameters used to calculate temperatures.
1 2 3 4 5 6 7 8 9
10 11 12 13 14 15 16 17 18 19
112 (44)
Load point 170 Wing station, cm (in.)
20 21 22 23
Maximum load, N (Ibf 4,444 (1000) 3,556 (800) 6,400 (1440) 8, 444 (1900)
10, 667 (2400) 10,667 (2400) 10,667 (2400) 10,667 (2400) 10, 667 (2400) 10, 667 (2400) 10,667 (2400) 10, 667 (2400) 10, 667 (2400) 10, 667 (2400) 10, 667 (2400) 10, 667 (2400) 10,667 (2400) 10, 667 (2400) 10,667 (2400) 10, 667 (2400) 10,667 (2400) 2 ,222 (500) 3, 111 (700)
Figure 8. Strain-gage-bridge calibration loads.
26
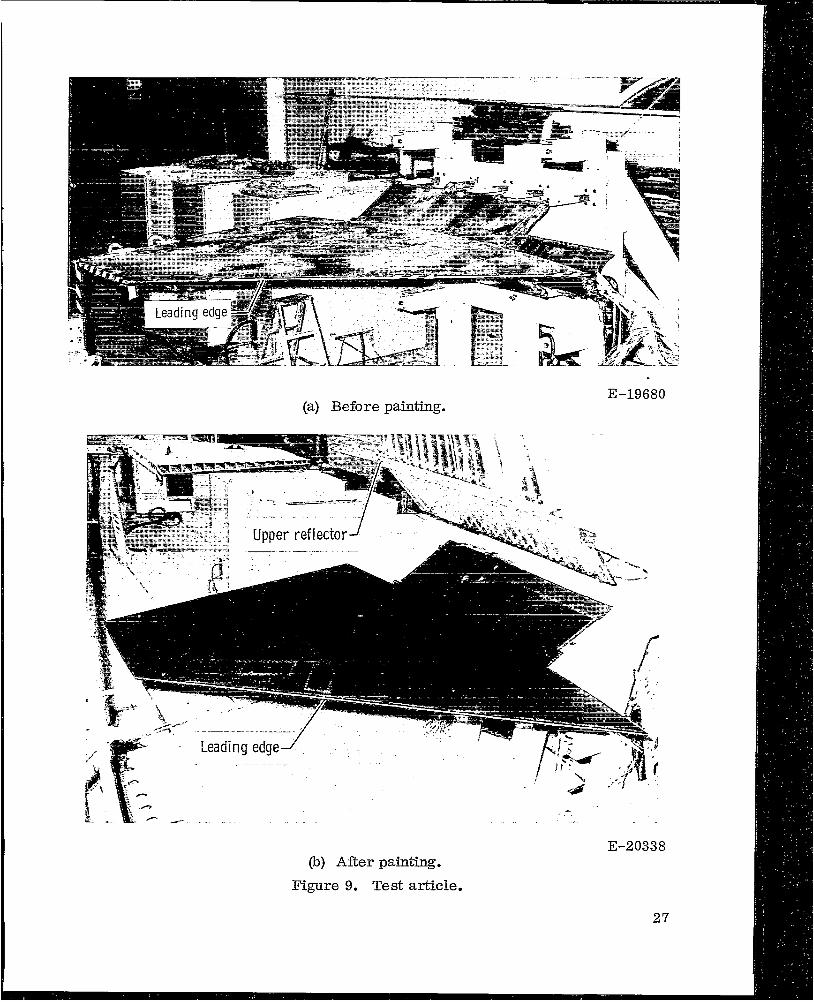
E-19680 (a) Before painting.
(b) After painting.
Figure 9. Test article.
E-20338
27
601
5a
T W , OK 4a
30C
200
o Simulated temperatures before paint ing Simulated temperatures after pa int ing
--- Calculated (emissivity =O. 76)
~ O 0 0 O 0 0 0 0
/O
I I 1 I I I 200 400 600 800 1000 1200
t, sec
Figure 10. Calculated and simulated temperatures in zone IX U (thermocouple 27) showing the effect of painting the surface.
28
Temperature
Temperature Aluminum foil with
Fiberglas insulation
0 200 400 600 800 1000 1200 t, sec
(a) Upper A-frame.
Figure 11. Simulated and calculated temperature time histories for the skin and substructure.
29
Temperature 0 Beamcap A Beam web
Calculated web
T,, "K
600
-Calculated skin
500
Tw, "K 400
300
200
500
400
300 Ts, "F
200
100
A l u m i n u m foi l w i th F iberglas insulation
T her mocoupIe
500
400
300 Tw, "F
200
100
0 200 400 600 800 1000 1200 t, sec
(b) Lower A-frame.
Figure 11. Concluded.
30
600 - -I 600 t, sec
e >loo00
700 -400 0
Tw, O K 400 600 T W l O F
-400 200
Upper surface
-Calculated o Simulated
Solid symbol -- Asbestos shield' Thermocouple 1 control thermocouple
600 t. sec -1 600
500
Tw, O K 400
300
200 1 0 .2 .4 -x .6 .8 1.0
Cr (a) Root station; C y = 3.25 m (10.66 ft).
Figure 12. Chordwise distribution of calculated and simulated temperatures.
I I I I I I III~1111Il11111Ill11
Ca Iculated o Simulated Solid symbol - control thermocouple
t, sec >lo00
0 e 700
0 s 600
I I I I I
t, sec n a - n m
W 6 >IO00 500 - 0 0 - n a 0 =-700
0 - 0 -- n m 0 w w v 0 s 600
0
-300-
0 8 I X n - r \ -
n r a - 200X O
Lower surface I _-I - 1
Cm
(b) Midspan station; cm = 2.26 m (7.42 ft).
Figure 12. Continued.
32
I
Calculated o Simulated
Solid symbol - control thermocouple
600 t, sec >loo8
- O 700 w -"
1
0 6000
Tws OK ""tu- = * G w- 0 400 . a
r X- >( 200 - 0
Upper surface 200 I 1 1 I I
X X l l u / x x q X X I u I I X X I I I u I X X I V U
- .c' : I r' : I I:] m-I- r;r I 1
\xx L I X X I L LXll 1X X l l l L] [ X X l V L
Asbestos shield Thermocouple
t. sec
I Lower surface 200 I 1 I 1 II
0 - 2 . 4 .6 .8 1.0
(c) Tip station; ct = 1.11 m (3.64 ft).
Figure 12. Concluded.
600
400
T,, O F
200
0
';1Tw, "F
33
0 200 400 600 800 lo00 1200 t, sec
400
300
200
100
o Simulated Ca Iculated
I
'O0
p e b 500I -1500
-500 400
0 300 -TS, "K 400 0 0
T S , "F 0 200
100
0
200 0 200 400 600 800 lo00 1200
t, sec
(a) Root station; 25-percent chord.
Figure 13. Simulated and calculated temperature time histories for the wing substructure.
34
6oo rUpper cap
500 500
400
300Tsl "K 400
200 Ts, "F
300 100
o Simulated 200'U Ca Icu lated 600 rWeb
-500
Ts, O K 400 - 0 Ts, "F
300(
-600 Lower cap -Iao
-500
Ts, "K 400 f Ts, "F
300 JO
I 0 200 4do 6AO 800 Id00 1400
t, sec
(b) Root station; 50-percent chord,
Figure 13. Continued.
35
600
500
Ts, "K 400
300
200
"I- Lower
I
7500
400
300
200 T,, "F1100
o Simulated Calculated
500
400
300 T,, "F
200
100
0
2001 1 1 1 1 1 I 0 200 400 600 800 1000 1200
t, sec
(c) Root station; 75-percent chord.
Figure 13. Continued.
36
6oo rUppercap
T,, "K
600
500
400
300 T,, "F
200
100
0
500
400
300
200
o Simulated Calculated
T,, "F
100
600
500
400
300
200 100
T,, "FT,, "K
*0°0 200 400 600 800 loo0 1200 t, sec
(d) Midspan station;50-percent chord.
Figure 13. Concluded.
37
. . . . . ... . ..I--

- 0 Test 61.2 \\\\\y Data from a l l tests
.8
Strain -gage-bridge 6 - Q . 4
output 421-Q
0
-.4 0
1 1 I 1 I 4 8 12 16 20x102
t, sec
(a) Bridge 11.
Strain -gage-bridgea-b 0
output 42, - Q
- 4 u I I 1 I * o 4 8 12 16 20x102
t, sec
(b) Bridge 30.
Figure 14. Outputs of two strain-gage bridges due to heating-simulation tests.
38
-12
o Bending moment due to uncorrected strain-gage output from test 6 A\\\\\ Bending moment due to corrected strain-gage output from a l l tests using test 6 as the correction
Magnitude of wing bending moment due to a 1-g load
4 x10³ -2 x10³ 1 -2 ~ 1 0 3
0 -0 0 -0 --3 --2
I ' -4 - --4 Bending Bending
0 - - 4 Bending Bending moment, moment, -8
Nlm ---6 ft-lbf Nlm
0 -12 -0
0 0
0
O entf moment, -8 j0ft-lbf
-16 t 0 0 -12 -16 I-12
-20 2 -20 b b l!i' j 6 2dx1$0 4 8 12 16 2Ox1O2 t, sec t, sec
(a) Equation (1). @) Equation (2).
Figure 15. Calculated bending moment [corrected and uncorrected) from two equations due to heating simulation. w a
2
1 -
St ra in-gage- bridge
output, a-q,kal-6 o:,
-1 ~ I
1 -
Strain -gage-bridge
output b-B bra,
-1 I
Test 6 0 Test 7
0
I I 1 I
(a) Bridge 35.
1 I I I
@) Bridge 2.
Figure 16. Strain-gage-bridge outputs for tests 6 and 7.
40 NASA-Langley, 1972 -32 H-676
‘1
. N A T I O N A L AERONAUTICS A N D SPACE A D M I S T R A T I O N
WASHINGTON, D.C. 20546 POSTAGE AND FEES PAID __
NATIONAL AERONAUTICS AND O F F I C I A L BUSINESS FIRST CLASS MAIL. SPACE ADMINISTRATION
PENALTY FOR PRIVATE USE 1300 USMAIL
U
015 001 C 1 U 32 720310 S O O 9 0 3 D S DEPT OF THE A I R FORCE A f WEAPONS L A 8 IAFSCI T E C H L IBRARY/WtQt/ ATTN: E LnU BOWMAN, CHIEF KIRTLANI) AFB N M 87117
If Undeliverable (Section 158 Postal Manual) Do Not Return
“The aeronautical and space activities of the United Stntes shall be conducted so as to contribute . . , to the expansion of human knowledge of phenoniena in the atniosphere and space. T h e Administration shall provide for the widest practicable and appropriate dissemination of information concerning its actiuities and the results thereof.”
-NATIONALAERONAUTICSAND SPACE ACT OF 1958
NASA SCIENTIFIC A N D TECHNICAL PUBLICATIONS
TECHNICAL REPORTS: Scientific and technical information considered important, complete, and a lasting contribution to existing knowledge.
TECHNICAL NOTES: Information less broad in scope but nevertheless of importance as a contribution to existing knowledge.
TECHNICAL MEMORANDUMS: Information receiving limited distribution because of preliminary data, security classification, or other reasons.
CONTRACTOR REPORTS: Scientific and technical information generated under a NASA contract or grant and considered an important contribution to existing knowledge.
TECHNICAL TRANSLATIONS: Information published in a foreign language considered to merit NASA distribution in English.
SPECIAL PUBLICATIONS: Information derived from or of value to NASA activities. Publications include conference proceedings, monographs, data compilations, handbooks, sourcebooks, and special bibliographies.
TECHNOLOGY UTILIZATION PUBLICATIONS: Information on technology used by NASA that may be of particular interest in commercial and other non-aerospace applications. Publications include Tech Briefs, Technology Utilization Reports and Technology Surveys.
Details on the availability of these publications may be obtained from:
SCIENTIFIC AND TECHNICAL INFORMATION OFFICE
NATIONAL AERONAUTICS AND SPACE ADMINISTRATION Washington, D.C. PO546