Embed Size (px)
Citation preview

ASIAN JOURNAL OF CIVIL ENGINEERING (BHRC) VOL. 17, NO. 6(2016)
PAGES 899-916
EXPERIMENTAL INVESTIGATION OF DAMAGED EXTERIOR
RC BEAM–COLUMN JOINTS RETROFITTRD BY FRP
JACKETING
E. Zamani Beydokhti and H. Shariatmadar*
Department of Civil Engineering, Faculty of Engineering, Ferdowsi University of Mashhad,
Postal Code 9177948944, P.O. Box 1111, Mashhad, Iran
Received: 15 October 2015; Accepted: 25 January 2016
ABSTRACT
The efficiency of a seismic retrofit using externally bonded fiber-reinforced polymer
composites on existing damaged reinforced concrete joints, designed prior to the
introduction of modern standard seismic design code provisions in the mid-1970s, are herein
presented, based on experimental investigations on beam-column joint subassemblies. The
experimental program comprises 8 external beam–column joint connection subassemblages
tested in 2 phases; the first phase was the damaging phase and the second was aimed to the
repairing the damaged joints. The joints had no beam-column joint transverse reinforcement
and special stirrups in beam and column critical lengths. These Non-Seismically designed
(NS) joints were damaged with different levels at the first phase of the experiment. In the
second phase, the damaged joints were strengthened with externally bonded carbon-fibre-
reinforced plastics (C-FRP) sheets. From the observed responses the load carring capacity
and stiffness of the pre-damaged strengthened joints were improved in moderate initial
damages (less than 1.5% drift ratio). Also, the use of CFRP sheets increased the capacity of
energy dissipation of the rehabilitated beam–column specimens in comparison to as-built
specimen. It can be deduced that the technique of externally bonded retrofitting (EBR) using
C-FRP sheets is efficient in moderately pre-damaged joints, i.e. the damage levels less than
1.5% drift ratio. This level is named as the repaire-ability level by using EBR strengthening
method.
Keywords: Damaged RC beam-column joints; CFRP laminates; rehabilitation;
performance level; ductility.
* E-mail address of the corresponding author: [email protected] (Hashem Shariatmadar)

E. Zamani Beydokhti and H. Shariatmadar
900
1. INTRODUCTION
Recent strong earthquakes in developing countries (Kashmir, 2005; China, 2008; Indonesia,
2009; and Haiti, 2010) caused extensive economic and human losses due to the poor
behavior of many old reinforced concrete (RC) buildings The repair and rehabilitation of
reinforced concrete structures damaged by severe earthquakes are challenging fields of study
in earthquake engineering, which have been developed during the last two decades. lateral
load carrying capacity of multi-storey reinforced concrete frames that were built prior to the
1970’s are often insufficient due to non-ductile reinforcement detailing. Many failures in
these structures can be attributed to the lack of internal steel stirrups in beam-column joints.
Local strengthening of these deficient elements is a feasible option for reducing the
vulnerability of such substandard buildings. On the other hand, the failure of these non-
seismically designed joints may lead to general failure of the entire structure [1].
In the last two decades, externally bonded fiber-reinforced polymers (FRP) have been
used extensively to strengthen seismically deficient elements. In comparison to other
strengthening materials, FRP possess advantages such as high resistance to corrosion,
excellent durability, high strength to weight ratio, adaptability to different shapes, and ease
and speed of in situ application [2].
In the recent years, a lot of researches have been done on how using FRP laminates affect
the behavior of the concrete joints [3-5]. There are also considerable experimental studies on
the seismic parameters of the upgraded or repaired connections. Hadi and Tran [6] tested the
exterior RC joint with joint shear (JS) failure, flexural beam hinge (BH) failure, and a
combination of JS and BH failure mode. Lee et al. [7] investigated the effect of the
simultaneously using of carbon and glass composites. Antonopoulos and Triantafillou [8]
and Bing Li et al. [9] investigated the rehabilitation of the concrete connections with carbon
and glass composites and compared the cyclic behaviors. Research of Balsamo et al. [10]
about the effect of the CFRP laminates on the behavior of a full scale structure with dual
system of moment frame and shear wall under cyclic and seismic loading have shown the
improvement of the structural behavior. Garcia et al. [11] improved the strength of damaged
joints by use of high strength concrete and CFRP laminates. Also, The tests carried out by
Realfonzo et al. [12] on repaired joints have confirmed the efficiency of the strengthening
solutions by use of CFRP sheets.
In this research, an effort to use carbon-fiber-reinforced plastic (CFRP) sheets in the
improvement of the seismic parameters of reinforced concrete exterior beam–column joints
is presented. Tested specimens were comprised of 8 external beam–column joint sub-
assemblages having non-seismic reinforcement detailing with 2/3 scale tested in 2 phases;
the first phase was the damaging phase and the second was aimed to the repairing the
damaged joints. The joints had no beam-column joint transverse reinforcement and special
stirrups in beam and column critical zones. These Non-Seismically designed (NS) joints
were damaged up to the different levels at the first phase of the experiment. In the second
phase, the damaged joints were strengthened with externally bonded carbon-fibre-reinforced
polymers (CFRP) sheets. Therefore, the current tests aimed at (1) assessing behavior of
substandard joints under different (moderate to severe) demands and (2) investigating
effective rehabilitation and strengthening solutions for damaged joints with FRP sheets.
EXPERIMENTAL INVESTIGATION OF DAMAGED EXTERIOR RC BEAM...
901
2. EXPERIMENTAL PROGRAM
2.1 Test specimen details
The beam of the joint subassemblage is taken to the mid-span of the bay, while the column
is taken from the mid-height of one storey to the mid-height of the next storey. The sub-
standard beam-column joint (NS5) was designed as per the current CSA A23.3-04 [13].
Beam and column cross sections with the 2/3 scale had the 30x40 cm and 30x30 cm
dimensions, respectively. The length of the beam from mid span to the side of column was
1400 mm and the length of the column from the mid height of the bottom floor to the mid
height of the higher floor was 2300 mm. The maximum-size coarse aggregate used in the
concrete was 25 mm. The average compressive strength of concrete at the time of the test for
all the specimens was 38.5 MPa. Also, The detailing of reinforcing in beam-column joint
presented in Figure 1 is the same for all the specimens. Ø10 and Ø18 rebars, were used as
stirrups and longitudinal reinforcement in the specimens. The material properties of used
materials is presented in Table 1.
The longitudinal rebars for the columns were 8Ø18 bars corresponding to a 1.7%
reinforcement ratio. The Ø10 stirrups were spaced at 200 mm over the entire height of the
column. No transverse reinforcement was used in the joint area.
The top and bottom longitudinal reinforcements of the beam were 4Ø18 bars each
corresponding to a 2.26% reinforcement ratio. The transverse reinforcement of the beam was
Ø10 rectangular ties starting at 50 mm from the face of the column. The ties were spaced at
150 mm along the beam.
Table 1: Mechanical properties of materials
Tensile properties of reinforcement bars
Rebar Diameter (mm) Fy (MPa) Fu (MPa)
Ø10 509.9 651.7
Ø18 533.3 696.0
Concrete Strength f'c (MPa)
NS5 NS1R NS2R NS3R NS5R
38.5 38.9 38.6 38.6 38.5
FRP Materials
Thickness
(mm)
Elongation
%
Tensile Strength
(MPa)
Tensile E-
Modulus (GPa)
Areal
Weight
(gr/m2)
CFRP:
QUANTOM®
Wrap 300C
0.167 1.5 4950 240 300
Epoxy resin QUANTOM® EPR3301 epoxy laminating resin

E. Zamani Beydokhti and H. Shariatmadar
902
400mm 1600mm
30
0m
m
25
00
mm
200mmA
B
B
A
400mm
30
0m
m
300mm3
00
mm
Section A-A
Section B-B
4 18
6 10hoops@200mm
6 10hoops@200mm
10Stirups@150mm11
4 18
184
8 18
10@200mm
10@150mm
Figure 1. Reinforcing Detail of beam-column joint
2.2 Repaired specimens
Carbon fiber-reinforced polymer (CFRP) composite material was used to strengthen the
joints after they had sustained extensive damage during Phase I testing. According to
manufacturer data sheet, the tensile strength, elastic modulus, and ultimate strain of the
CFRP sheets were presented in Table 1.
Based on the test results of specimen NS5 at the begining of the phase 1, the storey drifts
corresponded to structural performance levels [Immediate Occupancy (IO), Life safety (LS)
and Collapse Prevention (CP)] were obtained. The net beam rotation within 600 mm
adjacent to column face was measured during the test according to FEMA 356 [14]. Thus,
the tested NS-Grade specimens up to 1% (NS1), 1.5% (NS2) and 3% (NS3) storey drifts
were selected for IO, LS and CP structural performance levels, respectively.
Based on previous researches on rehabilitation of connections [15, 16] and damage
mechanism of NS5 specimen, the detailing shown in the Figure 2 was used for the repair of
connections. Flexural retrofitting of Beam and column of the specimens were designed
according to ACI440.2R-08 [17] presented in Table 2. Besides, the NS specimens was shear
retrofitted using one layer sheet with the length of 500 mm on the two parallel sides of the
column with the 90°angle relative to beam axis. Also, a 500 mm one layer U-shaped of the
CFRP laminate on the three free faces of the joint with the 0°angle perpendicular to previous
layer was attached to improve the confinement, strength and deformability of the joint.
EXPERIMENTAL INVESTIGATION OF DAMAGED EXTERIOR RC BEAM...
903
1-Ply Wrap
1-Ply WrapL-Shaped
1 or 2-Plies
1 Ply Wrap
U-Shaped-1 Ply
Column sheet
Column sheet
Shaped-U
Shaped-L
600 mm
60
0 m
m
600 mm
60
0 m
m
250m
m
400 mm
300
mm
50
0 m
m
400 mm
50
0 m
m
400 mm
100 mm
300 m
m
400 mm
1
2
3
Wrap sheet
4
Figure 2. Application sequence and detailing of CFRP laminates
Table 2: Characteristics of retrofitted specimens
Joint ID Pre-Loading
(mm)
Ply Number of FRP Sheets
L-Shaped U-Shaped column Sheets
NS1R (+14) , (-13)*
1 1 1
NS2R (+20.8),(-20.2) 1 1 1
NS3R (+44),(-42) 2 1 1
NS5R (+71.2),(-71.3) 2 1 1
* (+) Forward loading, (-) Backward loading
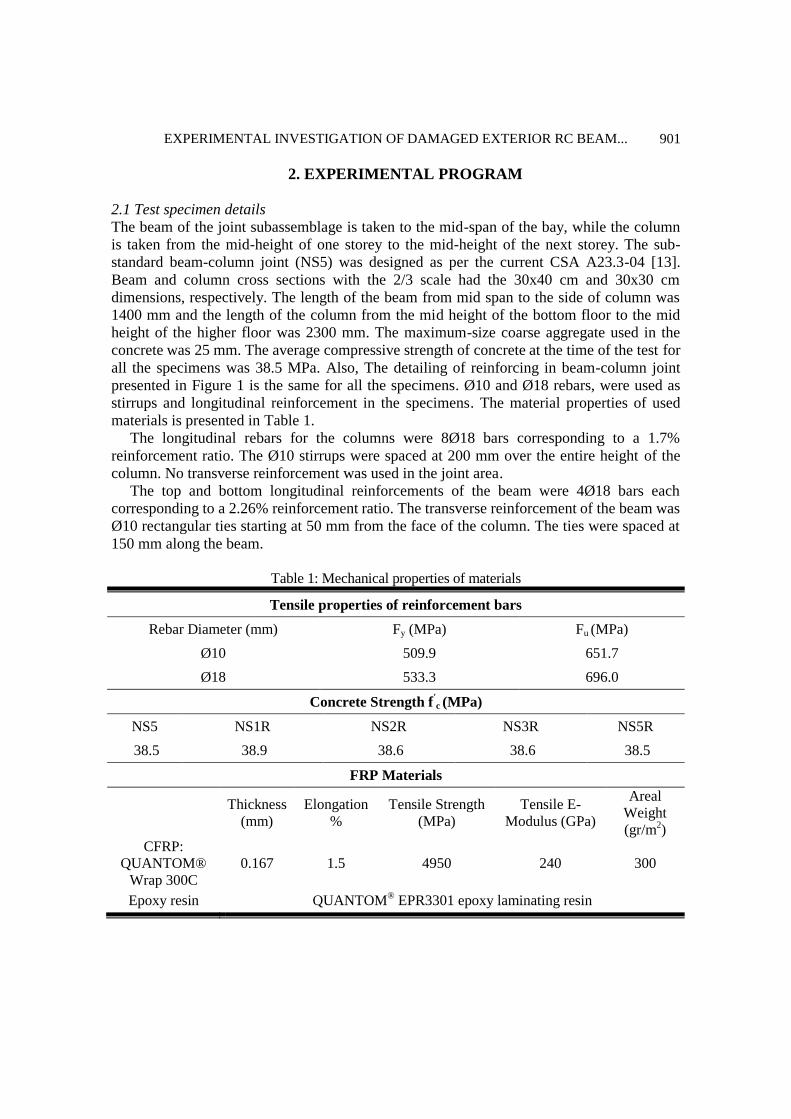
2.3 Test set-up and loading history
The experimental setup for specimens is shown in Figure 3. The specimens were rotated 90°
vertically, so the column placed on the floor of the laboratory and the beam was projected
from the floor. The Figure 3 shows the fastened specimen on the strong floor.
E. Zamani Beydokhti and H. Shariatmadar
904
(a)
2.30m
1.4
0 m
Cyclic Load
Reaction FrameHydraulic Jack
Load Cell
150mm LVDT’s
Pinned Support
Axial Load
Pinned
Support40 mm LVDT’s
(b)
Figure 3. Test set-up.
The end of beam and columns were points of contra flexure due to lateral loading of
structure. The specimens were pin-supported at the mid height of the column connected to
the reaction strong floor. A constant axial load about 70 kN was applied at the ends of
column. Horizontal displacements were applied at beam mid span through a pin-ended
double-acting 800 kN hydraulic actuator.
Five linear variable displacement transducers (LVDT) were used to measure the
displacement at various locations on the specimen as shown in Figure 3-b. One 150-mm
LVDT measured the beam tip displacement. Three 40 mm LVDTs were attached on the
surface of beam and column at the vicinity of joint, and one 150 mm LVDT was mounted on
the beam surface at a distance of 600 mm from column side for measuring the beam rotation
and curvature.
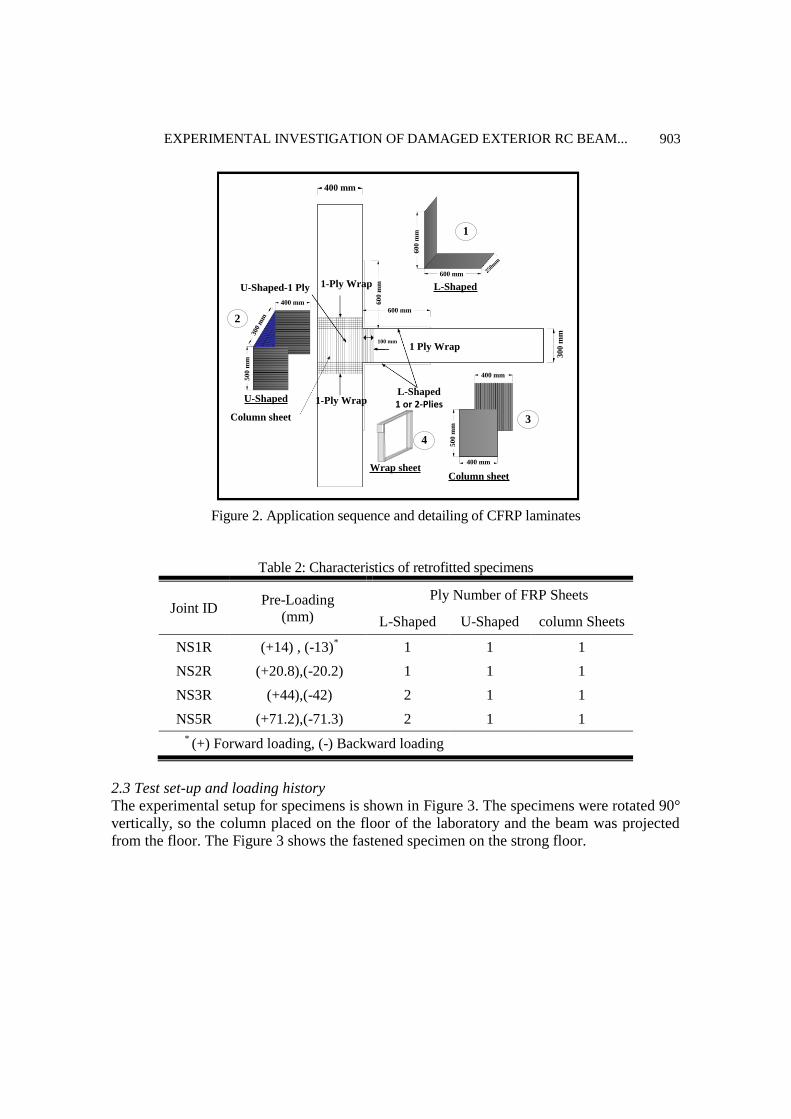
Cyclic loading was applied to the tip of the beam according to the loading history
displayed in Figure 4. Specimens were tested under a load-controlled cyclic in elastic range
followed by displacement-controlled cyclic load history based on the inter-storey drift which
represented a severe load condition for beam to column joint. The test loading pattern is
based on drift rather than ductility increments because the ductility can be difficult to define
for retrofitted systems other than conventionally reinforced concrete or steel structures.
Load Control
Cracking
Displacement Control
0.5% 1% 1.5% 2% Drift 2.5% Drift 3% Drift 4% Drift 5%
Cycl
ic L
oad
Drift or Disp.
Figure 4. Load history for the reversed cyclic load test
EXPERIMENTAL INVESTIGATION OF DAMAGED EXTERIOR RC BEAM...
905
3. TEST RESULTS
3.1 Phase I test results
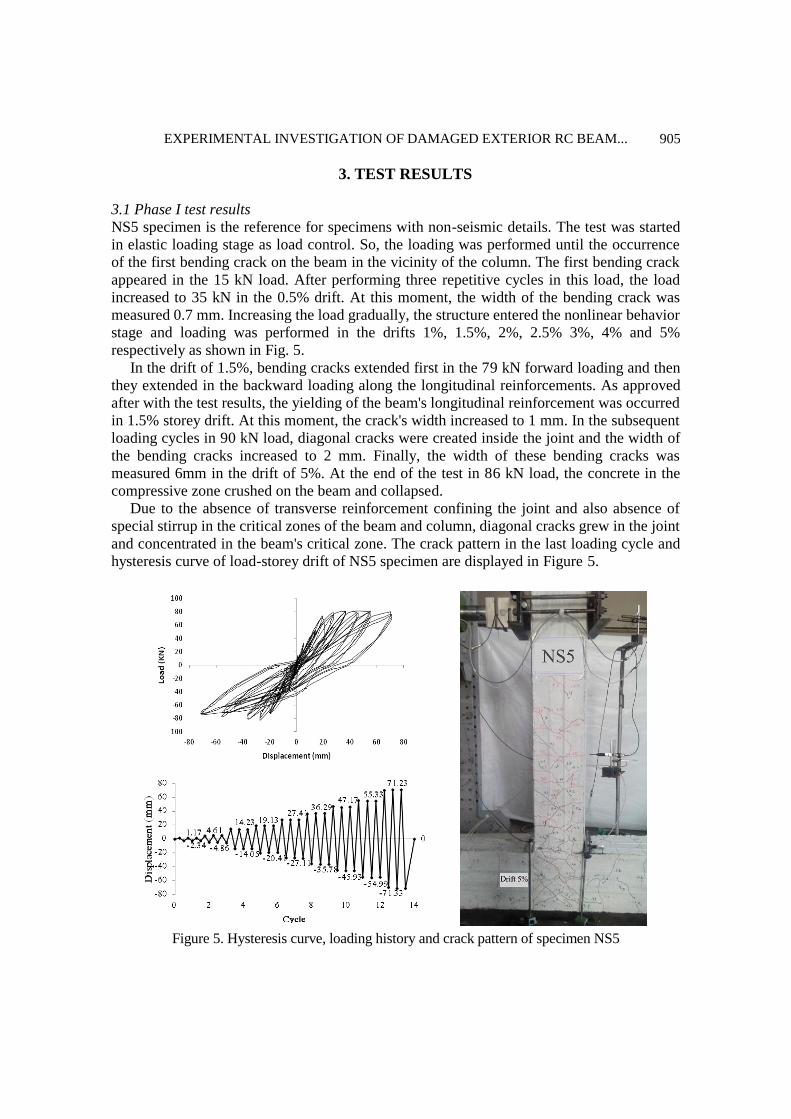
NS5 specimen is the reference for specimens with non-seismic details. The test was started
in elastic loading stage as load control. So, the loading was performed until the occurrence
of the first bending crack on the beam in the vicinity of the column. The first bending crack
appeared in the 15 kN load. After performing three repetitive cycles in this load, the load
increased to 35 kN in the 0.5% drift. At this moment, the width of the bending crack was
measured 0.7 mm. Increasing the load gradually, the structure entered the nonlinear behavior
stage and loading was performed in the drifts 1%, 1.5%, 2%, 2.5% 3%, 4% and 5%
respectively as shown in Fig. 5.
In the drift of 1.5%, bending cracks extended first in the 79 kN forward loading and then
they extended in the backward loading along the longitudinal reinforcements. As approved
after with the test results, the yielding of the beam's longitudinal reinforcement was occurred
in 1.5% storey drift. At this moment, the crack's width increased to 1 mm. In the subsequent
loading cycles in 90 kN load, diagonal cracks were created inside the joint and the width of
the bending cracks increased to 2 mm. Finally, the width of these bending cracks was
measured 6mm in the drift of 5%. At the end of the test in 86 kN load, the concrete in the
compressive zone crushed on the beam and collapsed.
Due to the absence of transverse reinforcement confining the joint and also absence of
special stirrup in the critical zones of the beam and column, diagonal cracks grew in the joint
and concentrated in the beam's critical zone. The crack pattern in the last loading cycle and
hysteresis curve of load-storey drift of NS5 specimen are displayed in Figure 5.
Figure 5. Hysteresis curve, loading history and crack pattern of specimen NS5
E. Zamani Beydokhti and H. Shariatmadar
906
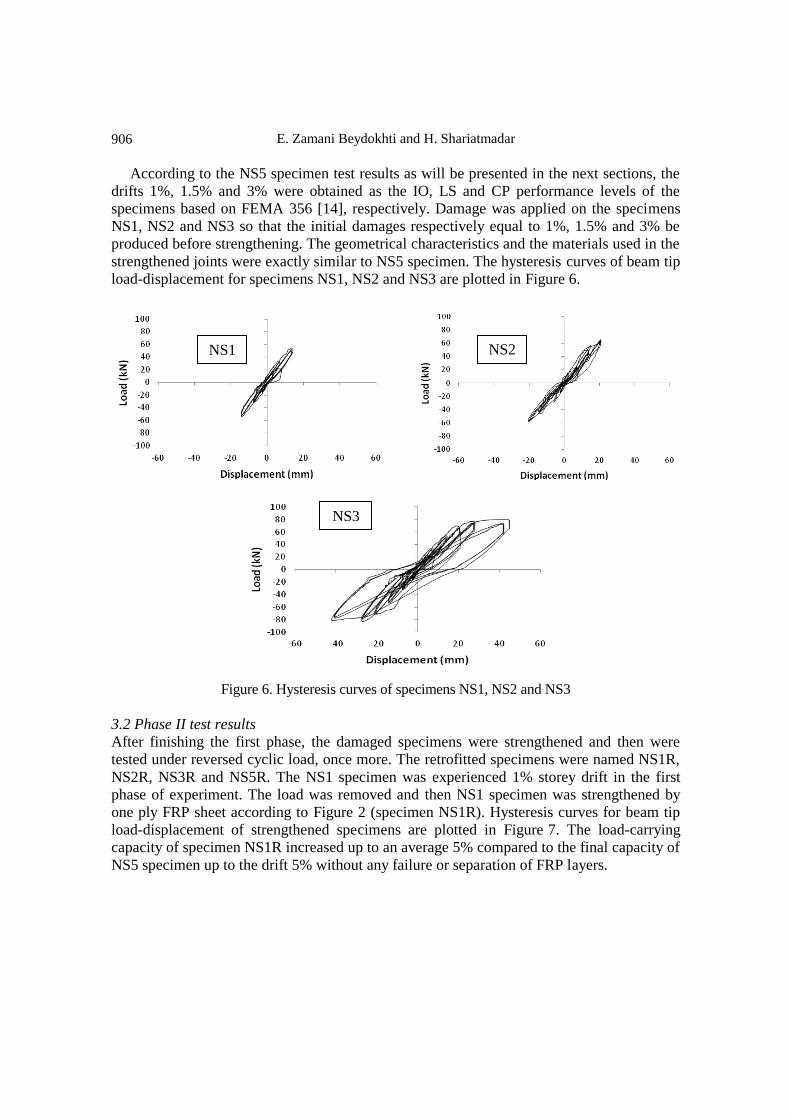
According to the NS5 specimen test results as will be presented in the next sections, the
drifts 1%, 1.5% and 3% were obtained as the IO, LS and CP performance levels of the
specimens based on FEMA 356 [14], respectively. Damage was applied on the specimens
NS1, NS2 and NS3 so that the initial damages respectively equal to 1%, 1.5% and 3% be
produced before strengthening. The geometrical characteristics and the materials used in the
strengthened joints were exactly similar to NS5 specimen. The hysteresis curves of beam tip
load-displacement for specimens NS1, NS2 and NS3 are plotted in Figure 6.
Figure 6. Hysteresis curves of specimens NS1, NS2 and NS3
3.2 Phase II test results
After finishing the first phase, the damaged specimens were strengthened and then were
tested under reversed cyclic load, once more. The retrofitted specimens were named NS1R,
NS2R, NS3R and NS5R. The NS1 specimen was experienced 1% storey drift in the first
phase of experiment. The load was removed and then NS1 specimen was strengthened by
one ply FRP sheet according to Figure 2 (specimen NS1R). Hysteresis curves for beam tip
load-displacement of strengthened specimens are plotted in Figure 7. The load-carrying
capacity of specimen NS1R increased up to an average 5% compared to the final capacity of
NS5 specimen up to the drift 5% without any failure or separation of FRP layers.
NS1 NS2
NS3

EXPERIMENTAL INVESTIGATION OF DAMAGED EXTERIOR RC BEAM...
907
Beam Tip Disp. (mm)
Load
(kN
)
-80 -60 -40 -20 0 20 40 60 80-100
-80
-60
-40
-20
0
20
40
60
80
100
NS1R
NS5
(a)
Beam Tip Disp. (mm)
Load
(kN
)
-80 -60 -40 -20 0 20 40 60 80-100
-80
-60
-40
-20
0
20
40
60
80
100
NS2R
NS5
(b)
Beam Tip Disp. (mm)
Load
(kN
)
-80 -60 -40 -20 0 20 40 60 80-100
-80
-60
-40
-20
0
20
40
60
80
100
NS3R
NS5
(c)
Beam Tip Disp. (mm)
Load
(kN
)
-80 -60 -40 -20 0 20 40 60 80-100
-80
-60
-40
-20
0
20
40
60
80
100
NS5R
NS5
(d)
Figure 7. Load–displacement hysteresis curves of specimens
NS2 specimen was damaged to 1.5% storey drift in the first phase of experiment. The
load was removed and NS2 specimen was strengthened by one ply FRP sheet under and
above the beam and around the joint area according to Figure 2 (specimen NS2R). Similar to
NS1R specimen according to Figure 7, NS2R specimen increased the load-carrying capacity
on average to 3% compared to the ultimate capacity of NS5 specimen up to the drift 5%
without any failure of FRP layers. In this specimen after the drift 2%, shear cracks extended
from the end of the L-shaped FRP sheets top and bottom the beam. In the drift 3%, the L-
shaped FRP layer buckled from the beam surfaces in several points. Finally, the L-shaped
layer at the right hand side of the beam was then ruptured in the drift 4%. The crack pattern
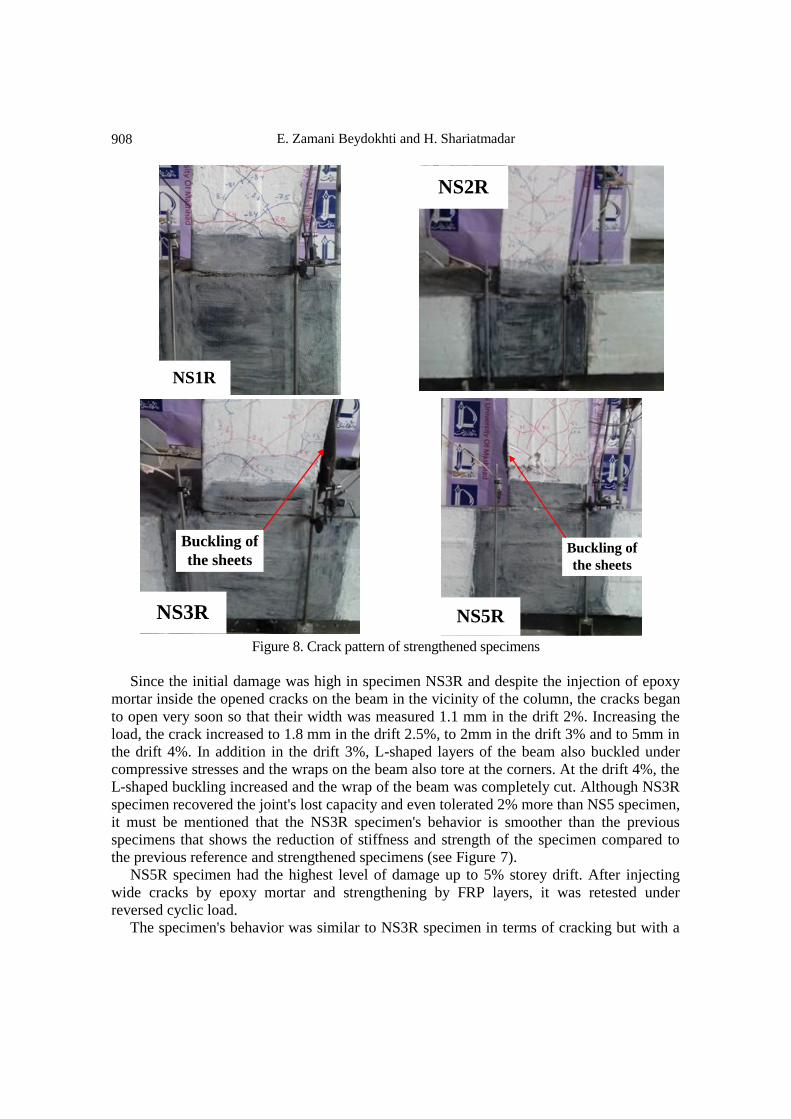
and FRP failure modes in tested specimens is presented in Figure 8.
Based on the test results of the NS5 specimen, it became clear that the drift 3% is
equivalent to the last level of damage according to the Iranian seismic design provisions
[18], at which the specimen can preserve its stability after a high damage . Hence, after the
initial damage up to the 3% drift, NS3 specimen was unloaded and was then strengthened
for bending by two FRP layers top and bottom of the beam and was shear strengthened by
one layer around the joint (specimen NS3R).
E. Zamani Beydokhti and H. Shariatmadar
908
NS1R
NS2R
NS3R
Buckling of
the sheets
NS5R
Buckling of
the sheets
Figure 8. Crack pattern of strengthened specimens
Since the initial damage was high in specimen NS3R and despite the injection of epoxy
mortar inside the opened cracks on the beam in the vicinity of the column, the cracks began
to open very soon so that their width was measured 1.1 mm in the drift 2%. Increasing the
load, the crack increased to 1.8 mm in the drift 2.5%, to 2mm in the drift 3% and to 5mm in
the drift 4%. In addition in the drift 3%, L-shaped layers of the beam also buckled under
compressive stresses and the wraps on the beam also tore at the corners. At the drift 4%, the
L-shaped buckling increased and the wrap of the beam was completely cut. Although NS3R
specimen recovered the joint's lost capacity and even tolerated 2% more than NS5 specimen,
it must be mentioned that the NS3R specimen's behavior is smoother than the previous
specimens that shows the reduction of stiffness and strength of the specimen compared to
the previous reference and strengthened specimens (see Figure 7).
NS5R specimen had the highest level of damage up to 5% storey drift. After injecting
wide cracks by epoxy mortar and strengthening by FRP layers, it was retested under
reversed cyclic load.
The specimen's behavior was similar to NS3R specimen in terms of cracking but with a

EXPERIMENTAL INVESTIGATION OF DAMAGED EXTERIOR RC BEAM...
909
higher intensity. At first in the drift 1%, bending cracks began to open in the vicinity of the
column. In the drift 1.5%, L-shaped beams buckled from the surface in the vicinity of the
wraps. The specimen's stiffness was significantly decreased by separation of the FRP L-
shaped due to buckling. Then in the drift 2%, the compressive concrete crushed and the
cracks above the L-shaped strength at the right hand side of the beam began to open. Finally
in the drift 4%, L-shaped beams tore longitudinally. As it is displayed in Figure 7, the load-
displacement curve of the specimen is more inclined than that of the previous specimens
which caused the decrease of stiffness and strength of the NS5R specimen compared to the
previous specimens. Also due to the slide of the beam's longitudinal reinforcements and
separation of FRP from the concrete's surface, pinching was clearly observable.
The summary of load carrying capacity for specimens is presented in Table 3. According
to the last column of Table 3, among the specimens that have achieved the capacity of the
final drift 5%, only NS5R specimen has a lower load-carrying capacity than the basis NS5
specimen.
Table 3: Load carrying capacity of specimens in forward and backward loading
Joint ID
Maximum
Storey
Drift (%)
Forward
Capacity
(C+) (kN)
Backward
Capacity
(C-) (kN)
Ratio (+)
(C/CNS5)
Ratio (-)
(C/CNS5)
Mean
Value
NS5 (base) 5 81.26 -82.98 1 1 1
NS1 1 53.95 -53.89 0.66 0.65 0.66
NS2 1.5 65.48 -58.4 0.81 0.7 0.75
NS3 3 80.5 -79.52 0.99 0.96 0.97
NS1R 5 86.75 -85.74 1.07 1.03 1.05
NS2R 5 92.41 -76.81 1.14 0.93 1.03
NS3R 5 80.87 -87.29 1 1.05 1.02
NS5R 5 78.3 -75.68 0.96 0.91 0.94
4. COMPARISON AND DISCUSSION OF TEST RESULTS
4.1 Capacity, secant stiffness and dissipated energy
To evaluate the effectiveness of the FRP sheets reinforcement, the strength, the stiffness, and
the energy dissipation capacity for all cycles were recorded. The load carring capacity
(maximum load) in both the push or the pull direction in the cycles regarded to 0.5%, 1.5%,
3% and 5% drift ratios were recorded as given in Table 4. The initial damage in different
levels affected adversely the response of the strengthened joint. So, the repairing by the use
of EBR method is less effective in pre-damaged joints. As seen in Table 4, the initial
capacity was decreased in all strengthened joints compared with original joint (NS5). But
when the FRP sheets activated in inelastic cycles (after 0.5% drift ratio), the capacity was
exceeded in NS1R, NS2R and NS3R specimens respectively about 7%, 12% and 7% in
compare with NS5 specimen. Only in NS5R (because of high per-damage level), the
ultimate capacity decreased about 7%.

E. Zamani Beydokhti and H. Shariatmadar
910
Secant stiffness can be introduced by the line between peak positive (or negative)
direction and the origin of hysteresis loop in each loading cycle. Comparison of the repaired
and original specimens showed an improvement in secant stiffness in the moderately
damaged specimens. In the moderately damaged specimen, i.e. NS1R and NS2R, the secant
stiffness of the repaired specimens were higher than the specimen NS5 about 25-50% after
0.5% drift ratio. The lower quality and compressive strength of damaged concrete in
repaired specimens with higher pre-damage level than 1% can be the reason of decreasing in
secant stiffness about 30-50%.
According the Table 4, the cumulative dissipated energy in repaired specimens was more
than the original one at the end of the test; while the NS1R specimen showed more
dissipated energy from the bigining due to less damage level. The results of this article are in
line with those Panteladis et al. (2008). It was shown that the rehabilitation increased the
dissipated energy of the beam–column specimens in comparison to as-built specimen from
20% in NS5R specimen to 235% in NS1R specimen.
Table 4: Comparison of seismic parameters of specimens
Seismic Parameter Specimen ID Drift Levels
0.50% 1.50% 3% 5%
Maximum Capacity
(kN)
NS5 35.58 73.97 80.24 76.38
NS1R 29.36 77.87 85.86 85.8
NS2R 23.92 71.08 89.01 89.83
NS3R 16.59 55.52 85.56 80.05
NS5R 15.35 32.64 65.07 74.8
Secant Stiffness
(kN/mm)
NS5 4.6 3.28 1.52 1.05
NS1R 4 3.56 2.28 1.05
NS2R 3.3 3.26 1.89 1.06
NS3R 2.35 2.16 1.79 1.08
NS5R 1.68 1.41 1.47 0.98
Dissipated energy
(kJ)
NS5 0.21 2.15 6.91 14.18
NS1R 0.33 2.86 20.86 48.02
NS2R 0.14 1.52 14.42 43.56
NS3R 0.15 1.53 9.66 28.52
NS5R 0.2 0.95 5.48 16.92
4.2 Moment-curvature
Curvature and rotation at the joint and at the beam critical zone (distance of 2h from the side
of joint where h is the height of the beam cross section) were measured during the
experiment. The beam section curvature was measured by the 150 mm LVDT installed at
600mm from the joint face in terms of the following formulation. Using curvature, the
longitudinal strain can be obtained at the beam critical sections and the yield of
reinforcements can be controlled.
EXPERIMENTAL INVESTIGATION OF DAMAGED EXTERIOR RC BEAM...
911
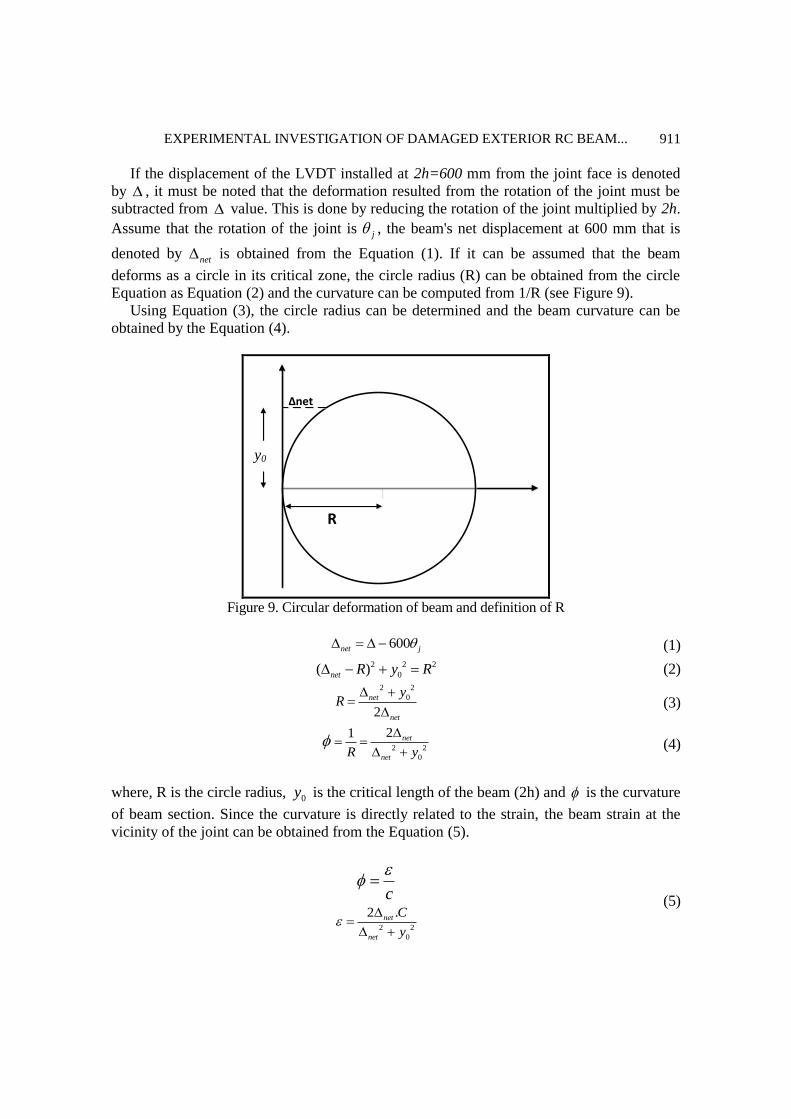
If the displacement of the LVDT installed at 2h=600 mm from the joint face is denoted
by , it must be noted that the deformation resulted from the rotation of the joint must be
subtracted from value. This is done by reducing the rotation of the joint multiplied by 2h.
Assume that the rotation of the joint is j , the beam's net displacement at 600 mm that is
denoted by net is obtained from the Equation (1). If it can be assumed that the beam
deforms as a circle in its critical zone, the circle radius (R) can be obtained from the circle
Equation as Equation (2) and the curvature can be computed from 1/R (see Figure 9).
Using Equation (3), the circle radius can be determined and the beam curvature can be
obtained by the Equation (4).
Δnet
R
Y 0
Figure 9. Circular deformation of beam and definition of R
(1) 600net j
(2) 2 2 2
0( )net R y R
(3) 2 2
0
2
net
net
yR
(4) 2 2
0
21 net
netR y
where, R is the circle radius, 0y is the critical length of the beam (2h) and is the curvature
of beam section. Since the curvature is directly related to the strain, the beam strain at the
vicinity of the joint can be obtained from the Equation (5).
(5) c
2 2
0
2 .net
net
C
y
y0
E. Zamani Beydokhti and H. Shariatmadar
912
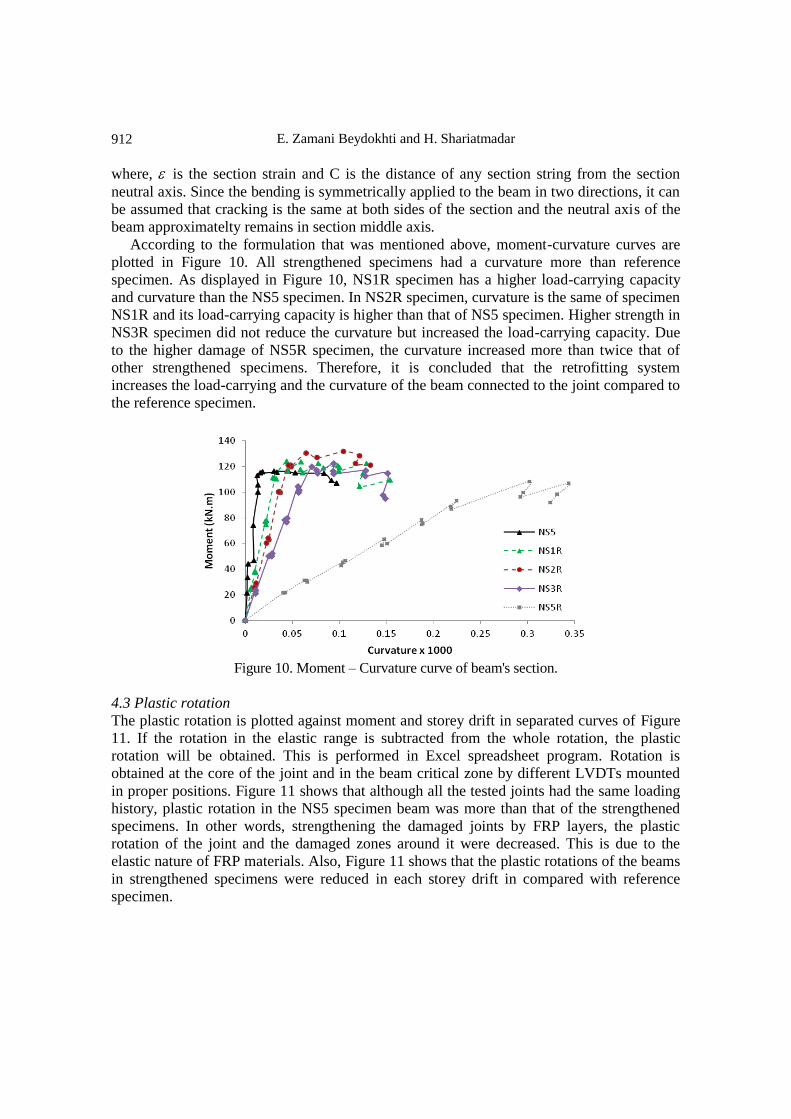
where, is the section strain and C is the distance of any section string from the section
neutral axis. Since the bending is symmetrically applied to the beam in two directions, it can
be assumed that cracking is the same at both sides of the section and the neutral axis of the
beam approximatelty remains in section middle axis.
According to the formulation that was mentioned above, moment-curvature curves are
plotted in Figure 10. All strengthened specimens had a curvature more than reference
specimen. As displayed in Figure 10, NS1R specimen has a higher load-carrying capacity
and curvature than the NS5 specimen. In NS2R specimen, curvature is the same of specimen
NS1R and its load-carrying capacity is higher than that of NS5 specimen. Higher strength in
NS3R specimen did not reduce the curvature but increased the load-carrying capacity. Due
to the higher damage of NS5R specimen, the curvature increased more than twice that of
other strengthened specimens. Therefore, it is concluded that the retrofitting system
increases the load-carrying and the curvature of the beam connected to the joint compared to
the reference specimen.
Figure 10. Moment – Curvature curve of beam's section.
4.3 Plastic rotation
The plastic rotation is plotted against moment and storey drift in separated curves of Figure
11. If the rotation in the elastic range is subtracted from the whole rotation, the plastic
rotation will be obtained. This is performed in Excel spreadsheet program. Rotation is
obtained at the core of the joint and in the beam critical zone by different LVDTs mounted
in proper positions. Figure 11 shows that although all the tested joints had the same loading
history, plastic rotation in the NS5 specimen beam was more than that of the strengthened
specimens. In other words, strengthening the damaged joints by FRP layers, the plastic
rotation of the joint and the damaged zones around it were decreased. This is due to the
elastic nature of FRP materials. Also, Figure 11 shows that the plastic rotations of the beams
in strengthened specimens were reduced in each storey drift in compared with reference
specimen.

EXPERIMENTAL INVESTIGATION OF DAMAGED EXTERIOR RC BEAM...
913
(b)
(a)
Figure 11. Plastic rotation of the beam's plastic hinge
Since the structural performance levels are determined from the plastic rotation of beams
and columns, beam and column plastic rotation-moment curves are used to evaluate of the
joint performance levels in the following section.
4.4 Performance levels
Based on FEMA 356 [14] calculating the plastic rotation in the members, the damage levels
can be computed. When the strengthening system can resist the plastic rotation up to the
level of life safety without major decrease in the load-carrying capacity (less than 10%), the
structure have acceptable performance. Analysis of the test results showed that the joint
performance level is determined by the plastic hinge located in the end of the beam that is
compatible with the weak beam-strong column theory. The load capacity and storey drift related to each performance level of specimens is
presented in Table 5. According to Table 5, the higher the specimen's capacity and drift are at
any performance level, the more acceptable behavior is achieved. NS1R specimen retained
the load-carrying capacity and the lateral displacement (drift) higher than those of the
reference specimen at any level of performance. Also, NS2R specimen performed an
acceptable behavior at any level of performance, especially in terms of the load-carrying
capacity. NS3R had an acceptable behavior up to IO performance level. But since it had a
higher initial damage than NS1R and NS2R specimens, it showed a lower load-carrying
capacity after IO level. The performance levels of NS5R specimen occurred in lower
capacity and drift compared with the reference specimen.
Table 5: Performance levels of tested B-C joints
Specimen
ID
IO Level LS Level CP Level
Drift
%
Capacity
(kN.m)
Ratio to NS5 Drift
%
Capacity
(kN.m)
Ratio to NS5 Drift
%
Capacity
(kN.m)
Ratio to NS5
Drift Capacity Drift Capacity Drift Capacity
NS5 0.44 43 1 1 1.82 107.35 1 1 3.07 115.15 1 1
NS1R 0.91 67 2.06 1.56 1.84 117 1.01 1.09 3.14 120 1.02 1.04
NS2R 0.65 46 0.72 1.07 1.43 101.47 0.78 0.95 2.75 120 0.81 1.04
NS3R 1.05 27 2.39 0.63 1.48 59 0.81 0.55 3.75 114 1.22 0.99
NS5R 0.63 19 1.43 0.44 1.36 35 0.75 0.33 3.1 86.95 1.01 0.76
E. Zamani Beydokhti and H. Shariatmadar
914
Based on the results, it is proved that behavior of two strengthened specimens, i.e. NS1R
and NS2R, improves the both performance level and load carrying capacity, simultaneously.
Therefore, the damage level of beam-column connection up to 1.5% drift ratio is considered
as the damage which can be repaired by strengthening using FRP laminates.
5. CONCLUSIONS
Eight 2/3-scale external RC beam-column joints were tested at the structural laboratory of
the Ferdowsi University of Mashhad by simultaneously applying a constant axial load and
lateral cyclic loading of increasing amplitudes. Tested specimens were comprised of five
units tested in two phases. Testes joints had non-seismic reinforcement detailing, as is
typical of pre-1970 Iranian construction practice before the introduction of seismic code
provisions. C-FRP sheets were used to wrap the critical regions of the beam member and the
joint panel zone of the examined sub-assemblages. Based on the experimental observations
and data processing results, the following conclusions are drawn:
1- The results showed that the method is effective and capable of restoring or even
upgrading load-carrying capacity and initial stiffness of damaged joints.
2- Comparison of the repaired and original specimens showed an improvement in secant
stiffness in the moderately damaged specimens, i.e. NS1R and NS2R. Secant stiffness of
these repaired specimens were higher than the specimen NS5 about 25-50% after 0.5%
drift ratio.
3- It was shown that the rehabilitation increased the dissipated energy of the B-C joints in
comparison to as-built specimen from 20% in NS5R specimen to 235% in NS1R
specimen.
4- The performance level of damaged joints under cyclic tests was improved. it is deduced
that behavior of two strengthened moderately damaged specimens, i.e. NS1R and NS2R,
improves the both performance level and load carrying capacity, simultaneously.
5- The repair ability level of damage was also evaluated up to 1.5% drift ratio for tested B-C
joints. Nevertheless, the plastic rotation of critical beam section and joint was decreased
due to elastic nature of FRP materials.
NOTATIONS
h: Depth of section
: The displacement at 2h=600 mm from the joint face
j : The rotation of the joint
net : The beam's net displacement at 600 mm
R: Circle radius if the beam’s deformed shape could be assumed as a circle in its critical
zone
0y : The critical length of the beam (2h)
: The curvature of beam’s section

EXPERIMENTAL INVESTIGATION OF DAMAGED EXTERIOR RC BEAM...
915
: The section strain
C: The distance of any section fiber from the section neutral axis
: Deformed bar
y : Rotation at general yielding state of the joint
u : Rotation at general ultimate state of the joint
y : Displacement at general yielding state of the joint
u : Displacement at general yielding state of the joint
REFERENCES
1. Park R, Paulay T. Reinforced Concrete Structures, Wiley, New York, 1975
2. Rizkalla S, Hassan T, Hassan N. Design recommendations for the use of FRP for
reinforcement and strengthening of concrete structures, Progress in Structural Engineering
and Materials, No. 1, 5(2003) 16-28.
3. Vatani-Oskouei A. Repairing of seismically damaged RC exterior beam-column connection
using CFRP, Journal of Reinforced Plastics and Composites, 2010.
4. Almusallam TH, Elsanadedy HM, Al-Salloum YA, Alsayed SH. Experimental and
numerical investigation for the flexural strengthening of rc beams using near-surface
mounted steel or GFRP bars, Construction and Building Materials, 40(2013) 145-61.
5. Del Vecchio C, Di Ludovico M, Balsamo A, Prota A, Manfredi G, Dolce M. Experimental
investigation of exterior RC beam-column joints retrofitted with FRP systems, Journal of
Composites for Construction, No. 4, 18 (2014) 04014002.
6. Hadi MN, Tran TM. Seismic rehabilitation of reinforced concrete beam–column joints by
bonding with concrete covers and wrapping with FRP composites, Materials and Structures,
(2014) 1-19.
7. Li J, Samali B, Ye L, Bakoss S. Behaviour of concrete beam–column connections
reinforced with hybrid FRP sheet, Composite Structures, No. 1, 57(2002) 357-65.
8. Antonopoulos CP, Triantafillou TC. Analysis of FRP-strengthened RC beam-column joints,
Journal of Composites for Construction, No. 1, 6(2002) 41-51.
9. Li B, Kai Q. Seismic behavior of reinforced concrete interior beam-wide column joints
repaired using FRP, Journal of Composites for Construction, No. 3, 15(2010) 327-38.
10. Balsamo A, Colombo A, Manfredi G, Negro P, Prota A. Seismic behavior of a full-scale RC
frame repaired using CFRP laminates, Engineering Structures, No. 5, 27(2005) 769-80.
11. Garcia R, Jemaa Y, Helal Y, Guadagnini M, Pilakoutas K. Seismic strengthening of
severely damaged beam-column RC joints using CFRP, Journal of Composites for
Construction, No. 2, 18(2013).
12. Realfonzo R, Napoli A, Pinilla JGR. Cyclic behavior of RC beam-column joints
strengthened with FRP systems, Construction and Building Materials, 54(2014) 282-97.
13. Association CS. Design of concrete structures, CSA A23. 3-04, CSA, Rexdale, Ontario,
2004.
14. FEMA356. Prestandard and Commentary for the Seismic Rehabilitation of Buildings:
Rehabilitation Requirement s. American Society of Civil Engineers Washington, DC, 2000.
15. Ilki A, Bedirhanoglu I, Kumbasar N. Behavior of FRP-retrofitted joints built with plain bars
E. Zamani Beydokhti and H. Shariatmadar
916
and low-strength concrete, Journal of Composites for Construction, No. 3, 15(2010) 312-26.
16. Pantelides CP, Okahashi Y, Reaveley L. Seismic rehabilitation of reinforced concrete frame
interior beam-column joints with FRP composites, Journal of Composites for Construction,
No. 4, 12(2008) 435-45.
17. ACI440.2R-08. Guide for the design and construction of externally bonded FRP system for
strengthening concrete structures, in ACI 440.2R-08, Michigan (USA), 2008.
18. Iranian Code of Practice for Seismic Resistant Design of Buildings, Standard No.2800,
Building and housing research center (BHRC), 2005.