Embed Size (px)
Citation preview
1
Experimental Implementation of
Spectrum Sensing Using Cognitive Radio
Prepared by:
Kendall Schmalz
Faculty Advisors:
Dr. Yanxiao Zhao
Assistant Professor, Electrical and Computer Engineering
Dr. Thomas Montoya
Associate Professor, Electrical and Computer Engineering
Dr. Alfred Boysen
Professor, Department of Humanities
Program Information:
National Science Foundation
Grant # 1359476
Research Experience for Undergraduates
Summer 2014
South Dakota School of Mines and Technology
501 E Saint Joseph Street
Rapid City, South Dakota
2
Table of Contents
Abstract..………………………………………………………………………………...……….3
Introduction……………………………………………………………………....………………4
Broader Impact…………………………………………………………………………….……..8
Procedure…………………………………………………………………………..……………..9
Results…………………………………………………………………………………..……….13
Discussion………………………………….......………………………………………………...15
Conclusion.....................................................................................……………………................16
Acknowledgments.........................................................................................................................18
3
Abstract
Cognitive radio (CR) is designed to detect available frequency bands/channels. Spectrum sensing
plays a critical role in CR with energy detection being the most common method. In our paper,
we implement energy detection using GNU Radio and USRP boards as a test-bed. Specifically,
energy detection is performed by using blocks in GNU Radio Companion (GRC) to calculate the
energy of a present signal and compare it against a threshold to determine whether or not the
channel is occupied by a signal. Extensive experiments are conducted and sensing performance
including false alarm and misdetection is analyzed as well.
4
1. Introduction
As the frequency spectrum continues to become more and more crowded, especially under 3
GHz, it is becoming more challenging to allocate available frequency bands to future
applications. On the other hand, there are still a lot of licensed areas of the spectrum which are
underutilized. Cognitive Radio Network (CRN) is one promising way of utilizing the spectrum to
the utmost efficiency. CR gives us this opportunity because it is able to detect unused portions of
the frequency spectrum and share with unlicensed users without causing harmful interference to
licensed users.
There are three fundamental steps to successfully implement a CRN: spectrum sensing,
spectrum sharing, and spectrum management. These three steps will be briefly introduced as
follows.
1.1. Spectrum Sensing
Spectrum sensing is the process in which secondary users (SU) (unlicensed users of the
spectrum) obtain information about the spectrum usage so that interference will not occur with
primary users (PU) (licensed users) [3]. Experimental implementation of spectrum sensing will
be discussed in this paper. There are some common approaches of spectrum sensing. Energy
detection (ED) is one such sensing method, which will be used due to simplicity of
implementation and most importantly, no need for prior knowledge of the signal is required. ED
is designed to sense the level of energy of a potential signal and compare it against a threshold.
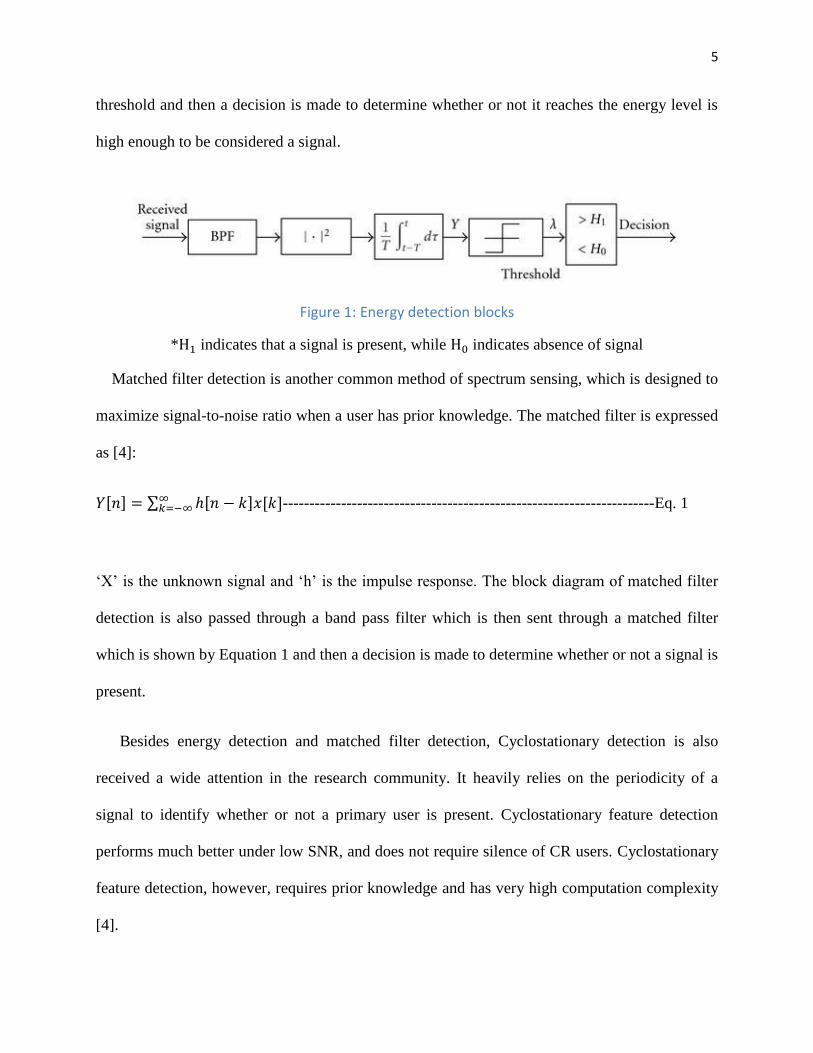
Figure 1 shows the block implementation of ED. A signal is first sent through a band pass filter
and then integrated over the square of the signal. This value is compared against a pre-define
5
threshold and then a decision is made to determine whether or not it reaches the energy level is
high enough to be considered a signal.
Figure 1: Energy detection blocks
*H1 indicates that a signal is present, while H0 indicates absence of signal
Matched filter detection is another common method of spectrum sensing, which is designed to
maximize signal-to-noise ratio when a user has prior knowledge. The matched filter is expressed
as [4]:
𝑌[𝑛] = ∑ ℎ[𝑛 − 𝑘]𝑥[𝑘]∞𝑘=−∞ ----------------------------------------------------------------------Eq. 1
‘X’ is the unknown signal and ‘h’ is the impulse response. The block diagram of matched filter
detection is also passed through a band pass filter which is then sent through a matched filter
which is shown by Equation 1 and then a decision is made to determine whether or not a signal is
present.
Besides energy detection and matched filter detection, Cyclostationary detection is also
received a wide attention in the research community. It heavily relies on the periodicity of a
signal to identify whether or not a primary user is present. Cyclostationary feature detection
performs much better under low SNR, and does not require silence of CR users. Cyclostationary
feature detection, however, requires prior knowledge and has very high computation complexity
[4].
6
1.2. Spectrum Sharing and Spectrum Management
With sensing results from the spectrum sensing process, spectrum sharing is the simultaneous
usage of specific radio frequencies in a certain geographical region [5]. Transmit power has to be
minimized to eliminate interference to nearby signals.
Spectrum management is the process of capturing the best available spectrum and limiting the
interference between users. Note that spectrum sharing and spectrum management are left for
future research. The main focus of this paper is on spectrum sensing.
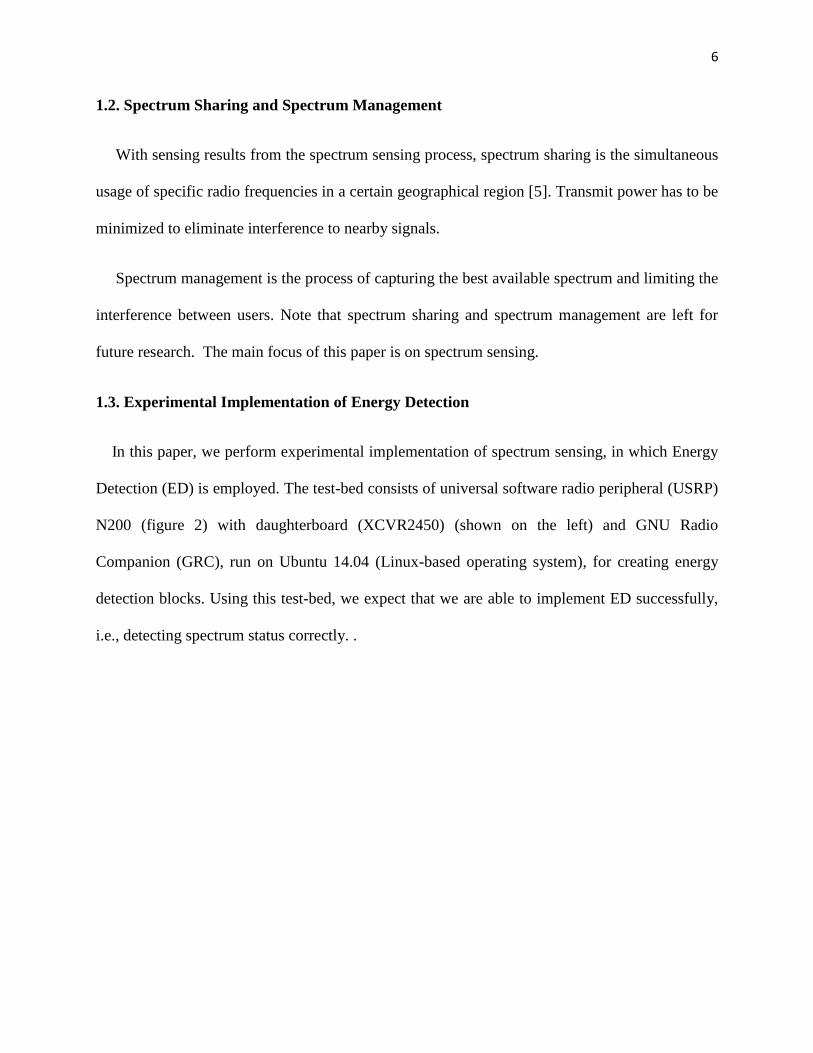
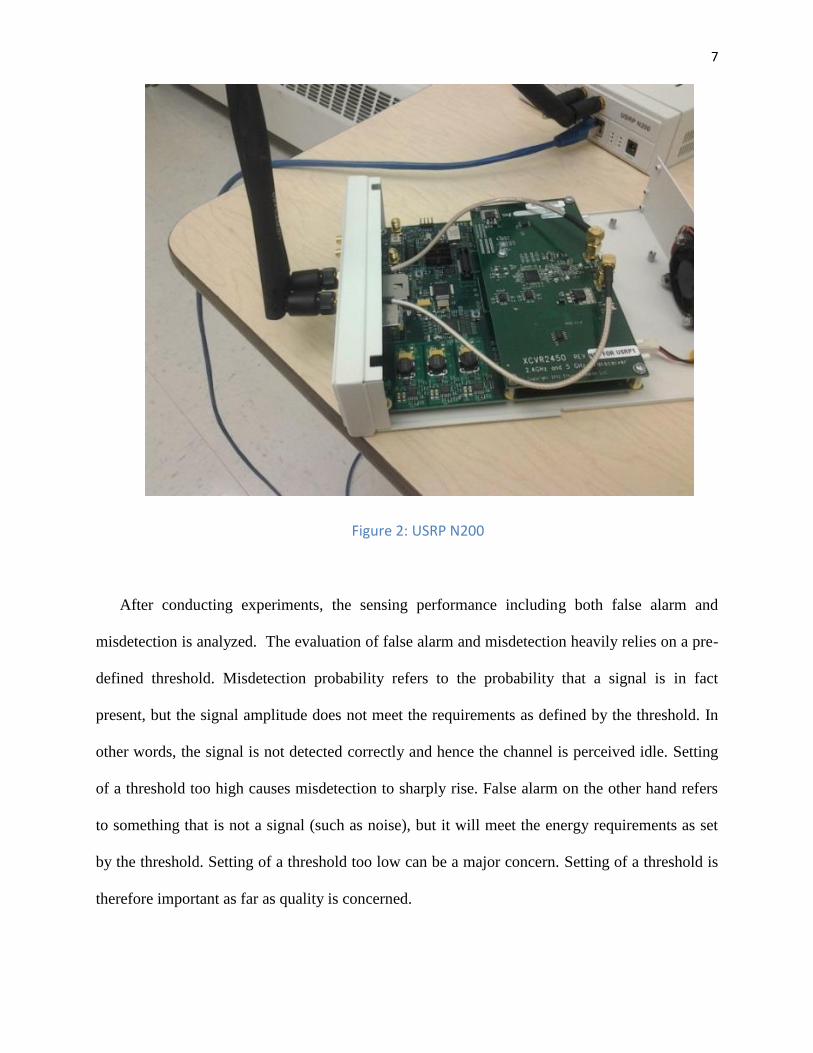
1.3. Experimental Implementation of Energy Detection
In this paper, we perform experimental implementation of spectrum sensing, in which Energy
Detection (ED) is employed. The test-bed consists of universal software radio peripheral (USRP)
N200 (figure 2) with daughterboard (XCVR2450) (shown on the left) and GNU Radio
Companion (GRC), run on Ubuntu 14.04 (Linux-based operating system), for creating energy
detection blocks. Using this test-bed, we expect that we are able to implement ED successfully,
i.e., detecting spectrum status correctly. .
7
After conducting experiments, the sensing performance including both false alarm and
misdetection is analyzed. The evaluation of false alarm and misdetection heavily relies on a pre-
defined threshold. Misdetection probability refers to the probability that a signal is in fact
present, but the signal amplitude does not meet the requirements as defined by the threshold. In
other words, the signal is not detected correctly and hence the channel is perceived idle. Setting
of a threshold too high causes misdetection to sharply rise. False alarm on the other hand refers
to something that is not a signal (such as noise), but it will meet the energy requirements as set
by the threshold. Setting of a threshold too low can be a major concern. Setting of a threshold is
therefore important as far as quality is concerned.
Figure 2: USRP N200
8
Setting a threshold in ED can be somewhat difficult if a low signal-to-noise ratio is present. As
will be seen in the results portion of the paper, a threshold was set to -60dB, which results in a
very high percentage of both misdetection and false alarm. Eliminating both misdetection and
false alarm probability must be overcome before implementation can take place.
2. Broader Impact
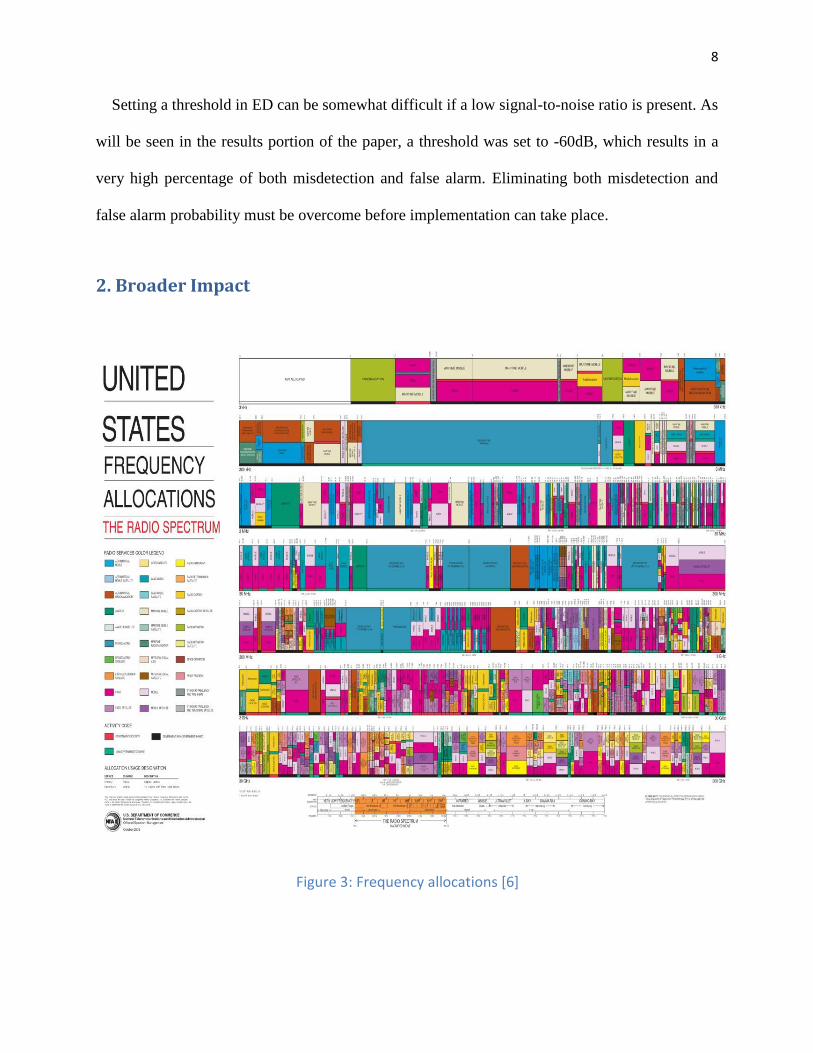
Figure 3: Frequency allocations [6]
9
As we continue to add more wireless devices (smartphones, tablets, computers, etc.), we are
making our lives easier and more enjoyable, but problems arise with an increasing demand for
these products. It is becoming increasingly difficult to find the optimum frequency band.
Cognitive radio is envisioned promising to solve this problem by dynamically allocating the area
of the spectrum, which are getting increasingly compact and also makes use of the areas which
lay mostly vacant. The frequency spectrum is much like land in that one cannot simply make
more land, but instead making the most of what is given can go a long way. Figure 3 shows the
allocation of different parts of the radio spectrum, which is becoming increasingly cluttered,
making adding more advances in wireless communication more difficult. Being able to use the
frequencies whenever they become available by the use of CR is becoming more relevant.
3. Procedure
In this paper, we set up a test-bed using the USRP N200 and daughterboard (XCVR2450) as
shown in Figure 2. After connecting this to a computer and installing GNU Radio Companion
(GRC) on Ubuntu 14.04, we could proceed to carry out the experiment. After successfully
writing a few lines of code, we are able to visually see what sort of signal is being received, but
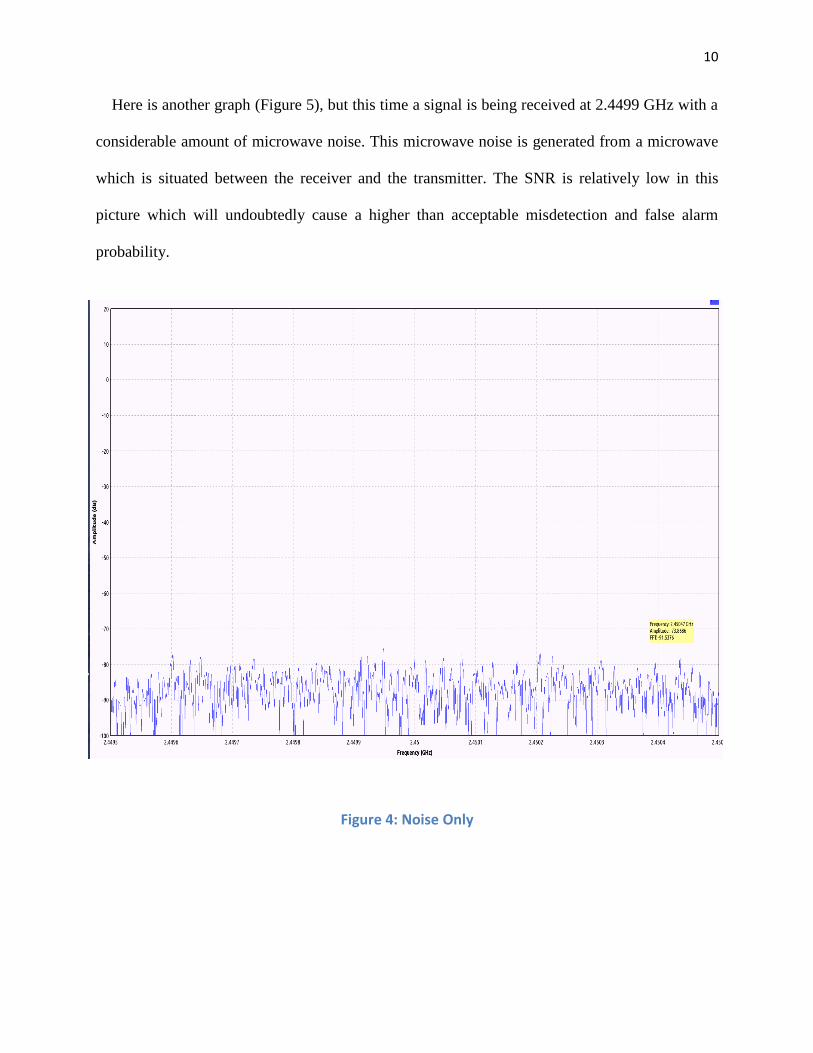
also what effect noise can have on a signal as well. Figure 4 shows what sort of noise is present
at a given time in our experiment. Without a signal being received, the amount of noise appears
to be very even and with a very low energy (in dB).
10
Here is another graph (Figure 5), but this time a signal is being received at 2.4499 GHz with a
considerable amount of microwave noise. This microwave noise is generated from a microwave
which is situated between the receiver and the transmitter. The SNR is relatively low in this
picture which will undoubtedly cause a higher than acceptable misdetection and false alarm
probability.
Figure 4: Noise Only

11
Figure 5: Signal received at 2.4499 GHz with low SNR

12
To effectively create a threshold, many experiments must be done using the same set
parameters, such as noise level (in our case we used a microwave oven), frequency, and distance.
Experiments could also be done at longer distances while varying levels of noise. After doing
the experiment ten times, we could finally move on to setting various thresholds from -20db to -
90db to analyze sensing performance. Two metrics, i.e., probabilities of false alarm and
misdetection, are measured. The blue line in figure 6 shows an example of what a potential
threshold could be, so that misdetection and false alarm probability are minimalized. This
threshold (-50dB), though, would not be equal on all graphs because both the power and the
noise will very in all graphs. Once thresholds are created, it must be determined at which point
gives us the lowest combined misdetection and false alarm probability
Figure 6: Example threshold at -50 dB
13
4. Results
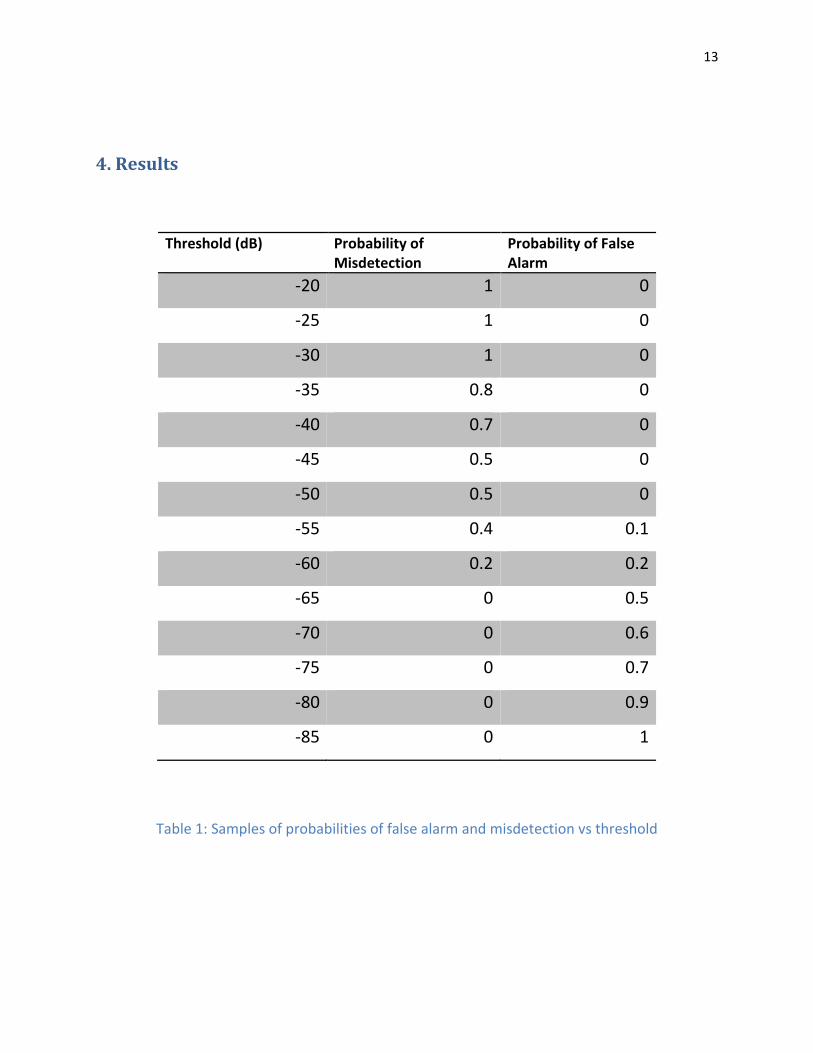
Table 1: Samples of probabilities of false alarm and misdetection vs threshold
Threshold (dB) Probability of Misdetection
Probability of False Alarm
-20 1 0
-25 1 0
-30 1 0
-35 0.8 0
-40 0.7 0
-45 0.5 0
-50 0.5 0
-55 0.4 0.1
-60 0.2 0.2
-65 0 0.5
-70 0 0.6
-75 0 0.7
-80 0 0.9
-85 0 1

14
After running the ten samples, and determining different intervals (5dB apart), the following
excel sheet is created which gives the threshold level followed by the percent of false alarm and
misdetection at said threshold. From this (table 1), Figure 7 is plotted to give a visual
understanding of the trends of false alarm and misdetection.
False Alarm and Misdetection vs. Threshold
Figure 7: False alarm and misdetection probabilities vs. thresholds (in dB)
0
0.2
0.4
0.6
0.8
1
-100 -80 -60 -40 -20 0
Pe
rce
nt
of
mis
det
ect
ion
an
dfa
lse
ala
rm p
rob
abili
ty
Misdetection
False Alarm
15
It appears that -60db is the optimum level for misdetection and false alarm probability, but at
the intersecting point, this number is 20%, which is much higher than expected. The sensing
results are affected by several factors. For instance, currently, only 10 samples are collected and
the result is expected better with more samples. Different environments with varying levels of
noise will without a doubt have impact on the probability of false alarm and misdetection. Also
the distance of the receivers will have an effect on the SNR.
5. Discussion
We have conducted extensive energy detection (ED) experiments using USRP and GNU
radio. Some promising preliminary results are obtained followed by sensing performance
analysis. However, many problems still exist with ED. As shown in Section 4, with microwave
noise (Wi-Fi and other interferences are included); -60db appeared to be the optimum threshold
with an exuberant amount of probability of misdetection and false alarm. There have been many
proposals to lowering this percentage of misdetection and false alarm probability. One method,
proposed in [2] was to implement two thresholds which instead of simply choosing one threshold
and accounting only for energy levels above that point. The double threshold method would
account only for values in between the two thresholds and make a decision from that point.
One method that we are strongly considering though, is a method which accounts for both
bandwidth and energy detection. In this method, the bandwidth of a signal would have to be
within a certain range and anything outside of that would not be considered a signal (noise by
definition has unlimited bandwidth, so this would eliminate most noise) which in theory leads to
a lower false alarm and misdetection probability. Future work will be done on proving whether
or not this method works as well in practice as it does theoretically.
16
6. Conclusion
Energy detection is a common approach of spectrum sensing. In this paper, we have
implemented energy detection by setting up a test-bed using USRP and GNU radio. Sensing
results show that currently we obtain 20% misdetection and false alarm probability, which is by
no means perfect. More efforts should be put forth to improve the sensing performance. In
future, we will propose new approach based on energy detection and conduct more experiments.
17
References
1. Bodepudi Mounika , Kolli Ravi Chandra , Rayala Ravi Kumar. "Spectrum Sensing
Techniques and Issues in Cognitive Radio". International Journal of Engineering Trends
and Technology (IJETT). V4(4):695-699 Apr 2013. ISSN: 2231-5381.
www.ijettjournal.org. published by seventh sense research group.
2. Kalamkar, S. S., & Banerjee, A. (2013, January 1). “Improved Double Threshold Energy
Detection for Cooperative Spectrum Sensing in Cognitive Radio”. Academia.edu.
Retrieved July 29, 2014.
3. Zhao, Y., Huang, J., Pradhan, J., & Sun, H. “Experimental Approach: Energy-and-
Bandwidth Spectrum Sensing Using GNU Radio and USRP”, ACM RACS, 2014.
4. Verma, P. K., Taluja, S., & Dua, R. L. Performance analysis of Energy detection,
Matched filter detection & Cyclostationary feature detection Spectrum Sensing
Techniques. International Journal of Computational Engineering Research, 2. from
http://www.ijceronline.com/papers/Vol2_issue5/T02512961301.pdf.
5. Wyglinski, A., Nekovee, M., & Hou, Y. (2009, December 1). “Cognitive Radio
Communications and Networks: Principles and Practice”. from
http://ecewp.ece.wpi.edu/wordpress/wireless/files/2011/11/crtextbook_ch05.pdf.
6. Frequency allocation. (2014, February 8). Retrieved August 8, 2014, from
http://en.wikipedia.org/wiki/Frequency_allocation
18
Acknowledgments
The funding for this research came from the National Science Foundation. Thanks to advisors
Dr. Yanxiao Zhao, Dr. Thomas Montoya, Dr. Alfred Boysen and also to all of the students of
EEP 339 for helping me out immensely on this project.