Embed Size (px)
Citation preview
International Journal of Research and Scientific Innovation (IJRSI) | Volume IV, Issue VIIS, July 2017 | ISSN 2321–2705
www.rsisinternational.org Page 174
Energy Detection Spectrum Sensing in Cognitive
Radio
Swati Singhal, Neelu Trivedi, Shilpi Pal
ECE (Electronics & Communication Engineering), IFTM University, Moradabad, Uttar Pradesh, India
Abstract: -Wireless communications and the utilization of the
radio frequency spectrum have witnessed a tremendous boom
during the past few decades. The current static frequency
allocation schemes are unable to accommodate the requirements
of an increasing number of higher data rate devices. Cognitive
radio (CR) with effective primary user detection has become a
candidate for more efficient spectrum utilization systems based
on opportunistic spectrum sharing . Spectrum sensing is a
challenging task for cognitive radio. Energy detection is one of
the popular spectrum sensing technique for cognitive radio.
In this paper, we analyze the performance of energy detection
technique to detect primary user (PU). To evaluate the
performance of the detection techniques, MATLAB software has
been used for simulation. Simulations were carried out and
graphs of probability of detection vs. the probability of false
alarm were observed and analysed. The detection probability
increases with respect to the increase in false alarm. Also
significant reduction in probability of missed detection have been
achieved with this sensing technique. The detection probability
also varies with the SNR value. SNR has a great influence on the
probability of detection. With an increase in SNR value, the
probability of detection increases.
I. INTRODUCTION
ognitive radio based on dynamic spectrum access, arises
to be a tempting solution to the spectral congestion
problem by introducing opportunistic usage of the frequency
bands that are not heavily occupied by licensed users. With
dynamic spectrum access, secondary (unlicensed) users can
access spectrum owned by primary (licensed) users when it is
temporally and/or geographically unused. This unused
spectrum is termed as spectrum opportunity. The ability to
reliably and autonomously identify unused frequency bands is
envisaged as one of the main functionalities of cognitive
radios.
II. MAIN FUNCTIONS OF CR
1. Spectrum Sensing: this is a fundamental function in CR
to enable cognitive radio users (CRs) to detect the
underutilized spectrum of primary systems and
improve overall spectrum efficiency.
2. Spectrum Management: functions are required for CR
to achieve users’ communication needs by capturing
the best available spectrum; CR should decide on the
best spectrum band and the channels within it to meet
the QoS requirements over all available spectrum
channels.
3. Spectrum Mobility: this is the process whereby
cognitive radio users change their frequency of
operation. Cognitive radio networks aim to use the
spectrum dynamically by allocating the radio terminals
to operate in the greatest available frequency channels.
4. Spectrum Sharing: this is one of the main challenges in
open spectrum usage, providing efficient and fair
dynamic spectrum allocation methods to distribute the
unoccupied spectrum of primary users to the
competitive secondary users.
Being the focus of this paper, spectrum sensing by far is the
most important component for the establishment of cognitive
radio. Spectrum sensing is the task of obtaining awareness
about the spectrum usage and existence of primary users in a
geographical area. This awareness can be obtained by using
geolocation and database, by using beacons, or by local
spectrum sensing at cognitive radios . In this paper, we focus
on spectrum sensing performed by cognitive radios because of
its broader application areas and lower infrastructure
requirement.
III. CLASSIFICATION OF SPECTRUM SENSING
Spectrum sensing (SS) refers to detecting the spectrum holes
(unused spectrum) and sharing it without harmful interference
with other cognitive users. It is the task of obtaining spectrum
occupancy information. The most efficient and simple
approach to identify spectrum opportunity with low
infrastructure requirement is to detect primary receiver within
operative range of CR. Practically, however, it is not feasible
as CR cannot locate PU receiver, and hence, spectrum sensing
techniques usually rely on primary transmitter detection.
Before looking into the details of spectrum sensing methods,
we summarize the typical grouping of SS schemes in Fig. 1
and highlight characteristic features of these sensing
approaches in the following.
C
International Journal of Research and Scientific Innovation (IJRSI) | Volume IV, Issue VIIS, July 2017 | ISSN 2321–2705
www.rsisinternational.org Page 175
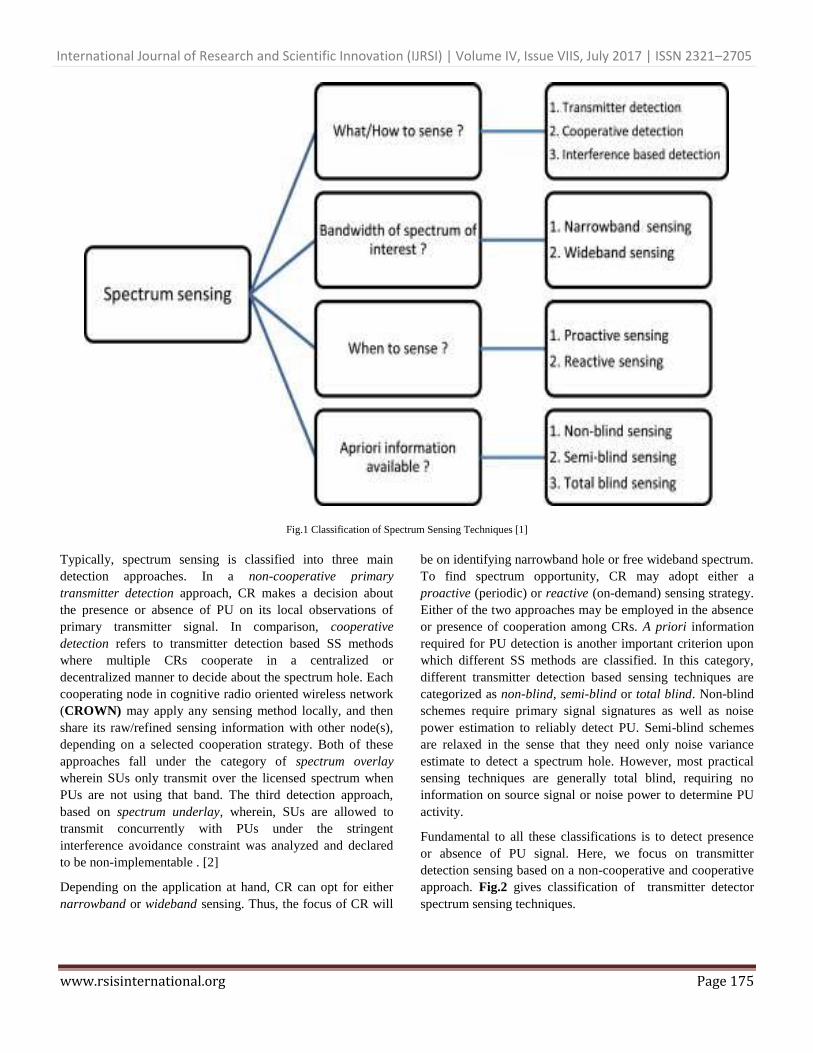
Fig.1 Classification of Spectrum Sensing Techniques [1]
Typically, spectrum sensing is classified into three main
detection approaches. In a non-cooperative primary
transmitter detection approach, CR makes a decision about
the presence or absence of PU on its local observations of
primary transmitter signal. In comparison, cooperative
detection refers to transmitter detection based SS methods
where multiple CRs cooperate in a centralized or
decentralized manner to decide about the spectrum hole. Each
cooperating node in cognitive radio oriented wireless network
(CROWN) may apply any sensing method locally, and then
share its raw/refined sensing information with other node(s),
depending on a selected cooperation strategy. Both of these
approaches fall under the category of spectrum overlay
wherein SUs only transmit over the licensed spectrum when
PUs are not using that band. The third detection approach,
based on spectrum underlay, wherein, SUs are allowed to
transmit concurrently with PUs under the stringent
interference avoidance constraint was analyzed and declared
to be non-implementable . [2]
Depending on the application at hand, CR can opt for either
narrowband or wideband sensing. Thus, the focus of CR will
be on identifying narrowband hole or free wideband spectrum.
To find spectrum opportunity, CR may adopt either a
proactive (periodic) or reactive (on-demand) sensing strategy.
Either of the two approaches may be employed in the absence
or presence of cooperation among CRs. A priori information
required for PU detection is another important criterion upon
which different SS methods are classified. In this category,
different transmitter detection based sensing techniques are
categorized as non-blind, semi-blind or total blind. Non-blind
schemes require primary signal signatures as well as noise
power estimation to reliably detect PU. Semi-blind schemes
are relaxed in the sense that they need only noise variance
estimate to detect a spectrum hole. However, most practical
sensing techniques are generally total blind, requiring no
information on source signal or noise power to determine PU
activity.
Fundamental to all these classifications is to detect presence
or absence of PU signal. Here, we focus on transmitter
detection sensing based on a non-cooperative and cooperative
approach. Fig.2 gives classification of transmitter detector
spectrum sensing techniques.
International Journal of Research and Scientific Innovation (IJRSI) | Volume IV, Issue VIIS, July 2017 | ISSN 2321–2705
www.rsisinternational.org Page 176
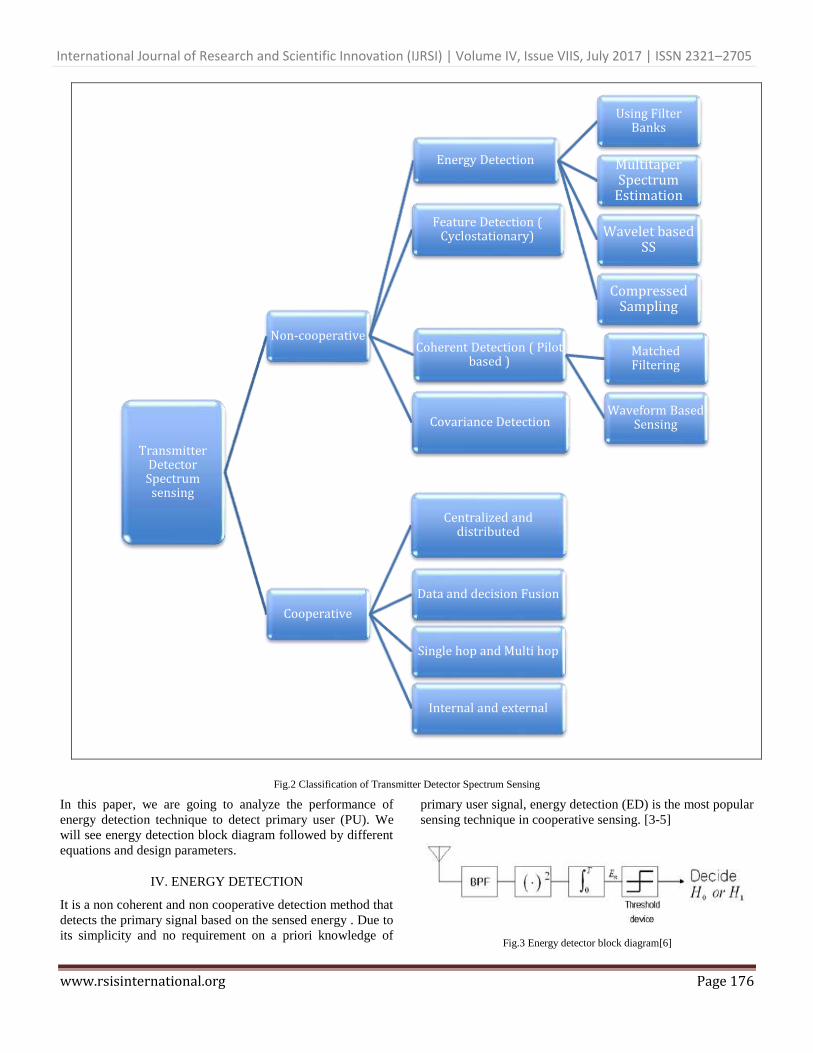
Fig.2 Classification of Transmitter Detector Spectrum Sensing
In this paper, we are going to analyze the performance of
energy detection technique to detect primary user (PU). We
will see energy detection block diagram followed by different
equations and design parameters.
IV. ENERGY DETECTION
It is a non coherent and non cooperative detection method that
detects the primary signal based on the sensed energy . Due to
its simplicity and no requirement on a priori knowledge of
primary user signal, energy detection (ED) is the most popular
sensing technique in cooperative sensing. [3-5]
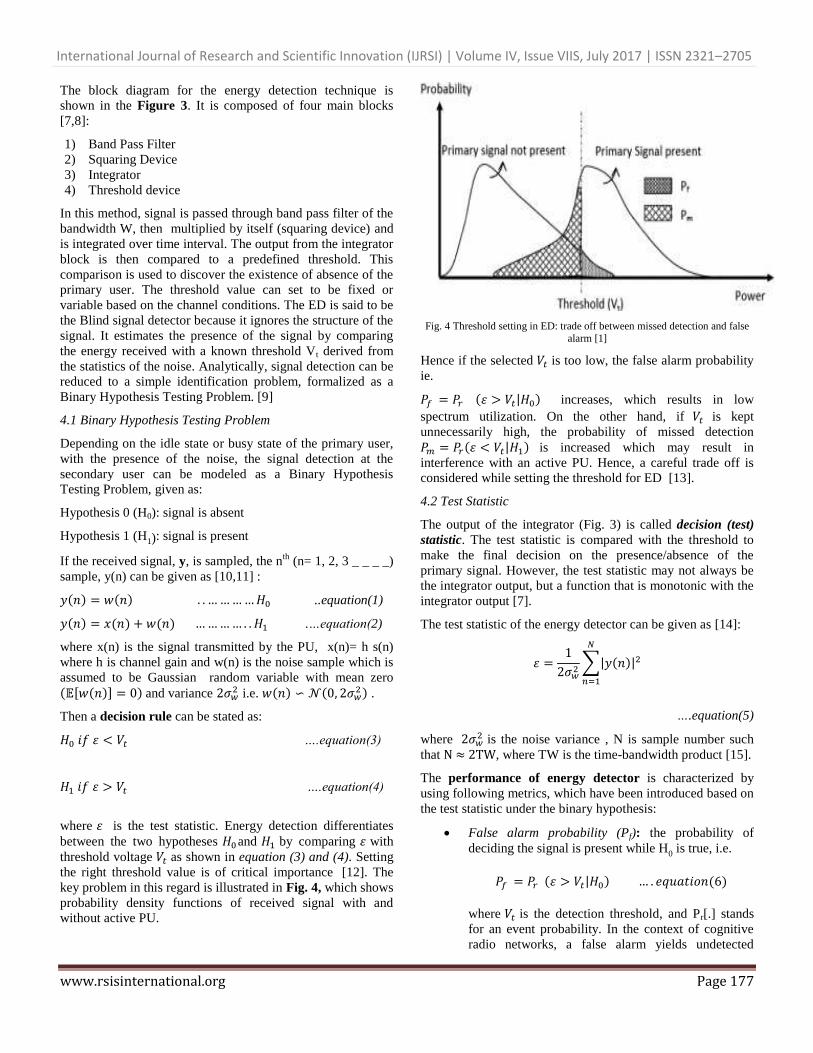
Fig.3 Energy detector block diagram[6]
Transmitter Detector Spectrum sensing
Non-cooperative
Energy Detection
Using Filter Banks
Multitaper Spectrum
Estimation
Wavelet based SS
Compressed Sampling
Feature Detection ( Cyclostationary)
Coherent Detection ( Pilot based )
Matched Filtering
Waveform Based Sensing Covariance Detection
Cooperative
Centralized and distributed
Data and decision Fusion
Single hop and Multi hop
Internal and external
International Journal of Research and Scientific Innovation (IJRSI) | Volume IV, Issue VIIS, July 2017 | ISSN 2321–2705
www.rsisinternational.org Page 177
The block diagram for the energy detection technique is
shown in the Figure 3. It is composed of four main blocks
[7,8]:
1) Band Pass Filter
2) Squaring Device
3) Integrator
4) Threshold device
In this method, signal is passed through band pass filter of the
bandwidth W, then multiplied by itself (squaring device) and
is integrated over time interval. The output from the integrator
block is then compared to a predefined threshold. This
comparison is used to discover the existence of absence of the
primary user. The threshold value can set to be fixed or
variable based on the channel conditions. The ED is said to be
the Blind signal detector because it ignores the structure of the
signal. It estimates the presence of the signal by comparing
the energy received with a known threshold Vt derived from
the statistics of the noise. Analytically, signal detection can be
reduced to a simple identification problem, formalized as a
Binary Hypothesis Testing Problem. [9]
4.1 Binary Hypothesis Testing Problem
Depending on the idle state or busy state of the primary user,
with the presence of the noise, the signal detection at the
secondary user can be modeled as a Binary Hypothesis
Testing Problem, given as:
Hypothesis 0 (H0): signal is absent
Hypothesis 1 (H1): signal is present
If the received signal, y, is sampled, the nth
(n= 1, 2, 3 _ _ _ _)
sample, y(n) can be given as [10,11] :
( ) ( ) ..equation(1)
( ) ( ) ( ) .…equation(2)
where x(n) is the signal transmitted by the PU, x(n)= h s(n)
where h is channel gain and w(n) is the noise sample which is
assumed to be Gaussian random variable with mean zero
( [ ( )] ) and variance i.e. ( ) (
) .
Then a decision rule can be stated as:
….equation(3)
….equation(4)
where is the test statistic. Energy detection differentiates
between the two hypotheses and by comparing with
threshold voltage as shown in equation (3) and (4). Setting
the right threshold value is of critical importance [12]. The
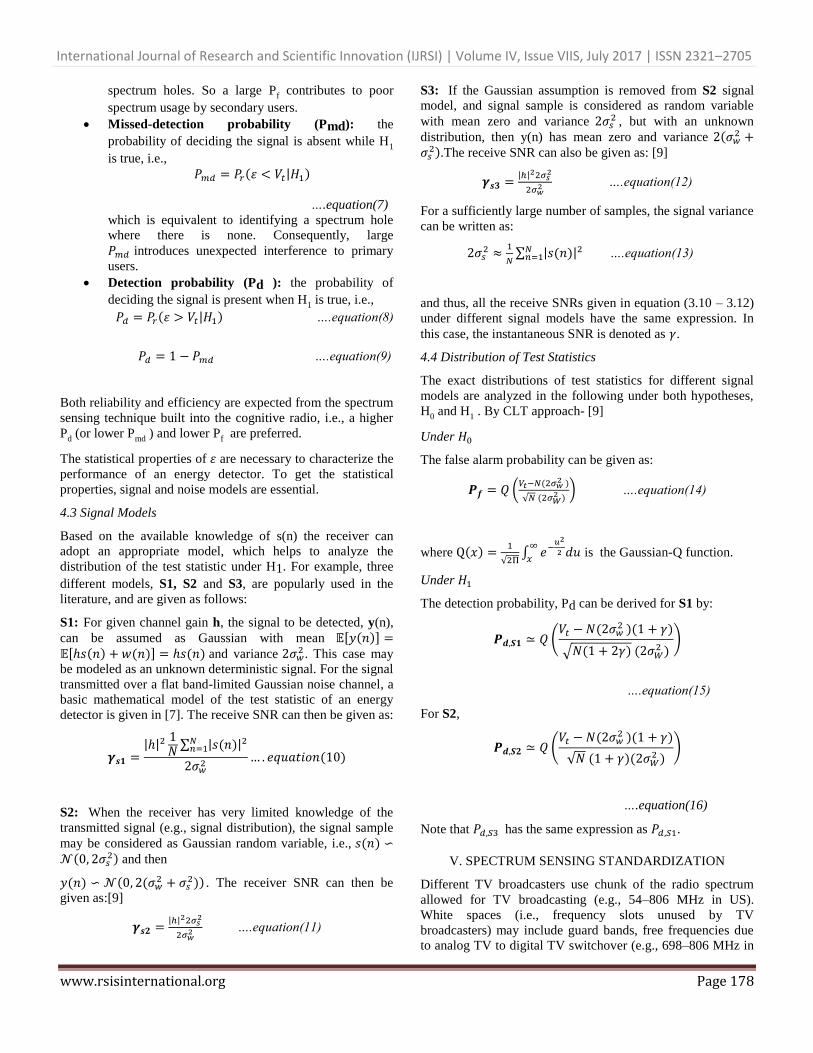
key problem in this regard is illustrated in Fig. 4, which shows
probability density functions of received signal with and
without active PU.
Fig. 4 Threshold setting in ED: trade off between missed detection and false
alarm [1]
Hence if the selected is too low, the false alarm probability
ie.
( | ) increases, which results in low
spectrum utilization. On the other hand, if is kept
unnecessarily high, the probability of missed detection
( | ) is increased which may result in
interference with an active PU. Hence, a careful trade off is
considered while setting the threshold for ED [13].
4.2 Test Statistic
The output of the integrator (Fig. 3) is called decision (test)
statistic. The test statistic is compared with the threshold to
make the final decision on the presence/absence of the
primary signal. However, the test statistic may not always be
the integrator output, but a function that is monotonic with the
integrator output [7].
The test statistic of the energy detector can be given as [14]:
∑| ( )|
….equation(5)
where is the noise variance , N is sample number such
that N ≈ TW, where TW is the time-bandwidth product [15].
The performance of energy detector is characterized by
using following metrics, which have been introduced based on
the test statistic under the binary hypothesis:
False alarm probability (Pf): the probability of
deciding the signal is present while H0 is true, i.e.
( | ) ( )
where is the detection threshold, and Pr[.] stands
for an event probability. In the context of cognitive
radio networks, a false alarm yields undetected
International Journal of Research and Scientific Innovation (IJRSI) | Volume IV, Issue VIIS, July 2017 | ISSN 2321–2705
www.rsisinternational.org Page 178
spectrum holes. So a large Pf contributes to poor
spectrum usage by secondary users.
Missed-detection probability (Pmd): the
probability of deciding the signal is absent while H1
is true, i.e.,
( | )
….equation(7)
which is equivalent to identifying a spectrum hole
where there is none. Consequently, large
introduces unexpected interference to primary
users.
Detection probability (Pd ): the probability of
deciding the signal is present when H1 is true, i.e.,
( | ) ….equation(8)
….equation(9)
Both reliability and efficiency are expected from the spectrum
sensing technique built into the cognitive radio, i.e., a higher
Pd (or lower P
md ) and lower Pf are preferred.
The statistical properties of are necessary to characterize the
performance of an energy detector. To get the statistical
properties, signal and noise models are essential.
4.3 Signal Models
Based on the available knowledge of s(n) the receiver can
adopt an appropriate model, which helps to analyze the
distribution of the test statistic under H1. For example, three
different models, S1, S2 and S3, are popularly used in the
literature, and are given as follows:
S1: For given channel gain h, the signal to be detected, y(n),
can be assumed as Gaussian with mean [ ( )] [ ( ) ( )] ( ) and variance
. This case may
be modeled as an unknown deterministic signal. For the signal
transmitted over a flat band-limited Gaussian noise channel, a
basic mathematical model of the test statistic of an energy
detector is given in [7]. The receive SNR can then be given as:
| |
∑ | ( )|
( )
S2: When the receiver has very limited knowledge of the
transmitted signal (e.g., signal distribution), the signal sample
may be considered as Gaussian random variable, i.e., ( ) (
) and then
( ) ( (
)) . The receiver SNR can then be
given as:[9]
| |
….equation(11)
S3: If the Gaussian assumption is removed from S2 signal
model, and signal sample is considered as random variable
with mean zero and variance , but with an unknown
distribution, then y(n) has mean zero and variance (
).The receive SNR can also be given as: [9]
| |
….equation(12)
For a sufficiently large number of samples, the signal variance
can be written as:
≈
∑ | ( )| ….equation(13)
and thus, all the receive SNRs given in equation (3.10 – 3.12)
under different signal models have the same expression. In
this case, the instantaneous SNR is denoted as .
4.4 Distribution of Test Statistics
The exact distributions of test statistics for different signal
models are analyzed in the following under both hypotheses,
H0 and H
1 . By CLT approach- [9]
Under
The false alarm probability can be given as:
( (
)
√ ( )) ….equation(14)
where ( )
√ ∫
is the Gaussian-Q function.
Under
The detection probability, Pd can be derived for S1 by:
( (
)( )
√ ( ) ( ))
….equation(15)
For S2,
( (
)( )
√ ( )( )
)
….equation(16)
Note that has the same expression as .
V. SPECTRUM SENSING STANDARDIZATION
Different TV broadcasters use chunk of the radio spectrum
allowed for TV broadcasting (e.g., 54–806 MHz in US).
White spaces (i.e., frequency slots unused by TV
broadcasters) may include guard bands, free frequencies due
to analog TV to digital TV switchover (e.g., 698–806 MHz in
International Journal of Research and Scientific Innovation (IJRSI) | Volume IV, Issue VIIS, July 2017 | ISSN 2321–2705
www.rsisinternational.org Page 179
US), and free TV bands created when traffic in digital TV is
low and can be compressed into fewer TV bands. The US
FCC allows to use white spaces by unlicensed users.
Subsequently, following standardization efforts have
materialized:
The IEEE 802.22 standard for TV white spaces has
been released with medium access control and
physical layer specifications for WRAN.
The ECMA 392 includes specification for
personal/portable wireless devices operating in TV
bands [16],
The IEEE SCC41 develops supporting standards for
radio and dynamic spectrum management [17].
The IEEE 802.11af is for Wi-Fi on the TV white
spaces using cognitive radio technology [18].
VI. DESIGN PARAMETERS
The main design parameters of the energy detector are the
number of samples and threshold. Although the performance
of the energy detector depends on SNR and noise variance as
well, designers have very limited control over them because
these parameters depend on the behavior of the wireless
channel.
6.1 Threshold
A pre-defined threshold is required to decide whether the
target signal is absent or present. This threshold determines all
performance metrics, Pd , Pf and P
md . Since it varies from 0 to
1, selection of operating threshold is important. The operating
threshold thus can be determined based on the target value of
the performance metric of interest. [9]
When the threshold increases (or decreases), both Pf and Pd
decrease (or increase). For known N and , the common
practice of setting the threshold is based on a constant false
alarm probability Pf , e.g., P
f ≤ 0.1. The selected threshold
based on Pf can be given by using (3.14) as:
( ( ) √ )√
….equation(17)
However, this threshold may not guarantee that the energy
detector achieves the target detection probability (e.g., 0.9
specified in the IEEE 802.22 WRAN). Thus, threshold
selection can be viewed as an optimization problem to balance
the two conflicting objectives (i.e., maximize Pd while
minimizing Pf).
6.2 Number of Samples
The number of samples (N) is also an important design
parameter to achieve the requirements on detection and false
alarm probabilities. For given false alarm probability Pf and
detection probability Pd , the minimum number of samples
required can be given as a function of SNR. By eliminating Vt
from both Pf in (3.14) and Pd in (3.15) (here signal model S1
is used as an example), N can be given as: [9]
[ ( ) ( )√ ]
….equation(18)
which is not a function of the threshold. Due to the
monotonically decreasing property of function ( ), it can
be seen that the signal can be detected even in very low SNR
region by increasing N, when the noise power is perfectly
known. Since ≈ where is the sensing time and fs is
the sampling frequency, the sensing time increases as N
increases. This is a main drawback in spectrum sensing at low
SNR because of the limitation on the maximal allowable
sensing time (e.g., the IEEE 802.22 specifies that the sensing
time should be less than 2 s). Therefore, the selection of N is
also an optimization problem.
VII. SIMULATION RESULTS
ROC plots for Energy Detector based spectrum sensing
Pmd = Probability of missed detection
Pd = Probability of detection
Pf = Probability of false alarm
N = Number of samples
SNR= Signal to noise ratio
Detection probability (Pd), False alarm probability (P
f) and
missed detection probability (Pmd
) are the key measurement
metrics that are used to analyze the performance of spectrum
sensing techniques. The performance of an spectrum sensing
technique is illustrated by the receiver operating
characteristics (ROC) curve which is a plot of Pd versus Pf
(or) Pf versus Pm. The performance of energy detector is
analyzed using ROC (Receiver operating characteristics)
curves. Monte-Carlo method is used for simulation.
7.1.The plot of Probability of false alarm versus Probability
of detection:
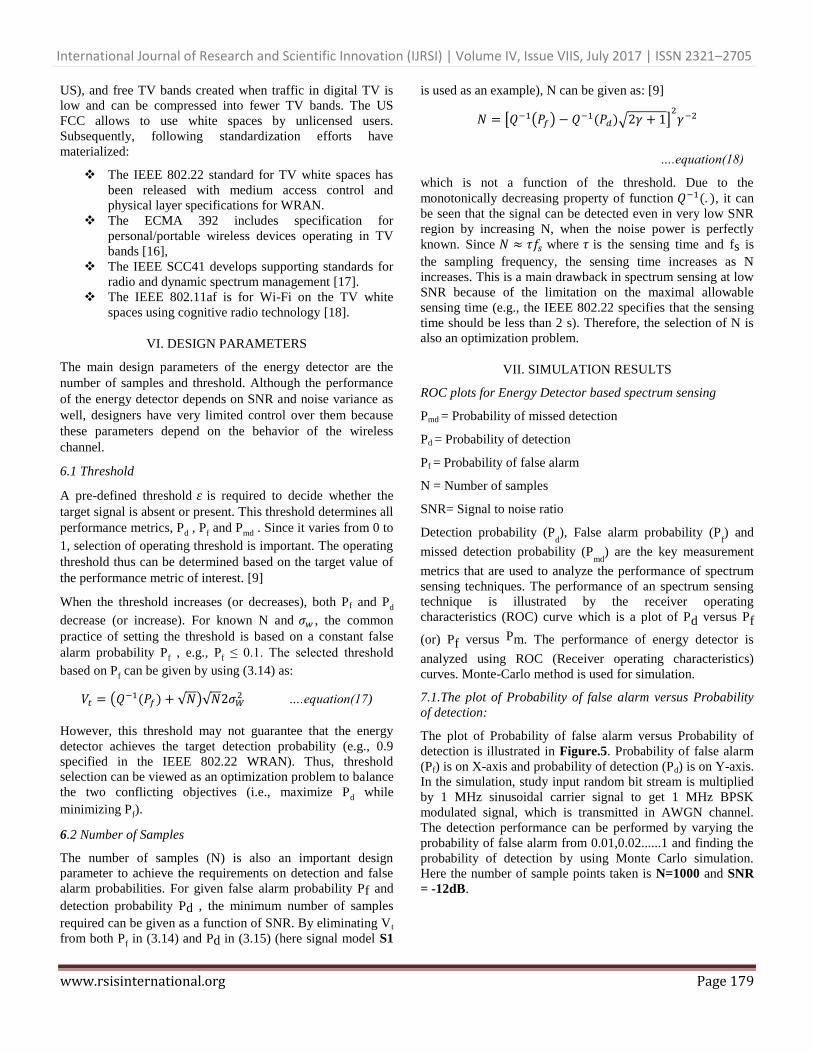
The plot of Probability of false alarm versus Probability of
detection is illustrated in Figure.5. Probability of false alarm
(Pf) is on X-axis and probability of detection (Pd) is on Y-axis.
In the simulation, study input random bit stream is multiplied
by 1 MHz sinusoidal carrier signal to get 1 MHz BPSK
modulated signal, which is transmitted in AWGN channel.
The detection performance can be performed by varying the
probability of false alarm from 0.01,0.02......1 and finding the
probability of detection by using Monte Carlo simulation.
Here the number of sample points taken is N=1000 and SNR
= -12dB.
International Journal of Research and Scientific Innovation (IJRSI) | Volume IV, Issue VIIS, July 2017 | ISSN 2321–2705
www.rsisinternational.org Page 180
Fig.5 ROC curve for Pf vs Pd Energy detector based spectrum sensing at
SNR= -12dB
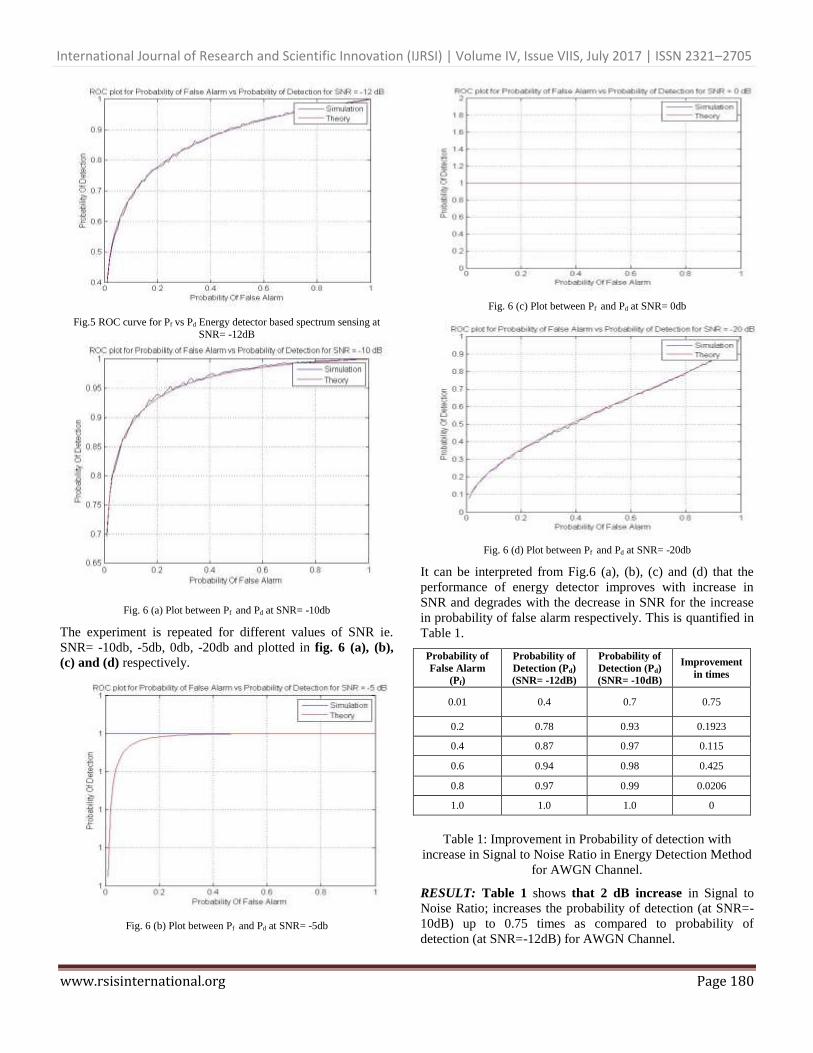
Fig. 6 (a) Plot between Pf and Pd at SNR= -10db
The experiment is repeated for different values of SNR ie.
SNR= -10db, -5db, 0db, -20db and plotted in fig. 6 (a), (b),
(c) and (d) respectively.
Fig. 6 (b) Plot between Pf and Pd at SNR= -5db
Fig. 6 (c) Plot between Pf and Pd at SNR= 0db
Fig. 6 (d) Plot between Pf and Pd at SNR= -20db
It can be interpreted from Fig.6 (a), (b), (c) and (d) that the
performance of energy detector improves with increase in
SNR and degrades with the decrease in SNR for the increase
in probability of false alarm respectively. This is quantified in
Table 1.
Probability of
False Alarm
(Pf)
Probability of
Detection (Pd)
(SNR= -12dB)
Probability of
Detection (Pd)
(SNR= -10dB)
Improvement
in times
0.01 0.4 0.7 0.75
0.2 0.78 0.93 0.1923
0.4 0.87 0.97 0.115
0.6 0.94 0.98 0.425
0.8 0.97 0.99 0.0206
1.0 1.0 1.0 0
Table 1: Improvement in Probability of detection with
increase in Signal to Noise Ratio in Energy Detection Method
for AWGN Channel.
RESULT: Table 1 shows that 2 dB increase in Signal to
Noise Ratio; increases the probability of detection (at SNR=-
10dB) up to 0.75 times as compared to probability of
detection (at SNR=-12dB) for AWGN Channel.
International Journal of Research and Scientific Innovation (IJRSI) | Volume IV, Issue VIIS, July 2017 | ISSN 2321–2705
www.rsisinternational.org Page 181
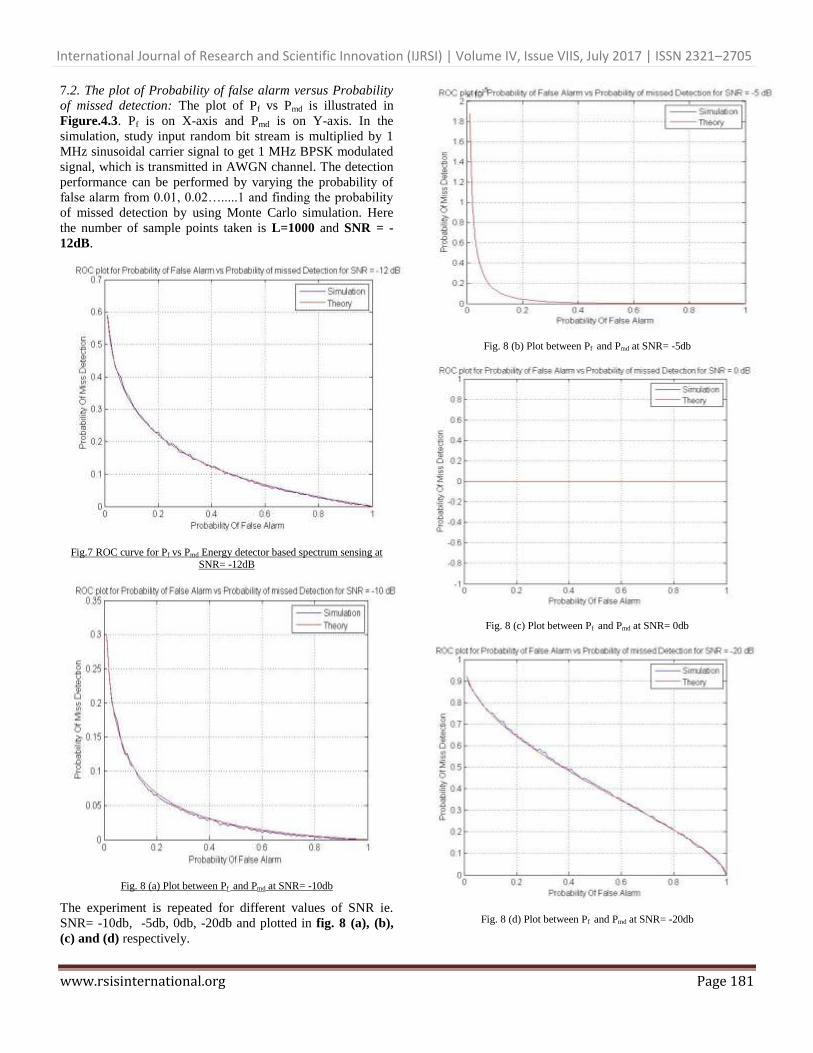
7.2. The plot of Probability of false alarm versus Probability
of missed detection: The plot of Pf vs Pmd is illustrated in
Figure.4.3. Pf is on X-axis and Pmd is on Y-axis. In the
simulation, study input random bit stream is multiplied by 1
MHz sinusoidal carrier signal to get 1 MHz BPSK modulated
signal, which is transmitted in AWGN channel. The detection
performance can be performed by varying the probability of
false alarm from 0.01, 0.02….....1 and finding the probability
of missed detection by using Monte Carlo simulation. Here
the number of sample points taken is L=1000 and SNR = -
12dB.
Fig.7 ROC curve for Pf vs Pmd Energy detector based spectrum sensing at SNR= -12dB
Fig. 8 (a) Plot between Pf and Pmd at SNR= -10db
The experiment is repeated for different values of SNR ie.
SNR= -10db, -5db, 0db, -20db and plotted in fig. 8 (a), (b),
(c) and (d) respectively.
Fig. 8 (b) Plot between Pf and Pmd at SNR= -5db
Fig. 8 (c) Plot between Pf and Pmd at SNR= 0db
Fig. 8 (d) Plot between Pf and Pmd at SNR= -20db
International Journal of Research and Scientific Innovation (IJRSI) | Volume IV, Issue VIIS, July 2017 | ISSN 2321–2705
www.rsisinternational.org Page 182
It can be interpreted from Figure.8 (a), (b), (c) and (d) that the
performance of energy detector improves with increase in
SNR and degrades with the decrease in SNR for the increase
in probability of false alarm respectively. Since , hence as increases, Pmd decreases. So when SNR
increases, Pd increases and Pmd decreases. This is quantified in
Table 2.
Probability
of False
Alarm (Pf)
Probability
of Missed
Detection
(Pmd)
(SNR= -
12dB)
Probability
of Missed
Detection
(Pmd)
(SNR= -
10dB)
Improvement
in times
0.01 0.6 0.3 0.5
0.2 0.22 0.07 0.68
0.4 0.13 0.03 0.77
0.6 0.06 0.02 0.67
0.8 0.03 0.01 0.67
1.0 0 0 0
Table 2: Improvement in Probability of missed detection with
increase in Signal to Noise Ratio in Energy Detection Method
for AWGN Channel.
RESULT: Table 2 shows that 2 dB increase in Signal to
Noise Ratio; decreases the probability of missed detection (at
SNR= -10dB) up to 77 times as compared to probability of
detection (at SNR= -12dB) for AWGN Channel.
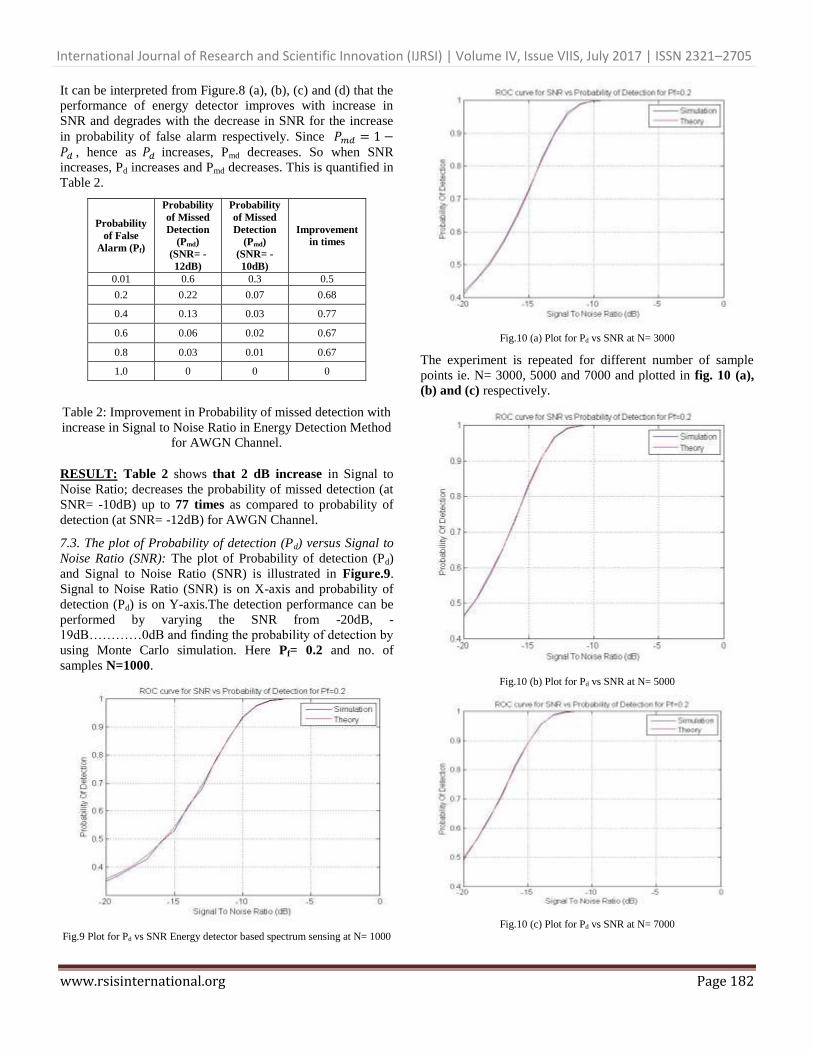
7.3. The plot of Probability of detection (Pd) versus Signal to
Noise Ratio (SNR): The plot of Probability of detection (Pd)
and Signal to Noise Ratio (SNR) is illustrated in Figure.9.
Signal to Noise Ratio (SNR) is on X-axis and probability of
detection (Pd) is on Y-axis.The detection performance can be
performed by varying the SNR from -20dB, -
19dB…………0dB and finding the probability of detection by
using Monte Carlo simulation. Here Pf= 0.2 and no. of
samples N=1000.
Fig.9 Plot for Pd vs SNR Energy detector based spectrum sensing at N= 1000
Fig.10 (a) Plot for Pd vs SNR at N= 3000
The experiment is repeated for different number of sample
points ie. N= 3000, 5000 and 7000 and plotted in fig. 10 (a),
(b) and (c) respectively.
Fig.10 (b) Plot for Pd vs SNR at N= 5000
Fig.10 (c) Plot for Pd vs SNR at N= 7000
International Journal of Research and Scientific Innovation (IJRSI) | Volume IV, Issue VIIS, July 2017 | ISSN 2321–2705
www.rsisinternational.org Page 183
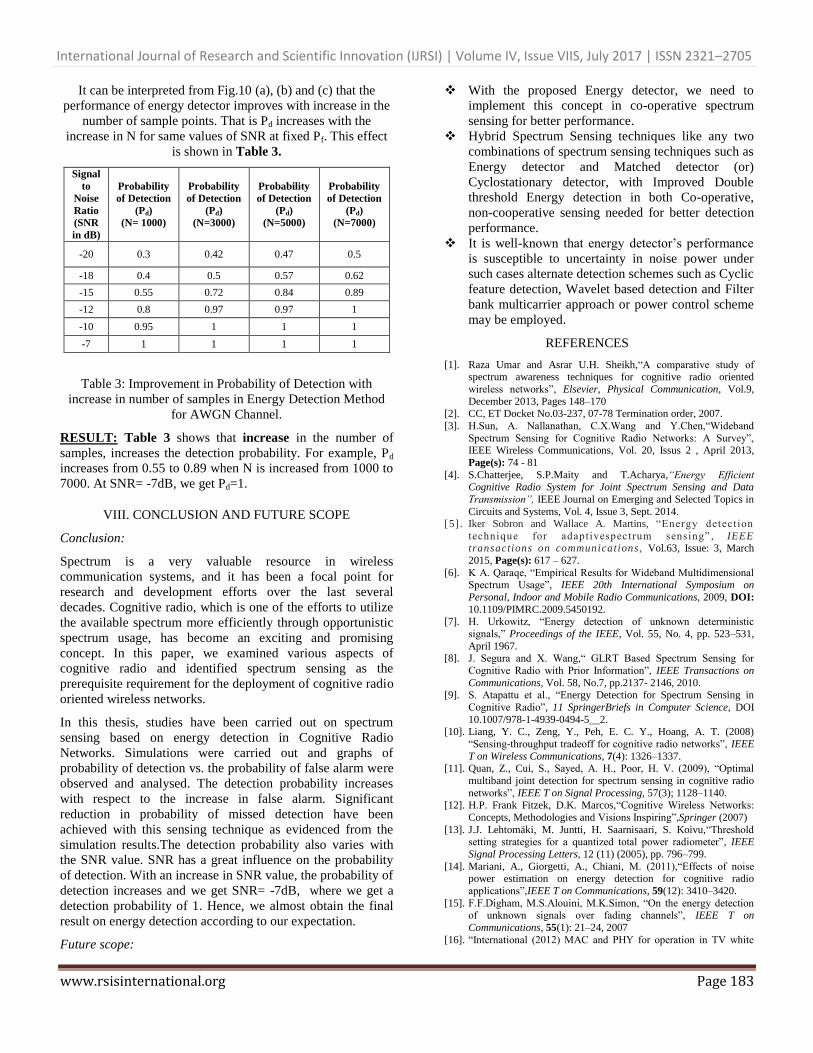
It can be interpreted from Fig.10 (a), (b) and (c) that the
performance of energy detector improves with increase in the
number of sample points. That is Pd increases with the
increase in N for same values of SNR at fixed Pf. This effect
is shown in Table 3.
Signal
to
Noise
Ratio
(SNR
in dB)
Probability
of Detection
(Pd)
(N= 1000)
Probability
of Detection
(Pd)
(N=3000)
Probability
of Detection
(Pd)
(N=5000)
Probability
of Detection
(Pd)
(N=7000)
-20 0.3 0.42 0.47 0.5
-18 0.4 0.5 0.57 0.62
-15 0.55 0.72 0.84 0.89
-12 0.8 0.97 0.97 1
-10 0.95 1 1 1
-7 1 1 1 1
Table 3: Improvement in Probability of Detection with
increase in number of samples in Energy Detection Method
for AWGN Channel.
RESULT: Table 3 shows that increase in the number of
samples, increases the detection probability. For example, Pd
increases from 0.55 to 0.89 when N is increased from 1000 to
7000. At SNR= -7dB, we get Pd=1.
VIII. CONCLUSION AND FUTURE SCOPE
Conclusion:
Spectrum is a very valuable resource in wireless
communication systems, and it has been a focal point for
research and development efforts over the last several
decades. Cognitive radio, which is one of the efforts to utilize
the available spectrum more efficiently through opportunistic
spectrum usage, has become an exciting and promising
concept. In this paper, we examined various aspects of
cognitive radio and identified spectrum sensing as the
prerequisite requirement for the deployment of cognitive radio
oriented wireless networks.
In this thesis, studies have been carried out on spectrum
sensing based on energy detection in Cognitive Radio
Networks. Simulations were carried out and graphs of
probability of detection vs. the probability of false alarm were
observed and analysed. The detection probability increases
with respect to the increase in false alarm. Significant
reduction in probability of missed detection have been
achieved with this sensing technique as evidenced from the
simulation results.The detection probability also varies with
the SNR value. SNR has a great influence on the probability
of detection. With an increase in SNR value, the probability of
detection increases and we get SNR= -7dB, where we get a
detection probability of 1. Hence, we almost obtain the final
result on energy detection according to our expectation.
Future scope:
With the proposed Energy detector, we need to
implement this concept in co-operative spectrum
sensing for better performance.
Hybrid Spectrum Sensing techniques like any two
combinations of spectrum sensing techniques such as
Energy detector and Matched detector (or)
Cyclostationary detector, with Improved Double
threshold Energy detection in both Co-operative,
non-cooperative sensing needed for better detection
performance.
It is well-known that energy detector’s performance
is susceptible to uncertainty in noise power under
such cases alternate detection schemes such as Cyclic
feature detection, Wavelet based detection and Filter
bank multicarrier approach or power control scheme
may be employed.
REFERENCES
[1]. Raza Umar and Asrar U.H. Sheikh,“A comparative study of spectrum awareness techniques for cognitive radio oriented
wireless networks”, Elsevier, Physical Communication, Vol.9,
December 2013, Pages 148–170 [2]. CC, ET Docket No.03-237, 07-78 Termination order, 2007.
[3]. H.Sun, A. Nallanathan, C.X.Wang and Y.Chen,“Wideband
Spectrum Sensing for Cognitive Radio Networks: A Survey”, IEEE Wireless Communications, Vol. 20, Issus 2 , April 2013,
Page(s): 74 - 81
[4]. S.Chatterjee, S.P.Maity and T.Acharya,“Energy Efficient Cognitive Radio System for Joint Spectrum Sensing and Data
Transmission”, IEEE Journal on Emerging and Selected Topics in
Circuits and Systems, Vol. 4, Issue 3, Sept. 2014. [5] . Iker Sobron and Wallace A. Martins, “Energy detection
technique for adaptivespectrum sensing” , IEEE transactions on communications, Vol.63, Issue: 3, March
2015, Page(s): 617 – 627.
[6]. K A. Qaraqe, “Empirical Results for Wideband Multidimensional Spectrum Usage”, IEEE 20th International Symposium on
Personal, Indoor and Mobile Radio Communications, 2009, DOI:
10.1109/PIMRC.2009.5450192. [7]. H. Urkowitz, “Energy detection of unknown deterministic
signals,” Proceedings of the IEEE, Vol. 55, No. 4, pp. 523–531,
April 1967. [8]. J. Segura and X. Wang,“ GLRT Based Spectrum Sensing for
Cognitive Radio with Prior Information”, IEEE Transactions on
Communications, Vol. 58, No.7, pp.2137- 2146, 2010. [9]. S. Atapattu et al., “Energy Detection for Spectrum Sensing in
Cognitive Radio”, 11 SpringerBriefs in Computer Science, DOI
10.1007/978-1-4939-0494-5__2. [10]. Liang, Y. C., Zeng, Y., Peh, E. C. Y., Hoang, A. T. (2008)
“Sensing-throughput tradeoff for cognitive radio networks”, IEEE
T on Wireless Communications, 7(4): 1326–1337. [11]. Quan, Z., Cui, S., Sayed, A. H., Poor, H. V. (2009), “Optimal
multiband joint detection for spectrum sensing in cognitive radio
networks”, IEEE T on Signal Processing, 57(3); 1128–1140.
[12]. H.P. Frank Fitzek, D.K. Marcos,“Cognitive Wireless Networks:
Concepts, Methodologies and Visions Inspiring”,Springer (2007)
[13]. J.J. Lehtomäki, M. Juntti, H. Saarnisaari, S. Koivu,“Threshold setting strategies for a quantized total power radiometer”, IEEE
Signal Processing Letters, 12 (11) (2005), pp. 796–799.
[14]. Mariani, A., Giorgetti, A., Chiani, M. (2011),“Effects of noise power estimation on energy detection for cognitive radio
applications”,IEEE T on Communications, 59(12): 3410–3420.
[15]. F.F.Digham, M.S.Alouini, M.K.Simon, “On the energy detection of unknown signals over fading channels”, IEEE T on
Communications, 55(1): 21–24, 2007
[16]. “International (2012) MAC and PHY for operation in TV white
International Journal of Research and Scientific Innovation (IJRSI) | Volume IV, Issue VIIS, July 2017 | ISSN 2321–2705
www.rsisinternational.org Page 184
space”, ECMA [17]. F.Granelli, P.Pawelczak, R.V.Prasad, K.P.Subbalakshmi,
R.Chandramouli, J.A.Hoffmeyer and H.S.Berger (2010)
“Standardization and research in cognitive and dynamic spectrum access networks: IEEE SCC41 efforts and other activities”, IEEE
Communications M, 48(1): 71–79. [18]. C. S.Sum, H.Harada, F.Kojima, Z.Lan, R.Funada, (2011), “Smart
utility networks in TV white space”, IEEE Communications M,
49(7), 132–139.