Embed Size (px)
Citation preview
Atmos. Chem. Phys., 14, 9993–10012, 2014www.atmos-chem-phys.net/14/9993/2014/doi:10.5194/acp-14-9993-2014© Author(s) 2014. CC Attribution 3.0 License.
Experimental determination of the temperature dependence ofwater activities for a selection of aqueous organic solutions
G. Ganbavale1, C. Marcolli 1,4, U. K. Krieger 1, A. Zuend1,2, G. Stratmann3, and T. Peter1
1Institute for Atmospheric and Climate Science, ETH Zurich, Zurich, Switzerland2Department of Atmospheric and Oceanic Sciences, McGill University, Montreal, Quebec, Canada3Department of Atmospheric Physics, DLR Oberpfaffenhofen, Germany4Marcolli Chemistry and Physics Consulting GmbH, Zurich, Switzerland
Correspondence to:C. Marcolli ([email protected])
Received: 22 April 2014 – Published in Atmos. Chem. Phys. Discuss.: 19 May 2014Revised: 18 August 2014 – Accepted: 22 August 2014 – Published: 19 September 2014
Abstract. This work presents experimental data of the tem-perature dependence of water activity in aqueous organicsolutions relevant for tropospheric conditions (200–273 K).Water activity (aw) at low temperatures (T ) is a crucial pa-rameter for predicting homogeneous ice nucleation. We in-vestigated temperature-dependent water activities, ice freez-ing and melting temperatures of solutions, and vapour pres-sures of a selection of atmospherically relevant aqueous or-ganic systems. To measureaw over a wide composition rangeand with a focus on low temperatures, we use variousawmeasurement techniques and instruments: a dew point wa-ter activity meter, an electrodynamic balance (EDB), dif-ferential scanning calorimetry (DSC), and a setup to mea-sure the total gas phase pressure at equilibrium over aqueoussolutions. Water activity measurements were performed foraqueous multicomponent and multifunctional organic mix-tures containing the functional groups typically found in at-mospheric organic aerosols, such as hydroxyl, carboxyl, ke-tone, ether, ester, and aromatic groups. The aqueous organicsystems studied at several fixed compositions over a consid-erable temperature range differ significantly in their tempera-ture dependence. Aqueous organic systems of 1,4-butanedioland methoxyacetic acid show a moderate decrease inaw withdecreasing temperature. The aqueous M5 system (a mul-ticomponent system containing five different dicarboxylicacids) and aqueous 2-(2-ethoxyethoxy)ethanol solutions bothshow a strong increase of water activity with decreasingtemperature at high solute concentrations forT < 270 K andT < 260 K, respectively. These measurements show that thetemperature trend ofaw can be reversed at low temperatures
and that linear extrapolations of high-temperature data maylead to erroneous predictions. To avoid this, experimentallydeterminedaw at low temperature are needed to improvethermodynamic models towards lower temperatures and forimproved predictions of the ice nucleation ability of organic–water systems.
1 Introduction
Organic compounds account for a large fraction of airborneparticulate matter. They constitute around 50 % of the to-tal mass of the fine aerosol fraction in the continental mid-latitudes (Saxena and Hildemann, 1996; Novakov et al.,1997; Murphy et al., 2006; Jimenez et al., 2009) while inthe Tropics they may contribute up to 90 % (Yamasoe et al.,2000; Roberts et al., 2002). In the upper troposphere a highfraction of organic aerosols are internally mixed with sulfateaerosols (Murphy et al., 2006, 2007). The organic aerosolfraction is expected to remain in a liquid or amorphous (vis-cous) state since the large number of organic compounds de-presses the temperature at which crystallisation takes place(Marcolli et al., 2004). Studies show that the presence ofan organic aerosol fraction may inhibit ice nucleation andgrowth (DeMott et al., 2003; Cziczo et al., 2004; Peter et al.,2006; Knopf and Lopez, 2009). The organic aerosol fractioncontributes to aerosol effects in the atmosphere through inter-actions with water vapour, radiation, precipitation and tracegases (Fuzzi et al., 2006). In turn, these interactions influ-ence the physical and chemical properties of aerosol particles
Published by Copernicus Publications on behalf of the European Geosciences Union.
9994 G. Ganbavale et al.: Temperature dependency in aqueous organic solutions
such as physical state, hygroscopicity, size, and shape (e.g.Ming and Russell, 2002; Kanakidou et al., 2005; Zobristet al., 2008; Ciobanu et al., 2009; Mikhailov et al., 2009;Reid et al., 2011; Song et al., 2012). The light scattering in-tensity of aerosols depends on growth and evaporation of theparticles due to uptake and release of water vapour drivenby changes in ambient relative humidity (RH) (Carrico et al.,2003; Baynard et al., 2006; Zieger et al., 2013). For an ac-curate description of this process, the hygroscopicity of theinvolved aerosol compositions have to be known. The hy-groscopicities of most organic mixtures depend on tempera-ture. Particle phase water activityaw is equal to RH, providedthat the aqueous aerosol particles are in equilibrium with thesurrounding gas phase and that they are sufficiently largeso that the Kelvin effect is negligible. However,aw data ofaqueous organic compounds at low temperatures are scarce.Therefore, most estimates of the RH dependence of the directaerosol effect rely on data at or close to room temperature. Atlow tropospheric temperatures, particle hygroscopicity maybe different, because of the temperature dependence ofawand/or water uptake and release may be retarded due to slowdiffusion of water into highly viscous and amorphous phases(glasses) (Zobrist et al., 2008, 2011; Bones et al., 2012).
Homogeneous ice nucleation in the upper troposphere oc-curs in aqueous aerosol particles that subsequently grow intolarge ice crystals by deposition of water vapour, in part sup-plied from evaporating supersaturated cloud droplets. Un-less solution droplets become glassy, homogeneous ice nu-cleation in supercooled aqueous solutions does not dependon the specific nature of the solute; rather, knowing the ther-modynamic properties of the solution in terms of water ac-tivity (aw) is sufficient, which implicitly accounts for spe-cific properties of the solutes (Koop et al., 2000; Koop andZobrist, 2009). Thus,aw of solutions is a crucial parame-ter for homogeneous ice nucleation. Similarly, for heteroge-neous freezing in immersion mode,aw-based models are ap-plicable (Knopf and Alpert, 2013).
For a correct description of the ice nucleation process, de-viations from ideal mixing in aqueous solutions droplets haveto be taken into account. This is achieved by using activ-ity coefficients to describe solution non-ideality. For water,with a thermodynamic activity defined on a mole fraction ba-sis, its mole fraction-based activity coefficient is defined asγw = aw/xw, wherexw is the mole fraction of water. Activ-ity coefficients may exhibit considerable temperature depen-dence, which has to be parameterised explicitly in thermo-dynamic models in order to give accurate predictions for thelevel of non-ideality over a large range of temperatures. How-ever, for aqueous organic solutions, thermodynamic mod-els based on the UNIQUAC (UNIversal QUAsi Chemical)model (Abrams and Prausnitz, 1975) or its group contribu-tion version UNIFAC (UNIquac Functional group ActivityCoefficients) (Fredenslund et al., 1975) may not provide re-liable predictions of activity coefficients when they are usedoutside the temperature range for which they have been pa-
rameterised, i.e. atT < 275 K or T > 400 K. Improvementof these models for atmospheric conditions is strongly lim-ited by the limited availability of reliable activity coeffi-cient data forT < 290 K (Saxena and Hildemann, 1997;Lohmann et al., 2001; Marcolli and Peter, 2005). Performingnewaw measurements by combining different measurementtechniques (e.g. electrodynamic balance (EDB), differentialscanning calorimetry (DSC), total gas phase pressure mea-surements) can provide the experimental data required forimproved parameterisations of these thermodynamic mod-els, especially for low temperatures. Studies of the tempera-ture dependence of activity coefficients have been carried outfor a few atmospherically relevant inorganic acids and saltssuch as H2SO4, (NH4)2SO4, and NH4NO3 (Knopf et al.,2003; Tang and Munkelwitz, 1993; Rodebush, 1918; Clegget al., 1998), revealing quite distinct tendencies:aw of di-lute H2SO4 solutions are nearly independent of temperature,while in the case of NH4NO3, aw increases with decreasingtemperature (Koop, 2004).
For aqueous organic solutions,Zobrist et al.(2003) com-pared theaw data of various poly(ethylene glycol) (PEG) so-lutions in the stable and supercooled range and noticed thatthe aw of fixed-composition PEG solutions decreases withdecreasing temperature. The influence of temperature onawbecomes more pronounced with decreasing temperature aswell as with increasing solute concentration.Zobrist et al.(2008) determined the temperature dependence of water ac-tivity coefficients in polyols and sugars at atmospheric pres-sure in the temperature range from the ice melting curve to313 K and used these data to convert ice freezing temper-atures from the mass fraction composition to theaw scale.They found that if the temperature dependence is neglected,errors of the order of 10–15 % may result foraw at the ho-mogeneous ice freezing temperature. These examples showthat in the case of aqueous organic solutions, the temperaturedependence ofaw can be atmospherically important.
Low-temperatureaw data to the best of our knowledge aremostly restricted to solid–liquid equilibria (SLE). SLE mea-surements provide data on the melting curves of ice and/orthe organic component, i.e. for the specific solution composi-tions referring to the solid-liquid phase boundary over a cer-tain temperature range. To measureaw at low temperaturesover a wide composition and temperature range, we there-fore combine different measurement techniques including adew point water activity meter foraw measurements at tem-peratures higher than 273 K, differential scanning calorime-try (DSC) to determine SLE, and hygroscopicity measure-ments of single levitated particles in an electrodynamic bal-ance (EDB). To complement these measurements, we de-veloped a laboratory setup to measure total gas phase pres-sure over solutions at low temperatures. A detailed descrip-tion of the measurement techniques is given in Sect.2. Mea-surements were performed for binary aqueous organic mix-tures covering functional groups and multifunctional organiccompounds that are frequently observed in tropospheric
Atmos. Chem. Phys., 14, 9993–10012, 2014 www.atmos-chem-phys.net/14/9993/2014/
G. Ganbavale et al.: Temperature dependency in aqueous organic solutions 9995
aerosols. The organic functional groups considered includehydroxyl (OH), carboxyl (COOH), ketone (CHnCO), ester(CCOO), ether (CHnO), aromatic carbon (ACHn) and aro-matic carbon–alcohol (“phenol group”, ACOH), where “n”denotes the number of H atoms in the functional group.These new measurements provide useful data for the im-provement of thermodynamic models and for applications inice nucleation studies.
2 Measurement techniques
To perform measurements over a wide concentration andtemperature range for atmospherically relevant organic com-pounds we use different measurement techniques, each ofwhich covers a certain temperature range.
2.1 Differential scanning calorimetry (DSC)
Solid–liquid equilibria data were obtained by measuring themelting temperatures(Tm) of aqueous organic solutions foremulsified samples with a DSC instrument (Q10 from TAInstruments) following the procedure described inZobristet al. (2008). These measurements also provide homoge-neous freezing temperatures(Thom) as a function of aqueoussolution composition. Water-in-oil emulsions with droplet di-ameters in the range of 0.5 to 5 µm were prepared by addingfour parts by volume of a 5 wt % lanolin/mineral oil solution(Fluka/Aldrich) to one part by volume of an aqueous solu-tion and stirring with a rotor–stator homogeniser (PolytronPT 1300D with a PT-DA 1307/2EC dispersing aggregate) for40 s at 7000 rpm. Samples (8 to 10 mg) were pipetted into theDSC pans, which were immediately sealed to prevent anyevaporation. All aqueous solutions were made with distilledand deionised water (resistivity> 18.2 M� cm, total organicimpurities< 5 ppb). Each experiment comprised three sub-sequent cooling cycles starting from 293 K. The first and thelast cycle were run with a cooling rate of 10 K min−1 (used ascontrol for the emulsion stability) and the second cycle witha cooling rate of 1 K min−1 (used for the melting and freez-ing point evaluation). Ice melting temperatures were evalu-ated at the melting peak maxima of the heating cycle run at arate of 1 K min−1. A detailed calibration of the DSC resultedin a maximum uncertainty for ice melting temperatures of±0.8 K (Zobrist et al., 2008).
Aqueous solutions of the following organic compoundswere investigated: 1,3-propanediol (Aldrich, 98 %), 1,5-pentanediol (Fluka,≥ 97 %), 1,2-hexanediol (Aldrich, 97 %),glycolic acid (Aldrich, 99 %), pyruvic acid (Aldrich, 99 %),methoxyacetic acid (Aldrich, 99 %), 2-ethoxyethyl ac-etate (Aldrich, 99 %), D-sorbitol (Aldrich,≥ 98 %), su-crose (sigma,≥ 99 %), resorcinol (Aldrich, 99 %), 2-(2-ethoxyethoxy)ethanol (Aldrich,≥ 99 %) and M5, a mul-ticomponent dicarboxylic acid mixture composed of DL-malic acid (Aldrich, 99 %), maleic acid (Aldrich, 99 %), mal-
onic acid (Aldrich, 99 %), glutaric acid (Aldrich, 99 %) andmethylsuccinic acid (Aldrich, 99 %). Table1 lists the com-pounds used together with a selection of their physical prop-erties. The ice melting(Tm(xorg)) and homogeneous freez-ing temperaturesThom(xorg), obtained by DSC measurementsfor the aqueous organic mixtures at different liquid solutioncompositions given as mole fraction of the organic compo-nent,xorg, are provided in Table2.
We use the parameterisation byKoop and Zobrist(2009)to calculateaw at the melting temperature of ice for a knownsolution composition. The vapour pressures for solid phase(superscript S) pure hexagonal ice,p
◦,Sice (= p
◦,Sw ), and water
in equilibrium with the liquid (superscript L) solution,pLw,
on the melting curve (SLE) are the same:
pLw(T = Tm(xorg)) = p
◦,Sice (T = Tm(xorg)), (1)
where vapour–liquid, vapour–solid, and solid–liquid equilib-ria exist. At SLE, the water activity of the aqueous organicsolution,aSLE
w (T ,p), in equilibrium with ice can thereforebe expressed by
aSLEw (T = Tm(xorg),p) =
p◦,Sice (T = Tm)
p◦,Lw (T = Tm)
, (2)
wherep◦,Lw (T = Tm) is the vapour pressure of pure liquid
(supercooled) water atTm.We use the Koop and Zobrist (2009) temperature-
dependent parameterisation which is based onMurphy andKoop (2005) to calculateaw at SLE, valid at low (ambient)pressure in the temperature range 173 K< T < 273.15 K:
aSLEw (T ,p) =
[exp(9.550426−5723.265/T +3.53068· ln(T )
− 0.00728332·T )] ·[exp(54.842763−6763.22/T
− 4.210· ln(T ) + 0.000367· T + tanh(0.0415
· (T −218.8)) · (53.878− 1331.22/T −9.44523
· ln(T ) + 0.014025· T ))]−1 . (3)
2.2 Water activity measurements
Water activity measurements were performed using anAquaLab water activity meter (Model 3B, Decagon Devices,USA). The instrument employs the chilled mirror methodto determine the dew point temperature of the gas phase inequilibrium with the sample. Infrared thermometry in addi-tion indicates the sample temperature. This instrument al-lowsaw measurements in the temperature range from 288 to313 K for bulk samples. For most measurements the volatilesample block available as an accessory with the instrumentwas used since several of the organic compounds used haverather low, but potentially significant vapour pressures atthe probed temperatures. Experimental errors for the volatilesample block are specified as±0.015aw by the manufac-turer. The sample block was frequently calibrated and cor-rected for drifts and offsets using saturated salt solutions
www.atmos-chem-phys.net/14/9993/2014/ Atmos. Chem. Phys., 14, 9993–10012, 2014
9996 G. Ganbavale et al.: Temperature dependency in aqueous organic solutions
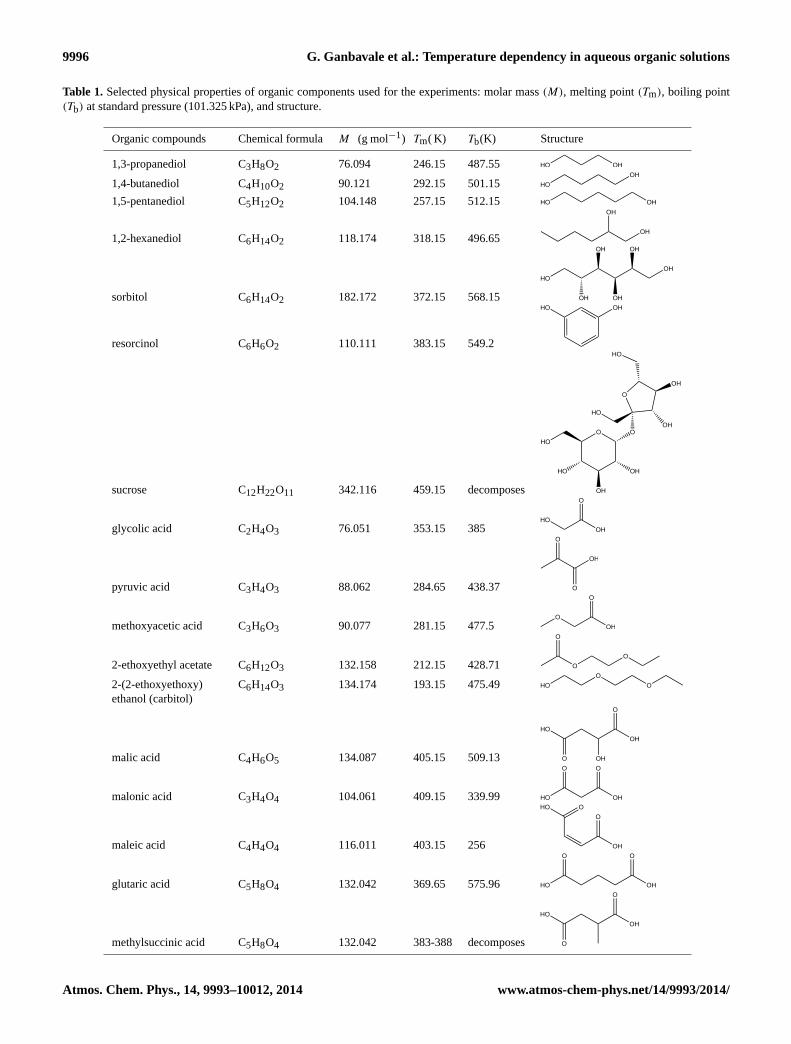
Table 1. Selected physical properties of organic components used for the experiments: molar mass(M), melting point(Tm), boiling point(Tb) at standard pressure (101.325 kPa), and structure.
Organic compounds Chemical formulaM (g mol−1) Tm( K) Tb(K) Structure
1,3-propanediol C3H8O2 76.094 246.15 487.55 HO OH
1,4-butanediol C4H10O2 90.121 292.15 501.15 HO
OH
1,5-pentanediol C5H12O2 104.148 257.15 512.15 HO OH
1,2-hexanediol C6H14O2 118.174 318.15 496.65OH
OH
sorbitol C6H14O2 182.172 372.15 568.15
OH
OH
OH
OH
OH
HO
resorcinol C6H6O2 110.111 383.15 549.2
HO OH
sucrose C12H22O11 342.116 459.15 decomposes
HO
OH
OH
O
HO
O
OH
OH
HO
HO
O
glycolic acid C2H4O3 76.051 353.15 385HO
O
OH
pyruvic acid C3H4O3 88.062 284.65 438.37
O
O
OH
methoxyacetic acid C3H6O3 90.077 281.15 477.5
O
OH
O
2-ethoxyethyl acetate C6H12O3 132.158 212.15 428.71
O
O
O
2-(2-ethoxyethoxy)ethanol (carbitol)
C6H14O3 134.174 193.15 475.49O
OHO
malic acid C4H6O5 134.087 405.15 509.13 OH
O
OH
O
HO
malonic acid C3H4O4 104.061 409.15 339.99
O
OH
O
HO
maleic acid C4H4O4 116.011 403.15 256
O
OH
OHO
glutaric acid C5H8O4 132.042 369.65 575.96
O
OH
O
HO
methylsuccinic acid C5H8O4 132.042 383-388 decomposes
O
OH
O
HO
Atmos. Chem. Phys., 14, 9993–10012, 2014 www.atmos-chem-phys.net/14/9993/2014/
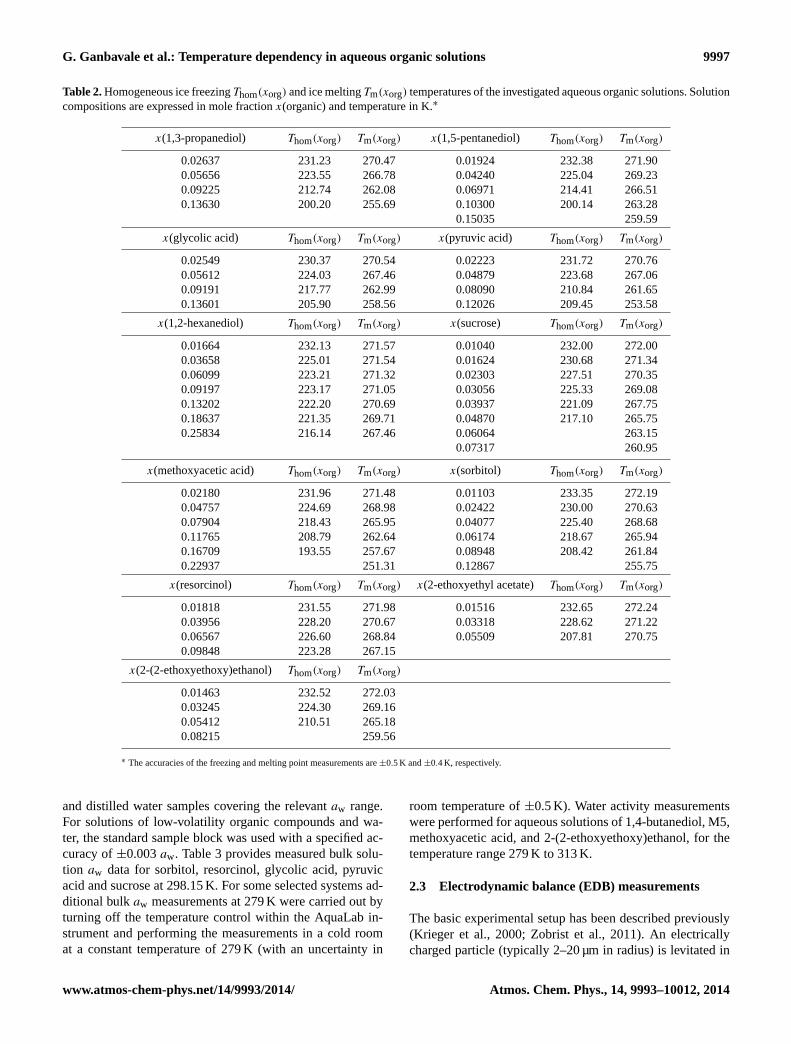
G. Ganbavale et al.: Temperature dependency in aqueous organic solutions 9997
Table 2.Homogeneous ice freezingThom(xorg) and ice meltingTm(xorg) temperatures of the investigated aqueous organic solutions. Solutioncompositions are expressed in mole fractionx(organic) and temperature in K.∗
x(1,3-propanediol) Thom(xorg) Tm(xorg) x(1,5-pentanediol) Thom(xorg) Tm(xorg)
0.02637 231.23 270.47 0.01924 232.38 271.900.05656 223.55 266.78 0.04240 225.04 269.230.09225 212.74 262.08 0.06971 214.41 266.510.13630 200.20 255.69 0.10300 200.14 263.28
0.15035 259.59
x(glycolic acid) Thom(xorg) Tm(xorg) x(pyruvic acid) Thom(xorg) Tm(xorg)
0.02549 230.37 270.54 0.02223 231.72 270.760.05612 224.03 267.46 0.04879 223.68 267.060.09191 217.77 262.99 0.08090 210.84 261.650.13601 205.90 258.56 0.12026 209.45 253.58
x(1,2-hexanediol) Thom(xorg) Tm(xorg) x(sucrose) Thom(xorg) Tm(xorg)
0.01664 232.13 271.57 0.01040 232.00 272.000.03658 225.01 271.54 0.01624 230.68 271.340.06099 223.21 271.32 0.02303 227.51 270.350.09197 223.17 271.05 0.03056 225.33 269.080.13202 222.20 270.69 0.03937 221.09 267.750.18637 221.35 269.71 0.04870 217.10 265.750.25834 216.14 267.46 0.06064 263.15
0.07317 260.95
x(methoxyacetic acid) Thom(xorg) Tm(xorg) x(sorbitol) Thom(xorg) Tm(xorg)
0.02180 231.96 271.48 0.01103 233.35 272.190.04757 224.69 268.98 0.02422 230.00 270.630.07904 218.43 265.95 0.04077 225.40 268.680.11765 208.79 262.64 0.06174 218.67 265.940.16709 193.55 257.67 0.08948 208.42 261.840.22937 251.31 0.12867 255.75
x(resorcinol) Thom(xorg) Tm(xorg) x(2-ethoxyethyl acetate) Thom(xorg) Tm(xorg)
0.01818 231.55 271.98 0.01516 232.65 272.240.03956 228.20 270.67 0.03318 228.62 271.220.06567 226.60 268.84 0.05509 207.81 270.750.09848 223.28 267.15
x(2-(2-ethoxyethoxy)ethanol) Thom(xorg) Tm(xorg)
0.01463 232.52 272.030.03245 224.30 269.160.05412 210.51 265.180.08215 259.56
∗ The accuracies of the freezing and melting point measurements are±0.5 K and±0.4 K, respectively.
and distilled water samples covering the relevantaw range.For solutions of low-volatility organic compounds and wa-ter, the standard sample block was used with a specified ac-curacy of±0.003aw. Table3 provides measured bulk solu-tion aw data for sorbitol, resorcinol, glycolic acid, pyruvicacid and sucrose at 298.15 K. For some selected systems ad-ditional bulkaw measurements at 279 K were carried out byturning off the temperature control within the AquaLab in-strument and performing the measurements in a cold roomat a constant temperature of 279 K (with an uncertainty in
room temperature of±0.5 K). Water activity measurementswere performed for aqueous solutions of 1,4-butanediol, M5,methoxyacetic acid, and 2-(2-ethoxyethoxy)ethanol, for thetemperature range 279 K to 313 K.
2.3 Electrodynamic balance (EDB) measurements
The basic experimental setup has been described previously(Krieger et al., 2000; Zobrist et al., 2011). An electricallycharged particle (typically 2–20 µm in radius) is levitated in
www.atmos-chem-phys.net/14/9993/2014/ Atmos. Chem. Phys., 14, 9993–10012, 2014

9998 G. Ganbavale et al.: Temperature dependency in aqueous organic solutions
Table 3. Bulk water activity(aw) measurements∗ at 298.15 K of different aqueous organic solutions. Solution compositions are expressedin mole fractionx(organic).
x(sorbitol) aw x(resorcinol) aw x(glycolic acid) aw x(pyruvic acid) aw x(sucrose) aw
0.01103 0.981 0.01818 0.985 0.02564 0.962 0.02267 0.966 0.01040 0.9920.02422 0.956 0.03956 0.950 0.05588 0.934 0.04868 0.925 0.01624 0.9880.04077 0.934 0.06567 0.938 0.09209 0.887 0.08068 0.883 0.02303 0.9770.06174 0.898 0.09848 0.893 0.13644 0.838 0.12020 0.836 0.03056 0.9710.08948 0.834 0.13992 0.877 0.19154 0.767 0.16986 0.778 0.03937 0.9550.12867 0.752 0.19312 0.843 0.25957 0.665 0.23467 0.704 0.04870 0.9390.18723 0.621 0.27629 0.836 0.35447 0.570 0.32089 0.596 0.06064 0.914
0.48560 0.451 0.45005 0.434 0.07317 0.8880.61773 0.193 0.16527 0.692
∗ The accuracy of the water activity measurements is specified by the manufacturer as±0.015 (absolute range) inaw.
an electrodynamic balance. The balance is hosted within athree-wall glass chamber with a cooling agent flowing be-tween the inner walls and an insulation vacuum between theouter walls. A constant flow of a N2 / H2O mixture witha controlled H2O partial pressure is pumped continuouslythrough the chamber at a constant total pressure, adjustablebetween 20 and 100 kPa. A charged, liquid particle is in-jected in the trap using a single-particle generator (Hewlett-Packard 51633A ink jet cartridge) and is levitated in the bal-ance, while keeping the temperature constant and increas-ing or decreasing the relative humidity within the chambercontinuously. This is achieved by changing the N2 / H2O ra-tio in the gas phase, using automatic mass flow controllers.The humidity sensor placed close to the particle registers theRH with an accuracy of±1.5 % RH (UPSI, France, ModelG-TUS.13) between 10 and 90 % RH. The sensor was cal-ibrated directly in the trap using the deliquescence relativehumidity of different salts at different temperatures in therange of interest. The concentration of the particle can becalculated from the DC voltage compensating the gravita-tional force when the dry particle mass is known (measuredat RH< 10 %). An alternative, independent measure of con-centration is based on Mie resonance spectroscopy. We usea ball lens type point source LED as a “white light” sourceto focus the light on the levitated particle and a pierced mir-ror to collect Mie resonance spectra in a backscattering ge-ometry. Radius information is retrieved from the Mie reso-nance spectra as described byZobrist et al.(2011). To con-vert radius to mass and concentration, we assume ideal vol-ume mixing (linear additivity of molar volumes) to calcu-late the density of aqueous solutions. For the M5 mixture weuse a molar volume of 86.62 cm3 mol−1 and a molarity basedlinear parameterisation to calculate the refractive index,nD,at 589 nm for aqueous M5 solutions of different concentra-tions (nD = 1.3334+0.01297× molarity). Since the opticallyretrieved concentration data are less noisy and more stablewith respect to drifts over longer measurement periods, we
use those for the water activity versus concentration data pre-sented in Tables10and11.
2.4 Total gas phase pressure measurements
We use total gas phase pressure measurements of binaryaqueous organic solutions to determineaw at low temper-atures over a wide concentration range. The organic com-ponents of the binary systems were selected such that theirvapour pressure contribution to the total pressure is irrele-vant, i.e. substantially lower than the vapour pressure of wa-ter in the considered temperature range. Given this prerequi-site, measured total pressures can be evaluated as being thevapour pressures of water in vapour–liquid equilibrium withthe binary solutions at measured temperatures and knowncompositions. Since we attribute measured total pressuresentirely to water vapour, we are restricted to binary mixtureswith low organic vapour pressures that lie within or below themeasurement uncertainty of the total pressure over the wholeinvestigated composition range. The experimental setup usedfor the total gas phase pressure measurements is shown inFig. 1.
The setup consists of a round-bottom flask (500 mL) inwhich an aqueous organic mixture of a particular compo-sition is filled. For the total gas phase pressure measure-ments, the flask is immersed in a thermostated ethanol bath(initially set to 223 K) whose temperature is slowly rampedup to 290 K. The flask can be evacuated to∼ 10−6 Pa us-ing a vacuum pump and cooled in liquid N2 for the pur-pose of degassing residual air naturally present in the sam-ples. Glass beads (∼ 50 g,∼ 3 mm diameter) are added to theflask to prevent undesirable foaming of the solution duringdegassing cycles, which may occur when a frozen solutionthaws relatively quickly at room temperature after coolingto liquid nitrogen temperature. Foaming may often lead tosplashing of solution droplets up to the neck of the flask,where the droplets remain without contact to the rest of thesample. If such droplets were present above the level of theethanol bath into which the flask is submerged to maintain
Atmos. Chem. Phys., 14, 9993–10012, 2014 www.atmos-chem-phys.net/14/9993/2014/

G. Ganbavale et al.: Temperature dependency in aqueous organic solutions 9999
��
��
Glass beads
VacuumPump
Aqueous solution
ethanol bath
Figure 1. Setup for total gas phase pressure measurements of aque-ous organic solutions at room temperature and below.
a temperature-controlled environment (Julabo, FP50 ther-mostat), they would be at a different temperature than thebulk solution and present a cause of systematic errors. Thepressure increase during the temperature ramp is registeredby two pressure heads operating in the pressure rangesP1(Pfeiffer Vacuum, CMR-262, range: 1 to 1× 10⁴ Pa) andP2(Pfeiffer Vacuum, PKR-251, range: 1× 10⁻² to 110 Pa).
A typical experiment involves the following operationalprocedure. A binary aqueous solution mixture (volume of 3to 5 mL) is added to the flask. To remove the residual gases(e.g. N2, O2, Ar, and CO2) from the solution, a thorough de-gassing procedure is carried out for which the flask is placedin a liquid N2 bath (atT ≈ 77 K) and the valve to the vacuumpump is opened to remove the gas phase above the solutionuntil a low pressure of∼ 10−6 Pa is reached. Thereafter, thevalve is closed again and the solution is slowly brought backto room temperature. These warming and cooling cycles arecarried out about 2–3 times so that all the residual gases areremoved. These degassing cycles are assumed to lead onlyto a very small loss of water via the gas phase, so that themixture composition remains practically unaffected. Beforethe actual measurement starts, the sample flask is once morecooled in liquid N2 and then transferred to the ethanol bath,which is held at 223 K, and further evacuated until a constantpressure is reached to allow the removal of any remainingdissolved gases from the solution and ensuring that the to-tal pressure measured by the pressure sensors corresponds,within uncertainty, to the one of water vapour alone. Thevalves to the pressure heads are then opened and the totalgas phase pressure measurement is carried out in the tem-perature range from 228 to 290 K by increasing the temper-
ature of the ethanol bath at a constant rate of 10.6 K h−1,over a time period of 350 min. The measured constant leakrate of the instrument, which we measured for the same timeinterval as the actual experiment, is subtracted from the to-tal pressure data and from the resulting values, water vapourpressure data for the particular system compositions and tem-peratures are obtained. Pure water ice was measured as a ref-erence sample. From this we estimate the error in the mea-sured water activity to be±0.015. For the investigated sys-tems,aw values are derived by dividing the measured watervapour pressure by the calculated liquid-state vapour pres-sure of pure water (liquid-state saturation vapour pressure)at the prescribed temperature of the ethanol bath using theparameterisation byMurphy and Koop(2005). We conserva-tively estimate the uncertainty in the water activity in organicsolutions to be twice of that determined for pure water ice,namely±0.03 in absoluteaw, to account for possible arte-facts by residual foaming and/or temperature gradients dueto the glass beads.
3 Results
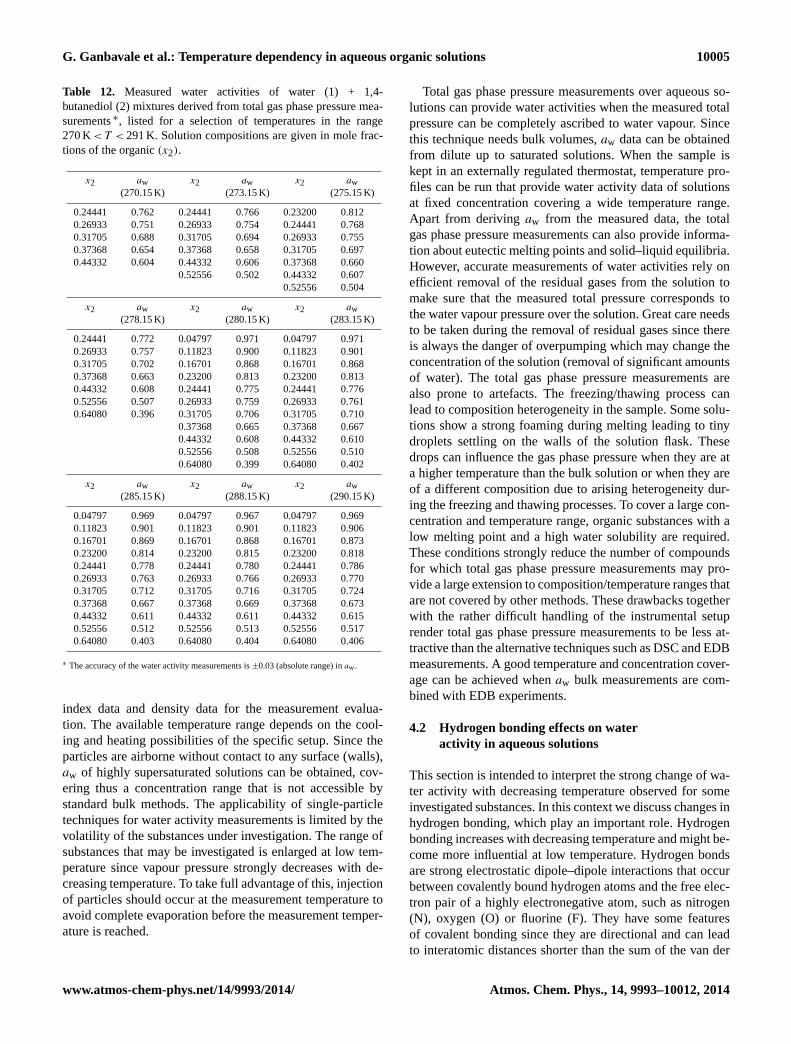
The total gas phase pressure measurements were performedfor four aqueous organic mixtures, namely for aqueous so-lutions of 1,4-butanediol, M5, methoxyacetic acid and 2-(2-ethoxyethoxy)ethanol. These measurements were comple-mented by bulk solutionaw measurements using the wateractivity meter in the temperature range from 313 K to 279 K,and SLE ice melting and freezing data measured with theDSC in the temperature range from 273 K to∼200 K, toobtainaw data coverage over a wide range of temperaturesand concentrations. In the case of aqueous M5 mixtures, ad-ditional aw measurements to temperatures as low as 233 Kwere obtained from single-particle measurements using theEDB.
3.1 1,4-Butanediol
Figure2 showsaw measurements for aqueous 1,4-butanediolsolutions obtained from the different measurement tech-niques. The ice melting curve as a function ofaw (dashedblue curve) is calculated using the parameterisation byKoopand Zobrist(2009). The dash-dotted lines represent the pa-rameterisation byZobrist et al.(2008) for the different com-positions given in terms of mass percent (wt %).Zobristet al.(2008) used experimental ice melting temperatures andbulk aw data and applied a composition- and temperature-dependent parameterisation for water activities of specificmixtures with seven coefficients fitted to their data sets. Thesolid lines (both coloured and grey) show the derivedawvalues from the total gas phase pressure measurements forconcentrations from 20 to 90 wt % over a temperature rangefrom 240 to 290 K. The measured data are considered reli-able within the uncertainty of the method (± 0.03 ofaw). The
www.atmos-chem-phys.net/14/9993/2014/ Atmos. Chem. Phys., 14, 9993–10012, 2014
10000 G. Ganbavale et al.: Temperature dependency in aqueous organic solutions
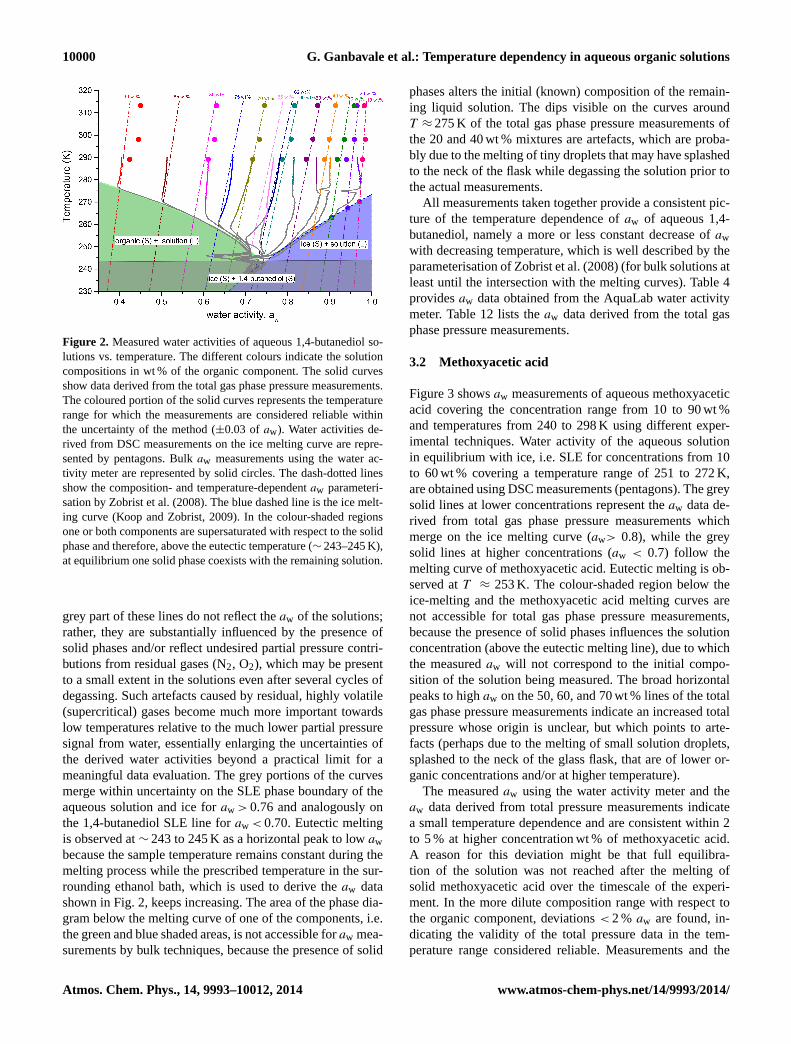
Figure 2. Measured water activities of aqueous 1,4-butanediol so-lutions vs. temperature. The different colours indicate the solutioncompositions in wt % of the organic component. The solid curvesshow data derived from the total gas phase pressure measurements.The coloured portion of the solid curves represents the temperaturerange for which the measurements are considered reliable withinthe uncertainty of the method (±0.03 ofaw). Water activities de-rived from DSC measurements on the ice melting curve are repre-sented by pentagons. Bulkaw measurements using the water ac-tivity meter are represented by solid circles. The dash-dotted linesshow the composition- and temperature-dependentaw parameteri-sation byZobrist et al.(2008). The blue dashed line is the ice melt-ing curve (Koop and Zobrist, 2009). In the colour-shaded regionsone or both components are supersaturated with respect to the solidphase and therefore, above the eutectic temperature (∼ 243–245 K),at equilibrium one solid phase coexists with the remaining solution.
grey part of these lines do not reflect theaw of the solutions;rather, they are substantially influenced by the presence ofsolid phases and/or reflect undesired partial pressure contri-butions from residual gases (N2, O2), which may be presentto a small extent in the solutions even after several cycles ofdegassing. Such artefacts caused by residual, highly volatile(supercritical) gases become much more important towardslow temperatures relative to the much lower partial pressuresignal from water, essentially enlarging the uncertainties ofthe derived water activities beyond a practical limit for ameaningful data evaluation. The grey portions of the curvesmerge within uncertainty on the SLE phase boundary of theaqueous solution and ice foraw > 0.76 and analogously onthe 1,4-butanediol SLE line foraw < 0.70. Eutectic meltingis observed at∼ 243 to 245 K as a horizontal peak to lowawbecause the sample temperature remains constant during themelting process while the prescribed temperature in the sur-rounding ethanol bath, which is used to derive theaw datashown in Fig.2, keeps increasing. The area of the phase dia-gram below the melting curve of one of the components, i.e.the green and blue shaded areas, is not accessible foraw mea-surements by bulk techniques, because the presence of solid
phases alters the initial (known) composition of the remain-ing liquid solution. The dips visible on the curves aroundT ≈ 275 K of the total gas phase pressure measurements ofthe 20 and 40 wt % mixtures are artefacts, which are proba-bly due to the melting of tiny droplets that may have splashedto the neck of the flask while degassing the solution prior tothe actual measurements.
All measurements taken together provide a consistent pic-ture of the temperature dependence ofaw of aqueous 1,4-butanediol, namely a more or less constant decrease ofawwith decreasing temperature, which is well described by theparameterisation ofZobrist et al.(2008) (for bulk solutions atleast until the intersection with the melting curves). Table4providesaw data obtained from the AquaLab water activitymeter. Table12 lists theaw data derived from the total gasphase pressure measurements.
3.2 Methoxyacetic acid
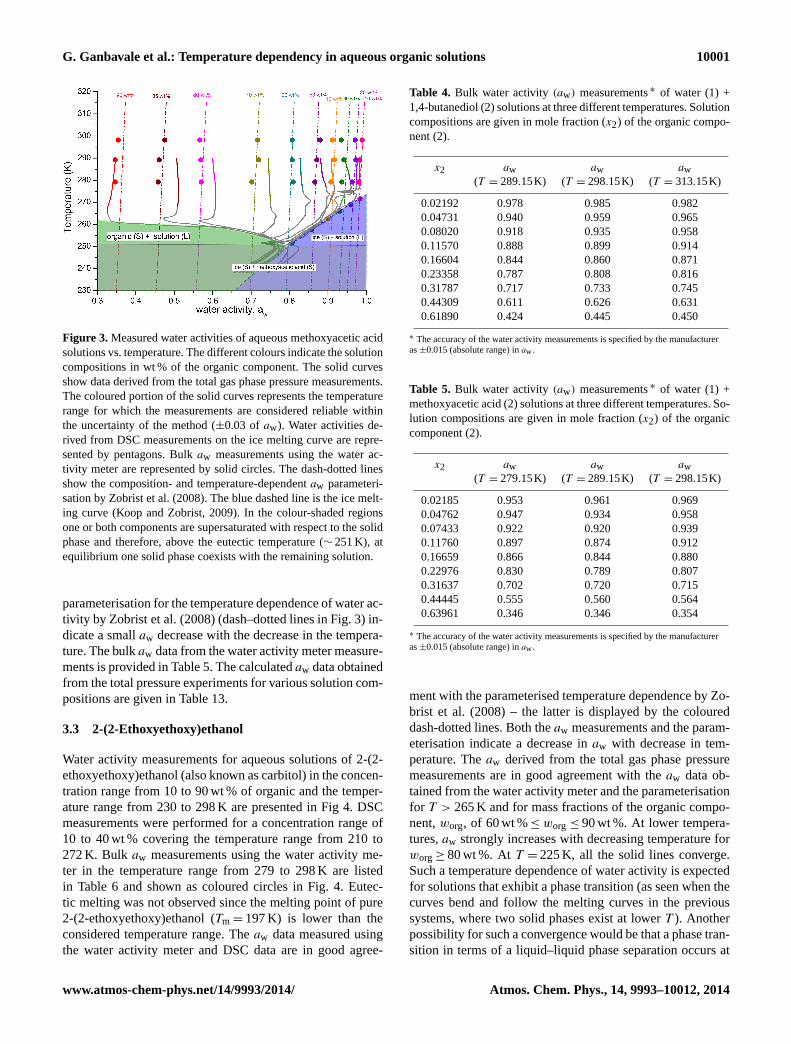
Figure3 showsaw measurements of aqueous methoxyaceticacid covering the concentration range from 10 to 90 wt %and temperatures from 240 to 298 K using different exper-imental techniques. Water activity of the aqueous solutionin equilibrium with ice, i.e. SLE for concentrations from 10to 60 wt % covering a temperature range of 251 to 272 K,are obtained using DSC measurements (pentagons). The greysolid lines at lower concentrations represent theaw data de-rived from total gas phase pressure measurements whichmerge on the ice melting curve (aw> 0.8), while the greysolid lines at higher concentrations (aw < 0.7) follow themelting curve of methoxyacetic acid. Eutectic melting is ob-served atT ≈ 253 K. The colour-shaded region below theice-melting and the methoxyacetic acid melting curves arenot accessible for total gas phase pressure measurements,because the presence of solid phases influences the solutionconcentration (above the eutectic melting line), due to whichthe measuredaw will not correspond to the initial compo-sition of the solution being measured. The broad horizontalpeaks to highaw on the 50, 60, and 70 wt % lines of the totalgas phase pressure measurements indicate an increased totalpressure whose origin is unclear, but which points to arte-facts (perhaps due to the melting of small solution droplets,splashed to the neck of the glass flask, that are of lower or-ganic concentrations and/or at higher temperature).
The measuredaw using the water activity meter and theaw data derived from total pressure measurements indicatea small temperature dependence and are consistent within 2to 5 % at higher concentration wt % of methoxyacetic acid.A reason for this deviation might be that full equilibra-tion of the solution was not reached after the melting ofsolid methoxyacetic acid over the timescale of the experi-ment. In the more dilute composition range with respect tothe organic component, deviations< 2 % aw are found, in-dicating the validity of the total pressure data in the tem-perature range considered reliable. Measurements and the
Atmos. Chem. Phys., 14, 9993–10012, 2014 www.atmos-chem-phys.net/14/9993/2014/
G. Ganbavale et al.: Temperature dependency in aqueous organic solutions 10001
Figure 3. Measured water activities of aqueous methoxyacetic acidsolutions vs. temperature. The different colours indicate the solutioncompositions in wt % of the organic component. The solid curvesshow data derived from the total gas phase pressure measurements.The coloured portion of the solid curves represents the temperaturerange for which the measurements are considered reliable withinthe uncertainty of the method (±0.03 ofaw). Water activities de-rived from DSC measurements on the ice melting curve are repre-sented by pentagons. Bulkaw measurements using the water ac-tivity meter are represented by solid circles. The dash-dotted linesshow the composition- and temperature-dependentaw parameteri-sation byZobrist et al.(2008). The blue dashed line is the ice melt-ing curve (Koop and Zobrist, 2009). In the colour-shaded regionsone or both components are supersaturated with respect to the solidphase and therefore, above the eutectic temperature (∼ 251 K), atequilibrium one solid phase coexists with the remaining solution.
parameterisation for the temperature dependence of water ac-tivity by Zobrist et al.(2008) (dash–dotted lines in Fig.3) in-dicate a smallaw decrease with the decrease in the tempera-ture. The bulkaw data from the water activity meter measure-ments is provided in Table5. The calculatedaw data obtainedfrom the total pressure experiments for various solution com-positions are given in Table13.
3.3 2-(2-Ethoxyethoxy)ethanol
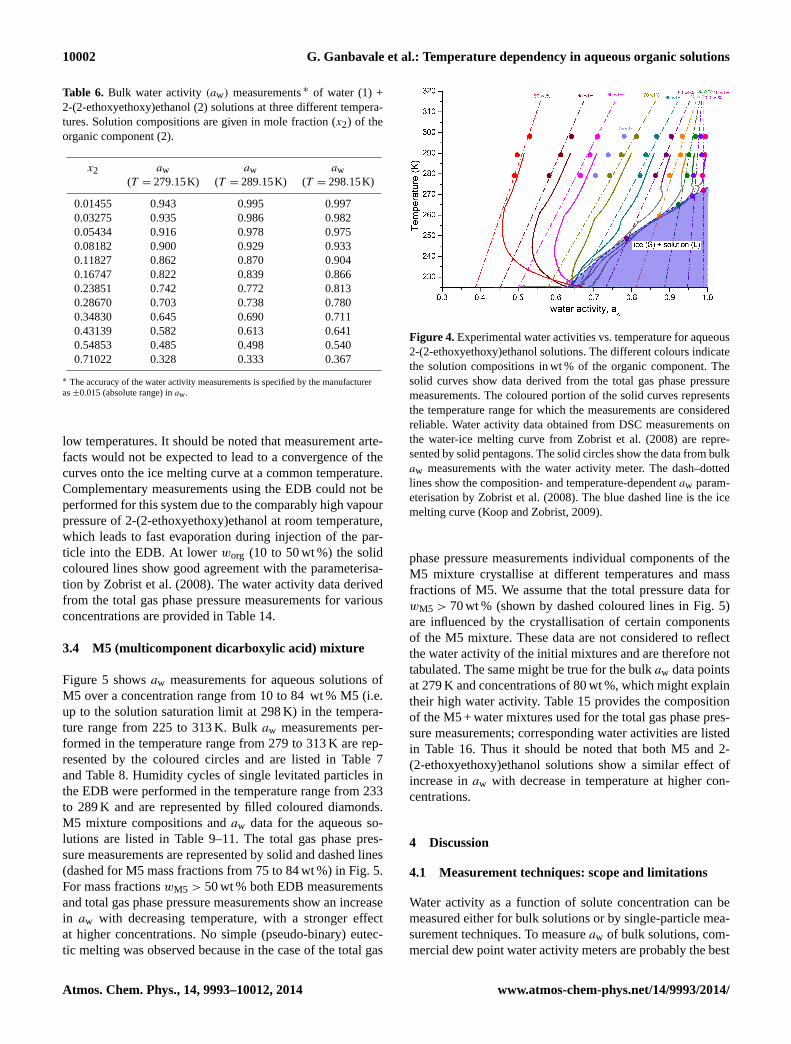
Water activity measurements for aqueous solutions of 2-(2-ethoxyethoxy)ethanol (also known as carbitol) in the concen-tration range from 10 to 90 wt % of organic and the temper-ature range from 230 to 298 K are presented in Fig4. DSCmeasurements were performed for a concentration range of10 to 40 wt % covering the temperature range from 210 to272 K. Bulk aw measurements using the water activity me-ter in the temperature range from 279 to 298 K are listedin Table 6 and shown as coloured circles in Fig.4. Eutec-tic melting was not observed since the melting point of pure2-(2-ethoxyethoxy)ethanol (Tm = 197 K) is lower than theconsidered temperature range. Theaw data measured usingthe water activity meter and DSC data are in good agree-
Table 4. Bulk water activity(aw) measurements∗ of water (1) +1,4-butanediol (2) solutions at three different temperatures. Solutioncompositions are given in mole fraction (x2) of the organic compo-nent (2).
x2 aw aw aw(T = 289.15K) (T = 298.15K) (T = 313.15K)
0.02192 0.978 0.985 0.9820.04731 0.940 0.959 0.9650.08020 0.918 0.935 0.9580.11570 0.888 0.899 0.9140.16604 0.844 0.860 0.8710.23358 0.787 0.808 0.8160.31787 0.717 0.733 0.7450.44309 0.611 0.626 0.6310.61890 0.424 0.445 0.450
∗ The accuracy of the water activity measurements is specified by the manufactureras±0.015 (absolute range) inaw.
Table 5. Bulk water activity(aw) measurements∗ of water (1) +methoxyacetic acid (2) solutions at three different temperatures. So-lution compositions are given in mole fraction (x2) of the organiccomponent (2).
x2 aw aw aw(T = 279.15K) (T = 289.15K) (T = 298.15K)
0.02185 0.953 0.961 0.9690.04762 0.947 0.934 0.9580.07433 0.922 0.920 0.9390.11760 0.897 0.874 0.9120.16659 0.866 0.844 0.8800.22976 0.830 0.789 0.8070.31637 0.702 0.720 0.7150.44445 0.555 0.560 0.5640.63961 0.346 0.346 0.354
∗ The accuracy of the water activity measurements is specified by the manufactureras±0.015 (absolute range) inaw.
ment with the parameterised temperature dependence byZo-brist et al.(2008) – the latter is displayed by the coloureddash-dotted lines. Both theaw measurements and the param-eterisation indicate a decrease inaw with decrease in tem-perature. Theaw derived from the total gas phase pressuremeasurements are in good agreement with theaw data ob-tained from the water activity meter and the parameterisationfor T > 265 K and for mass fractions of the organic compo-nent,worg, of 60 wt %≤ worg ≤ 90 wt %. At lower tempera-tures,aw strongly increases with decreasing temperature forworg≥ 80 wt %. At T = 225 K, all the solid lines converge.Such a temperature dependence of water activity is expectedfor solutions that exhibit a phase transition (as seen when thecurves bend and follow the melting curves in the previoussystems, where two solid phases exist at lowerT ). Anotherpossibility for such a convergence would be that a phase tran-sition in terms of a liquid–liquid phase separation occurs at
www.atmos-chem-phys.net/14/9993/2014/ Atmos. Chem. Phys., 14, 9993–10012, 2014
10002 G. Ganbavale et al.: Temperature dependency in aqueous organic solutions
Table 6. Bulk water activity(aw) measurements∗ of water (1) +2-(2-ethoxyethoxy)ethanol (2) solutions at three different tempera-tures. Solution compositions are given in mole fraction (x2) of theorganic component (2).
x2 aw aw aw(T = 279.15K) (T = 289.15K) (T = 298.15K)
0.01455 0.943 0.995 0.9970.03275 0.935 0.986 0.9820.05434 0.916 0.978 0.9750.08182 0.900 0.929 0.9330.11827 0.862 0.870 0.9040.16747 0.822 0.839 0.8660.23851 0.742 0.772 0.8130.28670 0.703 0.738 0.7800.34830 0.645 0.690 0.7110.43139 0.582 0.613 0.6410.54853 0.485 0.498 0.5400.71022 0.328 0.333 0.367
∗ The accuracy of the water activity measurements is specified by the manufactureras±0.015 (absolute range) inaw.
low temperatures. It should be noted that measurement arte-facts would not be expected to lead to a convergence of thecurves onto the ice melting curve at a common temperature.Complementary measurements using the EDB could not beperformed for this system due to the comparably high vapourpressure of 2-(2-ethoxyethoxy)ethanol at room temperature,which leads to fast evaporation during injection of the par-ticle into the EDB. At lowerworg (10 to 50 wt %) the solidcoloured lines show good agreement with the parameterisa-tion by Zobrist et al.(2008). The water activity data derivedfrom the total gas phase pressure measurements for variousconcentrations are provided in Table14.
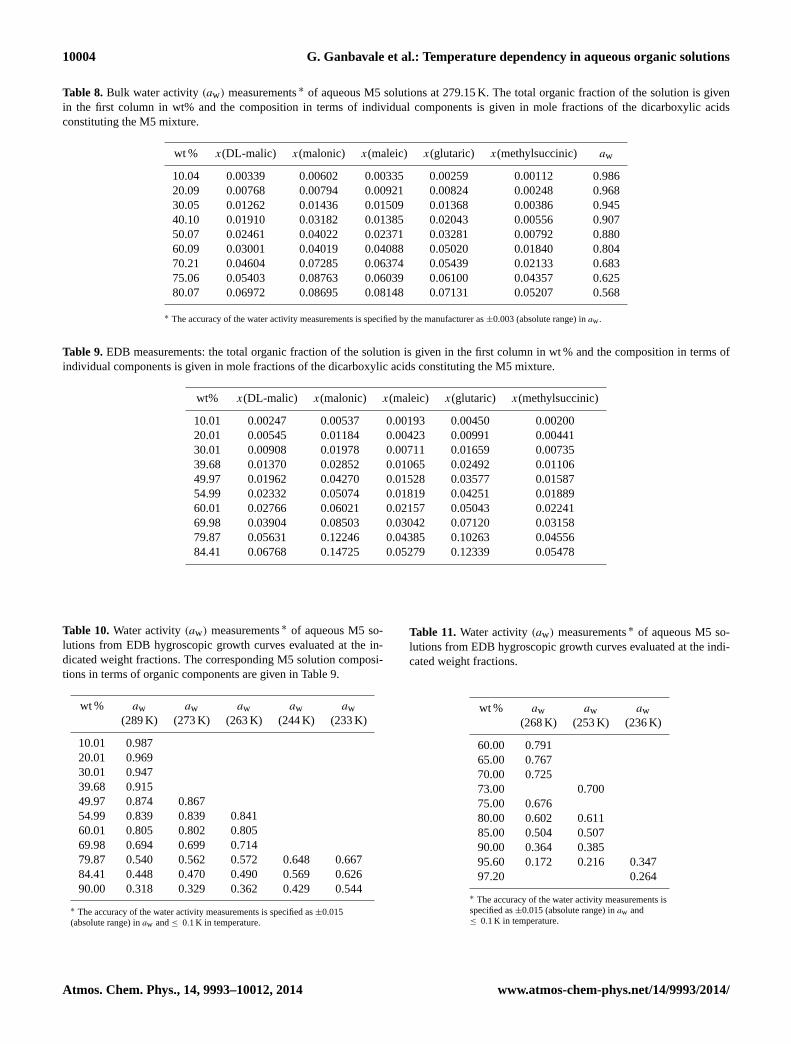
3.4 M5 (multicomponent dicarboxylic acid) mixture
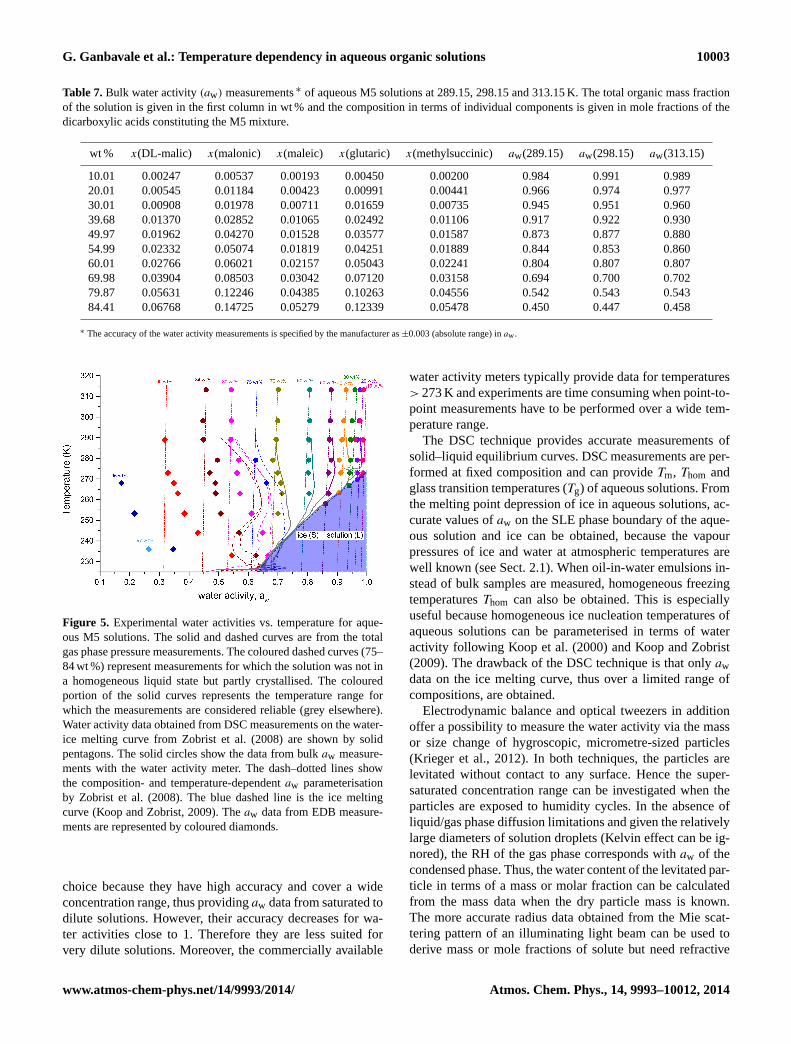
Figure5 showsaw measurements for aqueous solutions ofM5 over a concentration range from 10 to 84 wt % M5 (i.e.up to the solution saturation limit at 298 K) in the tempera-ture range from 225 to 313 K. Bulkaw measurements per-formed in the temperature range from 279 to 313 K are rep-resented by the coloured circles and are listed in Table7and Table8. Humidity cycles of single levitated particles inthe EDB were performed in the temperature range from 233to 289 K and are represented by filled coloured diamonds.M5 mixture compositions andaw data for the aqueous so-lutions are listed in Table9–11. The total gas phase pres-sure measurements are represented by solid and dashed lines(dashed for M5 mass fractions from 75 to 84 wt %) in Fig.5.For mass fractionswM5 > 50 wt % both EDB measurementsand total gas phase pressure measurements show an increasein aw with decreasing temperature, with a stronger effectat higher concentrations. No simple (pseudo-binary) eutec-tic melting was observed because in the case of the total gas
Figure 4.Experimental water activities vs. temperature for aqueous2-(2-ethoxyethoxy)ethanol solutions. The different colours indicatethe solution compositions in wt % of the organic component. Thesolid curves show data derived from the total gas phase pressuremeasurements. The coloured portion of the solid curves representsthe temperature range for which the measurements are consideredreliable. Water activity data obtained from DSC measurements onthe water-ice melting curve fromZobrist et al.(2008) are repre-sented by solid pentagons. The solid circles show the data from bulkaw measurements with the water activity meter. The dash–dottedlines show the composition- and temperature-dependentaw param-eterisation byZobrist et al.(2008). The blue dashed line is the icemelting curve (Koop and Zobrist, 2009).
phase pressure measurements individual components of theM5 mixture crystallise at different temperatures and massfractions of M5. We assume that the total pressure data forwM5 > 70 wt % (shown by dashed coloured lines in Fig.5)are influenced by the crystallisation of certain componentsof the M5 mixture. These data are not considered to reflectthe water activity of the initial mixtures and are therefore nottabulated. The same might be true for the bulkaw data pointsat 279 K and concentrations of 80 wt %, which might explaintheir high water activity. Table15 provides the compositionof the M5 + water mixtures used for the total gas phase pres-sure measurements; corresponding water activities are listedin Table 16. Thus it should be noted that both M5 and 2-(2-ethoxyethoxy)ethanol solutions show a similar effect ofincrease inaw with decrease in temperature at higher con-centrations.
4 Discussion
4.1 Measurement techniques: scope and limitations
Water activity as a function of solute concentration can bemeasured either for bulk solutions or by single-particle mea-surement techniques. To measureaw of bulk solutions, com-mercial dew point water activity meters are probably the best
Atmos. Chem. Phys., 14, 9993–10012, 2014 www.atmos-chem-phys.net/14/9993/2014/
G. Ganbavale et al.: Temperature dependency in aqueous organic solutions 10003
Table 7.Bulk water activity(aw) measurements∗ of aqueous M5 solutions at 289.15, 298.15 and 313.15 K. The total organic mass fractionof the solution is given in the first column in wt % and the composition in terms of individual components is given in mole fractions of thedicarboxylic acids constituting the M5 mixture.
wt % x(DL-malic) x(malonic) x(maleic) x(glutaric) x(methylsuccinic) aw(289.15) aw(298.15) aw(313.15)
10.01 0.00247 0.00537 0.00193 0.00450 0.00200 0.984 0.991 0.98920.01 0.00545 0.01184 0.00423 0.00991 0.00441 0.966 0.974 0.97730.01 0.00908 0.01978 0.00711 0.01659 0.00735 0.945 0.951 0.96039.68 0.01370 0.02852 0.01065 0.02492 0.01106 0.917 0.922 0.93049.97 0.01962 0.04270 0.01528 0.03577 0.01587 0.873 0.877 0.88054.99 0.02332 0.05074 0.01819 0.04251 0.01889 0.844 0.853 0.86060.01 0.02766 0.06021 0.02157 0.05043 0.02241 0.804 0.807 0.80769.98 0.03904 0.08503 0.03042 0.07120 0.03158 0.694 0.700 0.70279.87 0.05631 0.12246 0.04385 0.10263 0.04556 0.542 0.543 0.54384.41 0.06768 0.14725 0.05279 0.12339 0.05478 0.450 0.447 0.458
∗ The accuracy of the water activity measurements is specified by the manufacturer as±0.003 (absolute range) inaw.
Figure 5. Experimental water activities vs. temperature for aque-ous M5 solutions. The solid and dashed curves are from the totalgas phase pressure measurements. The coloured dashed curves (75–84 wt %) represent measurements for which the solution was not ina homogeneous liquid state but partly crystallised. The colouredportion of the solid curves represents the temperature range forwhich the measurements are considered reliable (grey elsewhere).Water activity data obtained from DSC measurements on the water-ice melting curve fromZobrist et al.(2008) are shown by solidpentagons. The solid circles show the data from bulkaw measure-ments with the water activity meter. The dash–dotted lines showthe composition- and temperature-dependentaw parameterisationby Zobrist et al.(2008). The blue dashed line is the ice meltingcurve (Koop and Zobrist, 2009). Theaw data from EDB measure-ments are represented by coloured diamonds.
choice because they have high accuracy and cover a wideconcentration range, thus providingaw data from saturated todilute solutions. However, their accuracy decreases for wa-ter activities close to 1. Therefore they are less suited forvery dilute solutions. Moreover, the commercially available
water activity meters typically provide data for temperatures> 273 K and experiments are time consuming when point-to-point measurements have to be performed over a wide tem-perature range.
The DSC technique provides accurate measurements ofsolid–liquid equilibrium curves. DSC measurements are per-formed at fixed composition and can provideTm, Thom andglass transition temperatures (Tg) of aqueous solutions. Fromthe melting point depression of ice in aqueous solutions, ac-curate values ofaw on the SLE phase boundary of the aque-ous solution and ice can be obtained, because the vapourpressures of ice and water at atmospheric temperatures arewell known (see Sect.2.1). When oil-in-water emulsions in-stead of bulk samples are measured, homogeneous freezingtemperaturesThom can also be obtained. This is especiallyuseful because homogeneous ice nucleation temperatures ofaqueous solutions can be parameterised in terms of wateractivity following Koop et al.(2000) andKoop and Zobrist(2009). The drawback of the DSC technique is that onlyawdata on the ice melting curve, thus over a limited range ofcompositions, are obtained.
Electrodynamic balance and optical tweezers in additionoffer a possibility to measure the water activity via the massor size change of hygroscopic, micrometre-sized particles(Krieger et al., 2012). In both techniques, the particles arelevitated without contact to any surface. Hence the super-saturated concentration range can be investigated when theparticles are exposed to humidity cycles. In the absence ofliquid/gas phase diffusion limitations and given the relativelylarge diameters of solution droplets (Kelvin effect can be ig-nored), the RH of the gas phase corresponds withaw of thecondensed phase. Thus, the water content of the levitated par-ticle in terms of a mass or molar fraction can be calculatedfrom the mass data when the dry particle mass is known.The more accurate radius data obtained from the Mie scat-tering pattern of an illuminating light beam can be used toderive mass or mole fractions of solute but need refractive
www.atmos-chem-phys.net/14/9993/2014/ Atmos. Chem. Phys., 14, 9993–10012, 2014
10004 G. Ganbavale et al.: Temperature dependency in aqueous organic solutions
Table 8. Bulk water activity(aw) measurements∗ of aqueous M5 solutions at 279.15 K. The total organic fraction of the solution is givenin the first column in wt% and the composition in terms of individual components is given in mole fractions of the dicarboxylic acidsconstituting the M5 mixture.
wt % x(DL-malic) x(malonic) x(maleic) x(glutaric) x(methylsuccinic) aw
10.04 0.00339 0.00602 0.00335 0.00259 0.00112 0.98620.09 0.00768 0.00794 0.00921 0.00824 0.00248 0.96830.05 0.01262 0.01436 0.01509 0.01368 0.00386 0.94540.10 0.01910 0.03182 0.01385 0.02043 0.00556 0.90750.07 0.02461 0.04022 0.02371 0.03281 0.00792 0.88060.09 0.03001 0.04019 0.04088 0.05020 0.01840 0.80470.21 0.04604 0.07285 0.06374 0.05439 0.02133 0.68375.06 0.05403 0.08763 0.06039 0.06100 0.04357 0.62580.07 0.06972 0.08695 0.08148 0.07131 0.05207 0.568
∗ The accuracy of the water activity measurements is specified by the manufacturer as±0.003 (absolute range) inaw.
Table 9. EDB measurements: the total organic fraction of the solution is given in the first column in wt % and the composition in terms ofindividual components is given in mole fractions of the dicarboxylic acids constituting the M5 mixture.
wt% x(DL-malic) x(malonic) x(maleic) x(glutaric) x(methylsuccinic)
10.01 0.00247 0.00537 0.00193 0.00450 0.0020020.01 0.00545 0.01184 0.00423 0.00991 0.0044130.01 0.00908 0.01978 0.00711 0.01659 0.0073539.68 0.01370 0.02852 0.01065 0.02492 0.0110649.97 0.01962 0.04270 0.01528 0.03577 0.0158754.99 0.02332 0.05074 0.01819 0.04251 0.0188960.01 0.02766 0.06021 0.02157 0.05043 0.0224169.98 0.03904 0.08503 0.03042 0.07120 0.0315879.87 0.05631 0.12246 0.04385 0.10263 0.0455684.41 0.06768 0.14725 0.05279 0.12339 0.05478
Table 10.Water activity(aw) measurements∗ of aqueous M5 so-lutions from EDB hygroscopic growth curves evaluated at the in-dicated weight fractions. The corresponding M5 solution composi-tions in terms of organic components are given in Table9.
wt % aw aw aw aw aw(289 K) (273 K) (263 K) (244 K) (233 K)
10.01 0.98720.01 0.96930.01 0.94739.68 0.91549.97 0.874 0.86754.99 0.839 0.839 0.84160.01 0.805 0.802 0.80569.98 0.694 0.699 0.71479.87 0.540 0.562 0.572 0.648 0.66784.41 0.448 0.470 0.490 0.569 0.62690.00 0.318 0.329 0.362 0.429 0.544
∗ The accuracy of the water activity measurements is specified as±0.015(absolute range) inaw and≤ 0.1 K in temperature.
Table 11.Water activity(aw) measurements∗ of aqueous M5 so-lutions from EDB hygroscopic growth curves evaluated at the indi-cated weight fractions.
wt % aw aw aw(268 K) (253 K) (236 K)
60.00 0.79165.00 0.76770.00 0.72573.00 0.70075.00 0.67680.00 0.602 0.61185.00 0.504 0.50790.00 0.364 0.38595.60 0.172 0.216 0.34797.20 0.264
∗ The accuracy of the water activity measurements isspecified as±0.015 (absolute range) inaw and≤ 0.1 K in temperature.
Atmos. Chem. Phys., 14, 9993–10012, 2014 www.atmos-chem-phys.net/14/9993/2014/
G. Ganbavale et al.: Temperature dependency in aqueous organic solutions 10005
Table 12. Measured water activities of water (1) + 1,4-butanediol (2) mixtures derived from total gas phase pressure mea-surements∗, listed for a selection of temperatures in the range270 K< T < 291 K. Solution compositions are given in mole frac-tions of the organic(x2).
x2 aw x2 aw x2 aw(270.15 K) (273.15 K) (275.15 K)
0.24441 0.762 0.24441 0.766 0.23200 0.8120.26933 0.751 0.26933 0.754 0.24441 0.7680.31705 0.688 0.31705 0.694 0.26933 0.7550.37368 0.654 0.37368 0.658 0.31705 0.6970.44332 0.604 0.44332 0.606 0.37368 0.660
0.52556 0.502 0.44332 0.6070.52556 0.504
x2 aw x2 aw x2 aw(278.15 K) (280.15 K) (283.15 K)
0.24441 0.772 0.04797 0.971 0.04797 0.9710.26933 0.757 0.11823 0.900 0.11823 0.9010.31705 0.702 0.16701 0.868 0.16701 0.8680.37368 0.663 0.23200 0.813 0.23200 0.8130.44332 0.608 0.24441 0.775 0.24441 0.7760.52556 0.507 0.26933 0.759 0.26933 0.7610.64080 0.396 0.31705 0.706 0.31705 0.710
0.37368 0.665 0.37368 0.6670.44332 0.608 0.44332 0.6100.52556 0.508 0.52556 0.5100.64080 0.399 0.64080 0.402
x2 aw x2 aw x2 aw(285.15 K) (288.15 K) (290.15 K)
0.04797 0.969 0.04797 0.967 0.04797 0.9690.11823 0.901 0.11823 0.901 0.11823 0.9060.16701 0.869 0.16701 0.868 0.16701 0.8730.23200 0.814 0.23200 0.815 0.23200 0.8180.24441 0.778 0.24441 0.780 0.24441 0.7860.26933 0.763 0.26933 0.766 0.26933 0.7700.31705 0.712 0.31705 0.716 0.31705 0.7240.37368 0.667 0.37368 0.669 0.37368 0.6730.44332 0.611 0.44332 0.611 0.44332 0.6150.52556 0.512 0.52556 0.513 0.52556 0.5170.64080 0.403 0.64080 0.404 0.64080 0.406
∗ The accuracy of the water activity measurements is±0.03 (absolute range) inaw.
index data and density data for the measurement evalua-tion. The available temperature range depends on the cool-ing and heating possibilities of the specific setup. Since theparticles are airborne without contact to any surface (walls),aw of highly supersaturated solutions can be obtained, cov-ering thus a concentration range that is not accessible bystandard bulk methods. The applicability of single-particletechniques for water activity measurements is limited by thevolatility of the substances under investigation. The range ofsubstances that may be investigated is enlarged at low tem-perature since vapour pressure strongly decreases with de-creasing temperature. To take full advantage of this, injectionof particles should occur at the measurement temperature toavoid complete evaporation before the measurement temper-ature is reached.
Total gas phase pressure measurements over aqueous so-lutions can provide water activities when the measured totalpressure can be completely ascribed to water vapour. Sincethis technique needs bulk volumes,aw data can be obtainedfrom dilute up to saturated solutions. When the sample iskept in an externally regulated thermostat, temperature pro-files can be run that provide water activity data of solutionsat fixed concentration covering a wide temperature range.Apart from derivingaw from the measured data, the totalgas phase pressure measurements can also provide informa-tion about eutectic melting points and solid–liquid equilibria.However, accurate measurements of water activities rely onefficient removal of the residual gases from the solution tomake sure that the measured total pressure corresponds tothe water vapour pressure over the solution. Great care needsto be taken during the removal of residual gases since thereis always the danger of overpumping which may change theconcentration of the solution (removal of significant amountsof water). The total gas phase pressure measurements arealso prone to artefacts. The freezing/thawing process canlead to composition heterogeneity in the sample. Some solu-tions show a strong foaming during melting leading to tinydroplets settling on the walls of the solution flask. Thesedrops can influence the gas phase pressure when they are ata higher temperature than the bulk solution or when they areof a different composition due to arising heterogeneity dur-ing the freezing and thawing processes. To cover a large con-centration and temperature range, organic substances with alow melting point and a high water solubility are required.These conditions strongly reduce the number of compoundsfor which total gas phase pressure measurements may pro-vide a large extension to composition/temperature ranges thatare not covered by other methods. These drawbacks togetherwith the rather difficult handling of the instrumental setuprender total gas phase pressure measurements to be less at-tractive than the alternative techniques such as DSC and EDBmeasurements. A good temperature and concentration cover-age can be achieved whenaw bulk measurements are com-bined with EDB experiments.
4.2 Hydrogen bonding effects on wateractivity in aqueous solutions
This section is intended to interpret the strong change of wa-ter activity with decreasing temperature observed for someinvestigated substances. In this context we discuss changes inhydrogen bonding, which play an important role. Hydrogenbonding increases with decreasing temperature and might be-come more influential at low temperature. Hydrogen bondsare strong electrostatic dipole–dipole interactions that occurbetween covalently bound hydrogen atoms and the free elec-tron pair of a highly electronegative atom, such as nitrogen(N), oxygen (O) or fluorine (F). They have some featuresof covalent bonding since they are directional and can leadto interatomic distances shorter than the sum of the van der
www.atmos-chem-phys.net/14/9993/2014/ Atmos. Chem. Phys., 14, 9993–10012, 2014

10006 G. Ganbavale et al.: Temperature dependency in aqueous organic solutions
Table 13.Measured water activities of water (1) + methoxyacetic acid (2) mixtures derived from total gas phase pressure measurements∗,listed for a selection of temperatures in the range 268 K< T < 291 K. Solution compositions are given in mole fractions of the organic(x2).
x2 aw (268.15 K) x2 aw(270.15 K) x2 aw(273.15 K) x2 aw(275.15 K)
0.43712 0.607 0.31301 0.750 0.31301 0.749 0.22937 0.8350.53152 0.509 0.43712 0.608 0.43712 0.608 0.31301 0.7490.63995 0.328 0.53152 0.510 0.53152 0.511 0.43712 0.608
0.63995 0.331 0.63995 0.336 0.53152 0.5110.63995 0.337
x2 aw(278.15 K) x2 aw(280.15 K) x2 aw(283.15 K) x2 aw(285.15 K)
0.02180 0.983 0.02180 0.983 0.02180 0.983 0.02180 0.9830.04757 0.974 0.04757 0.974 0.04757 0.975 0.04757 0.9750.07904 0.960 0.07904 0.958 0.07904 0.954 0.07904 0.9520.11765 0.924 0.11765 0.921 0.11765 0.918 0.11765 0.9160.16696 0.893 0.16696 0.888 0.16696 0.885 0.16696 0.8840.22937 0.832 0.22937 0.831 0.22937 0.830 0.22937 0.8290.31301 0.748 0.31301 0.748 0.31301 0.747 0.31301 0.7470.43712 0.607 0.43712 0.605 0.43712 0.604 0.43712 0.6030.53152 0.511 0.53152 0.510 0.53152 0.509 0.53152 0.5090.63995 0.340 0.63995 0.341 0.63995 0.343 0.63995 0.344
x2 aw(288.15 K) x2 aw(290.15 K)
0.02180 0.983 0.02180 0.9870.04757 0.976 0.04757 0.9800.07904 0.946 0.07904 0.9490.11765 0.915 0.11765 0.9180.16696 0.882 0.16696 0.8840.22937 0.829 0.22937 0.8300.31301 0.745 0.31301 0.7470.43712 0.601 0.43712 0.6020.53152 0.507 0.53152 0.5080.63995 0.346 0.63995 0.348
∗ The accuracy of the water activity measurements is±0.03 (absolute range) inaw.
Waals radii of the involved atoms. Hydrogen bonds have astrong influence on the activity of the constituents in a so-lution. In aqueous solutions of alcohols and organic acids,organic–organic, organic–water, and water–water hydrogenbonds can form. In general, organic–water hydrogen bondsdecreaseaw while association of organic molecules amongeach other leads to an increase in water activity. The strengthand average number of hydrogen bonds per molecule de-pends on concentration and temperature. A strong increase ofaw with decreasing temperature can be rationalised in termsof association of solute molecules among each other. There-fore, the analysis of the hydrogen bonds present in aqueoussolutions can help to understand the temperature dependenceof water activity.
The carboxyl group of organic acids can build hydrogenbonds with water or other dicarboxylic acids. The hydrogenatoms of the carboxyl group form hydrogen bonds with thefree electron pair of the oxygen atoms of a carboxyl groupof another acid molecule. Similarly, for dicarboxylic acidswhen the hydrogen bonds connect to another dicarboxylic
acid molecule this leads to an association of dicarboxylicacids and formation of a dimer, which reduces the effectivenumber of dissolved species and leads to a relative increasein water activity. Hydrogen bonds between water and dicar-boxylic acids lead to a relative decrease of water activity.
Aqueous solutions of poly(ethylene glycol) (PEG) haveattracted much attention because of their extraordinarymixing behaviour with water and their importance inpharmaceutical and biomedical appliances (Dormidontova,2002). 2-(2-ethoxyethoxy)ethanol shares with PEG the−CH2−CH2−O− repetition unit as the main structural fea-ture. Different from PEG with two terminal hydroxyl groups,2-(2-ethoxyethoxy)ethanol carries one terminal methyl andone terminal hydroxyl group, which makes it less hy-drophilic. The−CH2−CH2−O− repetition unit lends 2-(2-ethoxyethoxy)ethanol and PEG a higher solubility than typ-ical for ethers. This behaviour can be rationalised by theincreased structuring of water around PEG molecules. Thisstructuring is a consequence of hydrogen bonding and theability of the PEG structure to fill out the natural cavities in
Atmos. Chem. Phys., 14, 9993–10012, 2014 www.atmos-chem-phys.net/14/9993/2014/

G. Ganbavale et al.: Temperature dependency in aqueous organic solutions 10007
Table 14.Measured water activities of water (1) + 2-(2-ethoxyethoxy)ethanol (2) mixtures derived from total gas phase pressure measure-ments∗, listed for a selection of temperatures in the range 265 K< T < 291 K. Solution compositions are given in mole fractions of theorganic(x2).
x2 aw (265.15 K) x2 aw(268.15 K) x2 aw(270.15 K) x2 aw(273.15 K)
0.54409 0.469 0.54409 0.477 0.54409 0.481 0.54409 0.4880.42719 0.573 0.42719 0.583 0.42719 0.589 0.42719 0.5980.34418 0.644 0.34418 0.654 0.34418 0.660 0.34418 0.6690.23774 0.732 0.23774 0.742 0.23774 0.748 0.23774 0.7560.16753 0.801 0.16753 0.811 0.16753 0.817 0.16753 0.824
x2 aw (275.15 K) x2 aw(278.15 K) x2 aw(280.15 K) x2 aw(283.15 K)
0.54409 0.492 0.54409 0.497 0.54409 0.501 0.54409 0.5060.42719 0.603 0.42719 0.610 0.42719 0.616 0.42719 0.6220.34418 0.674 0.34418 0.681 0.34418 0.685 0.34418 0.6920.23774 0.762 0.23774 0.769 0.23774 0.774 0.23774 0.7820.16753 0.828 0.16753 0.835 0.16753 0.839 0.16753 0.8450.11810 0.878 0.11810 0.883 0.11810 0.886 0.11810 0.891
0.08217 0.932 0.08217 0.932 0.08217 0.9350.05412 0.961 0.05412 0.961 0.05412 0.9610.03245 0.988 0.03245 0.989 0.03245 0.990
x2 aw(285.15 K) x2 aw(288.15 K) x2 aw(290.15 K)
0.54409 0.509 0.54409 0.514 0.54409 0.5180.42719 0.627 0.42719 0.634 0.42719 0.6430.34418 0.696 0.34418 0.704 0.34418 0.7110.23774 0.787 0.23774 0.795 0.23774 0.8150.16753 0.849 0.16753 0.855 0.16753 0.8640.11810 0.895 0.11810 0.900 0.11810 0.9070.08217 0.938 0.08217 0.941 0.08217 0.9460.05412 0.962 0.05412 0.964 0.05412 0.9670.03245 0.992 0.03245 0.994 0.03245 0.998
∗ The accuracy of the water activity measurements is±0.03 (absolute range) inaw.
Table 15. Mixture compositions at different overall organic mass fractions of the aqueous M5 system used for total gas phase pressuremeasurements. Component mole fractions(x) of the dicarboxylic acids constituting the M5 mixture are given, with water accounting for theremaining fraction.
wt % x(DL-malic acid) x(malonic acid) x(maleic acid) x(glutaric acid) x(methylsuccinic acid)
20 0.00545 0.01183 0.00428 0.00992 0.0044140 0.01353 0.02815 0.01064 0.02453 0.0108550 0.01959 0.04236 0.01526 0.03581 0.0167260 0.02746 0.06049 0.02135 0.04971 0.0224170 0.03833 0.08327 0.02997 0.06984 0.0309075 0.04547 0.09924 0.03549 0.08310 0.03700
the hydrogen-bonded network of water. The increased struc-turing of the water is reflected in the large negative excessentropy of the solution, while its large positive excess heatcapacity is due to the temperature sensitivity of the struc-ture (Kjellander and Florin, 1981). This interplay of entropicand enthalpy contributions to the Gibbs energy leads to aclosed-loop miscibility gap at elevated temperature (353.15–523.15 K) for aqueous PEG solutions with PEG molecular
weights of 2200 g mol−1 and higher (e.g.Dormidontova,2004; Kjellander and Florin, 1981; Zobrist et al., 2003).
PEG with molecular weight below 2000 g mol−1 do notshow liquid–liquid phase separation close to room tempera-ture. However liquid–liquid equilibria are observed for aque-ous triethylene glycol solutions (Salabat, 2010) and smallerpoly(ethylene glycols) when a salt is added (e.g.Mar-colli and Krieger, 2006; Ciobanu et al., 2009). Liquid–liquid phase separation below room temperature is not easily
www.atmos-chem-phys.net/14/9993/2014/ Atmos. Chem. Phys., 14, 9993–10012, 2014

10008 G. Ganbavale et al.: Temperature dependency in aqueous organic solutions
Table 16.Measured water activities of water (1) + M5 (2) mixturesderived from total gas phase pressure measurements∗, listed for aselection of temperatures in the range 265 K< T < 291 K. The totalorganic mass fraction of the solution is given in the first column.
wt % aw aw aw aw(265.15 K) (268.15 K) (270.15 K) (273.15 K)
204050 0.872 0.881 0.886 0.89060 0.822 0.823 0.820 0.81970 0.724 0.719 0.719 0.709
wt % aw aw aw aw(275.15 K) (278.15 K) (280.15 K) (283.15 K)
20 0.982 0.982 0.98140 0.943 0.939 0.93450 0.892 0.890 0.888 0.88760 0.817 0.817 0.817 0.81570 0.706 0.701 0.699 0.696
wt % aw aw aw(285.15 K) (288.15 K) (290.15 K)
20 0.980 0.980 0.98240 0.933 0.932 0.93450 0.886 0.884 0.93460 0.814 0.812 0.82670 0.695 0.695 0.701
∗ The accuracy of the water activity measurements is±0.03 (absolute range) inaw.
accessible because of the competition with crystallisationof either the PEG, the ice phase or both phases, depend-ing on solution composition and temperature.Ciobanu et al.(2009) have investigated in detail liquid–liquid phase sepa-ration of aqueous PEG-400 solutions when ammonium sul-fate is added as a salting-out agent. This phase separationseems to persist or even grow with decreasing temperature.At the onset of liquid–liquid phase separation water activ-ity lines of different concentration converge at a highawvalue. Therefore the strong increase ofaw with decreasingtemperature in aqueous M5 and 2-(2-ethoxyethoxy)ethanolsolutions may be rationalised in terms of approaching a low-temperature miscibility gap that is not experimentally acces-sible because it falls in the concentration/temperature rangewhere ice forms. Low-temperature liquid–liquid transitionswithout macroscopic phase separation have been observed indifferent water–sugar and water–polyol systems (Murata andTanaka, 2013).
4.3 Atmospheric implications
In the upper troposphere, one pathway for cirrus cloud for-mation is by means of homogeneous ice nucleation on/in liq-uid aqueous aerosol particles, which subsequently grow intosupermicron-sized ice crystals by condensing water vapour.
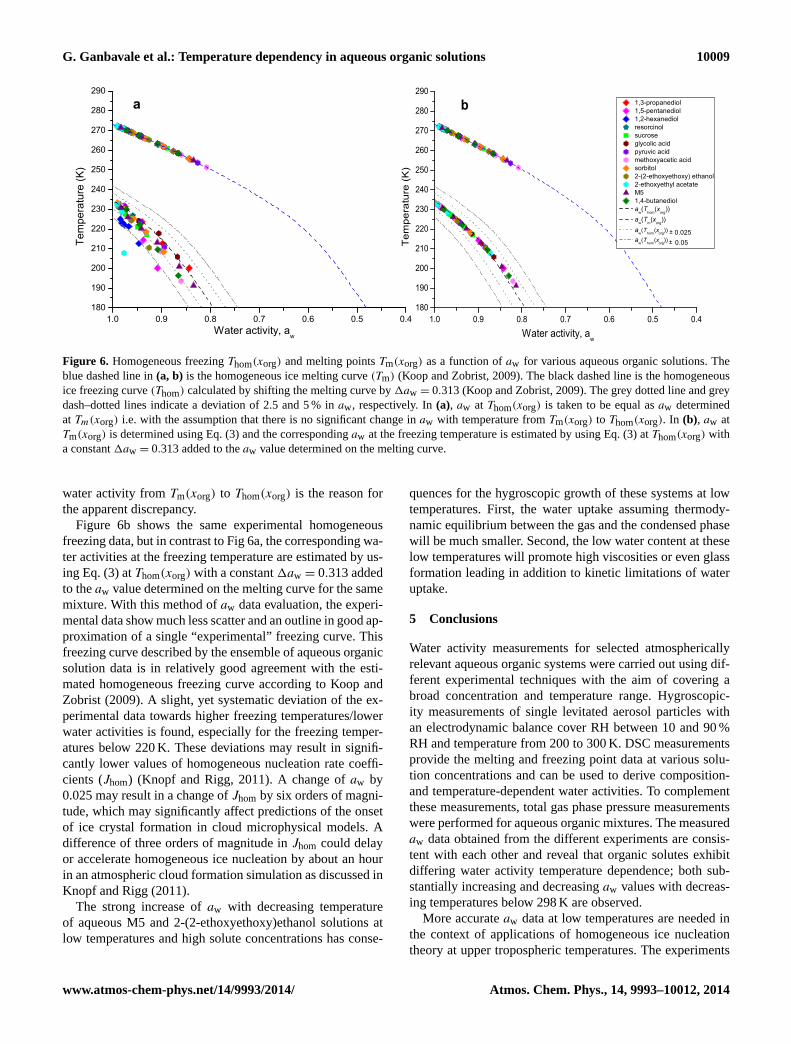
Water-activity-based ice nucleation theory can be employedto predict homogeneous ice nucleation temperatures and cor-responding ice nucleation rate coefficients for aqueous solu-tion droplets without explicit knowledge of the nature of thesolute (Koop et al., 2000; Koop and Zobrist, 2009). Whilefor known mixture compositions the ice melting tempera-ture and the corresponding equilibrium water activity can bemeasured and/or parameterised precisely (Koop et al., 2000;Koop, 2004; Knopf and Rigg, 2011), the same level of in-formation is not accessible experimentally in the case of su-percooled aqueous solution droplets, which exhibit homoge-neous freezing of ice at a temperature lower than the corre-sponding melting point, denoted asThom. As is well under-stood in the case of the ice melting process, with the melt-ing temperature being a function of aqueous solution com-position (melting point depression), similar behaviour is ob-served in droplet freezing experiments for the compositionand temperature dependence of the homogeneous freezingprocess. However, the water activity at the freezing tempera-ture is typically not accessible in experiments and/or subjectto relatively large uncertainty.
Koop et al.(2000) suggest thataw at the homogeneousfreezing temperatureThom(xorg) can be obtained from thecorrespondingaw determined at the melting temperatureTm(xorg) of the solution at the same composition with theassumption thataw does not change significantly over thetemperature difference fromTm(xorg) to Thom(xorg). This ap-proach has been tested and shown to be a good approxima-tion for a variety of inorganic solutions (Koop et al., 2000;Koop, 2004), but may lead to significant errors in predictionsof the homogeneous freezing temperatures for aqueous or-ganic solutions. Figure6 showsaw at melting and freezingconditions for aqueous organic solutions investigated in thiswork. TheThom(xorg) andTm(xorg) temperatures for the in-vestigated organic solutions are measured using the differ-ent measurement techniques stated in this paper. Theaw datafor the ice melting curve are calculated using the parame-terisation byKoop and Zobrist(2009). By applying the as-sumption that solutions do not show significant change inawwith temperature fromTm(xorg) to Thom(xorg), i.e. neglect-ing the temperature dependence, theaw values evaluated thisway show considerable scatter around the ice-freezing curvein Fig 6a. The homogeneous ice freezing curve, shown as adashed black line in Fig.6, is calculated by shifting the melt-ing curve by1aw = 0.313, as suggested byKoop and Zobrist(2009). The aw data derived with this assumption in mostcases lie below the ice freezing curve. This result could beinterpreted as freezing occurring at lower temperatures thanpredicted by the water-activity-based ice nucleation theoryfor the known mixture compositions in Fig.6a. However,since the water-activity-based freezing curve parameterisa-tion is actually very successful in describing the freezing be-haviour of many inorganic solutions, for which the experi-mental or predicted temperature dependence in water activ-ity is small, it is more likely the case that assuming constant
Atmos. Chem. Phys., 14, 9993–10012, 2014 www.atmos-chem-phys.net/14/9993/2014/
G. Ganbavale et al.: Temperature dependency in aqueous organic solutions 10009
a b
180
190
200
210
220
230
240
250
260
270
280
290
1.0 0.9 0.8 0.7 0.6 0.5 0.4
Wateroactivity,oaw
Te
mp
era
ture
obK
M
180
190
200
210
220
230
240
250
260
270
280
290
1.0 0.9 0.8 0.7 0.6 0.5 0.4Wateroactivity,oa
w
Te
mp
era
ture
obK
M
1,3-propanediol1,5-pentanediol1,2-hexanediolresorcinolsucroseglycolicoacidpyruvicoacidmethoxyaceticoacidsorbitol2-b2-ethoxyethoxyMoethanol2-ethoxyethyloacetateM51,4-butanediola
wbT
hombx
orgMM
awbT
mbx
orgMM
awbT
hombx
orgMM 0.025
awbT
hombx
orgMM 0.05
±
±
Figure 6. Homogeneous freezingThom(xorg) and melting pointsTm(xorg) as a function ofaw for various aqueous organic solutions. Theblue dashed line in(a, b) is the homogeneous ice melting curve(Tm) (Koop and Zobrist, 2009). The black dashed line is the homogeneousice freezing curve(Thom) calculated by shifting the melting curve by1aw = 0.313 (Koop and Zobrist, 2009). The grey dotted line and greydash–dotted lines indicate a deviation of 2.5 and 5 % inaw, respectively. In(a), aw at Thom(xorg) is taken to be equal asaw determinedat Tm(xorg) i.e. with the assumption that there is no significant change inaw with temperature fromTm(xorg) to Thom(xorg). In (b), aw atTm(xorg) is determined using Eq. (3) and the correspondingaw at the freezing temperature is estimated by using Eq. (3) atThom(xorg) witha constant1aw = 0.313 added to theaw value determined on the melting curve.
water activity fromTm(xorg) to Thom(xorg) is the reason forthe apparent discrepancy.
Figure 6b shows the same experimental homogeneousfreezing data, but in contrast to Fig6a, the corresponding wa-ter activities at the freezing temperature are estimated by us-ing Eq. (3) atThom(xorg) with a constant1aw = 0.313 addedto theaw value determined on the melting curve for the samemixture. With this method ofaw data evaluation, the experi-mental data show much less scatter and an outline in good ap-proximation of a single “experimental” freezing curve. Thisfreezing curve described by the ensemble of aqueous organicsolution data is in relatively good agreement with the esti-mated homogeneous freezing curve according toKoop andZobrist (2009). A slight, yet systematic deviation of the ex-perimental data towards higher freezing temperatures/lowerwater activities is found, especially for the freezing temper-atures below 220 K. These deviations may result in signifi-cantly lower values of homogeneous nucleation rate coeffi-cients (Jhom) (Knopf and Rigg, 2011). A change ofaw by0.025 may result in a change ofJhom by six orders of magni-tude, which may significantly affect predictions of the onsetof ice crystal formation in cloud microphysical models. Adifference of three orders of magnitude inJhom could delayor accelerate homogeneous ice nucleation by about an hourin an atmospheric cloud formation simulation as discussed inKnopf and Rigg(2011).
The strong increase ofaw with decreasing temperatureof aqueous M5 and 2-(2-ethoxyethoxy)ethanol solutions atlow temperatures and high solute concentrations has conse-
quences for the hygroscopic growth of these systems at lowtemperatures. First, the water uptake assuming thermody-namic equilibrium between the gas and the condensed phasewill be much smaller. Second, the low water content at theselow temperatures will promote high viscosities or even glassformation leading in addition to kinetic limitations of wateruptake.
5 Conclusions
Water activity measurements for selected atmosphericallyrelevant aqueous organic systems were carried out using dif-ferent experimental techniques with the aim of covering abroad concentration and temperature range. Hygroscopic-ity measurements of single levitated aerosol particles withan electrodynamic balance cover RH between 10 and 90 %RH and temperature from 200 to 300 K. DSC measurementsprovide the melting and freezing point data at various solu-tion concentrations and can be used to derive composition-and temperature-dependent water activities. To complementthese measurements, total gas phase pressure measurementswere performed for aqueous organic mixtures. The measuredaw data obtained from the different experiments are consis-tent with each other and reveal that organic solutes exhibitdiffering water activity temperature dependence; both sub-stantially increasing and decreasingaw values with decreas-ing temperatures below 298 K are observed.
More accurateaw data at low temperatures are needed inthe context of applications of homogeneous ice nucleationtheory at upper tropospheric temperatures. The experiments
www.atmos-chem-phys.net/14/9993/2014/ Atmos. Chem. Phys., 14, 9993–10012, 2014
10010 G. Ganbavale et al.: Temperature dependency in aqueous organic solutions
presented in this study provide new equilibrium data setsuseful for the development and improvement of thermody-namic activity coefficient models, such as UNIFAC (UNI-quac Functional group Activity Coefficients) and AIOMFAC(Aerosol Inorganic–Organic Mixtures Functional groups Ac-tivity Coefficients byZuend et al., 2011). For electrolyte-freeorganic and organic–water mixtures the AIOMFAC modeluses a group-contribution approach based on UNIFAC. Wepresent in a companion paper (Ganbavale et al., 2014) anew, improved parameterisation of AIOMFAC that makes,in addition to published data, use of the data collected inthis study. In turn, improved thermodynamic models can beused for more accurate predictions of the temperature de-pendence of activity coefficients of water and other solutionconstituents, as well as equilibrium compositions of multi-phase systems for mixtures and environmental conditions,for which experimental data are unavailable.
Acknowledgements.This work was supported by the SwissNational Foundation, project 200020-125151 and by the CCESprojects IMBALANCE and OPTIWARES funded by the ETHDomain.
Edited by: D. Knopf
References
Abrams, D. S. and Prausnitz, J. M.: Statistical thermodynamics ofliquid mixtures: a new expression for the excess Gibbs energy ofpartly or completely miscible systems, AIChE J., 21, 116–128,1975.
Baynard, T., Garland, R., Ravishankara, A., Tolbert, M., and Love-joy, E.: Key factors influencing the relative humidity dependenceof aerosol light scattering, Geophys. Res. Lett., 33, L06813,doi:10.1029/2005GL024898, 2006.
Bones, D., Reid, J., Lienhard, D., and Krieger, U.: Comparingthe mechanism of water condensation and evaporation in glassyaerosol, P. Natl. Acad. Sci. USA, 109, 11613–11618, 2012.
Carrico, C., Kus, P., Rood, M., Quinn, P., and Bates, T.: Mixtures ofpollution, dust, sea salt, and volcanic aerosol during ACE-Asia:Radiative properties as a function of relative humidity, J. Geo-phys. Res., 108, 8650, doi:10.1029/2003JD003405, 2003.
Ciobanu, V., Marcolli, C., Krieger, U., Weers, U., and Peter, T.:Liquid- Liquid Phase Separation in Mixed Organic/InorganicAerosol Particles, J. Phys. Chem. A., 113, 10966–10978,doi:10.1021/jp905054d, 2009.
Clegg, S. L., Brimblecombe, P., and Wexler, A. S.: Thermody-namic model of the system H+–NH+
4 –SO2−
4 –NO−
3 –H2O at tro-pospheric temperatures, J. Phys. Chem. A, 102, 2137–2154,1998.
Cziczo, D. J., DeMott, P. J., Brooks, S. D., Prenni, A. J., Thom-son, D. S., Baumgardner, D., Wilson, J. C., and Kreidenweis,S. M.and Murphy, D. M.: Observations of organic species andatmospheric ice formation, Geophys. Res. Lett., 31, L12116,doi:10.1029/2004GL019822, 2004.
DeMott, P. J., Cziczo, D. J., Prenni, A. J., Murphy, D. M., Krei-denweis, S. M., Thomson, D. S., Borys, R., and Rogers, D. C.:
Measurements of the concentration and composition of nuclei forcirrus formation, P. Natl. Acad. Sci., 100, 14655–14660, 2003.
Dormidontova, E. E.: Role of competitive PEO-water and water-water hydrogen bonding in aqueous solution PEO behavior,Macromolecules, 35, 987–1001, 2002.
Dormidontova, E. E.: Influence of end groups on phase behaviorand properties of PEO in aqueous solutions, Macromolecules,37, 7747–7761, 2004.
Fredenslund, A., Jones, R. L., and Prausnitz, J. M.: Group-Contribution Estimation of Activity Coefficients in NonidealLiquid Mixtures, AIChE J., 21, 1086–1099, 1975.
Fuzzi, S., Andreae, M. O., Huebert, B. J., Kulmala, M., Bond, T.C., Boy, M., Doherty, S. J., Guenther, A., Kanakidou, M., Kawa-mura, K., Kerminen, V.-M., Lohmann, U., Russell, L. M., andPöschl, U.: Critical assessment of the current state of scien-tific knowledge, terminology, and research needs concerning therole of organic aerosols in the atmosphere, climate, and globalchange, Atmos. Chem. Phys., 6, 2017–2038, doi:10.5194/acp-6-2017-2006, 2006.
Ganbavale, G., Zuend, A., Marcolli, C., and Peter, T.: Im-proved AIOMFAC model parameterisation of the tempera-ture dependence of activity coefficients for aqueous organicmixtures, Atmos. Chem. Phys. Discuss., 14, 16907–16995,doi:10.5194/acpd-14-16907-2014, 2014.
Jimenez, J. L., Canagaratna, M.R.and Donahue, N. M., Prevot, A.S. H., Zhang, Q., Kroll, J. H., DeCarlo, P. F., Allan, J. D., Coe, H.,Ng, N. L., Aiken, A. C., Docherty, K., Ulbrich, I., Grieshop, A.,Robinson, A. L.and Duplissy, J., Smith, J. D., Wilson, K., Lanz,V. A. Hueglin, C., Sun, Y., Tian, J., Laaksonen, A., Raatikainen,T., Rautiainen, J., Vaattovaara, P., Ehn, M., Kulmala, M., Tom-linson, J. M., Collins, D., Cubison, M., Dunlea, E., Huffman,J., Onasch, T., Alfarra, M., Williams, P., Bower, K., Kondo,Y., Schneider, J., Drewnick, F., Borrmann, S., Weimer, S., De-merjian, K., Salcedo, D., Cottrell, L., Griffin, R., Takami, A.,Miyoshi, T., Hatakeyama, S., Shimono, A., Sun, J. Y., Zhang,Y. M., Dzepina, K., Kimmel, J. R., Sueper, D., Jayne, J. T., Hern-don, S. C., Trimborn, A. M., Williams, L. R., Wood, E., Middle-brook, A. M., Kolb, C., Baltensperger, U., and Worsnop, D. R.:Evolution of organic aerosols in the atmosphere, Science, 326,1525–1529, doi:10.1126/science.1180353, 2009.
Kanakidou, M., Seinfeld, J. H., Pandis, S. N., Barnes, I., Dentener,F. J., Facchini, M. C., Van Dingenen, R., Ervens, B., Nenes, A.,Nielsen, C. J., Swietlicki, E., Putaud, J. P., Balkanski, Y., Fuzzi,S., Horth, J., Moortgat, G. K., Winterhalter, R., Myhre, C. E.L., Tsigaridis, K., Vignati, E., Stephanou, E. G., and Wilson,J.: Organic aerosol and global climate modelling: a review, At-mos. Chem. Phys., 5, 1053–1123, doi:10.5194/acp-5-1053-2005,2005.
Kjellander, R. and Florin, E.: Water structure and changes in ther-mal stability of the system poly (ethylene oxide)–water, J. Chem.Soc., Faraday Trans. 1, 77, 2053–2077, 1981.
Knopf, D. and Rigg, Y.: Homogeneous ice nucleation from aque-ous inorganic/organic particles representative of biomass burn-ing: Water activity, freezing temperatures, nucleation rates, J.Phys. Chem. A, 115, 762–773, doi:10.1021/jp109171g, 2011.
Knopf, D., Luo, B., Krieger, U., and Koop, T.: Thermody-namic dissociation constant of the bisulfate ion from Ramanand ion interaction modeling studies of aqueous sulfuric acid
Atmos. Chem. Phys., 14, 9993–10012, 2014 www.atmos-chem-phys.net/14/9993/2014/
G. Ganbavale et al.: Temperature dependency in aqueous organic solutions 10011
at low temperatures, J. Phys. Chem. A., 107, 4322–4332,doi:10.1021/jp027775+, 2003.
Knopf, D. A. and Alpert, P. A.: A water activity based modelof heterogeneous ice nucleation kinetics for freezing of waterand aqueous solution droplets, Faraday Discuss., 165, 513–534,2013.
Knopf, D. A. and Lopez, M. D.: Homogeneous ice freezing tem-peratures and ice nucleation rates of aqueous ammonium sulfateand aqueous levoglucosan particles for relevant atmospheric con-ditions, Phys. Chem. Chem. Phys., 11, 8056–8068, 2009.
Koop, T.: Homogeneous ice nucleation in water andaqueous solutions, Z. Phys. Chem., 218, 1231–1258,doi:10.1524/zpch.218.11.1231.50812, 2004.
Koop, T. and Zobrist, B.: Parameterizations for ice nucleation inbiological and atmospheric systems, Phys. Chem. Chem. Phys.,11, 10 839–10 850, 2009.
Koop, T., Luo, B., Tsias, A., and Peter, T.: Water activity as the de-terminant for homogeneous ice nucleation in aqueous solutions,Nature, 406, 611–614, doi:10.1038/35020537, 2000.
Krieger, U., Colberg, C., Weers, U., Koop, T., and Peter, T.: Super-cooling of single H2SO4/H2O aerosols to 158 K: No evidencefor the occurrence of the octrahydrate, Geophys. Res. Lett, 27,2097–2100, doi:10.1029/2000GL011613, 2000.
Krieger, U. K., Marcolli, C., and Reid, J. P.: Exploring the com-plexity of aerosol particle properties and processes using singleparticle techniques, Chem. Soc. Rev., 41, 6631–6662, 2012.
Lohmann, J., Joh, R., and Gmehling, J.: From UNIFAC to modi-fied UNIFAC (Dortmund), Ind. Eng. Chem. Res., 40, 957–964,doi:10.1021/ie0005710, 2001.
Marcolli, C. and Krieger, U. K.: Phase changes during hygro-scopic cycles of mixed organic/inorganic model systems oftropospheric aerosols, J. Phys. Chem. A, 110, 1881–1893,doi:10.1021/jp0556759, 2006.
Marcolli, C. and Peter, T.: Water activity in polyol/water systems:new UNIFAC parameterization, Atmos. Chem. Phys., 5, 1545–1555, doi:10.5194/acp-5-1545-2005, 2005.
Marcolli, C., Luo, B. P., Peter, T., and Wienhold, F. G.: Inter-nal mixing of the organic aerosol by gas phase diffusion ofsemivolatile organic compounds, Atmos. Chem. Phys., 4, 2593–2599, doi:10.5194/acp-4-2593-2004, 2004.
Mikhailov, E., Vlasenko, S., Martin, S., Koop, T., and Pöschl, U.:Amorphous and crystalline aerosol particles interacting with wa-ter vapor: conceptual framework and experimental evidence forrestructuring, phase transitions and kinetic limitations, Atmos.Chem. Phys, 9, 9491–9522, 2009.
Ming, Y. and Russell, L.: Thermodynamic equilibrium of organic-electrolyte mixtures in aerosol particles, AIChE J., 48, 1331–1348, doi:10.1002/aic.690480619, 2002.
Murata, K.-i. and Tanaka, H.: General nature of liquid–liquid tran-sition in aqueous organic solutions, Nat. Commun., 4, 1–8, 2013.
Murphy, D. and Koop, T.: Review of the vapour pressures of ice andsupercooled water for atmospheric applications, Q. J. R. Meteo-rol. Soc., 131, 1539–1565, doi:10.1256/qj.04.94, 2005.
Murphy, D., Cziczo, D., Froyd, K., Hudson, P., Matthew, B.,Middlebrook, A., Peltier, R., Sullivan, A., Thomson, D.,and Weber, R.: Single-particle mass spectrometry of tropo-spheric aerosol particles, J. Geophys. Res., 111, D23S32,doi:10.1029/2006JD007340, 2006.
Murphy, D., Cziczo, D., Hudson, P., and Thomson, D.: Car-bonaceous material in aerosol particles in the lower strato-sphere and tropopause region, J. Geophys. Res., 112, D04203,doi:10.1029/2006JD007297, 2007.
Novakov, T., Hegg, D., and Hobbs, P.: Airborne measurements ofcarbonaceous aerosols on the East Coast of the United States,J. Geophys. Res., 102, 30023–30030, doi:10.1029/97JD02793,1997.
Peter, T., Marcolli, C., Spichtinger, P., Corti, T., Baker, M. B., andKoop, T.: When dry air is too humid, Science, 314, 1399–1402,2006.
Reid, J., Dennis-Smither, B., Miles, R., Hanford, K., and Homer, C.:The morphology of aerosol particles consisting of hydrophobicand hydrophilic phases: hydrocarbons, alcohols and fatty acidsas the hydrophobic component, Phys. Chem. Chem. Phys., 13,15559–15572, doi:10.1039/c1cp21510h, 2011.
Roberts, G., Artaxo, P., Zhou, J., Swietlicki, E., and Andreae, M.:Sensitivity of CCN spectra on chemical and physical propertiesof aerosol: A case study from the Amazon Basin, J. Geophys.Res., 107, 8070, doi:10.1029/2001JD000583, 2002.
Rodebush, W.: The freezing points of concentrated solutions and thefree energy of solutions of salts., J. Am. Chem. Soc., 40, 1204–1213, doi:10.1021/ja02241a008, 1918.
Salabat, A.: Liquid–liquid equilibrium in the ternary systems tri-ethylene glycol+ salts+ water at different temperatures: Experi-mental determination and correlation, Fluid Phase Equilibr., 288,63–66, 2010.
Saxena, P. and Hildemann, L.: Water-soluble organics in atmo-spheric particles: A critical review of the literature and appli-cation of thermodynamics to identify candidate compounds, J.Atmos. Chem., 24, 57–109, 1996.
Saxena, P. and Hildemann, L. M.: Water absorption by organics:Survey of laboratory evidence and evaluation of UNIFAC for es-timating water activity, Environ. Sci. Technol., 31, 3318–3324,1997.
Song, M., Marcolli, C., Krieger, U., Zuend, A., and Peter, T.:Liquid-liquid phase separation and morphology of internallymixed dicarboxylic acids/ammonium sulfate/water particles, At-mos. Chem. Phys., 12, 2691–2712, doi:10.5194/acp-12-2691-2012, 2012.
Tang, I. and Munkelwitz, H.: Composition and temperature depen-dence of the deliquescence properties of hygroscopic aerosols,Atmos. Environ. Part A, 27, 467–473, 1993.
Yamasoe, M., Artaxo, P., Miguel, A., and Allen, A.: Chemical com-position of aerosol particles from direct emissions of vegetationfires in the Amazon Basin: water-soluble species and trace ele-ments, Atmos. Environ., 34, 1641–1653, 2000.
Zieger, P., Fierz-Schmidhauser, R., Weingartner, E., and Bal-tensperger, U.: Effects of relative humidity on aerosol light scat-tering: results from different European sites, Atmos. Chem. Phys,13, 10609–10631, 2013.
Zobrist, B., Weers, U., and Koop, T.: Ice nucleation in aqueous so-lutions of poly [ethylene glycol] with different molar mass, J.Chem. Phys., 118, 10254, doi:10.1063/1.1571818, 2003.
Zobrist, B., Marcolli, C., Pedernera, D. A., and Koop, T.: Do atmo-spheric aerosols form glasses?, Atmos. Chem. Phys., 8, 5221–5244, doi:10.5194/acp-8-5221-2008, 2008.
www.atmos-chem-phys.net/14/9993/2014/ Atmos. Chem. Phys., 14, 9993–10012, 2014
10012 G. Ganbavale et al.: Temperature dependency in aqueous organic solutions
Zobrist, B., Soonsin, V., Luo, B., Krieger, U., Marcolli, C., Pe-ter, T., and Koop, T.: Ultra-slow water diffusion in aqueoussucrose glasses, Phys. Chem. Chem. Phys., 13, 3514–3526,doi:10.1039/c0cp01273d, 2011.
Zuend, A., Marcolli, C., Booth, A. M., Lienhard, D. M., Soonsin, V.,Krieger, U. K., Topping, D. O., McFiggans, G., Peter, T., and Se-infeld, J. H.: New and extended parameterization of the thermo-dynamic model AIOMFAC: calculation of activity coefficientsfor organic-inorganic mixtures containing carboxyl, hydroxyl,carbonyl, ether, ester, alkenyl, alkyl, and aromatic 25 functionalgroups, Atmos. Chem. Phys., 11, 9155–9206, doi:10.5194/acp-11-9155-2011, 2011.
Atmos. Chem. Phys., 14, 9993–10012, 2014 www.atmos-chem-phys.net/14/9993/2014/