Embed Size (px)
Citation preview
Digest 2008, December 2008 1263-1279
Experimental Determination and Numerical Analysis of Vertical Stresses under Square Footings Resting on Sand†1 M. Salih KESKİN* Mustafa LAMAN** Tarık BARAN*** ABSTRACT
In this study, the vertical stress values occurring under the center line of uniformly loaded square footings were investigated experimentally and analytically. The results of the study were compared with the results obtained from the Boussinesq method. Tests were performed in a square shaped test box and a pressure transducer was used to measure the stresses. In the numerical analysis, soil was modeled using the finite element method with two dimensional axi-symmetric and three dimensional conditions as linear elastic and non-linear elasto-plastic materials and the effect of these models on the vertical stress values was investigated. Finally, a general agreement was observed between the experimental, numerical and theoretical results for the values obtained for predetermined depths of sand and the obtained results are discussed. Keywords: Sand, stress, square footing, finite elements
1. INTRODUCTION
The self weight of the soil layers and applied external loads create stresses within the soil. The estimation of stress distribution in soil is quite important for the solution of a wide variety of geotechnical problems and design of foundations. The stress distribution in soil depends on the value of the applied load, the dimensions of the loaded area and the properties of the soil.
Due to the complexity of the soil medium, it is quite difficult to perform realistic stress-deformation analyses [1]. The problem of stress increment in soil is generally predicted with the theory of elasticity, which assumes that stress is proportional to strain and the soil is a linearly elastic half space. In these solutions vertical stress distributions are independent from the material properties. Furthermore, the type of soil and parameters like density can not be considered and the same stress distributions are obtained for different types of soils [2]. However, the experimental and numerical studies show that, stress distribution in granular soils varies significiantly, especially depending on the soil density [3]. For that * Çukurova University, Adana, Turkey - [email protected] ∗∗ Çukurova University, Adana, Turkey - [email protected] ∗∗∗ Çukurova University, Adana, Turkey - [email protected] † Published in Teknik Dergi Vol. 19, No. 4 October 2008, pp: 4521-4538
Experimental Determination and Numerical Analysis …
1264
reason, it is necessary to find the vertical stress values experimentally and to compare the results with numerical and theoretical solutions.
In this study, the vertical stress values that occur under square footings resting on sand were investigated experimentally and numerically and the results were compared with the results of the Boussinesq method. Experimental studies were conducted in a square shaped test box and a pressure transducer was used to measure stress values. In the numerical analyses, soil was modeled with two dimensional (2D) axi-symmetrical and three dimensional (3D) conditions as a linear elastic and a non-linear elasto-plastic material and also the effects of these model assumptions on the vertical stress values were investigated.
2. PREVIOUS STUDIES
To determine vertical stresses within soils, experimental set ups and techniques were developed, besides many theoretical solutions based on theory of elasticity have been presented in the literature.
Koegler’s [4] study is probably as one of the first experimental studies on determination of stress values within soils. In this study, laboratory model tests were performed to obtain the stress distribution in sandy soils. For this purpose, a sand fill was loaded and stresses at particular depths of horizontal planes were measured with instruments placed at measurement depths. Koegler [4] compared the results obtained from this experimental study with theoretical solutions and indicated that vertical stress distributions obtained from the experimental study beneath the loaded areas were in good agreement with the predictions of the Boussinesq [5] equations [6].
Burland et al. [7] examined the effects of non-linearity, non-homogeneity and anisotropy and concluded that for different soil conditions the Boussinesq equations gave a reasonably accurate distribution of the vertical stress changes produced by a loaded area [6].
Vertical stresses measured in model footing tests on granular soils were summarized by Morgan and Gerard [8] and found to be in reasonable agreement with those predicted using the theory of elasticity.
The estimation of the values and distributions of the stresses within the soil created by various applied loads is one of the classical problems of soil mechanics and has been a point of interest in many investigations for many years [5, 9-16].
One of the most frequently used and practical equation using the theory of elasticity is the Boussinesq [5] solution. Boussinesq [5] solved the stress problem by a point load acting at the surface in a linearly elastic, homogeneous, isotropic half space. This problem is one of the most studied problems in soil mechanics and predicting the stress increment in soils is known as a Boussinesq problem [17]. According to this solution, vertical stress value, ∆σz due to a point load, Q at any vertical depth of z and at a point of horizontal distance of r is given by Equation (1).
2
25
2z zQ
)z/r(11
23
+
=π
σ∆ (1)
M. Salih KESKİN, Mustafa LAMAN, Tarık BARAN
1265
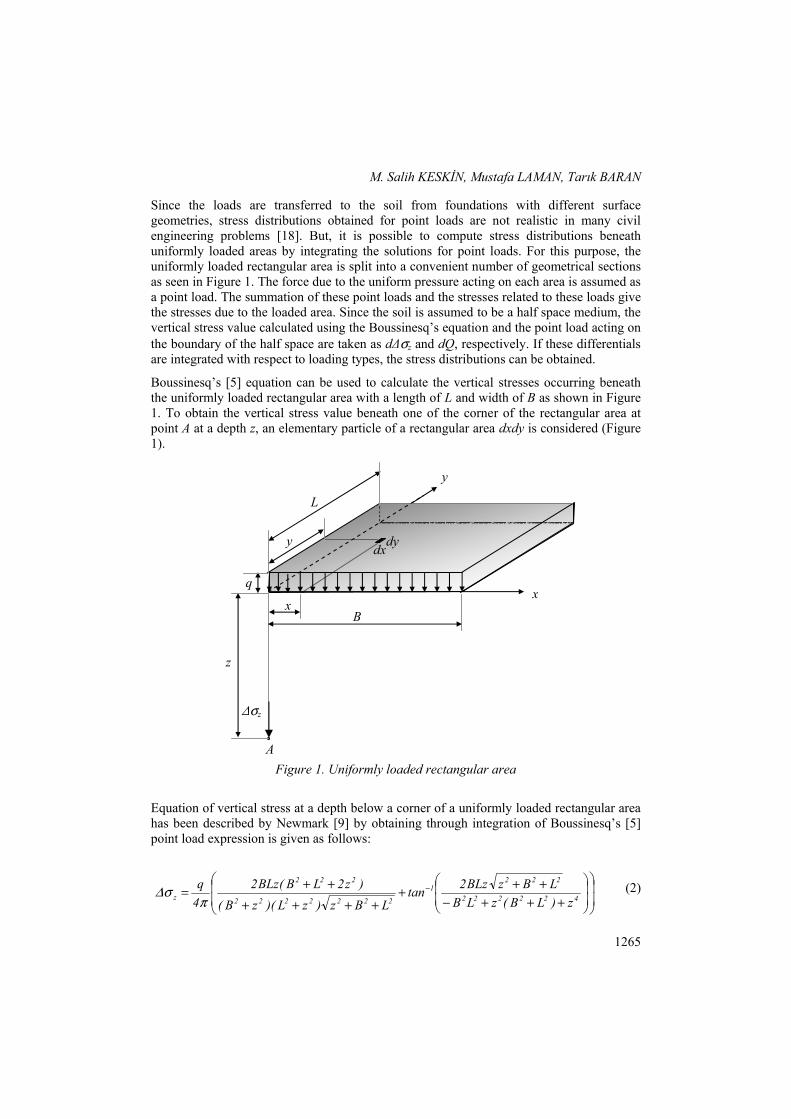
Since the loads are transferred to the soil from foundations with different surface geometries, stress distributions obtained for point loads are not realistic in many civil engineering problems [18]. But, it is possible to compute stress distributions beneath uniformly loaded areas by integrating the solutions for point loads. For this purpose, the uniformly loaded rectangular area is split into a convenient number of geometrical sections as seen in Figure 1. The force due to the uniform pressure acting on each area is assumed as a point load. The summation of these point loads and the stresses related to these loads give the stresses due to the loaded area. Since the soil is assumed to be a half space medium, the vertical stress value calculated using the Boussinesq’s equation and the point load acting on the boundary of the half space are taken as d∆σz and dQ, respectively. If these differentials are integrated with respect to loading types, the stress distributions can be obtained.
Boussinesq’s [5] equation can be used to calculate the vertical stresses occurring beneath the uniformly loaded rectangular area with a length of L and width of B as shown in Figure 1. To obtain the vertical stress value beneath one of the corner of the rectangular area at point A at a depth z, an elementary particle of a rectangular area dxdy is considered (Figure 1).
Figure 1. Uniformly loaded rectangular area
Equation of vertical stress at a depth below a corner of a uniformly loaded rectangular area has been described by Newmark [9] by obtaining through integration of Boussinesq’s [5] point load expression is given as follows:
+++−+++
++++++= −
422222
2221
2222222
222
z z)LB(zLBLBzBLz2tan
LBz)zL)(zB()z2LB(BLz2
4qπ
σ∆ (2)
B
z
A
∆σz
x
q x
L
y
y
dydx
Experimental Determination and Numerical Analysis …
1266
The vertical stress at a point in or out of a uniformly loaded rectangular area can be calculated from Equation (2) by applying the principle of superposition.
Westergaard [10], suggested Equation (3) to obtain the vertical stress value below a uniformly loaded rectangular area.
−−+
+
−−= −
22
2
221
z nm1
2221
n1
m1
2221cot
21q
µµ
µµ
πσ∆ (3)
where µ is the Poissons ratio, m and n are geometrical coefficients.
3. EXPERIMENTAL STUDY
The experimental study involves the measurement of vertical stress values that occur due to loading of a footing plate located on sand, along the centerline of a square footing at various depths of the sandy soil.
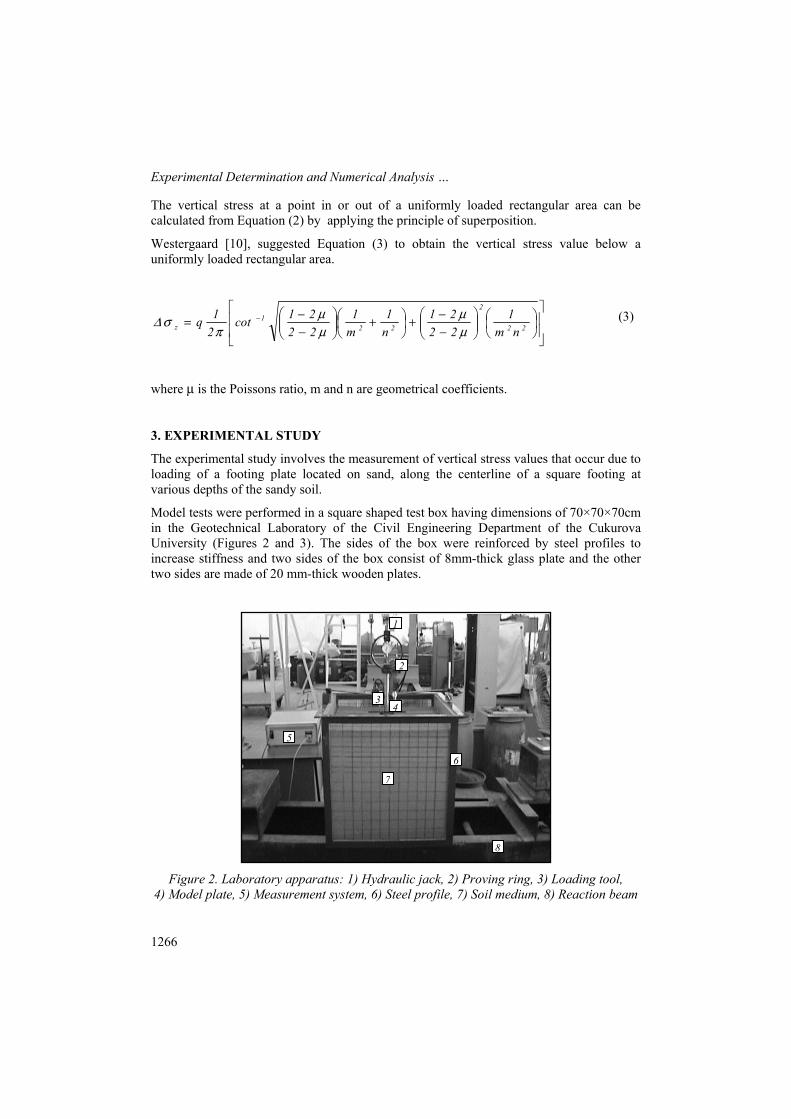
Model tests were performed in a square shaped test box having dimensions of 70×70×70cm in the Geotechnical Laboratory of the Civil Engineering Department of the Cukurova University (Figures 2 and 3). The sides of the box were reinforced by steel profiles to increase stiffness and two sides of the box consist of 8mm-thick glass plate and the other two sides are made of 20 mm-thick wooden plates.
Figure 2. Laboratory apparatus: 1) Hydraulic jack, 2) Proving ring, 3) Loading tool,
4) Model plate, 5) Measurement system, 6) Steel profile, 7) Soil medium, 8) Reaction beam
1
2
7
5
8
6
34
M. Salih KESKİN, Mustafa LAMAN, Tarık BARAN
1267
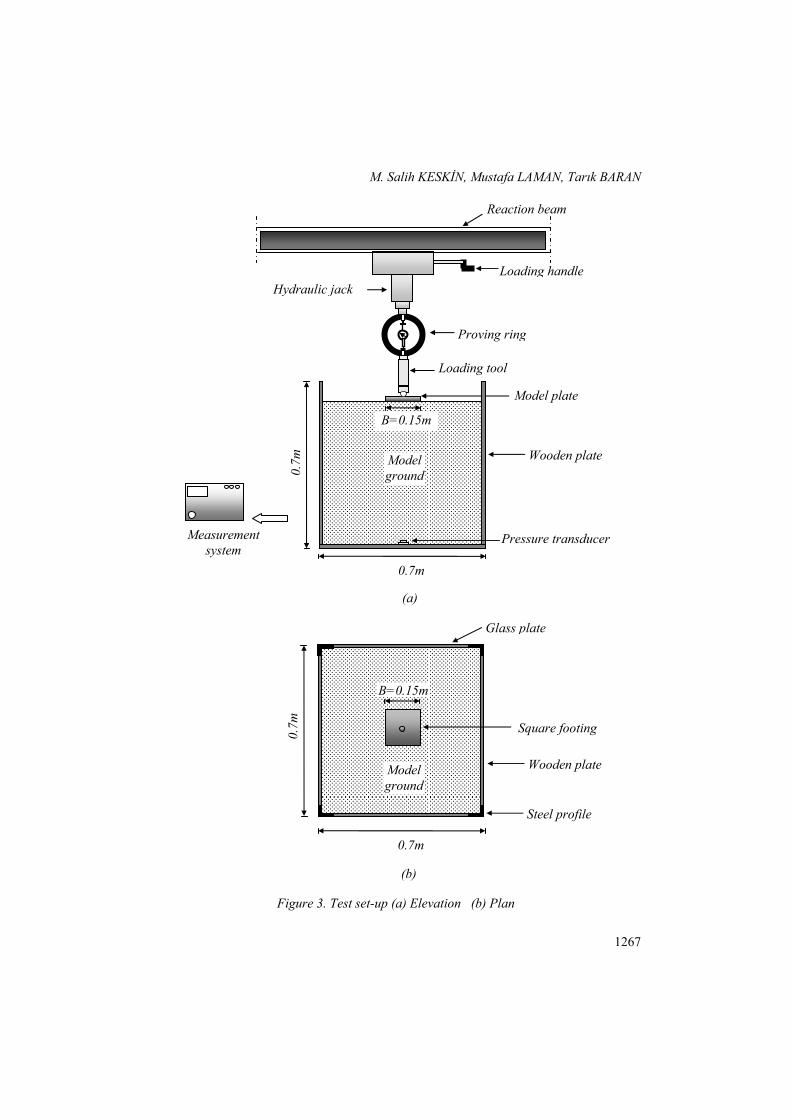
Figure 3. Test set-up (a) Elevation (b) Plan
0.7m
0.7m
Pressure transducer
Loading handle Hydraulic jack
Proving ring
Reaction beam
Measurement system
Wooden plate
Model plate
(a)
Model ground
B=0.15m
Loading tool
Glass plate
Model ground
B=0.15m
Square footing
Wooden plate
Steel profile
0.7m
0.7m
(b)
Experimental Determination and Numerical Analysis …
1268
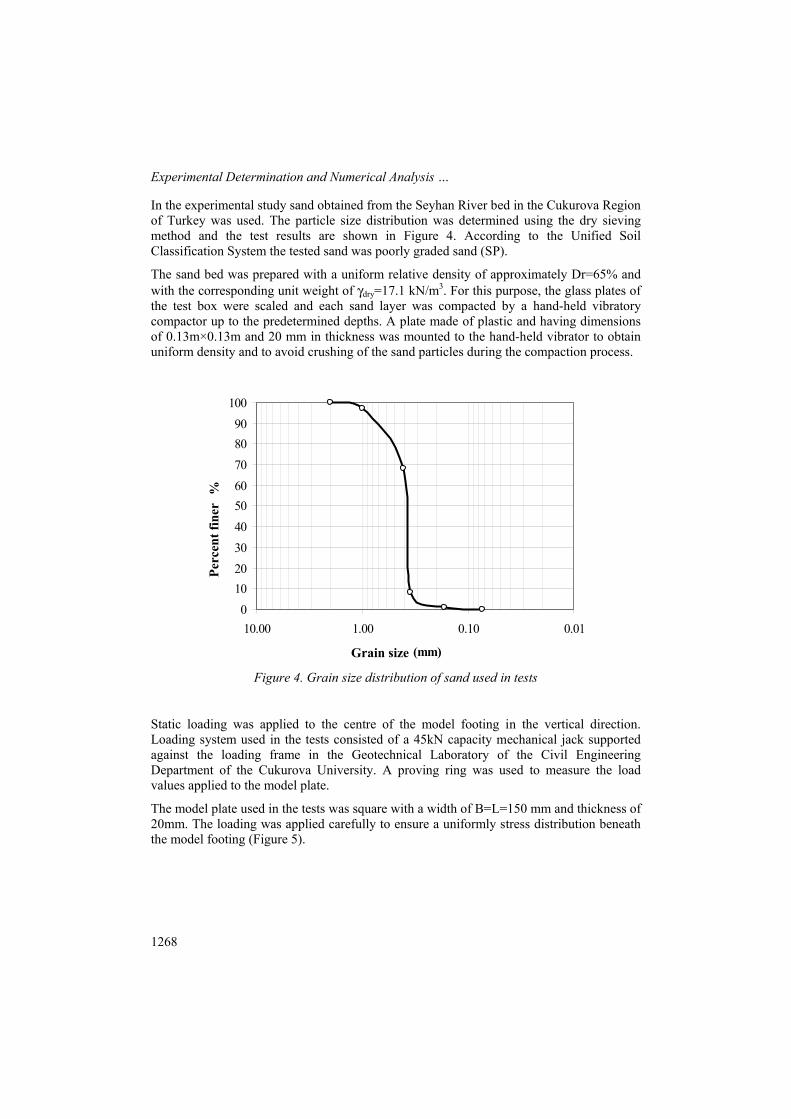
In the experimental study sand obtained from the Seyhan River bed in the Cukurova Region of Turkey was used. The particle size distribution was determined using the dry sieving method and the test results are shown in Figure 4. According to the Unified Soil Classification System the tested sand was poorly graded sand (SP).
The sand bed was prepared with a uniform relative density of approximately Dr=65% and with the corresponding unit weight of γdry=17.1 kN/m3. For this purpose, the glass plates of the test box were scaled and each sand layer was compacted by a hand-held vibratory compactor up to the predetermined depths. A plate made of plastic and having dimensions of 0.13m×0.13m and 20 mm in thickness was mounted to the hand-held vibrator to obtain uniform density and to avoid crushing of the sand particles during the compaction process.
Figure 4. Grain size distribution of sand used in tests
Static loading was applied to the centre of the model footing in the vertical direction. Loading system used in the tests consisted of a 45kN capacity mechanical jack supported against the loading frame in the Geotechnical Laboratory of the Civil Engineering Department of the Cukurova University. A proving ring was used to measure the load values applied to the model plate.
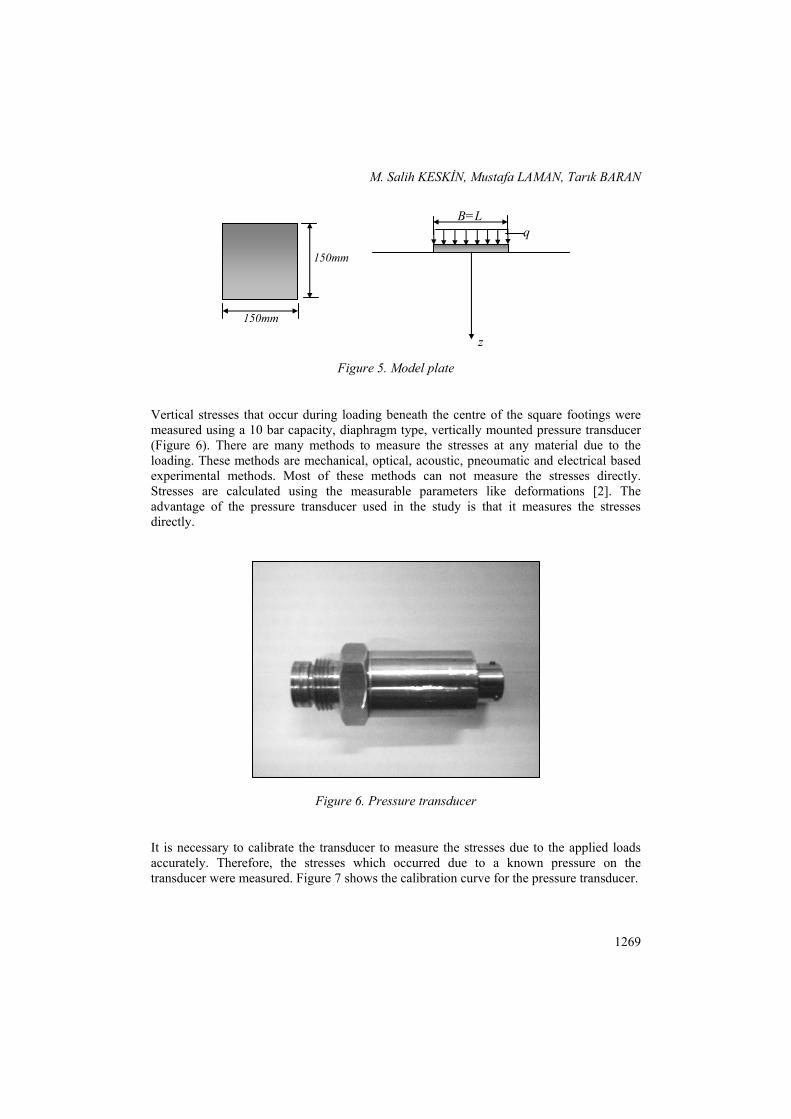
The model plate used in the tests was square with a width of B=L=150 mm and thickness of 20mm. The loading was applied carefully to ensure a uniformly stress distribution beneath the model footing (Figure 5).
0102030405060708090
100
0.010.101.0010.00
Çap (mm)
Geç
en %
Grain size
Perc
ent f
iner
M. Salih KESKİN, Mustafa LAMAN, Tarık BARAN
1269
Figure 5. Model plate
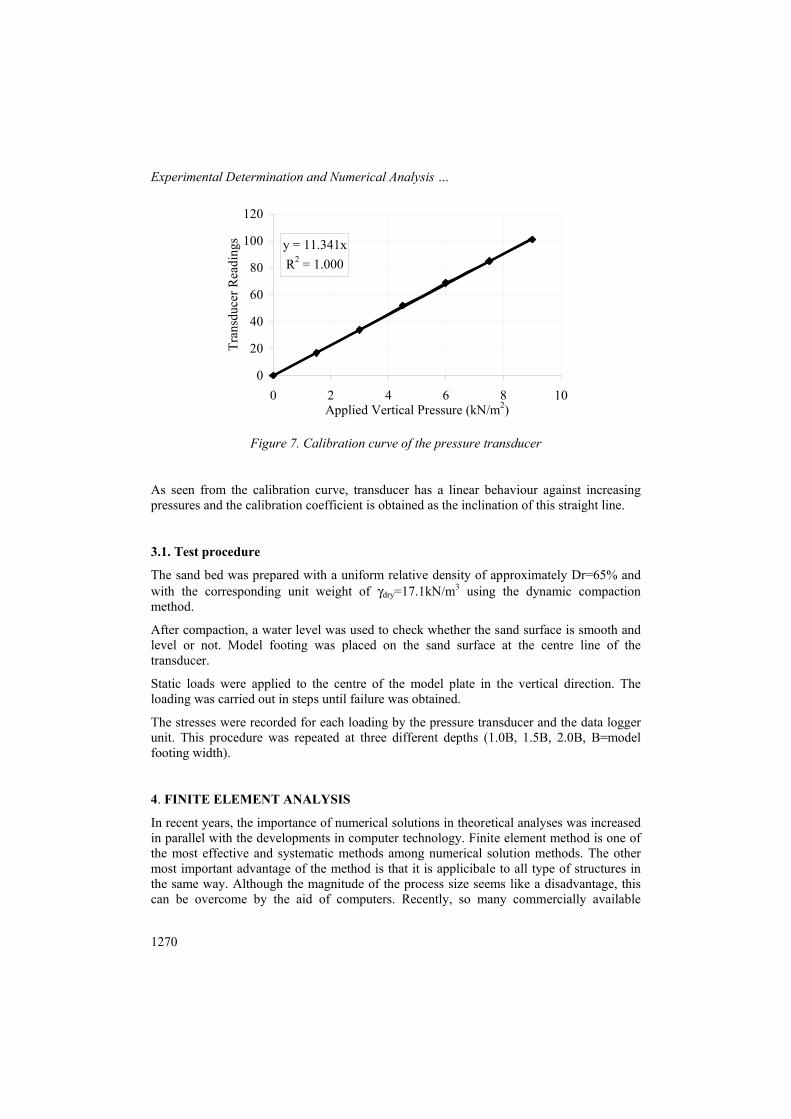
Vertical stresses that occur during loading beneath the centre of the square footings were measured using a 10 bar capacity, diaphragm type, vertically mounted pressure transducer (Figure 6). There are many methods to measure the stresses at any material due to the loading. These methods are mechanical, optical, acoustic, pneoumatic and electrical based experimental methods. Most of these methods can not measure the stresses directly. Stresses are calculated using the measurable parameters like deformations [2]. The advantage of the pressure transducer used in the study is that it measures the stresses directly.
Figure 6. Pressure transducer
It is necessary to calibrate the transducer to measure the stresses due to the applied loads accurately. Therefore, the stresses which occurred due to a known pressure on the transducer were measured. Figure 7 shows the calibration curve for the pressure transducer.
150mm
150mm
B=Lq
z
Experimental Determination and Numerical Analysis …
1270
y = 11.341xR2 = 1.000
0
20
40
60
80
100
120
0 2 4 6 8 10Applied Vertical Pressure (kN/m2)
Tran
sduc
er R
eadi
ngs
Figure 7. Calibration curve of the pressure transducer
As seen from the calibration curve, transducer has a linear behaviour against increasing pressures and the calibration coefficient is obtained as the inclination of this straight line.
3.1. Test procedure
The sand bed was prepared with a uniform relative density of approximately Dr=65% and with the corresponding unit weight of γdry=17.1kN/m3 using the dynamic compaction method.
After compaction, a water level was used to check whether the sand surface is smooth and level or not. Model footing was placed on the sand surface at the centre line of the transducer.
Static loads were applied to the centre of the model plate in the vertical direction. The loading was carried out in steps until failure was obtained.
The stresses were recorded for each loading by the pressure transducer and the data logger unit. This procedure was repeated at three different depths (1.0B, 1.5B, 2.0B, B=model footing width).
4. FINITE ELEMENT ANALYSIS
In recent years, the importance of numerical solutions in theoretical analyses was increased in parallel with the developments in computer technology. Finite element method is one of the most effective and systematic methods among numerical solution methods. The other most important advantage of the method is that it is applicibale to all type of structures in the same way. Although the magnitude of the process size seems like a disadvantage, this can be overcome by the aid of computers. Recently, so many commercially available
M. Salih KESKİN, Mustafa LAMAN, Tarık BARAN
1271
computer programs which give adequately accurate results based on the finite element method like ANSYS were developed. ANSYS is a computer program which is designed to analyse many engineering problems using the finite element method.
The finite element studies of the stress distribution of square footings resting on a sand bed were carried out using the program ANSYS (Version 10). In the program, problems can be analysed in 2D and 3D, as linear and non-linear material under static and dynamic loads. In the Linear Elastic Model, the soil was assumed to be isotropic and linearly elastic (Hooke’s law). Input parameters are Young’s modulus (E) and Poisson’s ratio (µ) in the model. Another model called Drucker-Prager which is an elasto-plastic non-linear material model was also used to simulate the behaviour of granular soil material. Input parameters are Young’s modulus (E), Poisson’s ratio (µ), the cohesion (c), internal friction angle (φ) and dilatation angle (ψ) in this model.
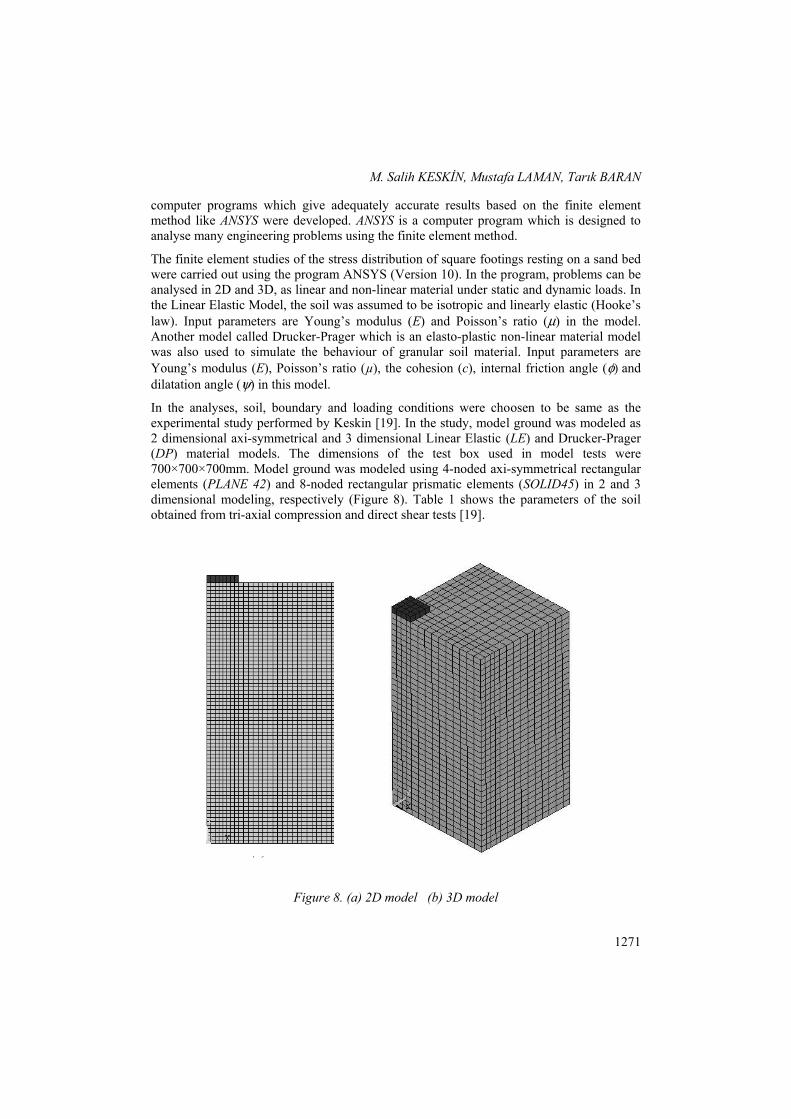
In the analyses, soil, boundary and loading conditions were choosen to be same as the experimental study performed by Keskin [19]. In the study, model ground was modeled as 2 dimensional axi-symmetrical and 3 dimensional Linear Elastic (LE) and Drucker-Prager (DP) material models. The dimensions of the test box used in model tests were 700×700×700mm. Model ground was modeled using 4-noded axi-symmetrical rectangular elements (PLANE 42) and 8-noded rectangular prismatic elements (SOLID45) in 2 and 3 dimensional modeling, respectively (Figure 8). Table 1 shows the parameters of the soil obtained from tri-axial compression and direct shear tests [19].
(a) (b)
Figure 8. (a) 2D model (b) 3D model
Experimental Determination and Numerical Analysis …
1272
Table 1. Model parameters for tested sand
Parameters Symbol Unit Value
Young’s modulus E kN/m2 28000
Cohesion c kN/m2 0
Internal friction angle φ (˚) 41
Dilatation angle ψ (˚) 11
Poisson’s ratio µ - 0.20
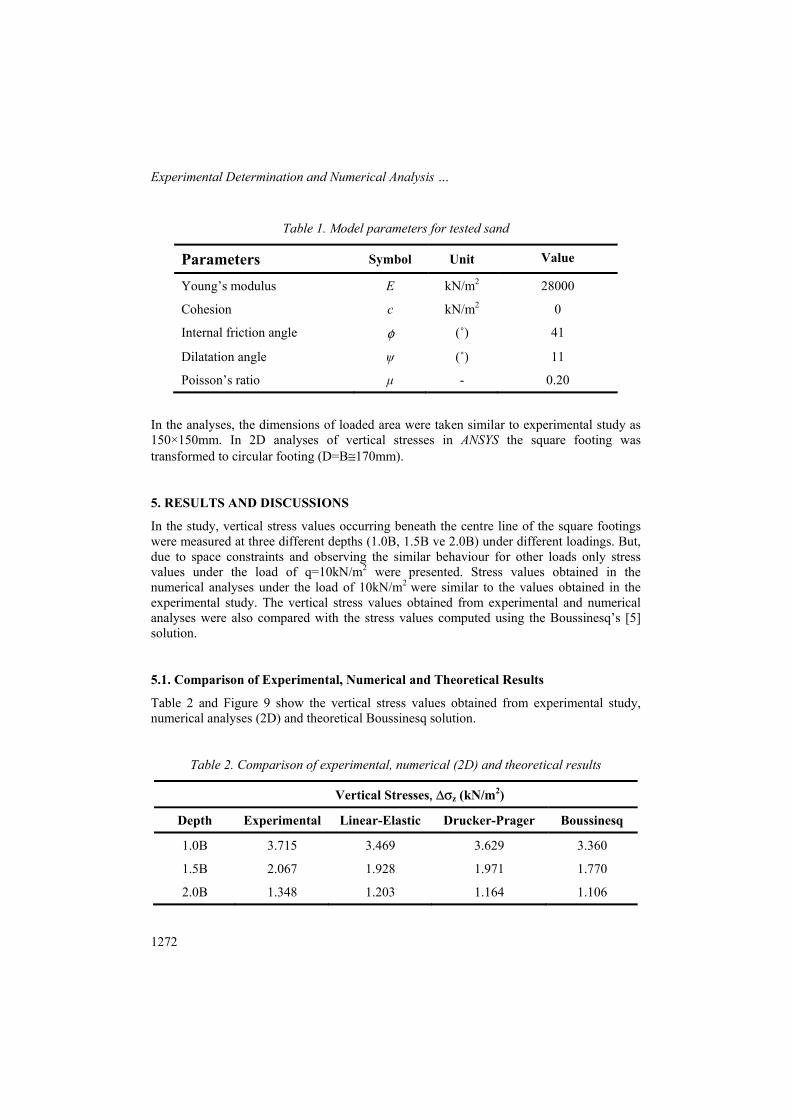
In the analyses, the dimensions of loaded area were taken similar to experimental study as 150×150mm. In 2D analyses of vertical stresses in ANSYS the square footing was transformed to circular footing (D=B≅170mm).
5. RESULTS AND DISCUSSIONS
In the study, vertical stress values occurring beneath the centre line of the square footings were measured at three different depths (1.0B, 1.5B ve 2.0B) under different loadings. But, due to space constraints and observing the similar behaviour for other loads only stress values under the load of q=10kN/m2 were presented. Stress values obtained in the numerical analyses under the load of 10kN/m2 were similar to the values obtained in the experimental study. The vertical stress values obtained from experimental and numerical analyses were also compared with the stress values computed using the Boussinesq’s [5] solution.
5.1. Comparison of Experimental, Numerical and Theoretical Results
Table 2 and Figure 9 show the vertical stress values obtained from experimental study, numerical analyses (2D) and theoretical Boussinesq solution.
Table 2. Comparison of experimental, numerical (2D) and theoretical results
Vertical Stresses, ∆σz (kN/m2)
Depth Experimental Linear-Elastic Drucker-Prager Boussinesq
1.0B 3.715 3.469 3.629 3.360
1.5B 2.067 1.928 1.971 1.770
2.0B 1.348 1.203 1.164 1.106
M. Salih KESKİN, Mustafa LAMAN, Tarık BARAN
1273
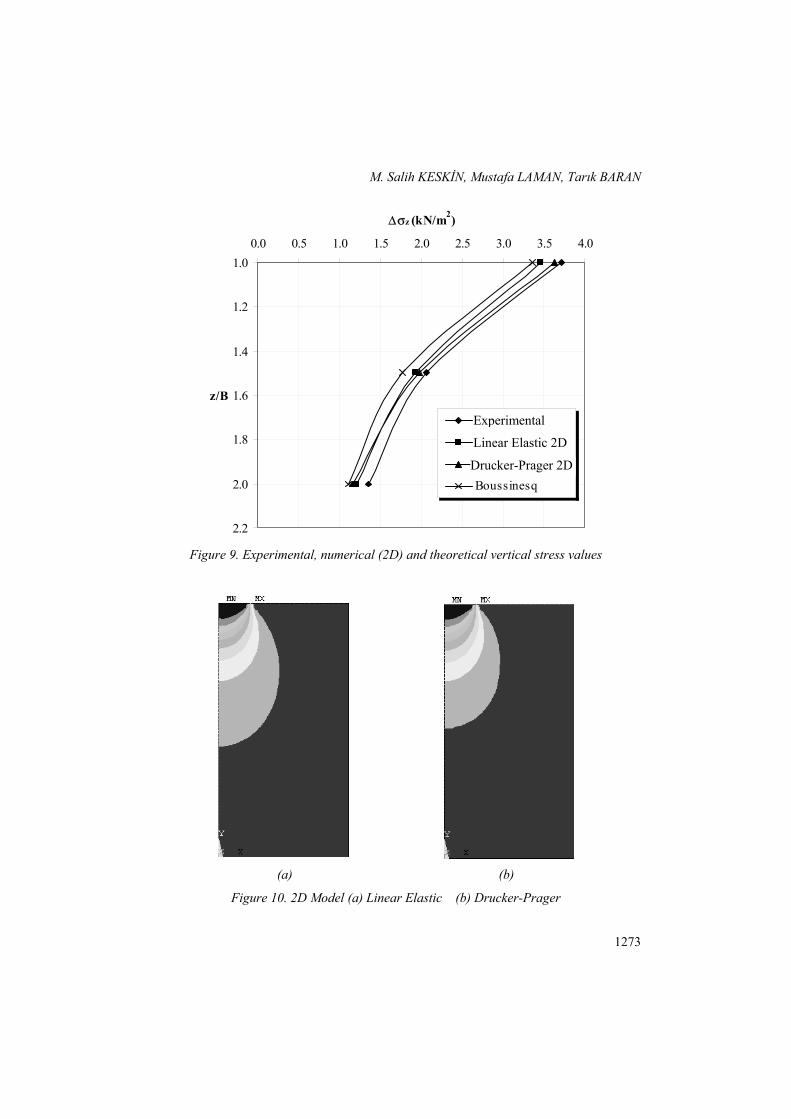
Figure 9. Experimental, numerical (2D) and theoretical vertical stress values
(a) (b)
Figure 10. 2D Model (a) Linear Elastic (b) Drucker-Prager
1.0
1.2
1.4
1.6
1.8
2.0
2.2
0.0 0.5 1.0 1.5 2.0 2.5 3.0 3.5 4.0
∆σz (kN/m2)
z/B
Deneysel
Lineer Elastik 2D
Drucker-Prager 2D
Boussinesq
Experimental
Linear Elastic 2D
Drucker-Prager 2D
Experimental Determination and Numerical Analysis …
1274
It can be seen that experimental results are in good agreement with numerical and theoretical results. It is only 14% and 18% greater than those obtained from numerical and theoretical studies, respectively. Experimental results are much closer to Drucker-Prager results at depths of 1.0B and 1.5B than those obtained from 2D Linear Elastic and Boussinesq model while it is much closer to the 2D Linear Elastic model at depth of 2.0B comparing to the others. Boussinesq’s solution also gives smaller values than numerical and experimental studies. Although there are no great differences between 2D Linear Elastic and Drucker-Prager results, it is a disadvantage for the 2D Linear Elastic Model that it doesn’t give the failure load. Therefore, it can be said that the Drucker-Prager Model is reflecting better the behaviour of soil. Figure 10 shows the stress distribution obtained from finite element analysis for Linear Elastic and Drucker-Prager models.
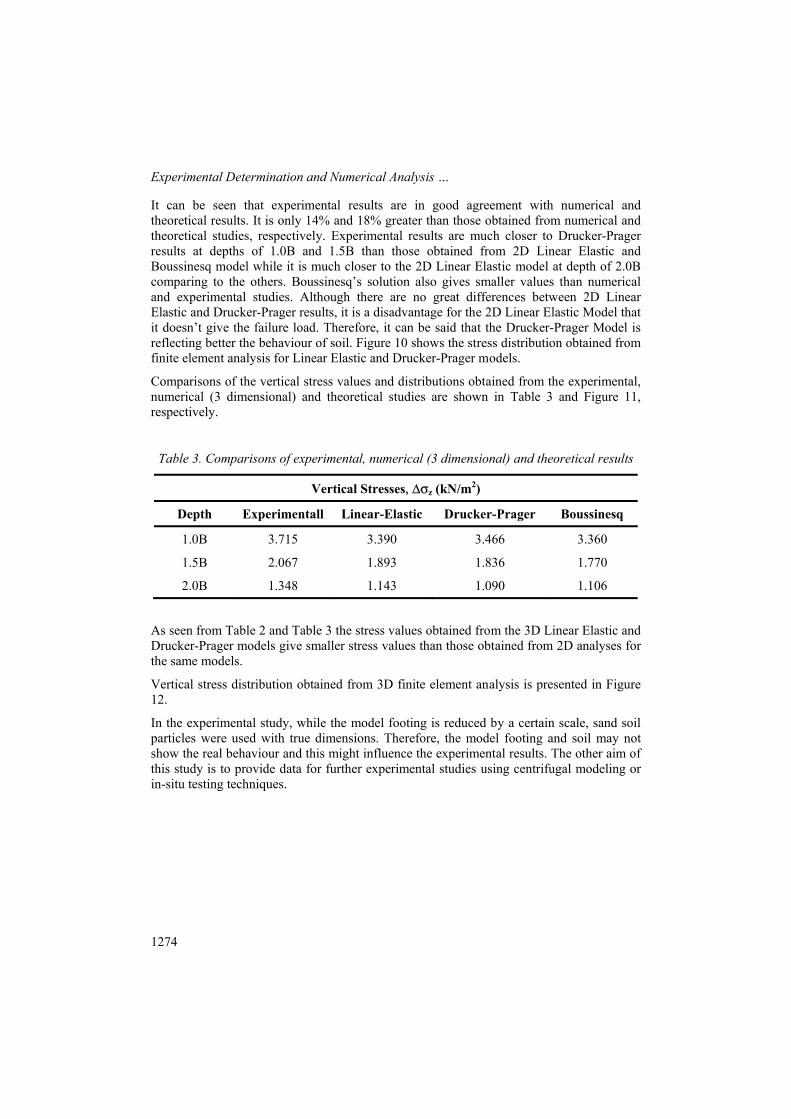
Comparisons of the vertical stress values and distributions obtained from the experimental, numerical (3 dimensional) and theoretical studies are shown in Table 3 and Figure 11, respectively.
Table 3. Comparisons of experimental, numerical (3 dimensional) and theoretical results
Vertical Stresses, ∆σz (kN/m2)
Depth Experimentall Linear-Elastic Drucker-Prager Boussinesq
1.0B 3.715 3.390 3.466 3.360
1.5B 2.067 1.893 1.836 1.770
2.0B 1.348 1.143 1.090 1.106
As seen from Table 2 and Table 3 the stress values obtained from the 3D Linear Elastic and Drucker-Prager models give smaller stress values than those obtained from 2D analyses for the same models.
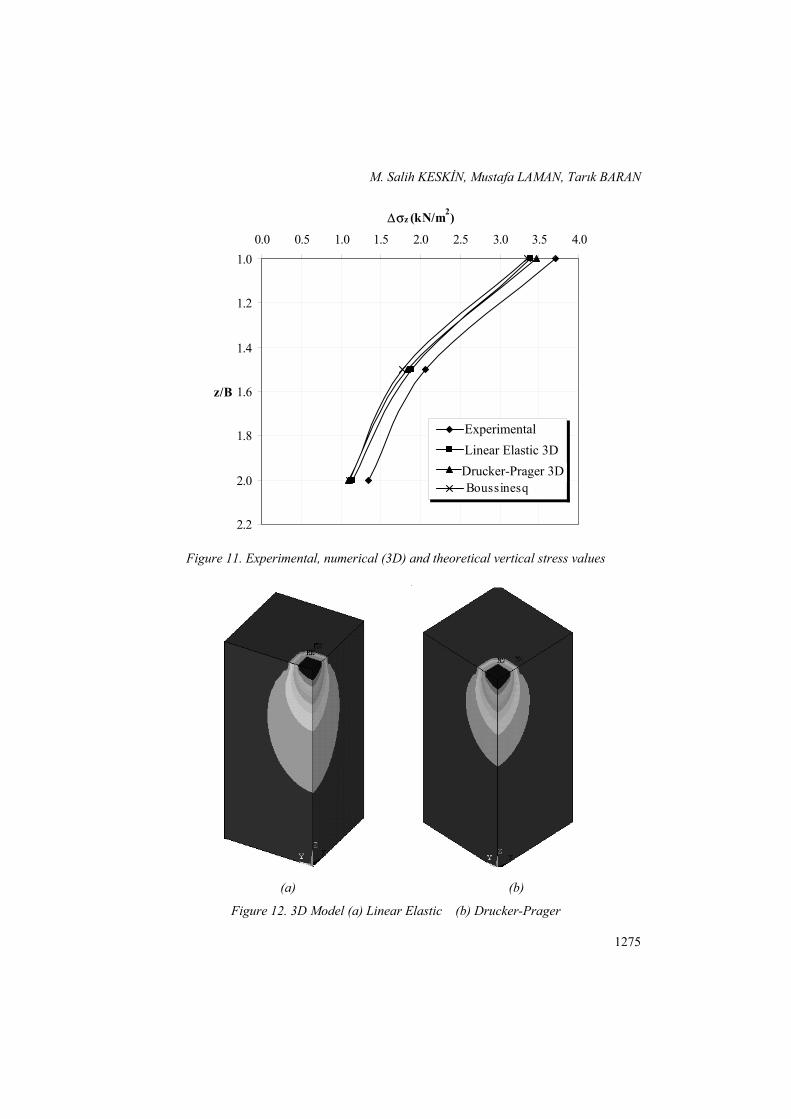
Vertical stress distribution obtained from 3D finite element analysis is presented in Figure 12.
In the experimental study, while the model footing is reduced by a certain scale, sand soil particles were used with true dimensions. Therefore, the model footing and soil may not show the real behaviour and this might influence the experimental results. The other aim of this study is to provide data for further experimental studies using centrifugal modeling or in-situ testing techniques.
M. Salih KESKİN, Mustafa LAMAN, Tarık BARAN
1275
Figure 11. Experimental, numerical (3D) and theoretical vertical stress values
(a) (b)
Figure 12. 3D Model (a) Linear Elastic (b) Drucker-Prager
1.0
1.2
1.4
1.6
1.8
2.0
2.2
0.0 0.5 1.0 1.5 2.0 2.5 3.0 3.5 4.0
∆σz (kN/m2)
z/B
DeneyselLineer Elastik 3DDrucker-Prager 3DBoussinesq
ExperimentalLinear Elastic 3DDrucker-Prager 3D
Experimental Determination and Numerical Analysis …
1276
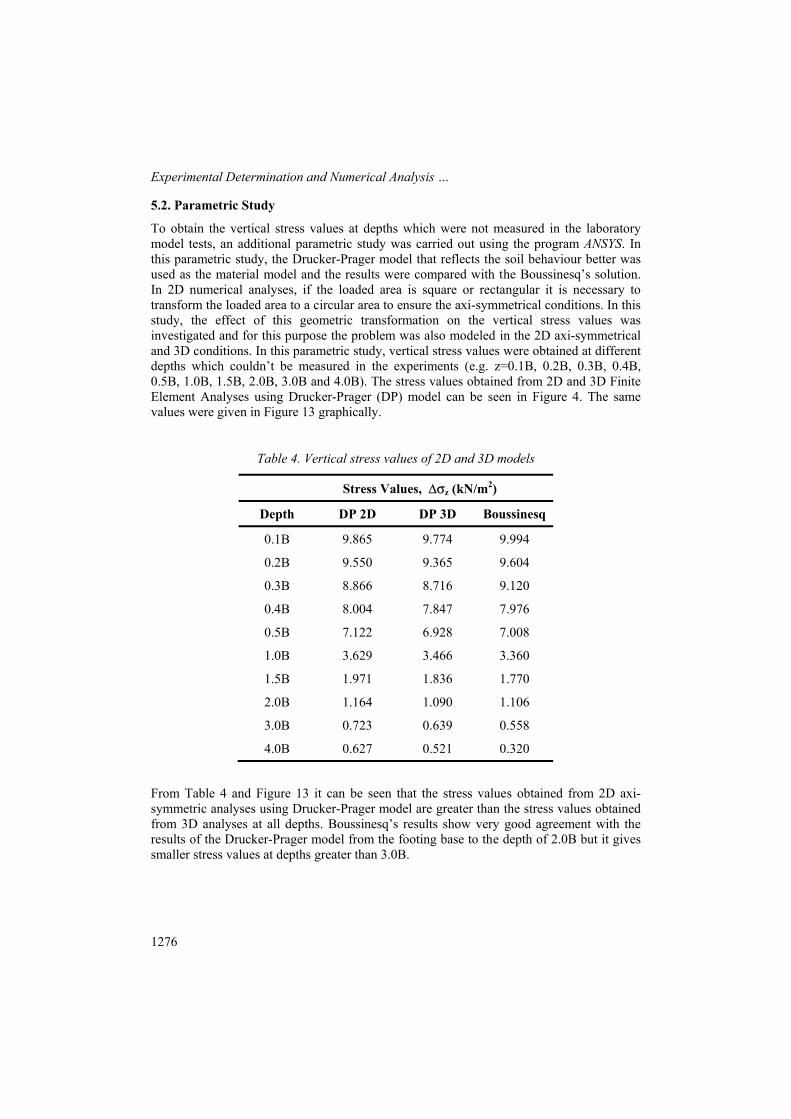
5.2. Parametric Study
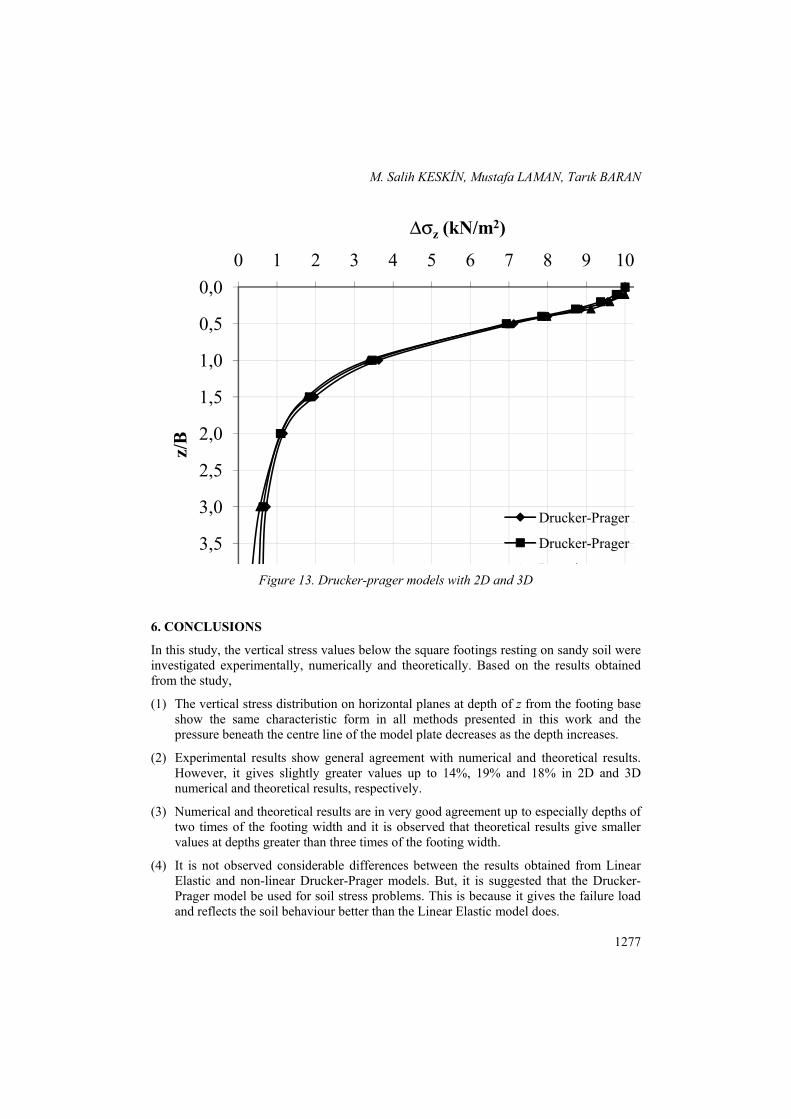
To obtain the vertical stress values at depths which were not measured in the laboratory model tests, an additional parametric study was carried out using the program ANSYS. In this parametric study, the Drucker-Prager model that reflects the soil behaviour better was used as the material model and the results were compared with the Boussinesq’s solution. In 2D numerical analyses, if the loaded area is square or rectangular it is necessary to transform the loaded area to a circular area to ensure the axi-symmetrical conditions. In this study, the effect of this geometric transformation on the vertical stress values was investigated and for this purpose the problem was also modeled in the 2D axi-symmetrical and 3D conditions. In this parametric study, vertical stress values were obtained at different depths which couldn’t be measured in the experiments (e.g. z=0.1B, 0.2B, 0.3B, 0.4B, 0.5B, 1.0B, 1.5B, 2.0B, 3.0B and 4.0B). The stress values obtained from 2D and 3D Finite Element Analyses using Drucker-Prager (DP) model can be seen in Figure 4. The same values were given in Figure 13 graphically.
Table 4. Vertical stress values of 2D and 3D models
Stress Values, ∆σz (kN/m2)
Depth DP 2D DP 3D Boussinesq
0.1B 9.865 9.774 9.994
0.2B 9.550 9.365 9.604
0.3B 8.866 8.716 9.120
0.4B 8.004 7.847 7.976
0.5B 7.122 6.928 7.008
1.0B 3.629 3.466 3.360
1.5B 1.971 1.836 1.770
2.0B 1.164 1.090 1.106
3.0B 0.723 0.639 0.558
4.0B 0.627 0.521 0.320
From Table 4 and Figure 13 it can be seen that the stress values obtained from 2D axi-symmetric analyses using Drucker-Prager model are greater than the stress values obtained from 3D analyses at all depths. Boussinesq’s results show very good agreement with the results of the Drucker-Prager model from the footing base to the depth of 2.0B but it gives smaller stress values at depths greater than 3.0B.
M. Salih KESKİN, Mustafa LAMAN, Tarık BARAN
1277
0,0
0,5
1,0
1,5
2,0
2,5
3,0
3,5
0 1 2 3 4 5 6 7 8 9 10
z/B
∆σz (kN/m2)
Drucker-Prager 2
Drucker-Prager 3
B i Figure 13. Drucker-prager models with 2D and 3D
6. CONCLUSIONS
In this study, the vertical stress values below the square footings resting on sandy soil were investigated experimentally, numerically and theoretically. Based on the results obtained from the study,
(1) The vertical stress distribution on horizontal planes at depth of z from the footing base show the same characteristic form in all methods presented in this work and the pressure beneath the centre line of the model plate decreases as the depth increases.
(2) Experimental results show general agreement with numerical and theoretical results. However, it gives slightly greater values up to 14%, 19% and 18% in 2D and 3D numerical and theoretical results, respectively.
(3) Numerical and theoretical results are in very good agreement up to especially depths of two times of the footing width and it is observed that theoretical results give smaller values at depths greater than three times of the footing width.
(4) It is not observed considerable differences between the results obtained from Linear Elastic and non-linear Drucker-Prager models. But, it is suggested that the Drucker-Prager model be used for soil stress problems. This is because it gives the failure load and reflects the soil behaviour better than the Linear Elastic model does.
Experimental Determination and Numerical Analysis …
1278
(5) Boussinesq’s results show good agreement with the experimental and numerical results especially at the depths up to where the effect of applied load decreases to 10%.
(6) Stress values obtained from 2D axi-symmetric analyses are greater than the results obtained from 3D analyses.
(7) Altough, the stress values obtained from 2D and 3D analyses are slightly different from each other they both give conservative results. Because of the difficulty of the 3D modeling and because it normally takes longer time to solve, it can be concluded that 2D axi-symmetric model can be suggested to be sufficiently useful in solution of stress increment problems.
Symbols Q : Point load
z : Depth
r : Horizontal distance
∆σz : Vertical stress
L : Foundation length
B : Foundation width
q : Uniform load
µ : Poisson’s ratio
m, n : Geometrical coefficients
Dr : Relative density
γdry : Dry unit weight
E : Young’s modulus
c : Cohesion
φ : Internal friction angle
ψ : Dilatation angle
D : Diameter
References [1] Uzuner, B.A., Çözümlü Problemlerle Temel Zemin Mekaniği, Ankara, Teknik
Yayınevi, 1998 (in Turkish).
[2] Sağlamer, A., Kohezyonsuz Zeminlerde Sükunetteki Toprak Basıncı Katsayısının Zemin Parametreleri Cinsinden İfadesi, Ph. D. Thesis in Civil Engineering, İstanbul Teknik Üniversitesi, İstanbul, 1972 (in Turkish).
M. Salih KESKİN, Mustafa LAMAN, Tarık BARAN
1279
[3] Laman, M., Keskin, M.S., Kumlu Zeminlere Oturan Kare Temeller Altında Düşey Gerilme Analizi, Türkiye Mühendislik Haberleri, 431, 53-57, 2004 (in Turkish).
[4] Koegler, D.P., Scheidig, A., Baugrund und Bauwerk, W. Ernst und Shon, Berlin, 1938.
[5] Boussinesq, J., Application des Potentiels a L’etude de L’equilbre et du Movement des Solids Elastiques, Gauthier-Villars, Paris, 1885.
[6] Charles, J.A., The Depth of Influence of Loaded Areas, Geotechnique, 46 (1), 51-61, 1996.
[7] Burland, J.B., Broms, B.B., De Mello, V.F.B., Behaviour of Foundations and Structures, In Proceedings of the 9th International Conference on Soil Mechanics and Foundation Engineering, Tokyo, A.A. Balkema, pp. 495–538, 1977.
[8] Morgan, J.R., Gerrard, C.M., Behavior of Sands Under Surface Loads, Proc. Am. Soc. Civil Engineers, 97 (SM 12), 1675-1699, 1971.
[9] Newmark, N.M., Simplified Computation of Vertical Pressures in Elastic Foundations, University of Illinois Engineering, Experiment Station, Circular No. 24, Illinois, 1935.
[10] Westergaard, H.M., A Problem of Elasticity Suggested by a Problem in Soil Mechanics: Soft Material Reinforced by Numerous Strong Horizontal Sheets, Contributions to the Mechanics of Solids, S. Timoshenko 60th Anniversary Volume, Newyork-Mac Millan, 1938.
[11] Gray H., Stresses and Displacements from Loads over Rectangular Area, Civil Engineering, ASCE, 13 (5), 227-229, 1943.
[12] Ambraseys N.N., Discussion of Linearly Variable Load Distribution on a Rectangular Foundation, Journal of the Soil Mechanics and Foundation Division, ASCE, 86 (SM3), 123-125, 1960.
[13] Vitone D.M., Valsangkar A.J., Stresses from Loads over Rectangular Areas, Journal of Geotechnical Engineering Division, ASCE, 112 (10), 961-964, 1986.
[14] Giroud, J.P., Stresses Under Linearly Loaded Rectangular Area, Journal of the Soil Mechanics and Foundation Division, ASCE, 96 (SMI), 263-268, 1970.
[15] Jarquio R. and Jarquio V., Vertical Stress Formulas for Triangular Loading, Journal of Geotechnical Engineering Division, ASCE, 110 (1), 73-78, 1984.
[16] Algin, H.M., Stresses from Linearly Distributed Pressures over Rectangular Areas, International Journal for Numerical and Analytical Methods in Geomechanics, 24, 681-692, 2000.
[17] Tekinsoy, M.A., Laman, M., Elastik Zemin Problemleri, Süleyman Demirel Üniversitesi Basımevi, Isparta, 2000 (in Turkish).
[18] Özaydın, K., Zemin Mekaniği, MEYA Matbaacılık ve Yayıncılık, İstanbul, 1989 (in Turkish).
[19] Keskin, M.S., Zeminlerde Oluşan İlave Düşey Gerilmelerin Değişik Yöntemlerle İrdelenmesi, Yüksek Lisans Tezi, Çukurova Üniversitesi, Adana, 2004 (in Turkish).