Embed Size (px)
Citation preview

Experimental DesignMaking sure your data does not cause problems for you
Xochitl Morgan, Ph.D.7 April 2014
Objectives
• Be more critical of things you read (Ioannidas, Plos Med 2005).
• Be more likely to avoid experimental design flaws.
• Ask questions

Lecture Format
1. Study design and hierarchy of evidence2. Piloting3. Batch effects and how to avoid them4. Small-group work examples

Hierarchy of Evidence
How do you decide what to believe?
What is good evidence?
What is a sufficientlywell-designed study?
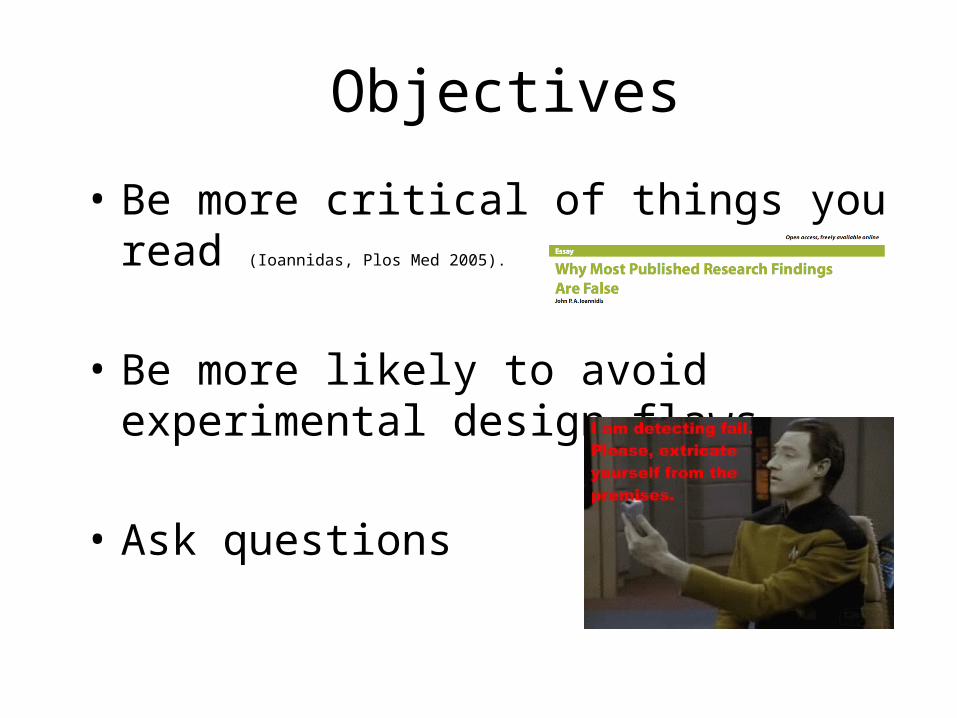
Date of download: 4/7/2014Copyright © 2014 American Medical Association.
All rights reserved.
From: Contradicted and Initially Stronger Effects in Highly Cited ClinicalResearch
JAMA. 2005;294(2):218-228. doi:10.1001/jama.294.2.218
Figure Legend:
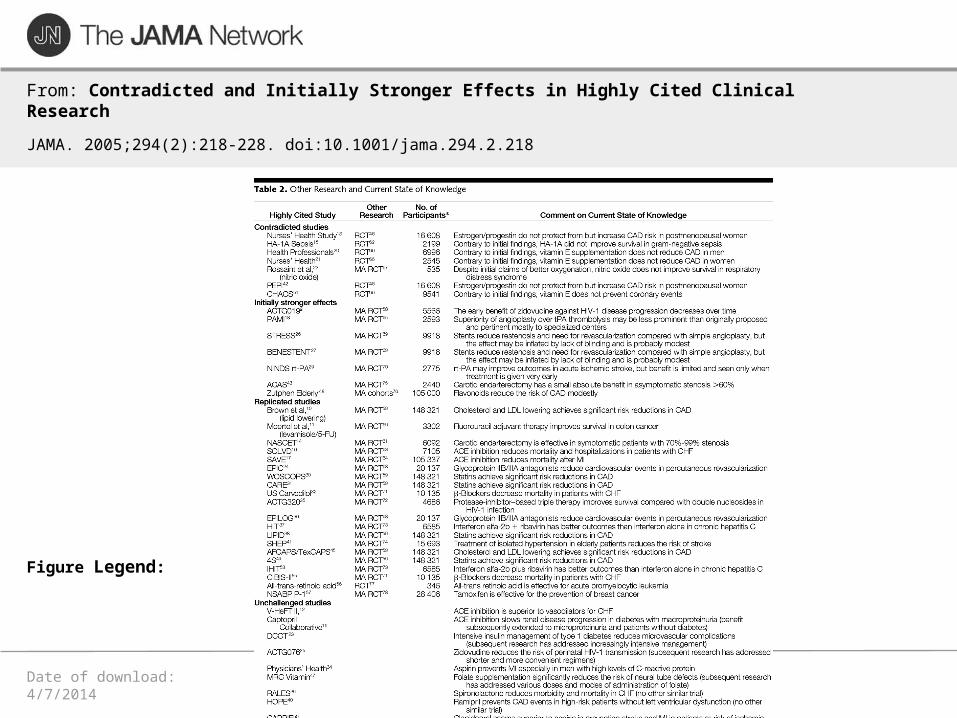
Case report: Detailed description of a single instance

Cross sectional studies: snapshots of populations in time
• Estimate the prevalence of something of interest in a population (and / or subgroups)• Quick and inexpensive• Can measure many variables• No followup• Correlation, not causation
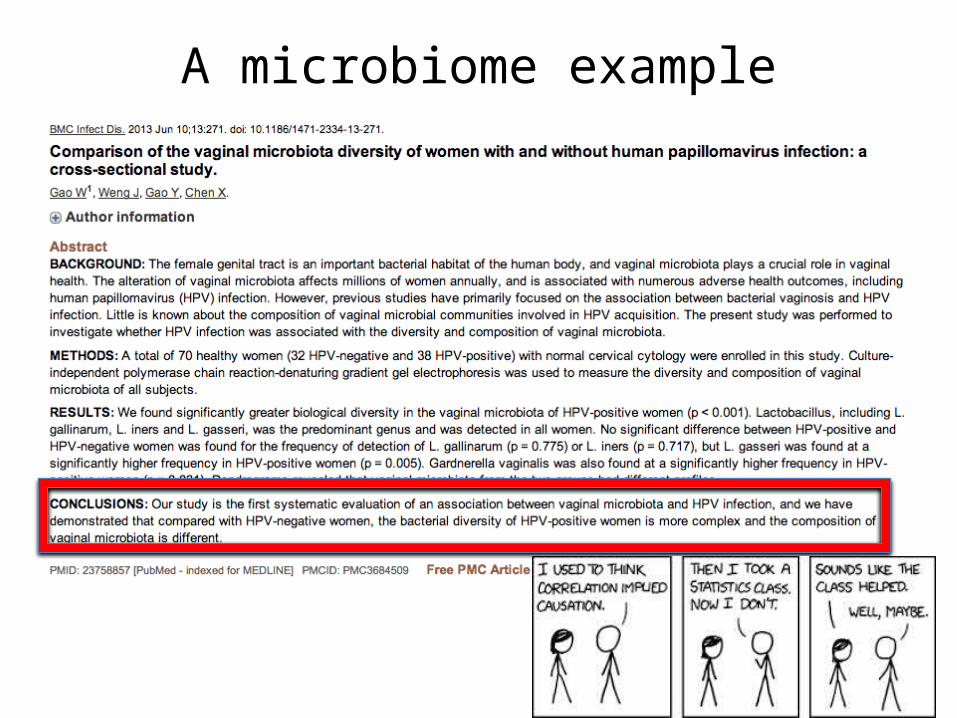
A microbiome example
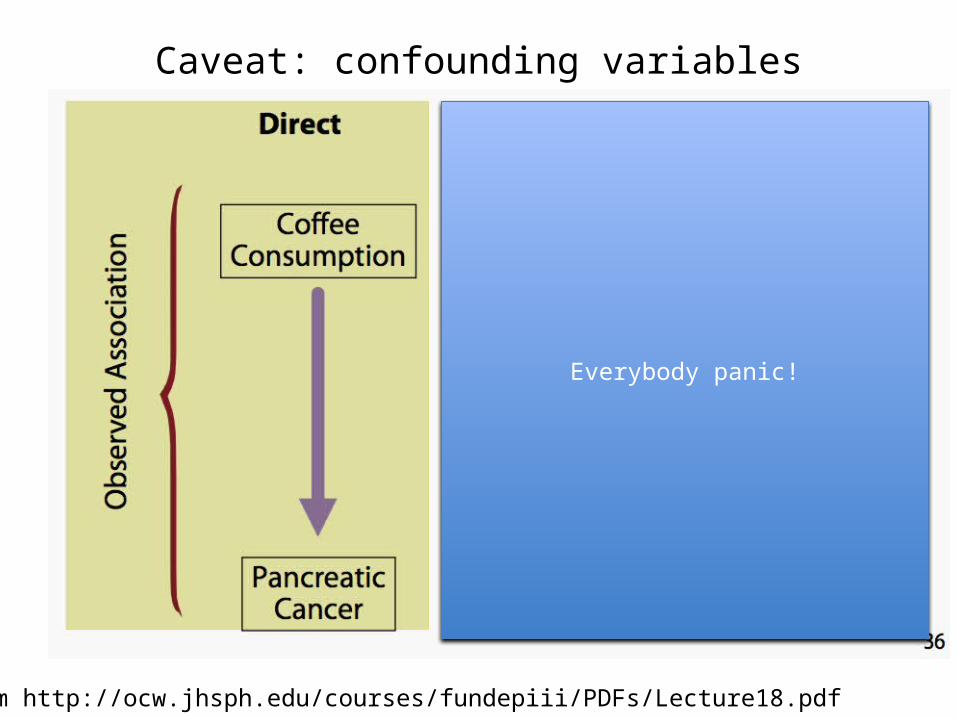
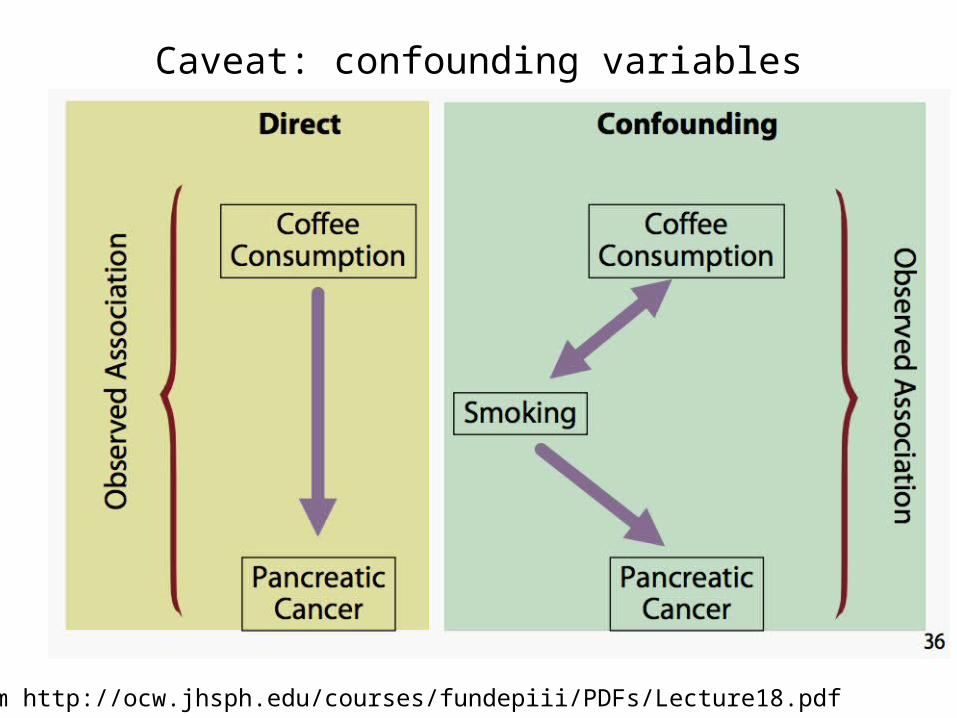
Caveat: confounding variables
From http://ocw.jhsph.edu/courses/fundepiii/PDFs/Lecture18.pdf
Everybody panic!
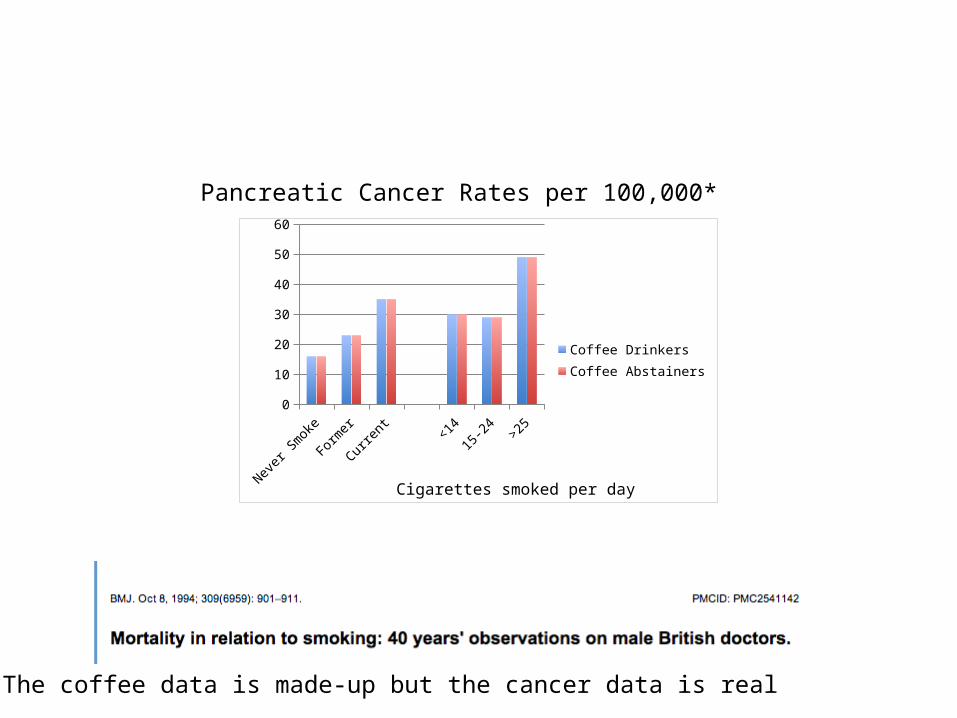
Cigarettes smoked per dayNever Smoke
Former Current <14 15-24 >250
10
20
30
40
50
60
Coffee DrinkersCoffee Abstainers
Pancreatic Cancer Rates per 100,000*
*The coffee data is made-up but the cancer data is real
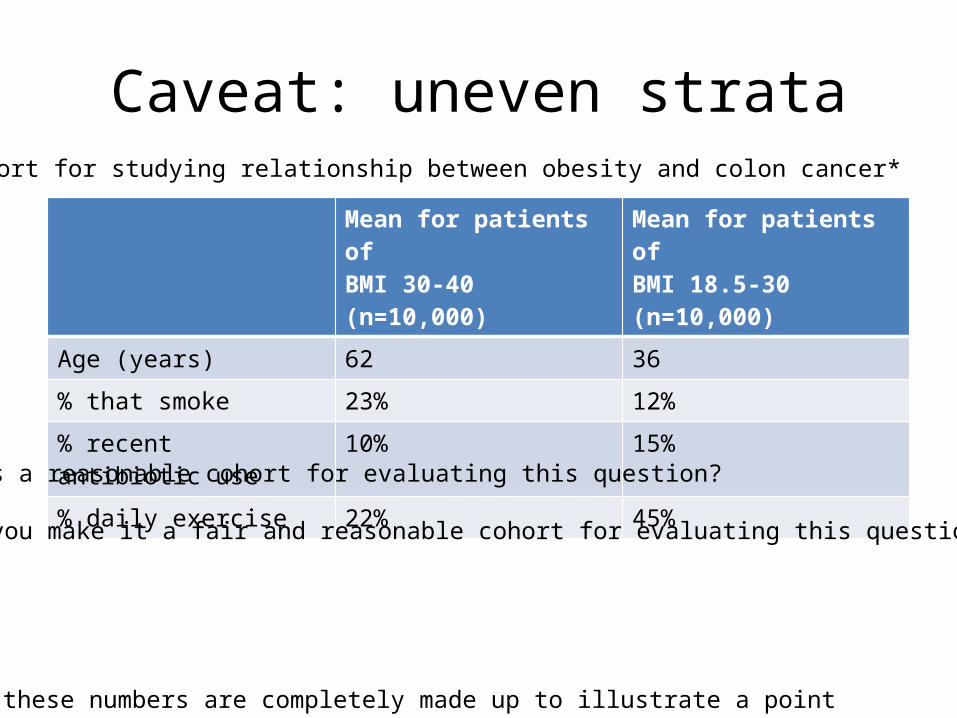
Caveat: uneven strata
Mean for patients ofBMI 30-40 (n=10,000)
Mean for patients ofBMI 18.5-30 (n=10,000)
Age (years) 62 36
% that smoke 23% 12%
% recent antibiotic use 10% 15%
% daily exercise 22% 45%
Cohort for studying relationship between obesity and colon cancer*
*All of these numbers are completely made up to illustrate a point
Is this a reasonable cohort for evaluating this question?
Could you make it a fair and reasonable cohort for evaluating this question?
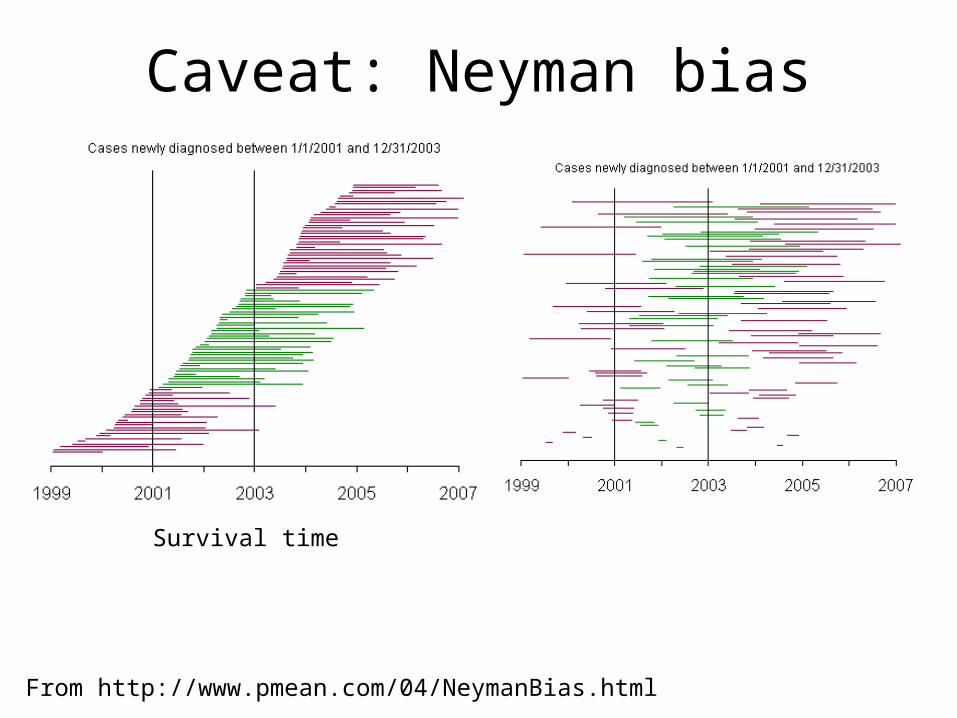
Caveat: Neyman bias
Survival time
From http://www.pmean.com/04/NeymanBias.html
Caveat: confounding variables
From http://ocw.jhsph.edu/courses/fundepiii/PDFs/Lecture18.pdf

Case-Control Study
• Identify cases (with outcome)• For each case, multiple matched controls (without outcome)• Look back in time to compare exposures for each group• Inherently retrospective• Be very specific about how case is defined • Match controls for age, sex, time of hospitalization• Calculate odds ratio for exposure in cases vs controls (with
confidence intervals) (e.g. OR = odds of exposure in cases / odds of exposure in controls)
• Quick, easy, inexpensive, efficient• Can be limited by database quality; can only show correlation;
fitting controls properly can be an issue.
Review: http://www.ncbi.nlm.nih.gov/pmc/articles/PMC1706071/

Example: How it can go wrong
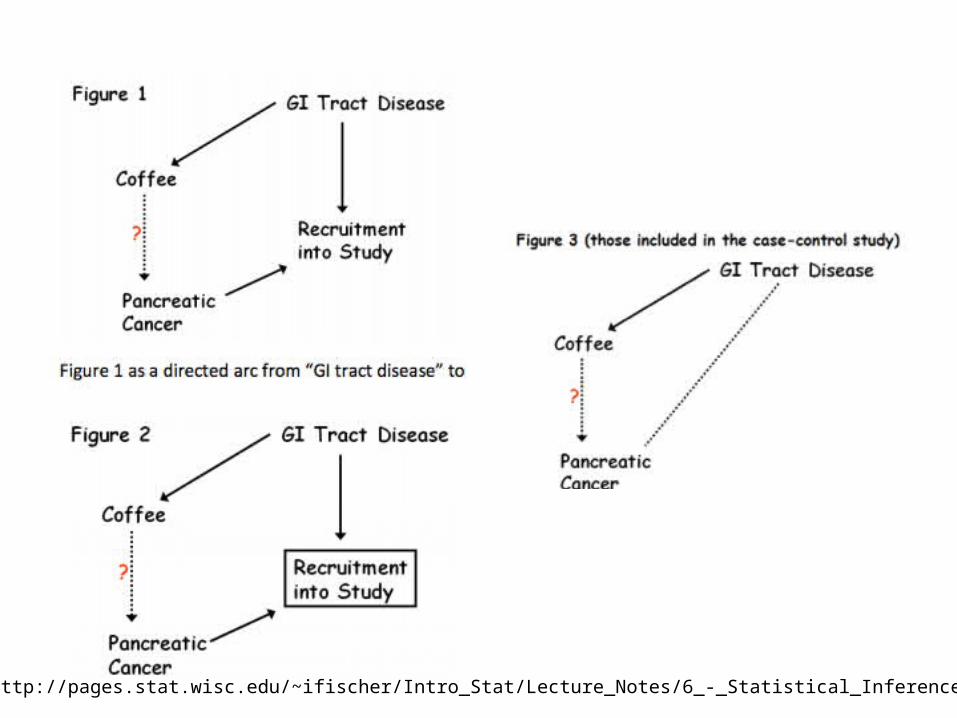
http://pages.stat.wisc.edu/~ifischer/Intro_Stat/Lecture_Notes/6_-_Statistical_Inference/BIAS.pdf
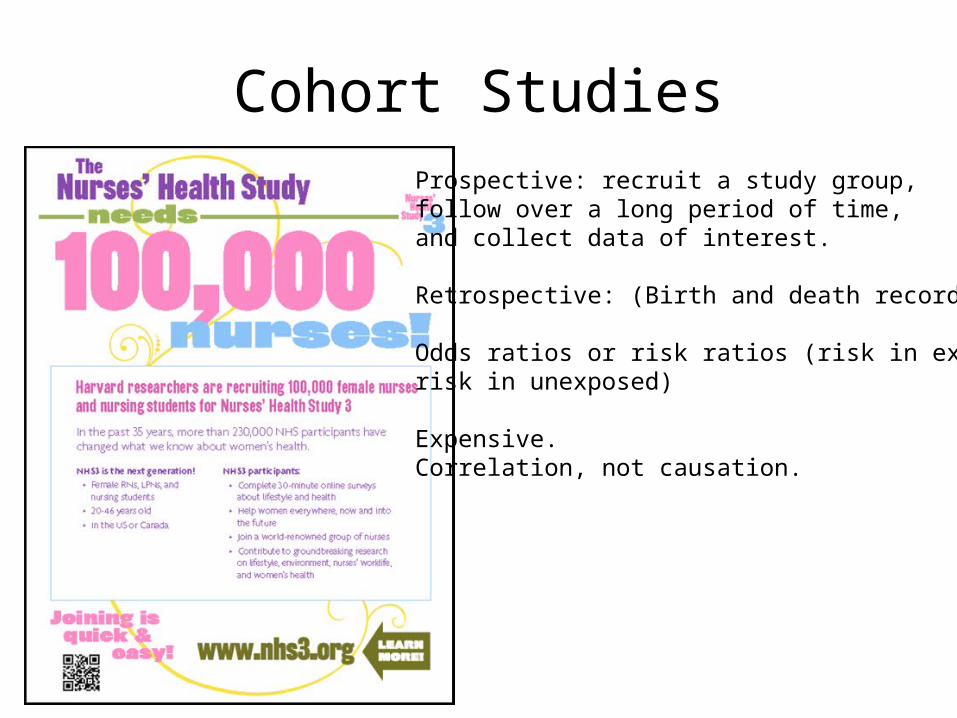
Cohort StudiesProspective: recruit a study group,follow over a long period of time,and collect data of interest.
Retrospective: (Birth and death records)
Odds ratios or risk ratios (risk in exposed /risk in unexposed)
Expensive.Correlation, not causation.
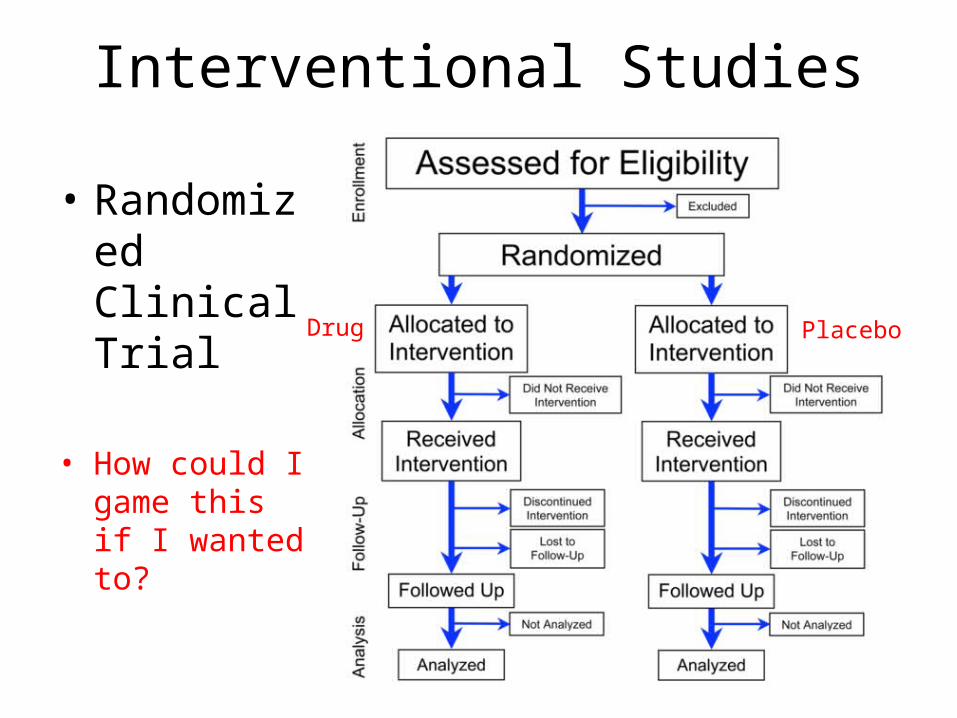
Interventional Studies
• Randomized Clinical Trial
• How could I game this if I wanted to?
Drug Placebo
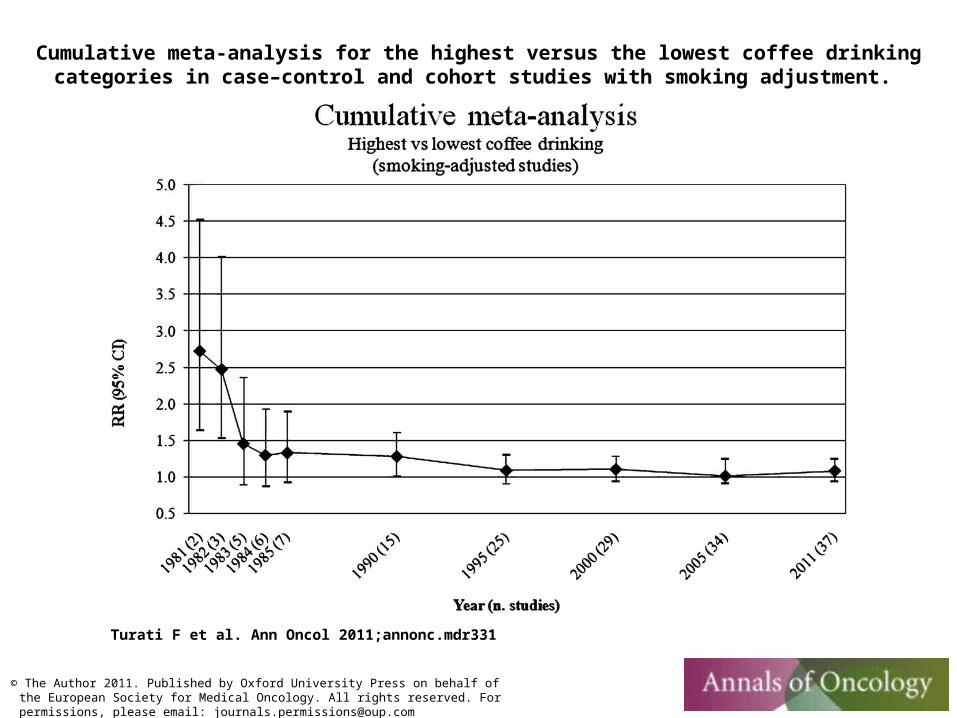
Cumulative meta-analysis for the highest versus the lowest coffee drinking categories in case–control and cohort studies with smoking adjustment.
Turati F et al. Ann Oncol 2011;annonc.mdr331
© The Author 2011. Published by Oxford University Press on behalf of the European Society for Medical Oncology. All rights reserved. For permissions, please email: [email protected]

Summarize: Hierarchy of Evidence• Observational
– Case report– Cross section
• Describes a random sample of a population at a point in time
– Case / Control Studies• For each case, matched controls (multiple controls per case)
– Cohort studies-Prospective (defined before data collection)-Retrospective (defined after data collection)
• Interventional– Randomized control trials (suggestive, but indefinite 95% confidence intervals)– Randomized control trials (definite 95% confidence intervals)
• Systematic reviews / meta analysis
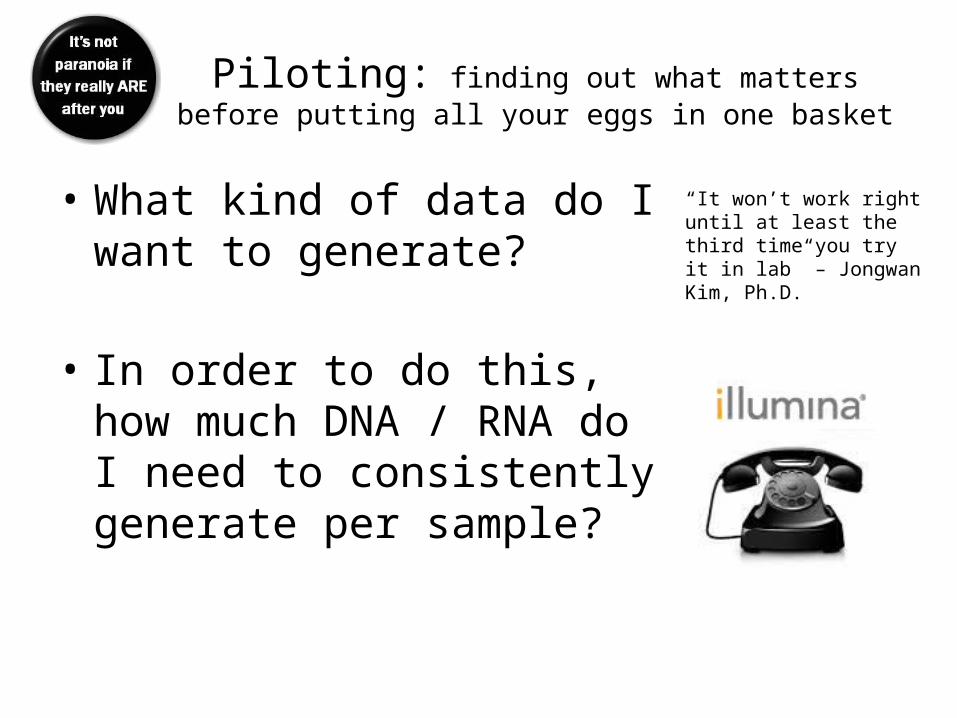
Piloting: finding out what matters before putting all your eggs in one basket
• What kind of data do I want to generate?
• In order to do this, how much DNA / RNA do I need to consistently generate per sample?
“It won’t work right until at least the third time you try it in lab” – Jongwan Kim, Ph.D.

Piloting 2
• How do I collect my samples, and is it consistent with reality?
I want to doRNA-seq on skin bacterialcommunities!
It’s completely OKto use Q-tips
for sampling the bacterial
communities ofmy subjects’ noses,
right?
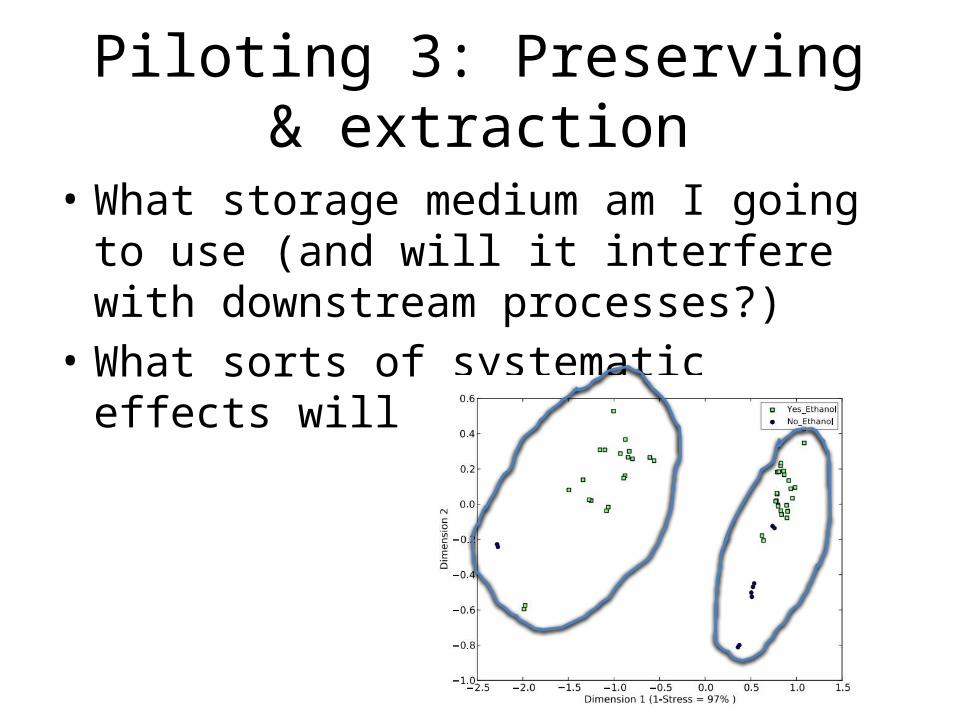
Piloting 3: Preserving & extraction
• What storage medium am I going to use (and will it interfere with downstream processes?)
• What sorts of systematic effects will it introduce?
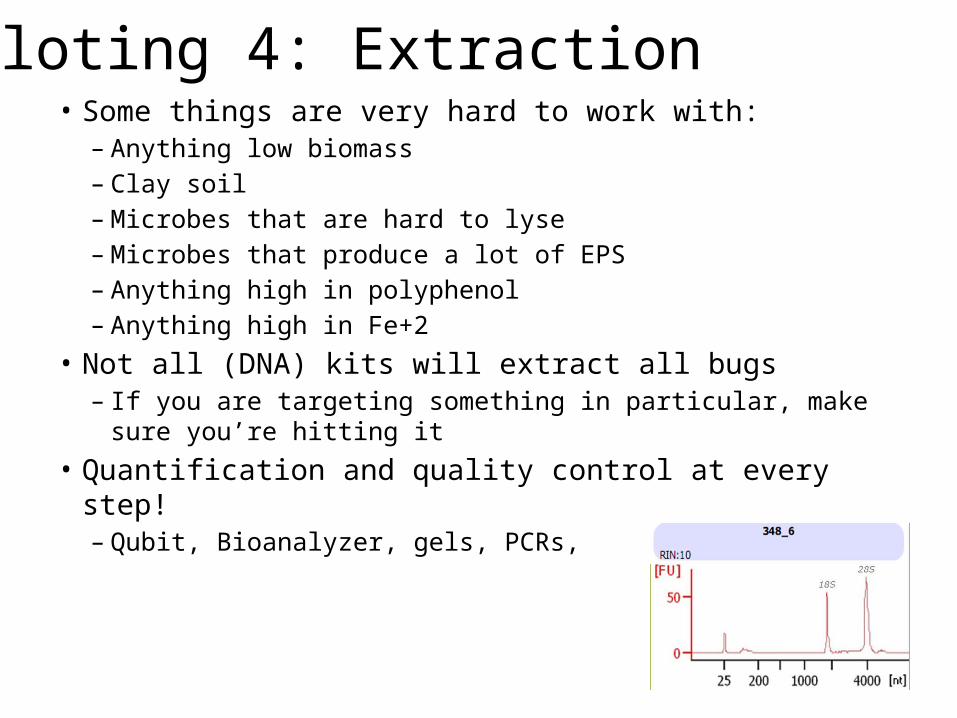
Piloting 4: Extraction• Some things are very hard to work with:
– Anything low biomass– Clay soil– Microbes that are hard to lyse– Microbes that produce a lot of EPS– Anything high in polyphenol– Anything high in Fe+2
• Not all (DNA) kits will extract all bugs– If you are targeting something in particular, make sure you’re
hitting it • Quantification and quality control at every step!
– Qubit, Bioanalyzer, gels, PCRs,

Batch Effects
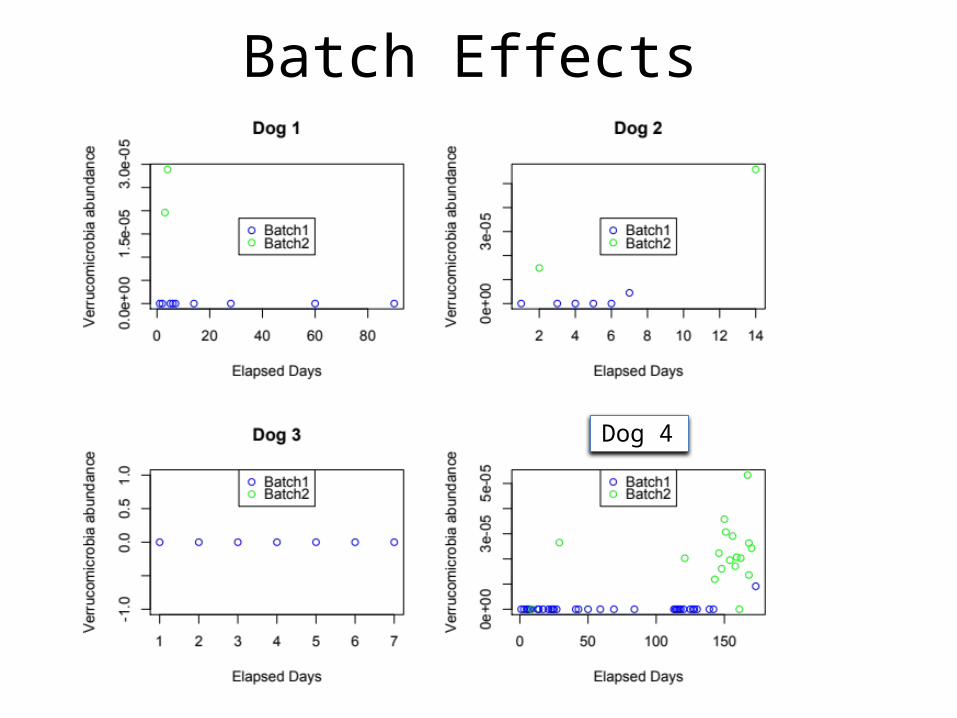
Batch Effects
DDog 4
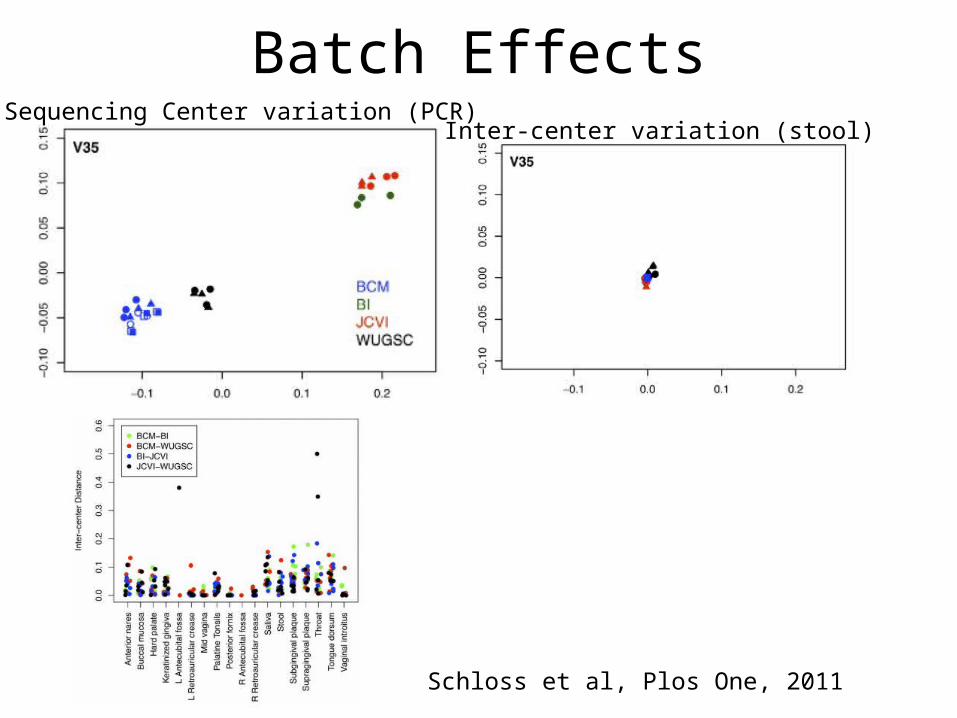
Batch EffectsSequencing Center variation (PCR)
Inter-center variation (stool)
Schloss et al, Plos One, 2011

Plate design
Plate #196 Cases
Plate #296 Controls
Are these designs a good idea?
If not, what else would you try?
Plate #1Small
Intestine
Plate #2Large
Intestine
Plate #3Esophagus
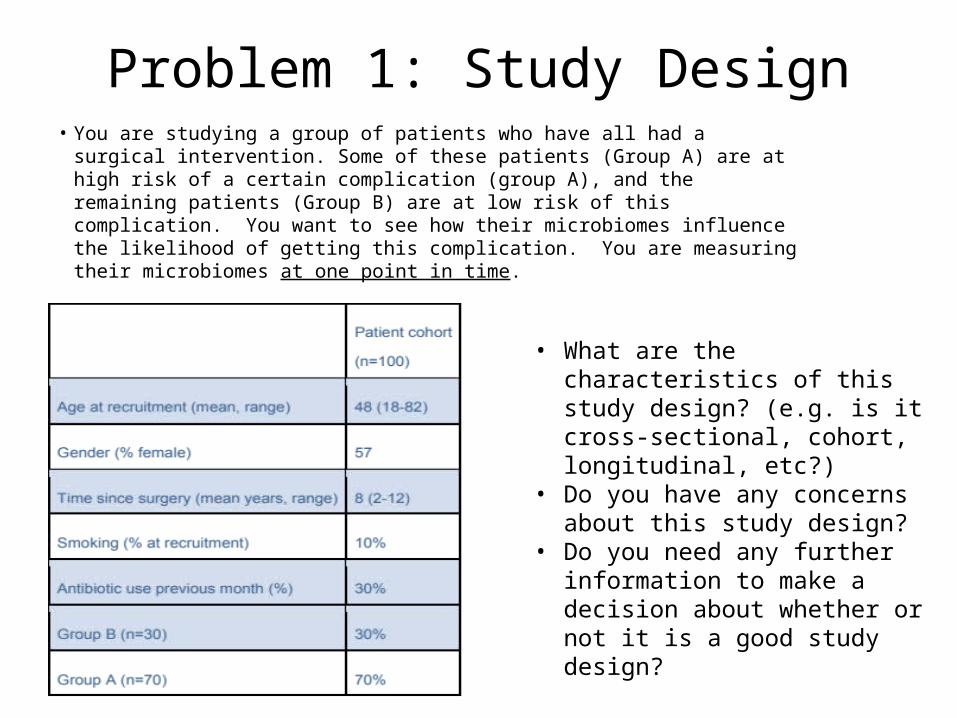
Problem 1: Study Design• You are studying a group of patients who have all had a surgical
intervention. Some of these patients (Group A) are at high risk of a certain complication (group A), and the remaining patients (Group B) are at low risk of this complication. You want to see how their microbiomes influence the likelihood of getting this complication. You are measuring their microbiomes at one point in time.
• What are the characteristics of this study design? (e.g. is it cross-sectional, cohort, longitudinal, etc?)
• Do you have any concerns about this study design?
• Do you need any further information to make a decision about whether or not it is a good study design?
Problem 2: PilotingSally is a first-year Ph.D student who has gotten an enormous grant from Mercedes Benz to characterize the microbiome of interior surfaces of new cars. However, if she does not get results and publish a paper, she will never, graduate and must instead become a gas station attendant for the rest of her life. Sally would like to compare the microbiomes of windshields, door handles, foot pedals, shifters, dashboards, carpet, and seats. She thinks it would be interesting to characterize the communities with shotgun metagenomic sequencing and RNA sequencing, and she would like to survey 100 cars each from Mercedes, VW, and Honda at each surface.
• What sorts of parameters should Sally pilot to make sure that her plans are feasible?
• Do you need any further information to make sure that Sally’s plans are feasible?• Do you have any concerns about Sally’s plans?• Do you have any alternative suggestions for Sally’s Ph.D. thesis?
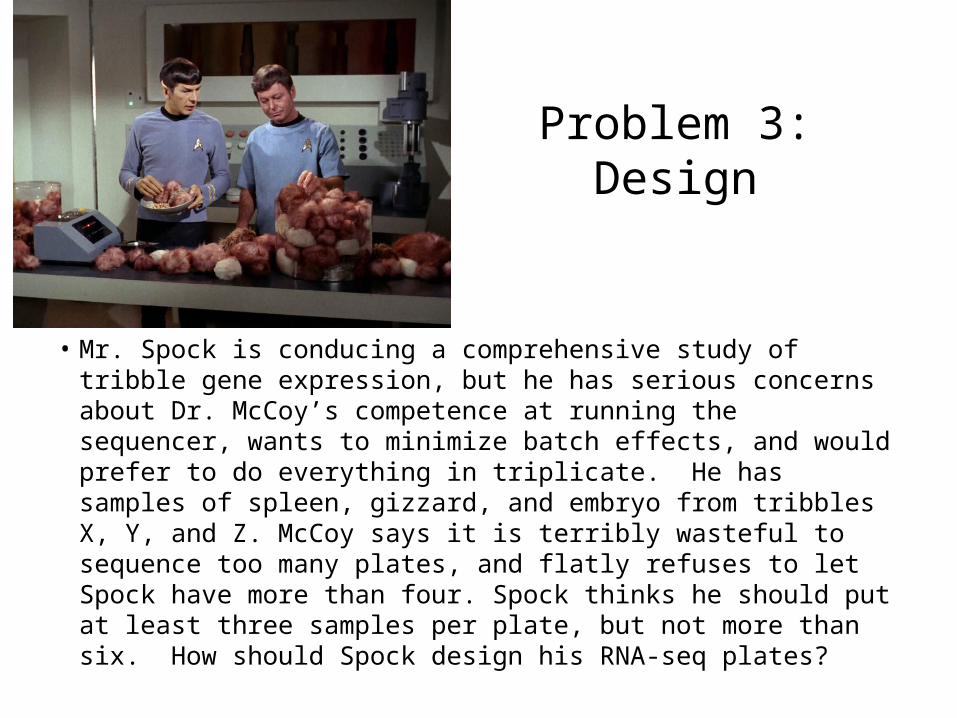
Problem 3: Design
• Mr. Spock is conducing a comprehensive study of tribble gene expression, but he has serious concerns about Dr. McCoy’s competence at running the sequencer, wants to minimize batch effects, and would prefer to do everything in triplicate. He has samples of spleen, gizzard, and embryo from tribbles X, Y, and Z. McCoy says it is terribly wasteful to sequence too many plates, and flatly refuses to let Spock have more than four. Spock thinks he should put at least three samples per plate, but not more than six. How should Spock design his RNA-seq plates?

Problem 4: Thinking CriticallyConsider the abstract from a recent paper (“Microbial dysbiosis is associated with human breast cancer” – Plos One, 8 Jan 2014).
Abstract:Breast cancer affects one in eight women in their lifetime. Though diet, age and genetic predisposition are established risk factors, the majority of breast cancers have unknown etiology. The human microbiota refers to the collection of microbes inhabiting the human body. Imbalance in microbial communities, or microbial dysbiosis, has been implicated in various human diseases including obesity, diabetes, and colon cancer. Therefore, we investigated the potential role of microbiota in breast cancer by next-generation sequencing using breast tumor tissue and paired normal adjacent tissue from the same patient. In a qualitative survey of the breast microbiota DNA, we found that the bacterium Methylobacterium radiotolerans is relatively enriched in tumor tissue, while the bacterium Sphingomonas yanoikuyae is relatively enriched in paired normal tissue. The relative abundances of these two bacterial species were inversely correlated in paired normal breast tissue but not in tumor tissue, indicating that dysbiosis is associated with breast cancer. Furthermore, the total bacterial DNA load was reduced in tumor versus paired normal and healthy breast tissue as determined by quantitative PCR. Interestingly, bacterial DNA load correlated inversely with advanced disease, a finding that could have broad implications in diagnosis and staging of breast cancer. Lastly, we observed lower basal levels of antibacterial response gene expression in tumor versus healthy breast tissue. Taken together, these data indicate that microbial DNA is present in the breast and that bacteria or their components may influence the local immune microenvironment. Our findings suggest a previously unrecognized link between dysbiosis and breast cancer which has potential diagnostic and therapeutic implications.
Methods:Genomic DNA (gDNA) extraction from FFPE tissueTotal genomic DNA was extracted from FFPE breast tissues using QIAamp DNA FFPE Tissue kit per manufacturer’s instructions with slight modifications. Purified gDNA was eluted twice from the column using ultrapure water. All extractions were performed in a designated clean (pre-PCR) room.
16S pyrosequencing
We initially set out to investigate the microbiome in breast cancer, and elected to study ER+ tumors. Due to the variability of the microbiome from individual to individual, we decided matched tissue (paired normal and tumor) from the same individual would provide the best comparison of microbial communities. Twenty paraffin-embedded paired samples were used for this purpose. Genomic DNA (gDNA) (from Subjects 1–20) was submitted to Second Genome Inc., for pyrosequencing and analysis. The gDNA was amplified using fusion primers targeting the bacterial 16S V4 rDNA with indexing barcodes. All samples were amplified with two differently barcoded V4 fusion primers and pooled for sequencing on the Illumina Miseq with 150bp paired-end reads. 60,248±14,229 (mean ± s.d.) reads were obtained per sample.

From Bergey’s Manual ofSystematic Bacteriology
Do you agree with the conclusionsof the authors?
Do you see any alternative explanations for the data?
Can you propose an alternative experimental approach to explore this problem?
http://protocolsonline.com/histology/sample-preparation/paraffin-processing-of-tissue/
Problem 5
Elizabeth prepares a mixture of microbes (Bug A and Bug B) in which she knows the ratio of Bug A to Bug B is exactly 10 to 1. She extracts the DNA and performs 16S sequencing and WGS sequencing. WGS sequencing tells her that the ratio of Bug A : Bug B is 2:1. 16S sequencing results yield the ratio of BugA:BugB 1:6. Why might these results happen?