Embed Size (px)
Citation preview
1
Volpe The National Transportation Systems Center
Experimental Design
U.S. Department of Transportation Research and Innovative Technology Administration John A. Volpe National Transportation Systems Center
Volpe The National Transportation Systems Center Advancing transportation innovation for the public good
Kevin Gay September 25, 2012
2
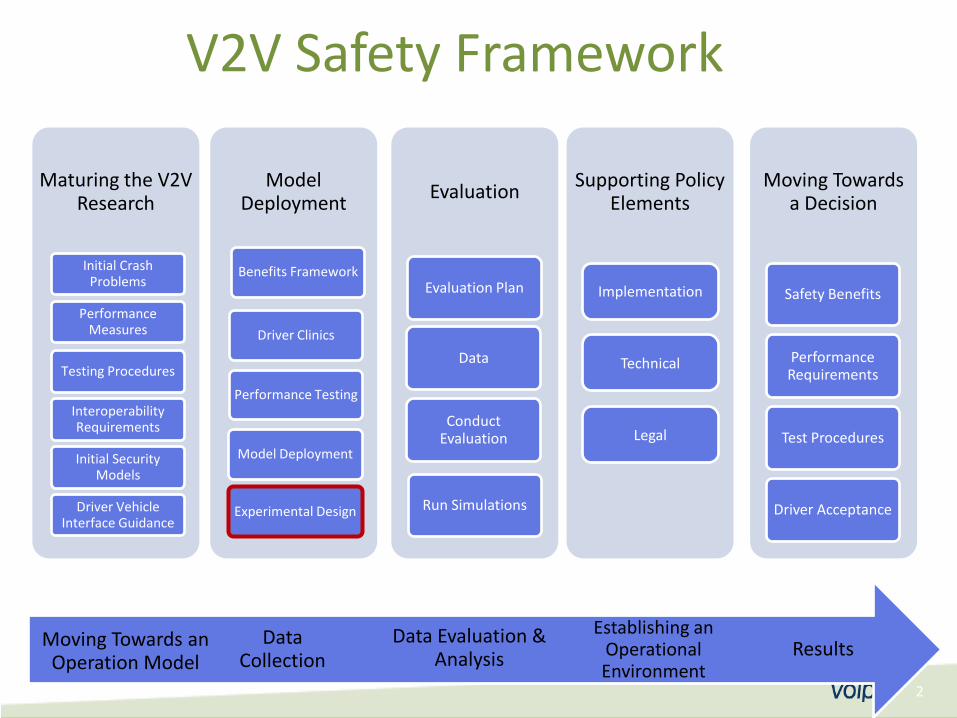
V2V Safety Framework
Maturing the V2V Research
Initial Crash
Problems
Interoperability Requirements
Performance Measures
Testing Procedures
Driver Vehicle Interface Guidance
Initial Security Models
Model Deployment
Driver Clinics
Benefits Framework
Performance Testing
Model Deployment
Experimental Design
Evaluation
Evaluation Plan
Conduct Evaluation
Data
Run Simulations
Moving Towards a Decision
Safety Benefits
Performance Requirements
Test Procedures
Driver Acceptance
Supporting Policy Elements
Implementation
Technical
Legal
Establishing an Operational Environment
Results Data Evaluation & Analysis
Data Collection
Moving Towards an Operation Model
3
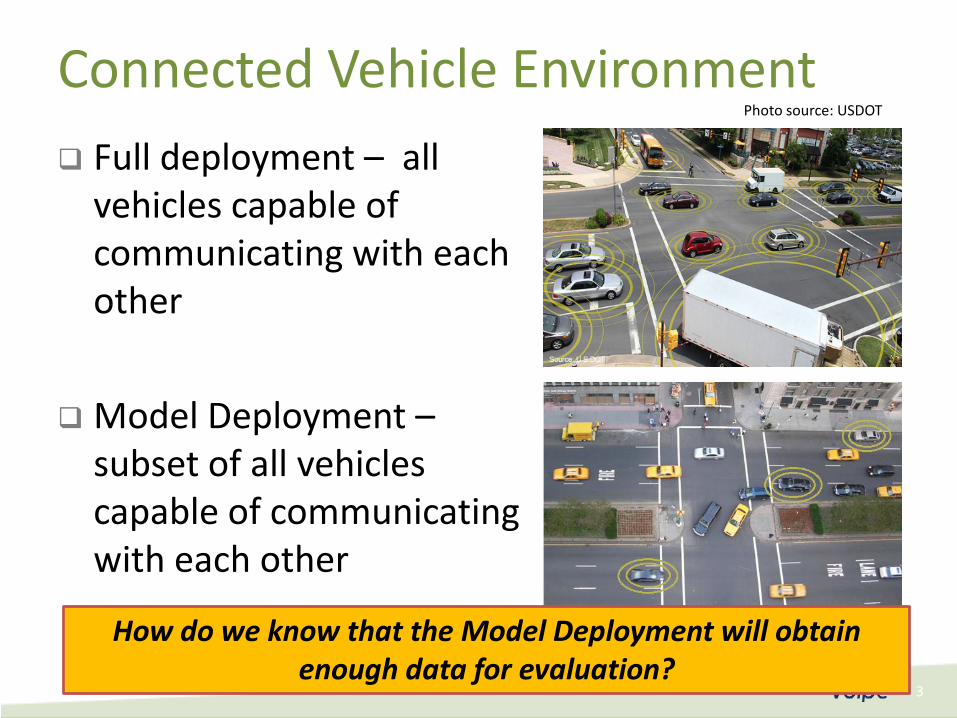
Connected Vehicle Environment Full deployment – all
vehicles capable of communicating with each other
Model Deployment –
subset of all vehicles capable of communicating with each other
How do we know that the Model Deployment will obtain enough data for evaluation?
Photo source: USDOT
4
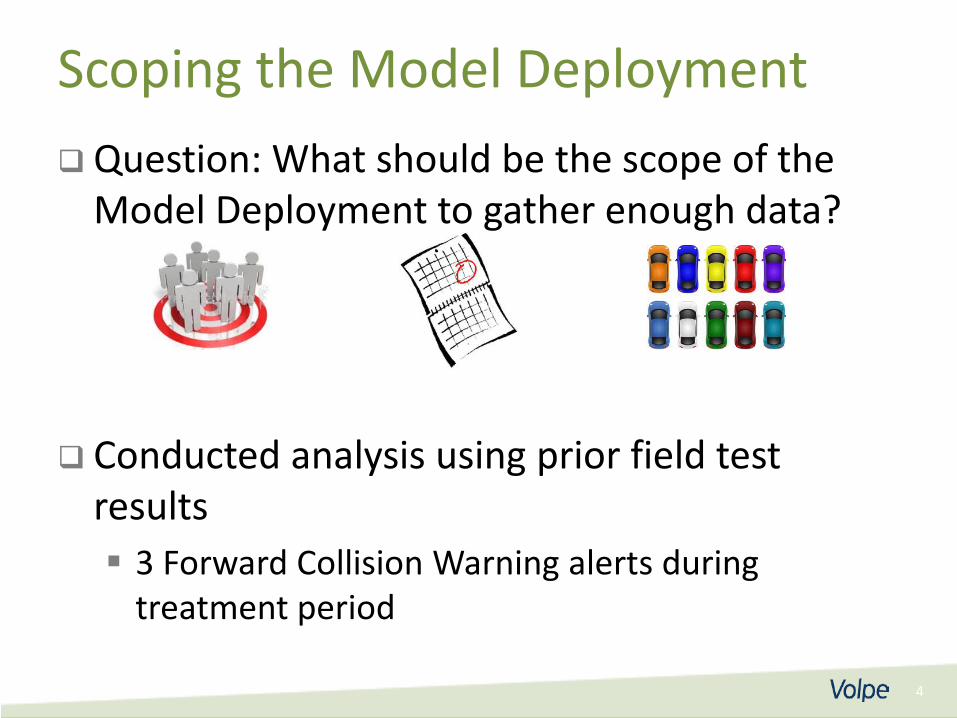
Scoping the Model Deployment Question: What should be the scope of the
Model Deployment to gather enough data?
Conducted analysis using prior field test results 3 Forward Collision Warning alerts during
treatment period
5
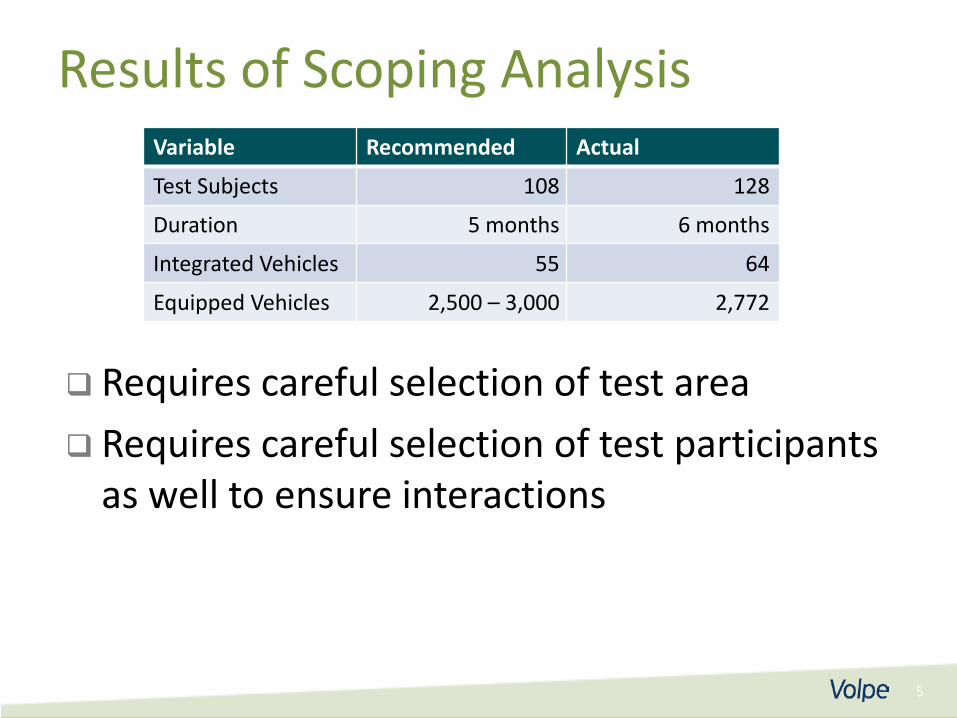
Results of Scoping Analysis
Requires careful selection of test area Requires careful selection of test participants
as well to ensure interactions
Variable Recommended
Test Subjects 108
Duration 5 months
Integrated Vehicles 55
Equipped Vehicles 2,500 – 3,000
Actual
128
6 months
64
2,772
6
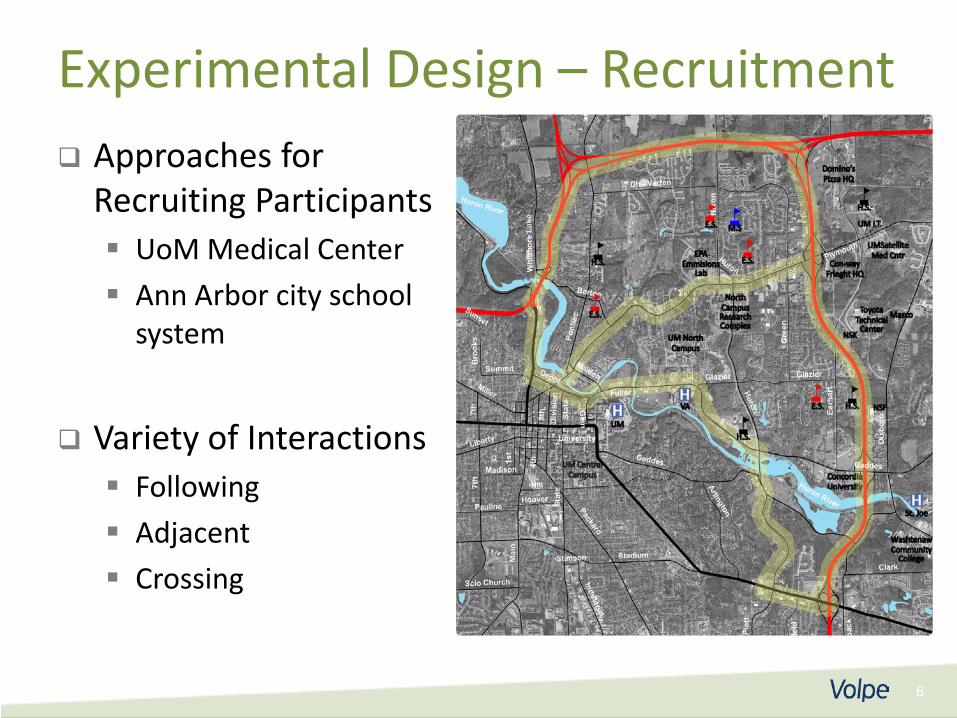
Experimental Design – Recruitment Approaches for
Recruiting Participants UoM Medical Center Ann Arbor city school
system
Variety of Interactions Following Adjacent Crossing

7
Simulating the Experimental Design Ann Arbor Trip Tables
Provided by Washtenaw Area Transportation Study
TRANSIMS Model Ran model for 24 hour period Output included second-by-second
positioning of vehicles
8
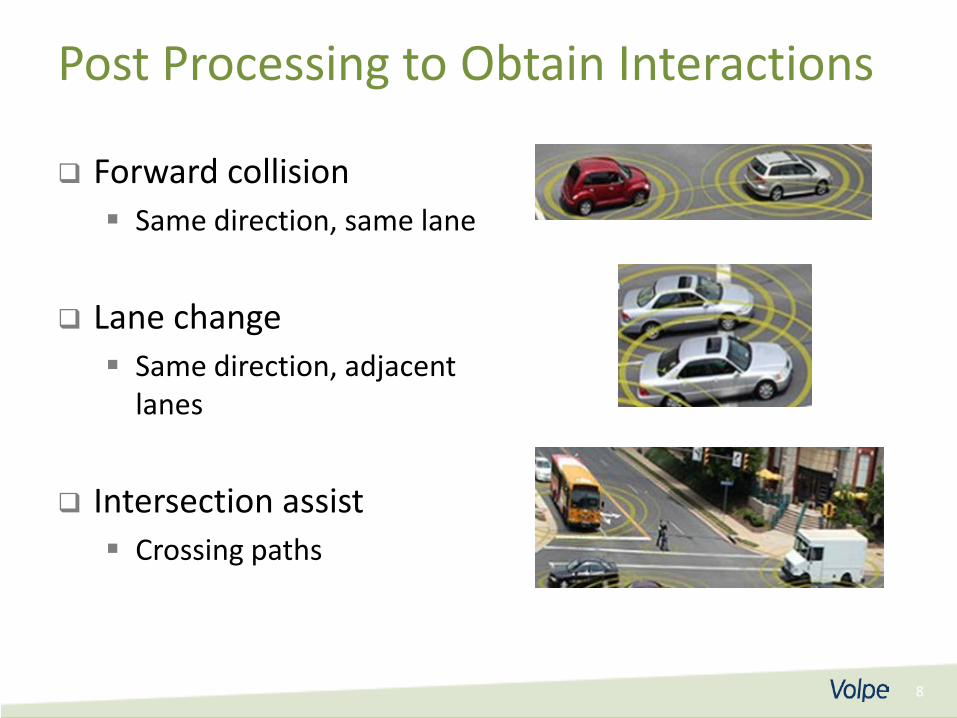
Post Processing to Obtain Interactions
Forward collision Same direction, same lane
Lane change Same direction, adjacent
lanes
Intersection assist Crossing paths
9
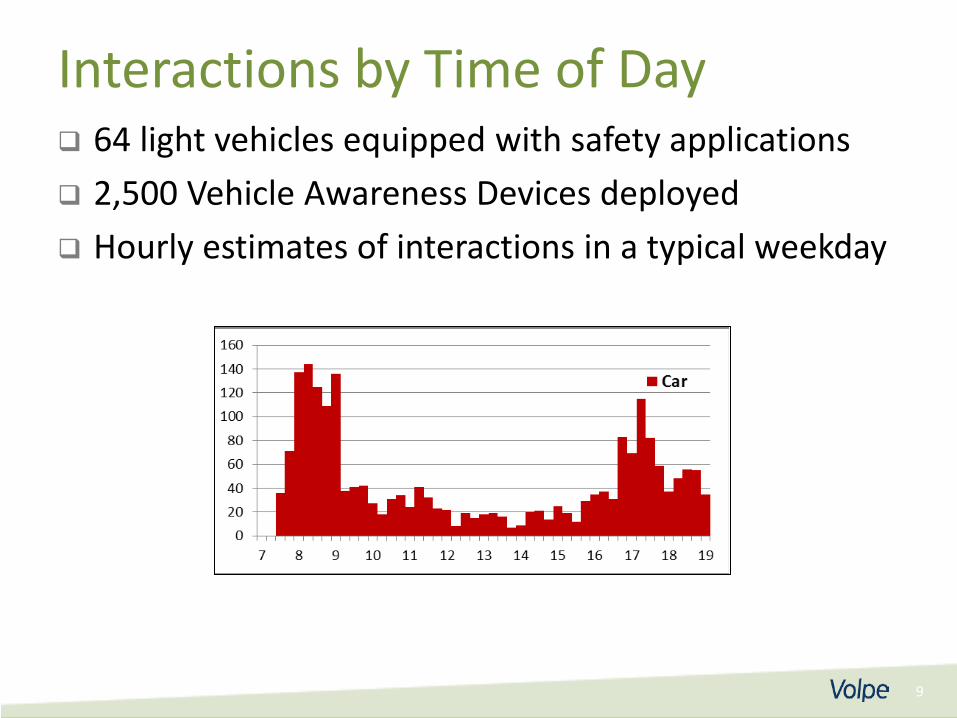
Interactions by Time of Day 64 light vehicles equipped with safety applications 2,500 Vehicle Awareness Devices deployed Hourly estimates of interactions in a typical weekday

10
Estimates of Daily V2V Interactions Assumptions for V2V interactions 2,500 Vehicle Awareness Devices are deployed Vehicle speeds > 25 mph Vehicles are within 30 meters of each other
Host Vehicle Daily Interactions Monthly Interactions
Integrated Light Vehicles 250 5,000
11
Total Safety Alerts Estimated How do the interactions relate to safety alerts
generated by the applications? Developed estimates of the relationship between
interactions and safety alerts. Estimated that over 6 months, each driver would
experience ~3 alerts / safety application
11
The estimated volume of alerts per driver are consistent with scoping analysis!
12
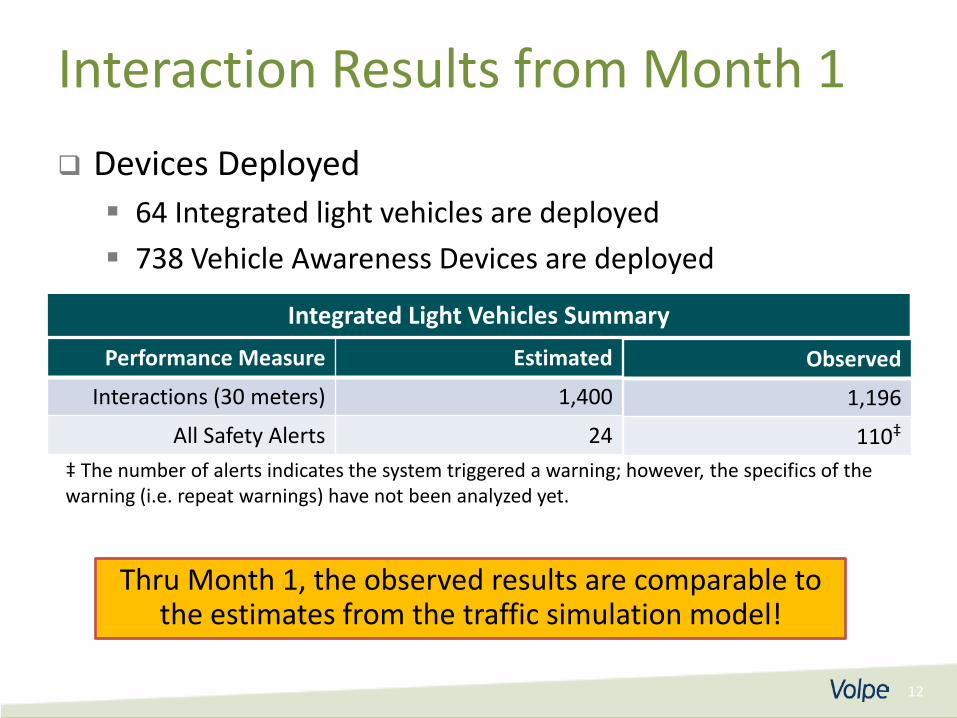
Interaction Results from Month 1
Performance Measure Estimated
Interactions (30 meters) 1,400
All Safety Alerts 24
Integrated Light Vehicles Summary
Observed
1,196
110‡
Thru Month 1, the observed results are comparable to the estimates from the traffic simulation model!
Devices Deployed 64 Integrated light vehicles are deployed 738 Vehicle Awareness Devices are deployed
‡ The number of alerts indicates the system triggered a warning; however, the specifics of the warning (i.e. repeat warnings) have not been analyzed yet.
13
Conclusion Observed results from the field are
comparable with the simulated estimates Simulation Model estimated that the Model
Deployment will generate sufficient data for evaluation
The results so far indicate that enough data will be collected for the evaluation!