Embed Size (px)
Citation preview
Kirk A. Grimmelsman
Ph.D. Thesis Defense Presentation
Experimental Characterization of the Towers in Cable-Supported Bridges by Ambient Vibration Testing
Advisor: Dr. A.E. Aktan
Committee Members: Drs. Aktan, Awerbuch, Lau, Moon, Tan
December 11, 2006
Presentation Outline
• Introduction
• Research Design
• Characterization of Brooklyn Tower by conventional approach
• Characterization of a Cantilever Beam
• Analytical Study of Brooklyn Bridge
• Rigorous Characterization of Brooklyn Tower
• Conclusions & Recommendations
• Significance of Research
• Future Work
Introduction
• Cable-supported bridges represent special class of very long-span bridges where the global structural system consists of subcomponents with very different stiffness and often very different mass characteristics
• Represent critical economic links and lifeline structures in transportation infrastructure
• Management costs associated with managing these • Management costs associated with managing these structures quite large– Seismic retrofit of Golden Gate Bridge est. $300 Million,
Replacement cost of bridge est. $1.4 Billion (Civil Eng. Magazine, Nov. 2000).
• Reliability and cost effectiveness of management decisions negatively impacted by uncertainty due to the constructed nature and operational environment of these structures – reduce uncertainty by experimental characterization
Research Motivation
• Significant challenges encountered in experimental characterization of the Brooklyn Bridge towers by ambient vibration testing
• Could identify many results from the measurements -meaningful dynamic properties were obscured by spurious and less relevant results
• Only minimal guidance exists on how to extract the critical • Only minimal guidance exists on how to extract the critical “modes” from the experimental results
• Current data analysis techniques not very robust and do not indicate the level of uncertainty associated with each identified mode
• Fundamental dynamic behavior of tower and its interactions with the spans are not well-understood – key to selecting modes versus spurious or less significant results
Literature Review
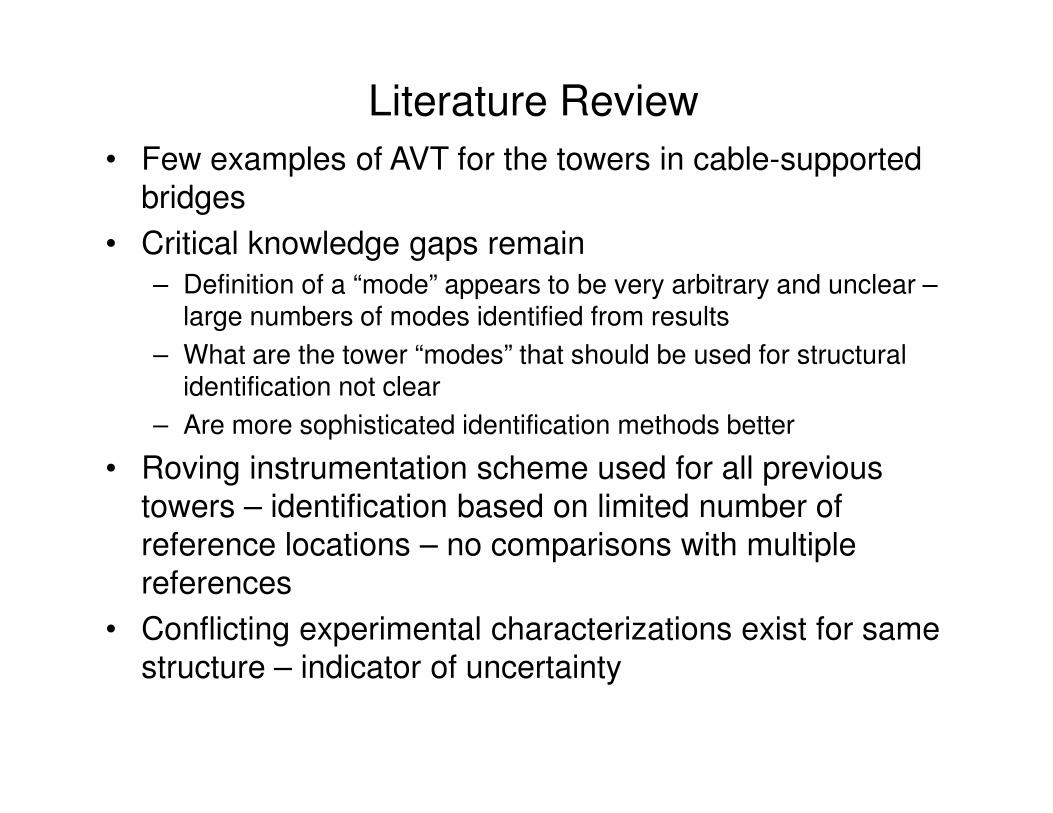
• Few examples of AVT for the towers in cable-supported bridges
• Critical knowledge gaps remain– Definition of a “mode” appears to be very arbitrary and unclear –
large numbers of modes identified from results
– What are the tower “modes” that should be used for structural identification not clear
– Are more sophisticated identification methods better
• Roving instrumentation scheme used for all previous towers – identification based on limited number of reference locations – no comparisons with multiple references
• Conflicting experimental characterizations exist for same structure – indicator of uncertainty
Literature Review
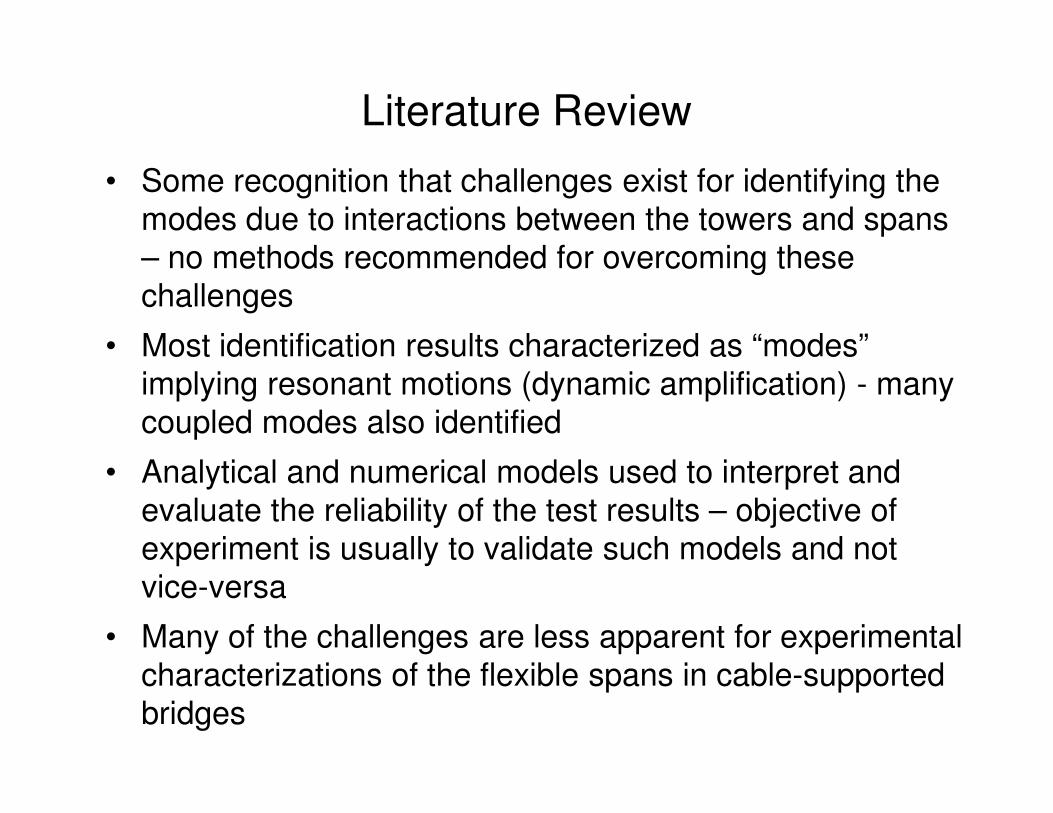
• Some recognition that challenges exist for identifying the modes due to interactions between the towers and spans – no methods recommended for overcoming these challenges
• Most identification results characterized as “modes” implying resonant motions (dynamic amplification) - many coupled modes also identifiedcoupled modes also identified
• Analytical and numerical models used to interpret and evaluate the reliability of the test results – objective of experiment is usually to validate such models and not vice-versa
• Many of the challenges are less apparent for experimental characterizations of the flexible spans in cable-supported bridges
Research Objectives
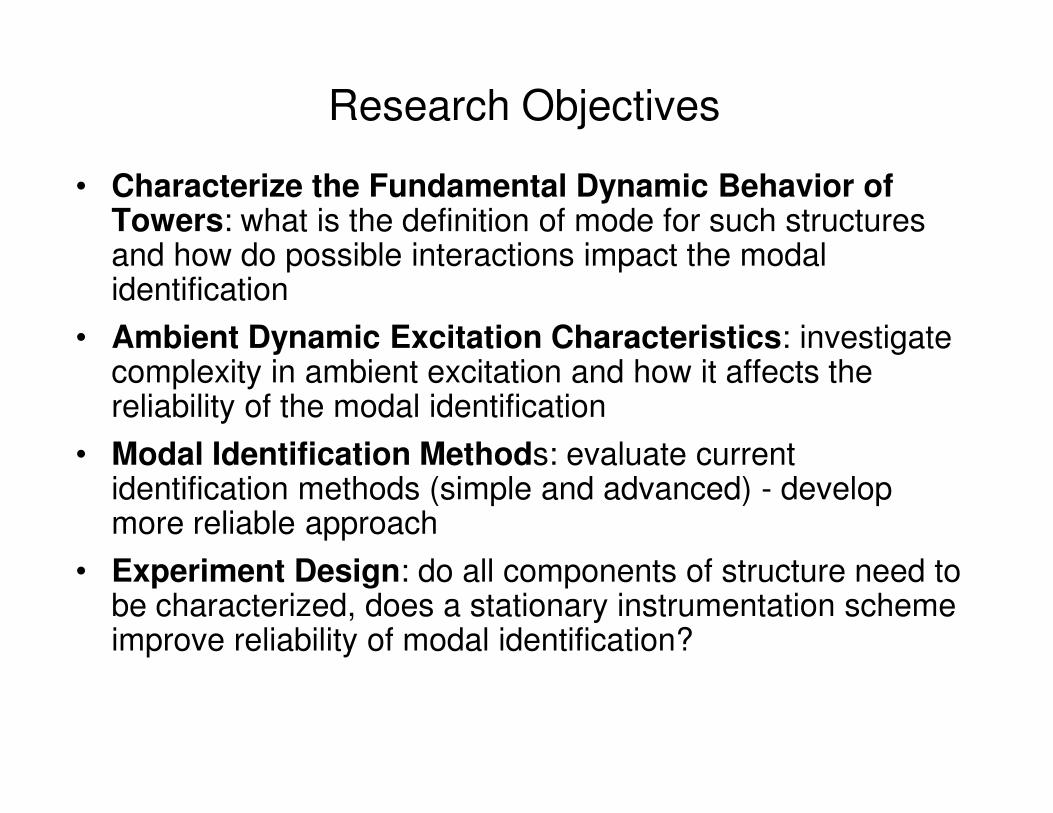
• Characterize the Fundamental Dynamic Behavior of Towers: what is the definition of mode for such structures and how do possible interactions impact the modal identification
• Ambient Dynamic Excitation Characteristics: investigate complexity in ambient excitation and how it affects the reliability of the modal identification reliability of the modal identification
• Modal Identification Methods: evaluate current identification methods (simple and advanced) - develop more reliable approach
• Experiment Design: do all components of structure need to be characterized, does a stationary instrumentation scheme improve reliability of modal identification?
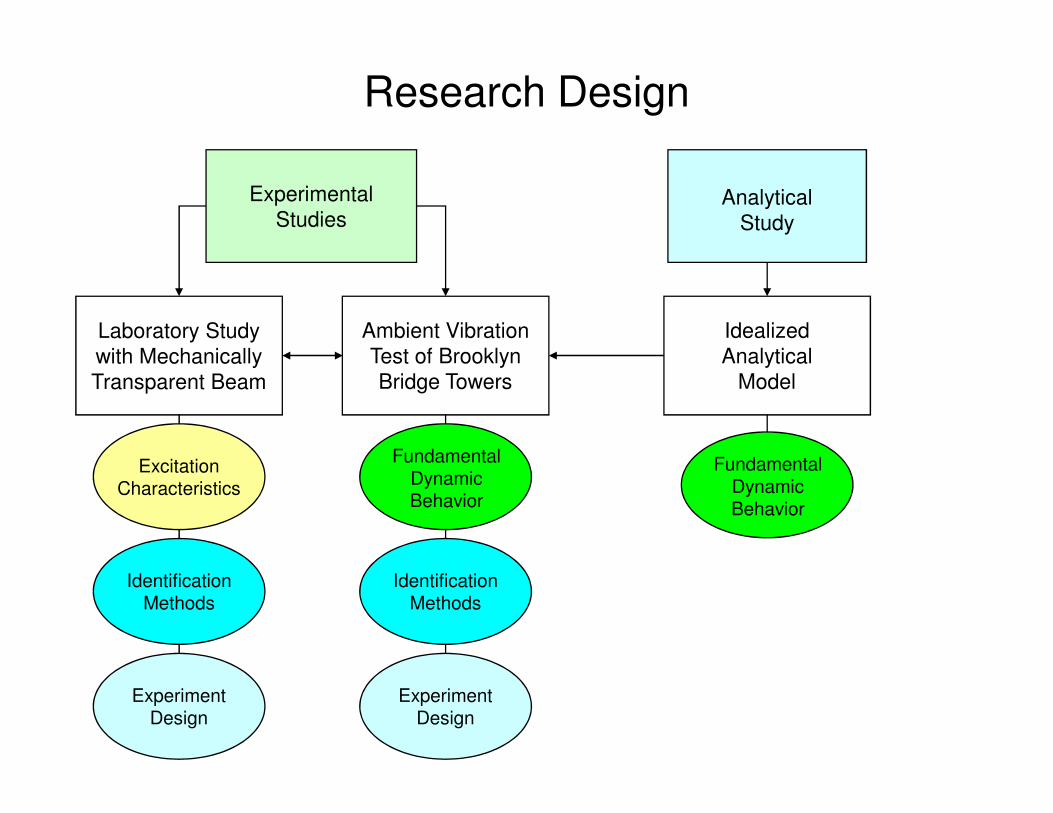
Research Design
Experimental Studies
Analytical Study
Laboratory Study with Mechanically Transparent Beam
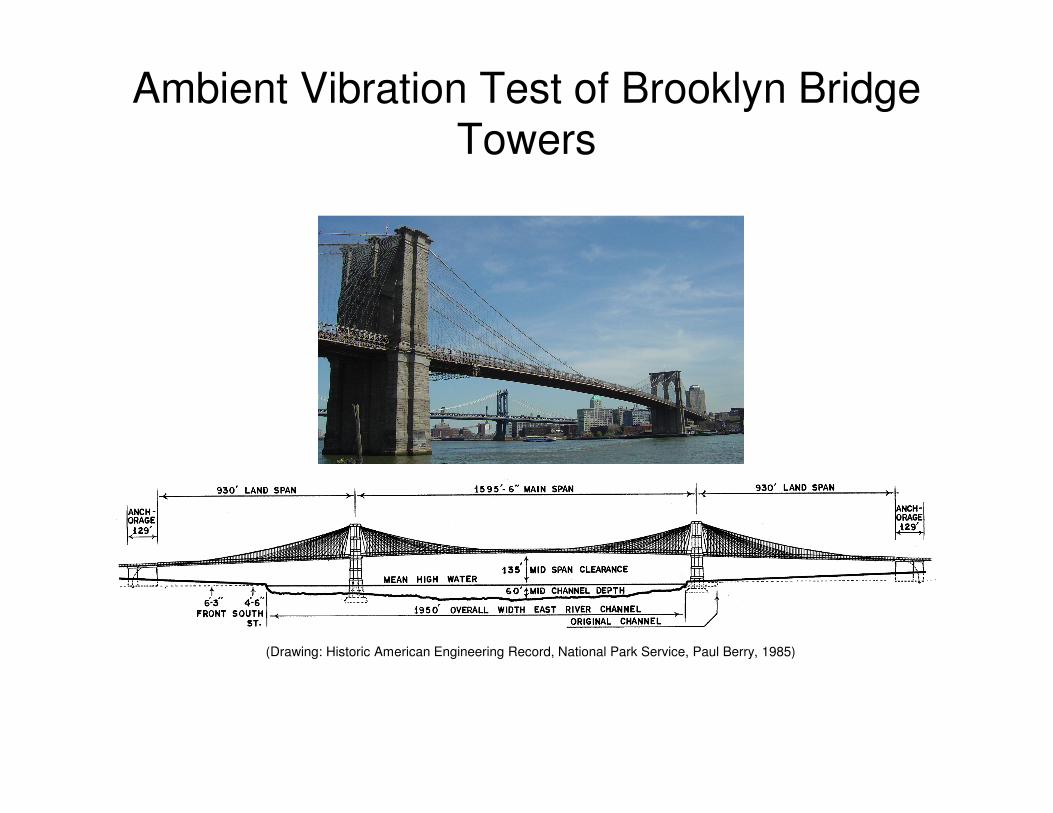
Ambient Vibration Test of Brooklyn Bridge Towers
Idealized Analytical
Model
Excitation Characteristics
Experiment Design
Identification Methods
Identification Methods
Fundamental Dynamic Behavior
Experiment Design
Fundamental Dynamic Behavior
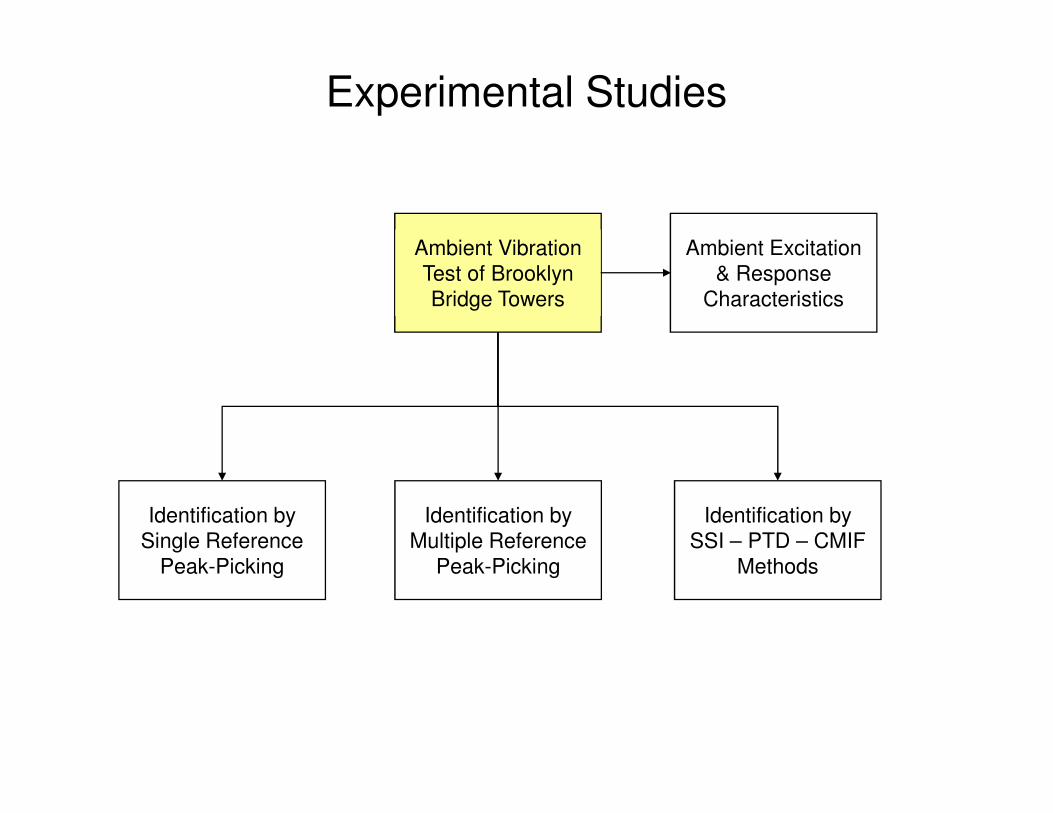
Ambient Vibration Test of Brooklyn Bridge Towers
Experimental Studies
Ambient Excitation & Response
Characteristics
Identification by Single Reference
Peak-Picking
Identification by Multiple Reference
Peak-Picking
Identification by SSI – PTD – CMIF
Methods
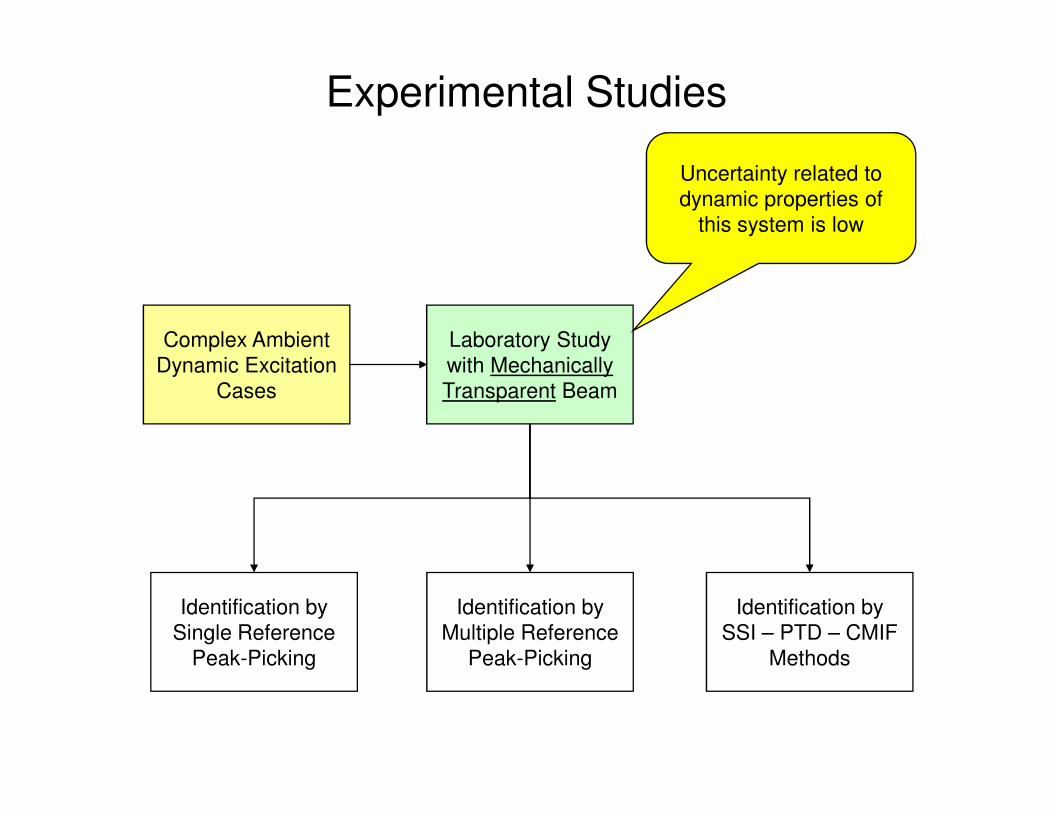
Laboratory Study with Mechanically Transparent Beam
Experimental Studies
Complex Ambient Dynamic Excitation
Cases
Uncertainty related to dynamic properties of
this system is low
Identification by Single Reference
Peak-Picking
Identification by Multiple Reference
Peak-Picking
Identification by SSI – PTD – CMIF
Methods
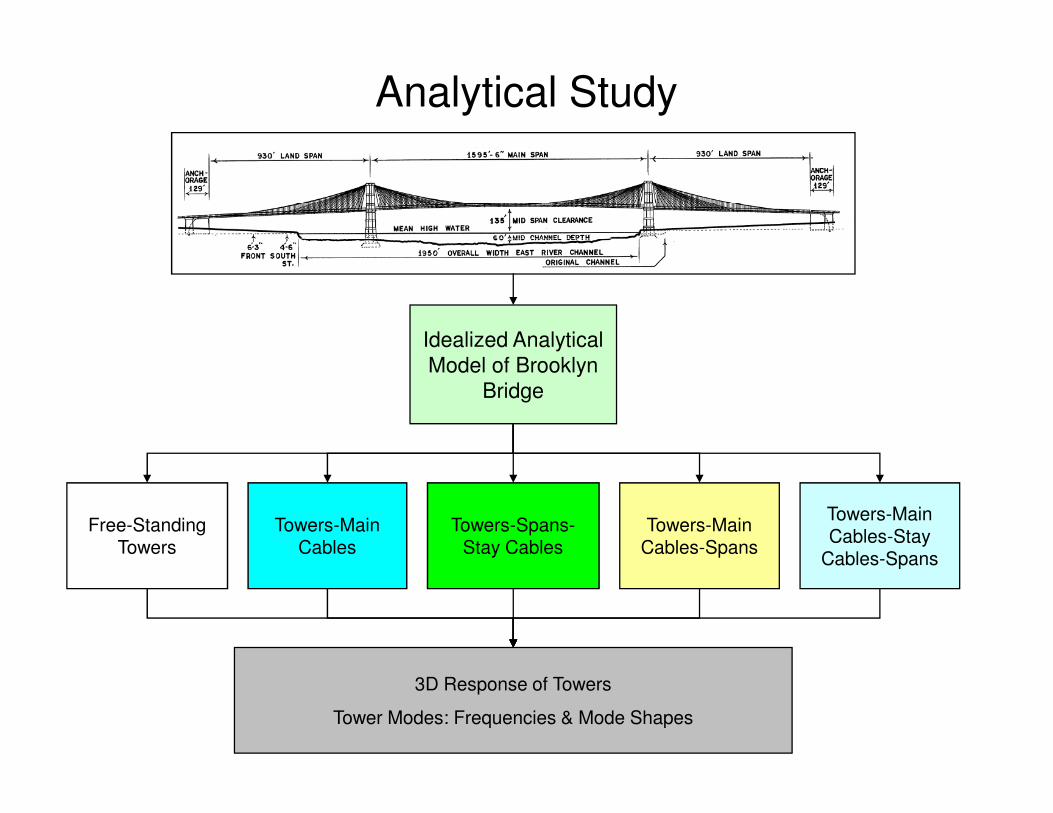
Idealized Analytical Model of Brooklyn
Bridge
Analytical Study
Free-Standing Towers
Towers-Main Cables
Towers-Spans-Stay Cables
Towers-Main Cables-Spans
Towers-Main Cables-Stay
Cables-Spans
3D Response of Towers
Tower Modes: Frequencies & Mode Shapes
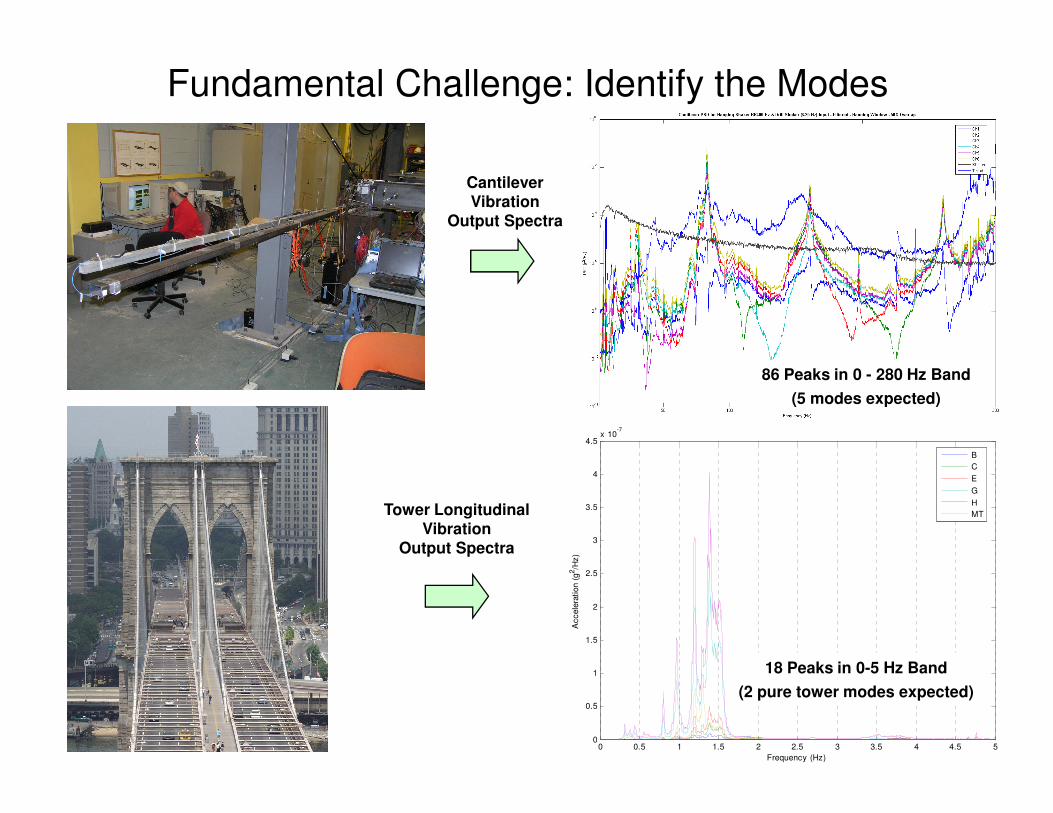
Fundamental Challenge: Identify the Modes
86 Peaks in 0 - 280 Hz Band
(5 modes expected)
Cantilever
VibrationOutput Spectra
0 0.5 1 1.5 2 2.5 3 3.5 4 4.5 50
0.5
1
1.5
2
2.5
3
3.5
4
4.5x 10
-7
Frequency (Hz)
Accele
ration (
g2/H
z)
B
C
E
G
H
MTTower Longitudinal Vibration
Output Spectra
18 Peaks in 0-5 Hz Band
(2 pure tower modes expected)
(5 modes expected)
Ambient Vibration Test of Brooklyn Bridge Towers
(Drawing: Historic American Engineering Record, National Park Service, Paul Berry, 1985)
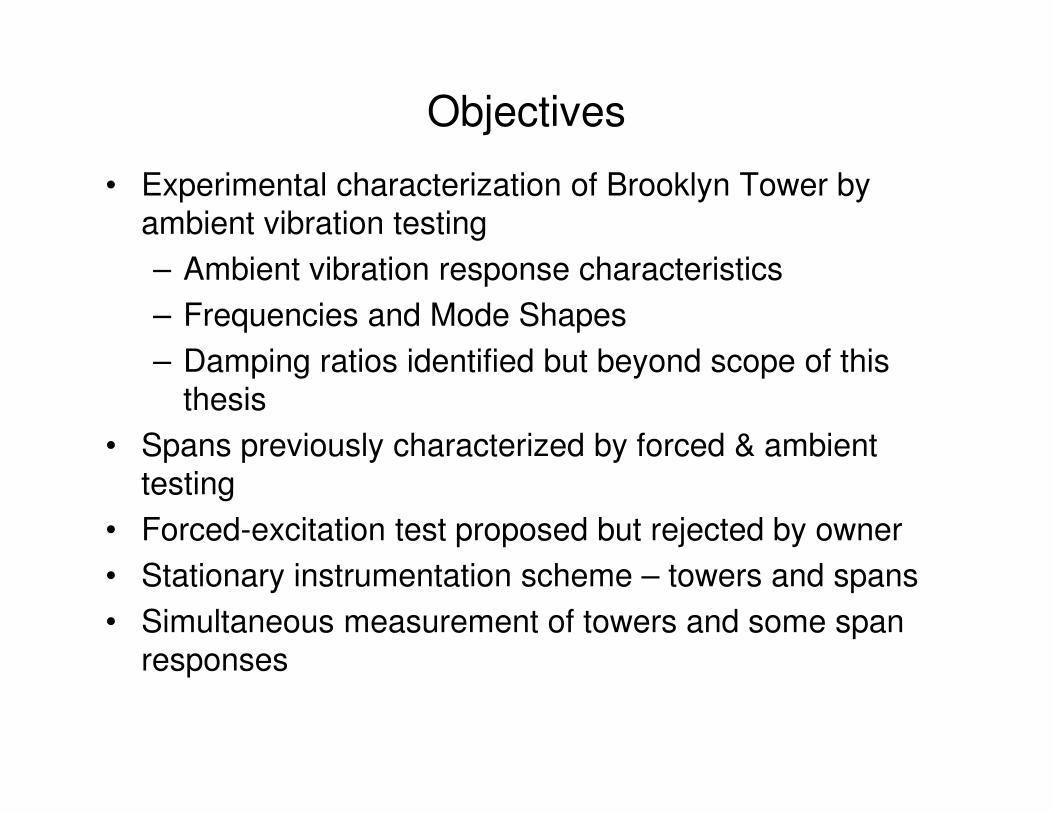
Objectives
• Experimental characterization of Brooklyn Tower by ambient vibration testing
– Ambient vibration response characteristics
– Frequencies and Mode Shapes
– Damping ratios identified but beyond scope of this thesisthesis
• Spans previously characterized by forced & ambient testing
• Forced-excitation test proposed but rejected by owner
• Stationary instrumentation scheme – towers and spans
• Simultaneous measurement of towers and some span responses
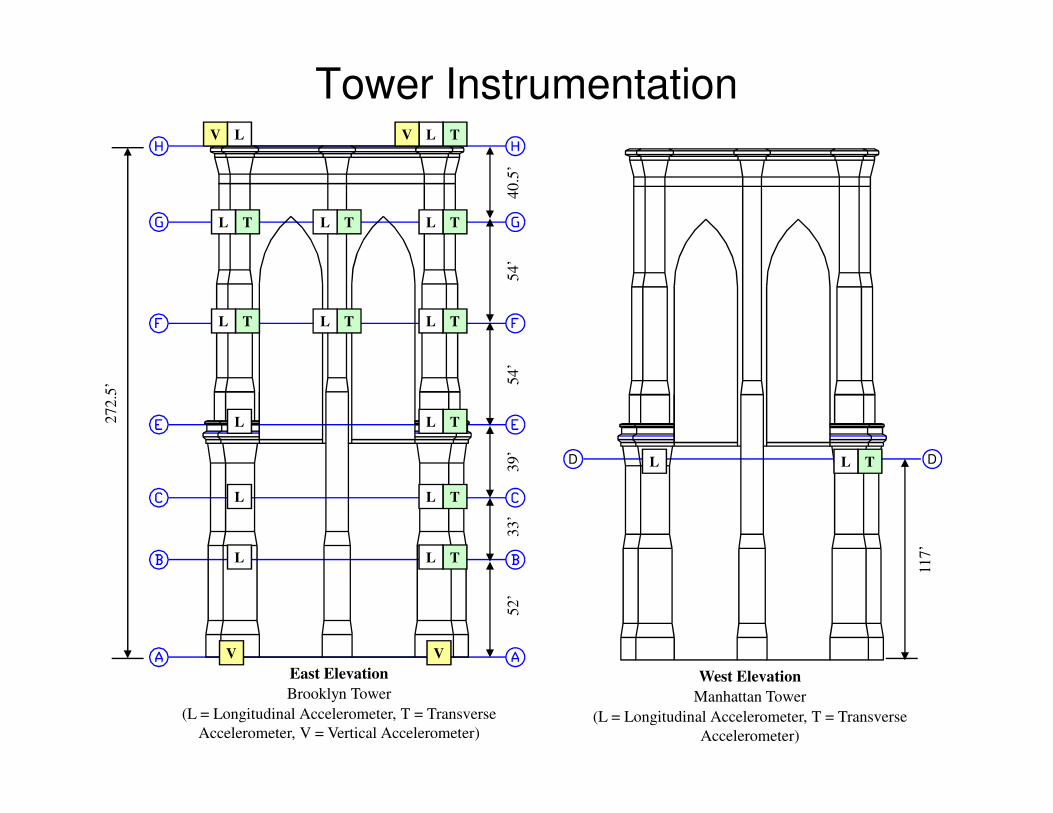
Tower Instrumentation
54’
54’
40.5
’
272.5
’
V TLL V
TLTLTL
TLTLTL
East Elevation
Brooklyn Tower
(L = Longitudinal Accelerometer, T = Transverse
Accelerometer, V = Vertical Accelerometer)
52’
33’
39’
272.5
’
West Elevation
Manhattan Tower
(L = Longitudinal Accelerometer, T = Transverse
Accelerometer)
117’
D D
TLL
TLL
TLL
TLL
V V
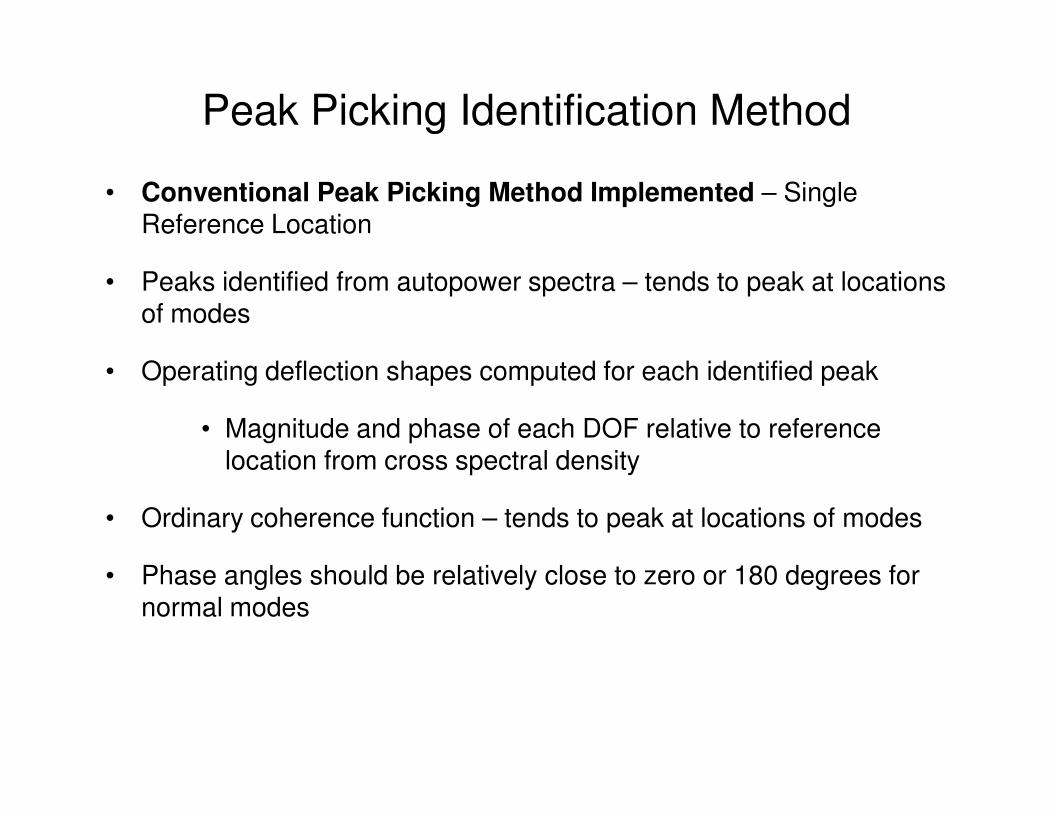
Peak Picking Identification Method
• Conventional Peak Picking Method Implemented – Single Reference Location
• Peaks identified from autopower spectra – tends to peak at locations of modes
• Operating deflection shapes computed for each identified peak
• Magnitude and phase of each DOF relative to reference location from cross spectral density
• Ordinary coherence function – tends to peak at locations of modes
• Phase angles should be relatively close to zero or 180 degrees for normal modes
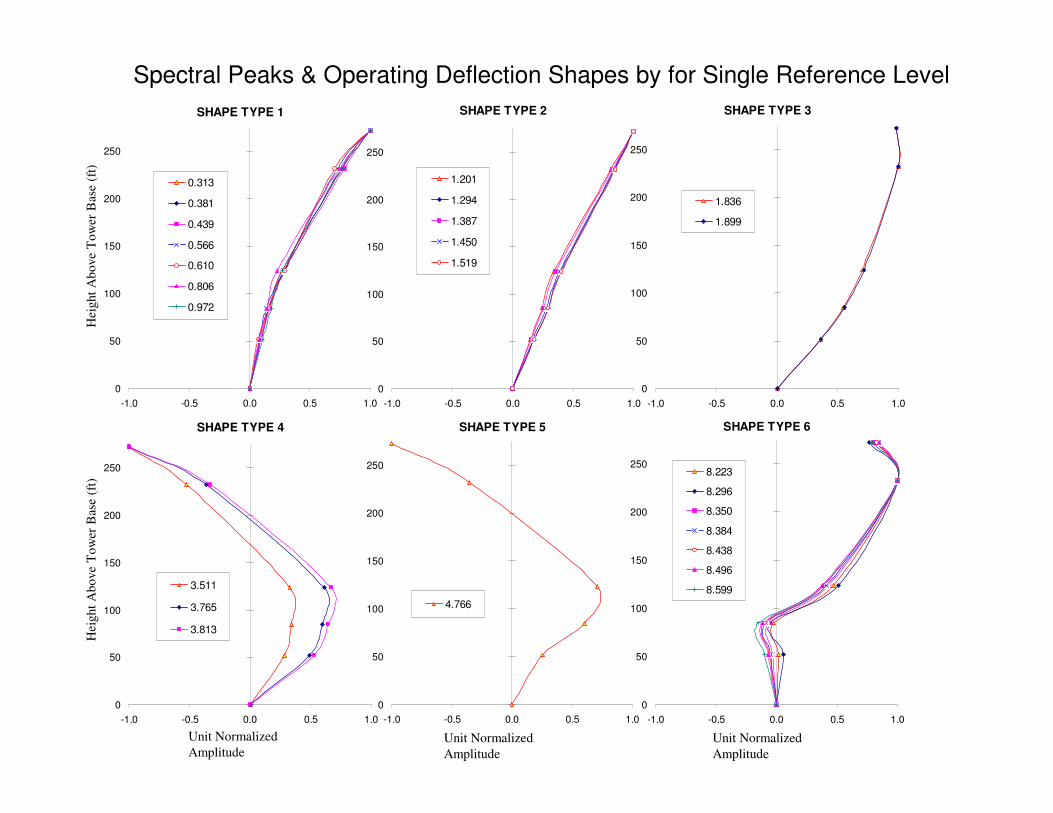
Spectral Peaks & Operating Deflection Shapes by for Single Reference LevelH
eight
Ab
ove
To
wer
Bas
e (f
t)
SHAPE TYPE 1
0
50
100
150
200
250
-1.0 -0.5 0.0 0.5 1.0
0.313
0.381
0.439
0.566
0.610
0.806
0.972
SHAPE TYPE 2
0
50
100
150
200
250
-1.0 -0.5 0.0 0.5 1.0
1.201
1.294
1.387
1.450
1.519
SHAPE TYPE 3
0
50
100
150
200
250
-1.0 -0.5 0.0 0.5 1.0
1.836
1.899
Unit Normalized
AmplitudeUnit Normalized
Amplitude
Hei
ght
Ab
ove
To
wer
Bas
e (f
t)
-1.0 -0.5 0.0 0.5 1.0 -1.0 -0.5 0.0 0.5 1.0 -1.0 -0.5 0.0 0.5 1.0
SHAPE TYPE 4
0
50
100
150
200
250
-1.0 -0.5 0.0 0.5 1.0
3.511
3.765
3.813
SHAPE TYPE 5
0
50
100
150
200
250
-1.0 -0.5 0.0 0.5 1.0
4.766
SHAPE TYPE 6
0
50
100
150
200
250
-1.0 -0.5 0.0 0.5 1.0
8.223
8.296
8.350
8.384
8.438
8.496
8.599
Unit Normalized
Amplitude
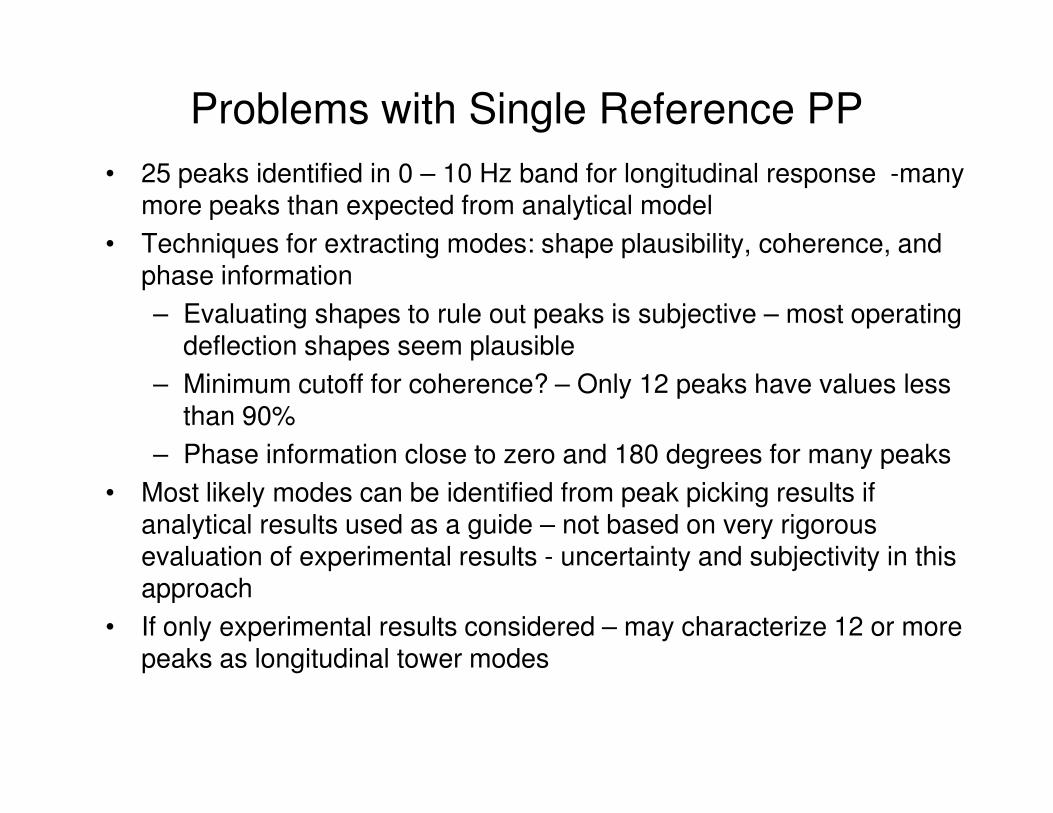
Problems with Single Reference PP
• 25 peaks identified in 0 – 10 Hz band for longitudinal response -many more peaks than expected from analytical model
• Techniques for extracting modes: shape plausibility, coherence, and phase information
– Evaluating shapes to rule out peaks is subjective – most operating deflection shapes seem plausible
– Minimum cutoff for coherence? – Only 12 peaks have values less than 90%than 90%
– Phase information close to zero and 180 degrees for many peaks
• Most likely modes can be identified from peak picking results if analytical results used as a guide – not based on very rigorous evaluation of experimental results - uncertainty and subjectivity in this approach
• If only experimental results considered – may characterize 12 or more peaks as longitudinal tower modes
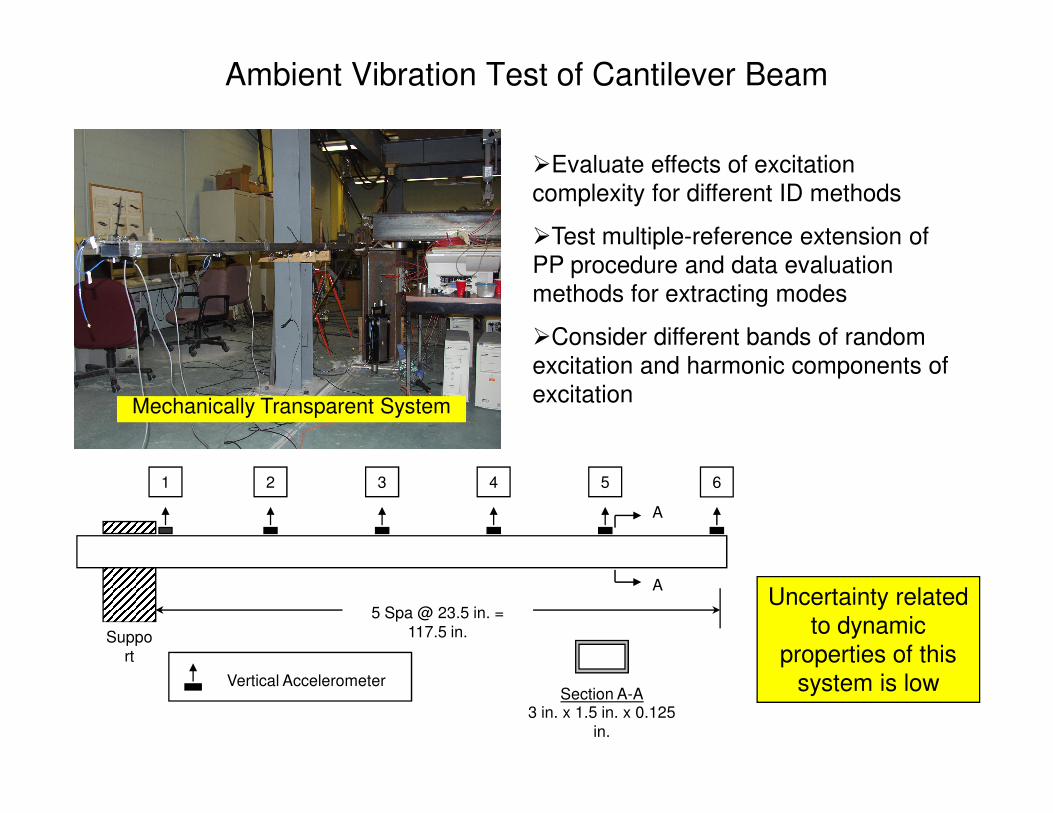
Ambient Vibration Test of Cantilever Beam
Mechanically Transparent System
�Evaluate effects of excitation complexity for different ID methods
�Test multiple-reference extension of PP procedure and data evaluation methods for extracting modes
�Consider different bands of random excitation and harmonic components of excitation
Mechanically Transparent System
A
A
3 in. x 1.5 in. x 0.125 in.
Section A-A
1 2 3 4 5 6
Vertical Accelerometer
5 Spa @ 23.5 in. = 117.5 in.Suppo
rt
excitation
Uncertainty related to dynamic
properties of this system is low
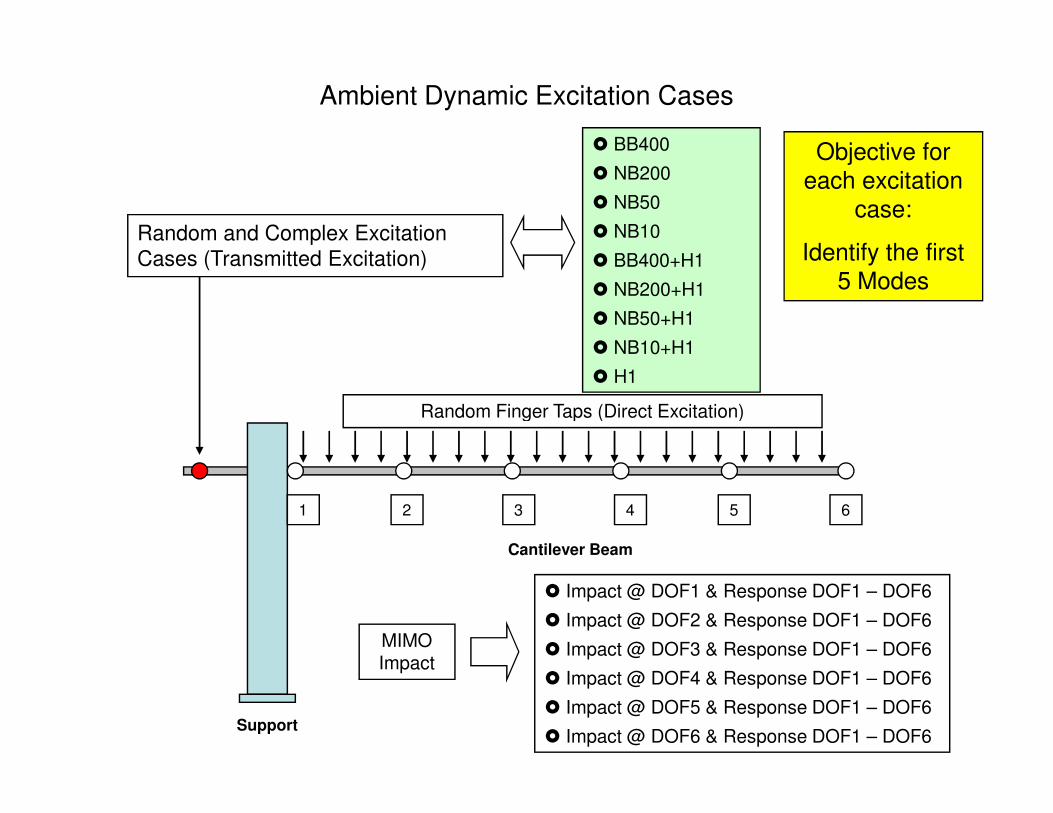
Ambient Dynamic Excitation Cases
Random and Complex Excitation Cases (Transmitted Excitation)
Random Finger Taps (Direct Excitation)
� BB400
� NB200
� NB50
� NB10
� BB400+H1
� NB200+H1
� NB50+H1
� NB10+H1
� H1
Objective for each excitation
case:
Identify the first 5 Modes
Random Finger Taps (Direct Excitation)
Cantilever Beam
Support
MIMO Impact
3 4 5 621
� Impact @ DOF1 & Response DOF1 – DOF6
� Impact @ DOF2 & Response DOF1 – DOF6
� Impact @ DOF3 & Response DOF1 – DOF6
� Impact @ DOF4 & Response DOF1 – DOF6
� Impact @ DOF5 & Response DOF1 – DOF6
� Impact @ DOF6 & Response DOF1 – DOF6
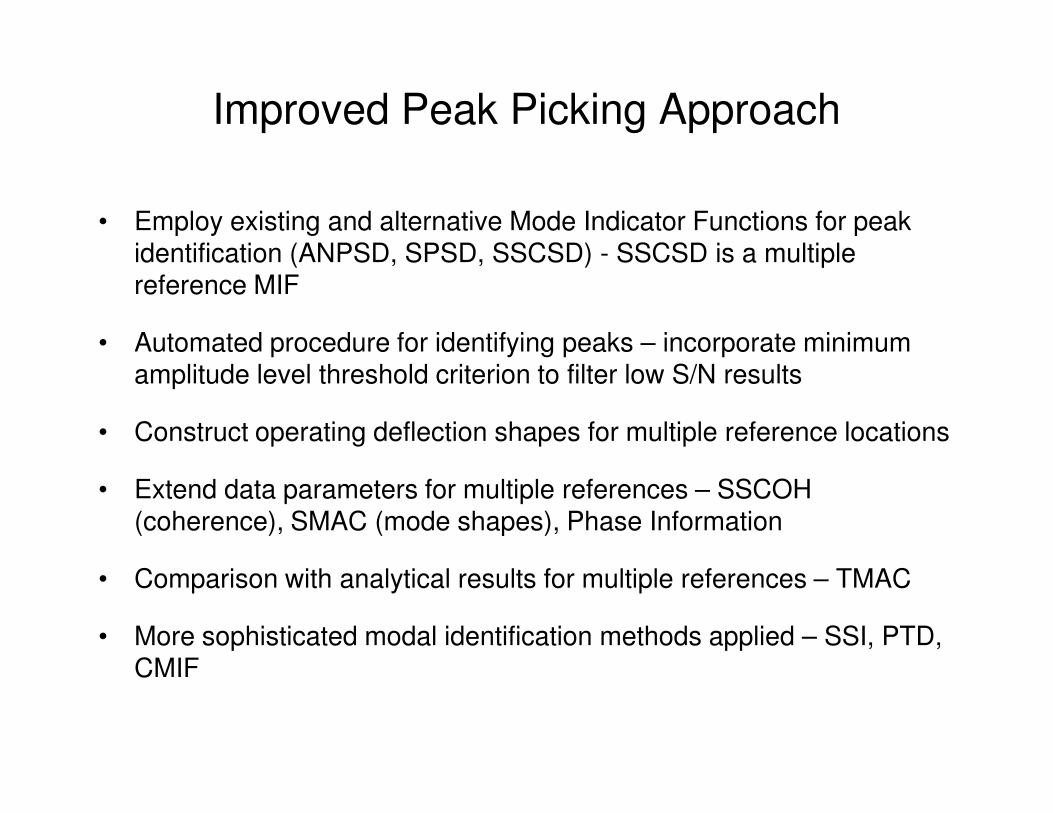
Improved Peak Picking Approach
• Employ existing and alternative Mode Indicator Functions for peak identification (ANPSD, SPSD, SSCSD) - SSCSD is a multiple reference MIF
• Automated procedure for identifying peaks – incorporate minimum amplitude level threshold criterion to filter low S/N results
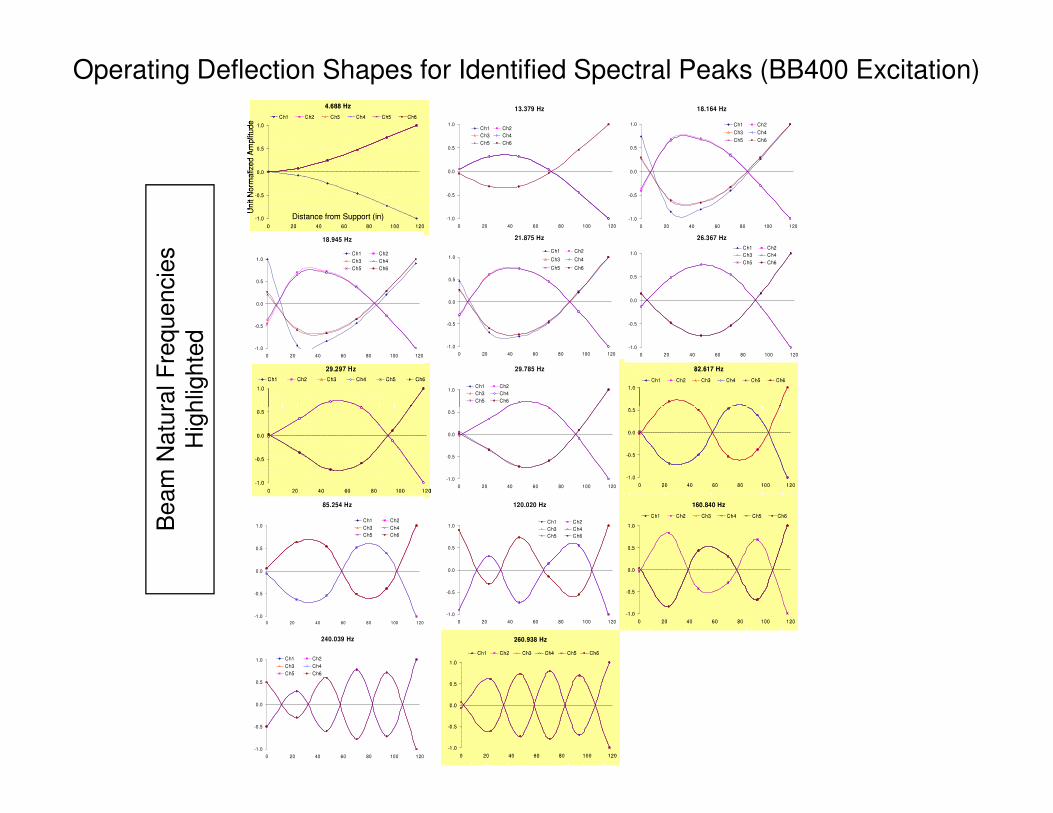
• Construct operating deflection shapes for multiple reference locations
• Extend data parameters for multiple references – SSCOH (coherence), SMAC (mode shapes), Phase Information
• Comparison with analytical results for multiple references – TMAC
• More sophisticated modal identification methods applied – SSI, PTD, CMIF
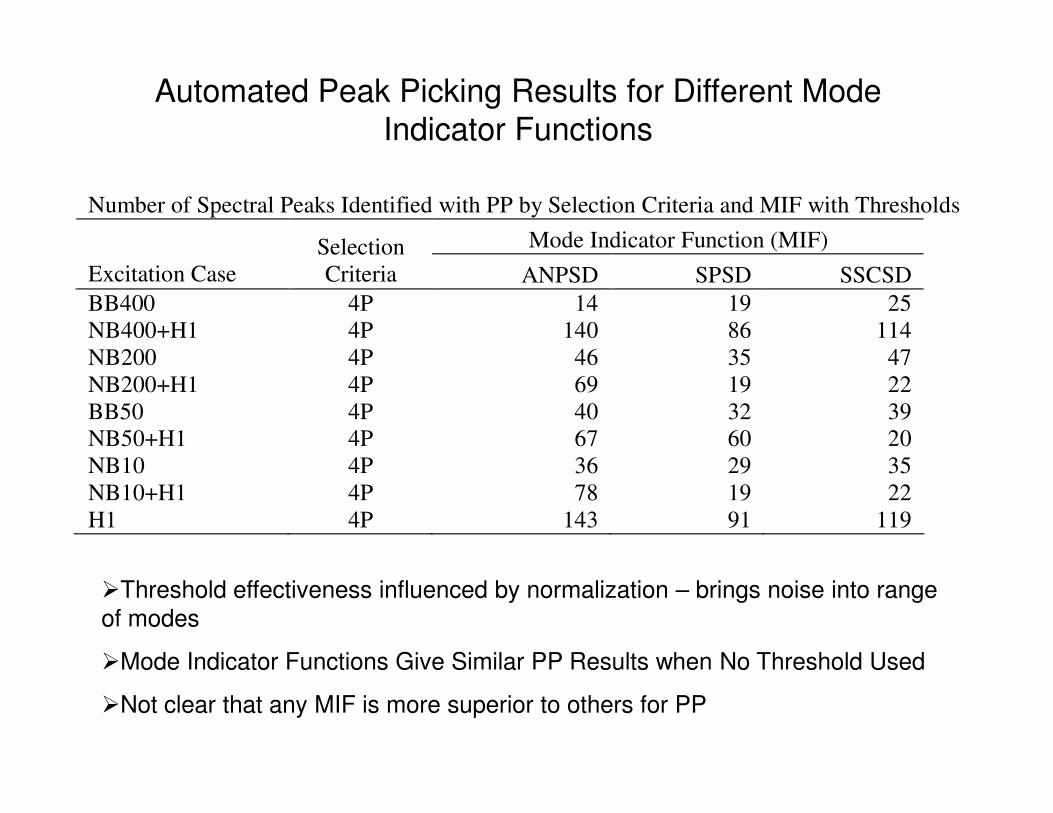
Number of Spectral Peaks Identified with PP by Selection Criteria and MIF with Thresholds
Mode Indicator Function (MIF)
Excitation Case
Selection
Criteria ANPSD SPSD SSCSD
BB400 4P 14 19 25
NB400+H1 4P 140 86 114
NB200 4P 46 35 47
NB200+H1 4P 69 19 22
BB50 4P 40 32 39
Automated Peak Picking Results for Different Mode Indicator Functions
BB50 4P 40 32 39
NB50+H1 4P 67 60 20
NB10 4P 36 29 35
NB10+H1 4P 78 19 22
H1 4P 143 91 119
�Threshold effectiveness influenced by normalization – brings noise into range of modes
�Mode Indicator Functions Give Similar PP Results when No Threshold Used
�Not clear that any MIF is more superior to others for PP
4.688 Hz
-1.0
-0.5
0.0
0.5
1.0
0 20 40 60 80 100 120
Ch1 Ch2 Ch3 Ch4 Ch5 Ch6
Unit
Norm
aliz
ed A
mp
litude
Distance from Support (in)
13.379 Hz
-1.0
-0.5
0.0
0.5
1.0
0 20 40 60 80 100 120
Ch1 Ch2
Ch3 Ch4
Ch5 Ch6
18.164 Hz
-1.0
-0.5
0.0
0.5
1.0
0 20 40 60 80 100 120
Ch1 Ch2
Ch3 Ch4
Ch5 Ch6
29.297 Hz
1.0
Ch1 Ch2 Ch3 Ch4 Ch5 Ch6
29.785 Hz
1.0Ch1 Ch2
Ch3 Ch4
Ch5 Ch6
82.617 Hz
1.0
Ch1 Ch2 Ch3 Ch4 Ch5 Ch6
18.945 Hz
-1.0
-0.5
0.0
0.5
1.0
0 20 40 60 80 100 120
Ch1 Ch2
Ch3 Ch4
Ch5 Ch6
21.875 Hz
-1.0
-0.5
0.0
0.5
1.0
0 20 40 60 80 100 120
Ch1 Ch2
Ch3 Ch4
Ch5 Ch6
26.367 Hz
-1.0
-0.5
0.0
0.5
1.0
0 20 40 60 80 100 120
Ch1 Ch2
Ch3 Ch4
Ch5 Ch6
4.688 Hz
-1.0
-0.5
0.0
0.5
1.0
0 20 40 60 80 100 120
Ch1 Ch2 Ch3 Ch4 Ch5 Ch6
Unit
Norm
aliz
ed A
mp
litude
Distance from Support (in)
4.688 Hz
-1.0
-0.5
0.0
0.5
1.0
0 20 40 60 80 100 120
Ch1 Ch2 Ch3 Ch4 Ch5 Ch6
Unit
Norm
aliz
ed A
mp
litude
Distance from Support (in)
13.379 Hz
-1.0
-0.5
0.0
0.5
1.0
0 20 40 60 80 100 120
Ch1 Ch2
Ch3 Ch4
Ch5 Ch6
18.164 Hz
-1.0
-0.5
0.0
0.5
1.0
0 20 40 60 80 100 120
Ch1 Ch2
Ch3 Ch4
Ch5 Ch6
29.297 Hz
1.0
Ch1 Ch2 Ch3 Ch4 Ch5 Ch6
29.297 Hz
1.0
Ch1 Ch2 Ch3 Ch4 Ch5 Ch6
29.785 Hz
1.0Ch1 Ch2
Ch3 Ch4
Ch5 Ch6
82.617 Hz
1.0
Ch1 Ch2 Ch3 Ch4 Ch5 Ch6
82.617 Hz
1.0
Ch1 Ch2 Ch3 Ch4 Ch5 Ch6
18.945 Hz
-1.0
-0.5
0.0
0.5
1.0
0 20 40 60 80 100 120
Ch1 Ch2
Ch3 Ch4
Ch5 Ch6
21.875 Hz
-1.0
-0.5
0.0
0.5
1.0
0 20 40 60 80 100 120
Ch1 Ch2
Ch3 Ch4
Ch5 Ch6
26.367 Hz
-1.0
-0.5
0.0
0.5
1.0
0 20 40 60 80 100 120
Ch1 Ch2
Ch3 Ch4
Ch5 Ch6
Operating Deflection Shapes for Identified Spectral Peaks (BB400 Excitation)
Beam
Natu
ral F
requencie
s
Hig
hlig
hte
d
-1.0
-0.5
0.0
0.5
0 20 40 60 80 100 120
-1.0
-0.5
0.0
0.5
0 20 40 60 80 100 120
-1.0
-0.5
0.0
0.5
0 20 40 60 80 100 120
160.840 Hz
-1.0
-0.5
0.0
0.5
1.0
0 20 40 60 80 100 120
Ch1 Ch2 Ch3 Ch4 Ch5 Ch6
120.020 Hz
-1.0
-0.5
0.0
0.5
1.0
0 20 40 60 80 100 120
Ch1 Ch2
Ch3 Ch4
Ch5 Ch6
85.254 Hz
-1.0
-0.5
0.0
0.5
1.0
0 20 40 60 80 100 120
Ch1 Ch2
Ch3 Ch4
Ch5 Ch6
240.039 Hz
-1.0
-0.5
0.0
0.5
1.0
0 20 40 60 80 100 120
Ch1 Ch2
Ch3 Ch4
Ch5 Ch6
260.938 Hz
-1.0
-0.5
0.0
0.5
1.0
0 20 40 60 80 100 120
Ch1 Ch2 Ch3 Ch4 Ch5 Ch6
-1.0
-0.5
0.0
0.5
0 20 40 60 80 100 120
-1.0
-0.5
0.0
0.5
0 20 40 60 80 100 120
-1.0
-0.5
0.0
0.5
0 20 40 60 80 100 120
-1.0
-0.5
0.0
0.5
0 20 40 60 80 100 120
-1.0
-0.5
0.0
0.5
0 20 40 60 80 100 120
160.840 Hz
-1.0
-0.5
0.0
0.5
1.0
0 20 40 60 80 100 120
Ch1 Ch2 Ch3 Ch4 Ch5 Ch6
160.840 Hz
-1.0
-0.5
0.0
0.5
1.0
0 20 40 60 80 100 120
Ch1 Ch2 Ch3 Ch4 Ch5 Ch6
120.020 Hz
-1.0
-0.5
0.0
0.5
1.0
0 20 40 60 80 100 120
Ch1 Ch2
Ch3 Ch4
Ch5 Ch6
85.254 Hz
-1.0
-0.5
0.0
0.5
1.0
0 20 40 60 80 100 120
Ch1 Ch2
Ch3 Ch4
Ch5 Ch6
240.039 Hz
-1.0
-0.5
0.0
0.5
1.0
0 20 40 60 80 100 120
Ch1 Ch2
Ch3 Ch4
Ch5 Ch6
260.938 Hz
-1.0
-0.5
0.0
0.5
1.0
0 20 40 60 80 100 120
Ch1 Ch2 Ch3 Ch4 Ch5 Ch6
260.938 Hz
-1.0
-0.5
0.0
0.5
1.0
0 20 40 60 80 100 120
Ch1 Ch2 Ch3 Ch4 Ch5 Ch6
Beam
Natu
ral F
requencie
s
Hig
hlig
hte
d
NB50 – No Peak Pick – Raw Modes Near Mode 5 (increment by delta F)
260.156 Hz
-1.0
-0.5
0.0
0.5
1.0
0 20 40 60 80 100 120
Ch1 Ch2 Ch3 Ch4 Ch5 Ch6
260.254 Hz
-1.0
-0.5
0.0
0.5
1.0
0 20 40 60 80 100 120
Ch1 Ch2 Ch3 Ch4 Ch5 Ch6
260.352 Hz
-1.0
-0.5
0.0
0.5
1.0
0 20 40 60 80 100 120
Ch1 Ch2 Ch3 Ch4 Ch5 Ch6
260.449 Hz
-1.0
-0.5
0.0
0.5
1.0
0 20 40 60 80 100 120
Ch1 Ch2 Ch3 Ch4 Ch5 Ch6
260.547 Hz
-1.0
-0.5
0.0
0.5
1.0
0 20 40 60 80 100 120
Ch1 Ch2 Ch3 Ch4 Ch5 Ch6
260.645 Hz
-1.0
-0.5
0.0
0.5
1.0
0 20 40 60 80 100 120
Ch1 Ch2 Ch3 Ch4 Ch5 Ch6U
nit N
orm
aliz
ed A
mplit
ude
Distance from Support (in)
260.742 Hz
1.0
Ch1 Ch2 Ch3 Ch4 Ch5 Ch6
260.840 Hz
1.0
Ch1 Ch2 Ch3 Ch4 Ch5 Ch6
260.938 Hz
1.0
Ch1 Ch2 Ch3 Ch4 Ch5 Ch6
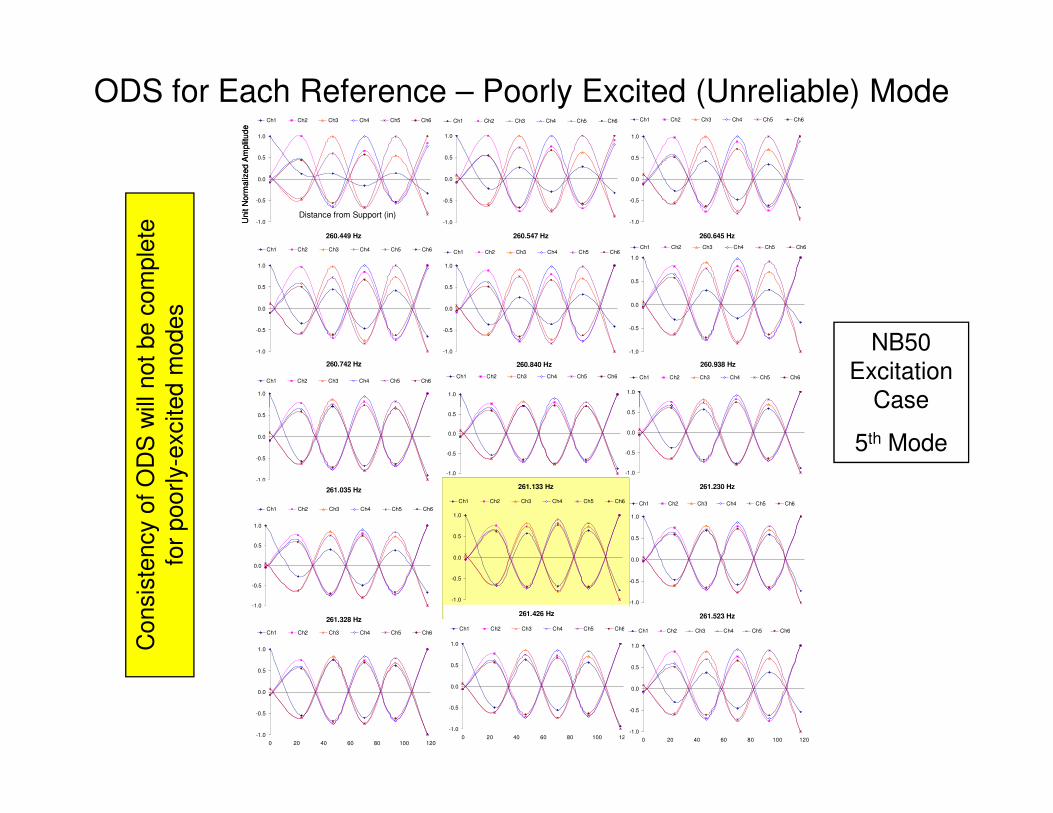
ODS for Each Reference – Poorly Excited (Unreliable) Mode
Consis
tency
of
OD
S w
ill n
ot
be c
om
ple
te
exc
ited m
odes
NB50 Excitation
Case
-1.0
-0.5
0.0
0.5
0 20 40 60 80 100 120
-1.0
-0.5
0.0
0.5
0 20 40 60 80 100 120
-1.0
-0.5
0.0
0.5
0 20 40 60 80 100 120261.230 Hz
-1.0
-0.5
0.0
0.5
1.0
0 20 40 60 80 100 120
Ch1 Ch2 Ch3 Ch4 Ch5 Ch6
261.035 Hz
-1.0
-0.5
0.0
0.5
1.0
0 20 40 60 80 100 120
Ch1 Ch2 Ch3 Ch4 Ch5 Ch6
261.133 Hz
-1.0
-0.5
0.0
0.5
1.0
0 20 40 60 80 100 120
Ch1 Ch2 Ch3 Ch4 Ch5 Ch6
261.328 Hz
-1.0
-0.5
0.0
0.5
1.0
0 20 40 60 80 100 120
Ch1 Ch2 Ch3 Ch4 Ch5 Ch6
261.426 Hz
-1.0
-0.5
0.0
0.5
1.0
0 20 40 60 80 100 120
Ch1 Ch2 Ch3 Ch4 Ch5 Ch6
261.523 Hz
-1.0
-0.5
0.0
0.5
1.0
0 20 40 60 80 100 120
Ch1 Ch2 Ch3 Ch4 Ch5 Ch6
-1.0
-0.5
0.0
0.5
0 20 40 60 80 100 120
-1.0
-0.5
0.0
0.5
0 20 40 60 80 100 120
-1.0
-0.5
0.0
0.5
0 20 40 60 80 100 120261.230 Hz
-1.0
-0.5
0.0
0.5
1.0
0 20 40 60 80 100 120
Ch1 Ch2 Ch3 Ch4 Ch5 Ch6
261.035 Hz
-1.0
-0.5
0.0
0.5
1.0
0 20 40 60 80 100 120
Ch1 Ch2 Ch3 Ch4 Ch5 Ch6
261.133 Hz
-1.0
-0.5
0.0
0.5
1.0
0 20 40 60 80 100 120
Ch1 Ch2 Ch3 Ch4 Ch5 Ch6
261.133 Hz
-1.0
-0.5
0.0
0.5
1.0
0 20 40 60 80 100 120
Ch1 Ch2 Ch3 Ch4 Ch5 Ch6
261.328 Hz
-1.0
-0.5
0.0
0.5
1.0
0 20 40 60 80 100 120
Ch1 Ch2 Ch3 Ch4 Ch5 Ch6
261.426 Hz
-1.0
-0.5
0.0
0.5
1.0
0 20 40 60 80 100 120
Ch1 Ch2 Ch3 Ch4 Ch5 Ch6
261.523 Hz
-1.0
-0.5
0.0
0.5
1.0
0 20 40 60 80 100 120
Ch1 Ch2 Ch3 Ch4 Ch5 Ch6
Consis
tency
of
OD
S w
ill n
ot
be c
om
ple
te
for
poorly-
exc
ited m
odes
Case
5th Mode
Discussion
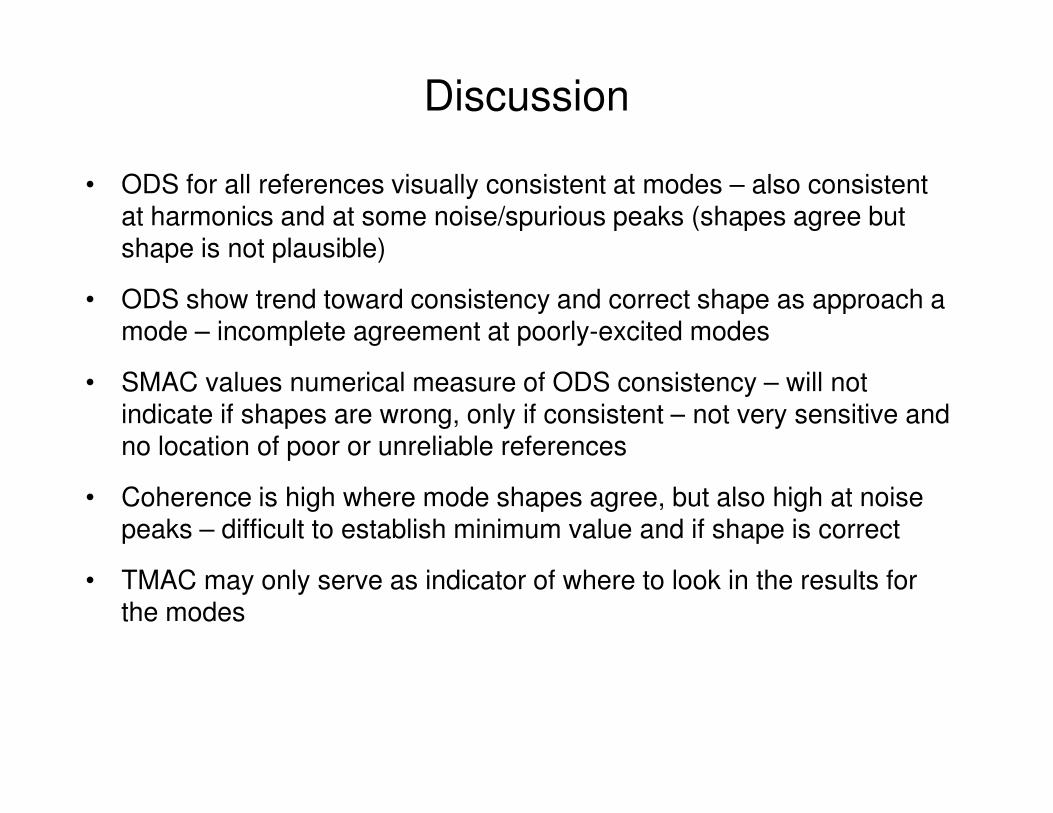
• ODS for all references visually consistent at modes – also consistent at harmonics and at some noise/spurious peaks (shapes agree but shape is not plausible)
• ODS show trend toward consistency and correct shape as approach a mode – incomplete agreement at poorly-excited modes
• SMAC values numerical measure of ODS consistency – will not indicate if shapes are wrong, only if consistent – not very sensitive and indicate if shapes are wrong, only if consistent – not very sensitive and no location of poor or unreliable references
• Coherence is high where mode shapes agree, but also high at noise peaks – difficult to establish minimum value and if shape is correct
• TMAC may only serve as indicator of where to look in the results for the modes
Discussion
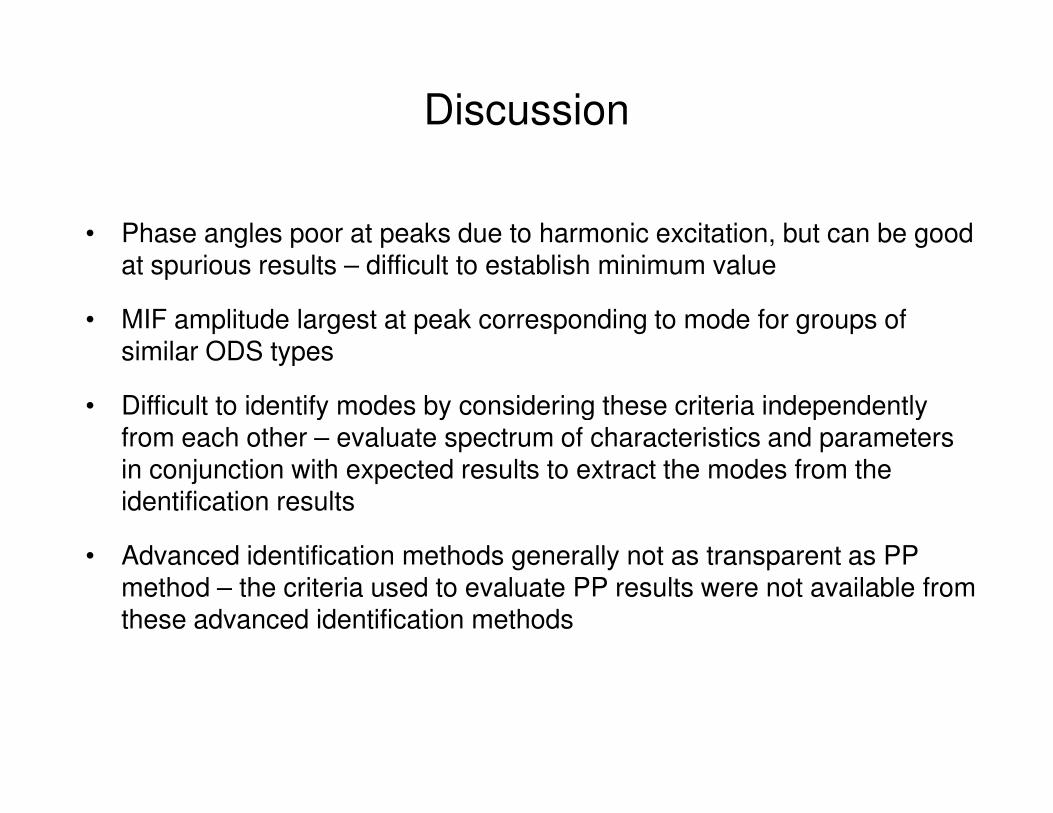
• Phase angles poor at peaks due to harmonic excitation, but can be good at spurious results – difficult to establish minimum value
• MIF amplitude largest at peak corresponding to mode for groups of similar ODS types
• Difficult to identify modes by considering these criteria independently • Difficult to identify modes by considering these criteria independently from each other – evaluate spectrum of characteristics and parameters in conjunction with expected results to extract the modes from the identification results
• Advanced identification methods generally not as transparent as PP method – the criteria used to evaluate PP results were not available from these advanced identification methods
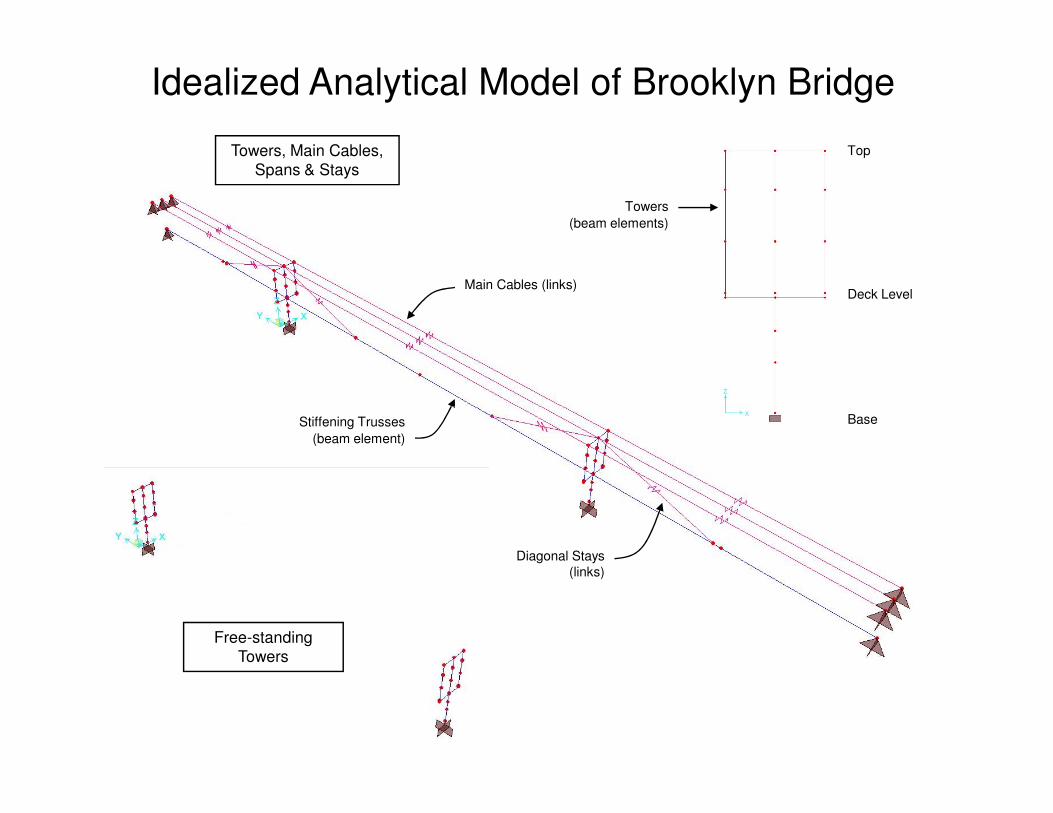
Main Cables (links)
Towers
(beam elements)
Towers, Main Cables, Spans & Stays
Deck Level
Top
Idealized Analytical Model of Brooklyn Bridge
Diagonal Stays (links)
Stiffening Trusses
(beam element)
Free-standing Towers
Base
150
200
250
150
200
250
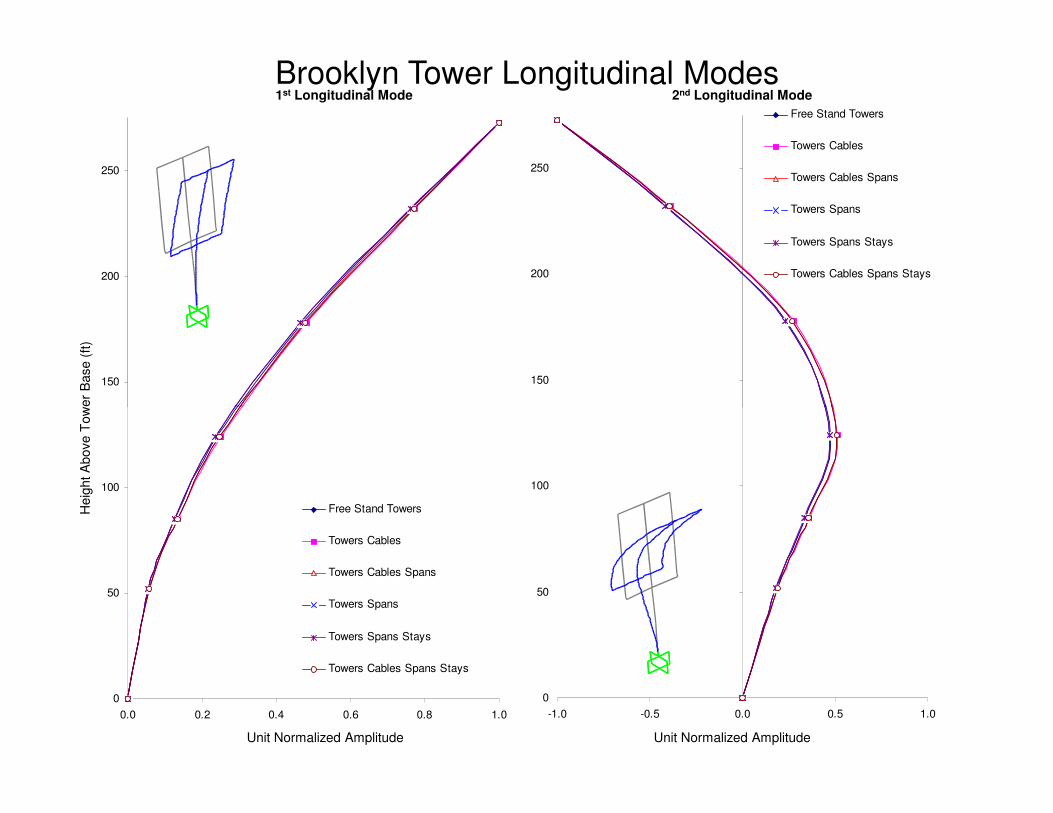
Free Stand Towers
Towers Cables
Towers Cables Spans
Towers Spans
Towers Spans Stays
Towers Cables Spans Stays
1st Longitudinal Mode 2nd Longitudinal ModeH
eig
ht A
bove
Tow
er
Base (
ft)
Brooklyn Tower Longitudinal Modes
0
50
100
0.0 0.2 0.4 0.6 0.8 1.0
Free Stand Towers
Towers Cables
Towers Cables Spans
Towers Spans
Towers Spans Stays
Towers Cables Spans Stays
0
50
100
-1.0 -0.5 0.0 0.5 1.0
Unit Normalized Amplitude Unit Normalized Amplitude
Heig
ht A
bove
Tow
er
Base (
ft)
40.0
50.0
60.0
70.0
80.0
40.0
50.0
60.0
70.0
80.0
40.0
50.0
60.0
70.0
80.0
Heig
ht A
bove
Tow
er
Base (
m)
Heig
ht A
bove
Tow
er
Base (
m)
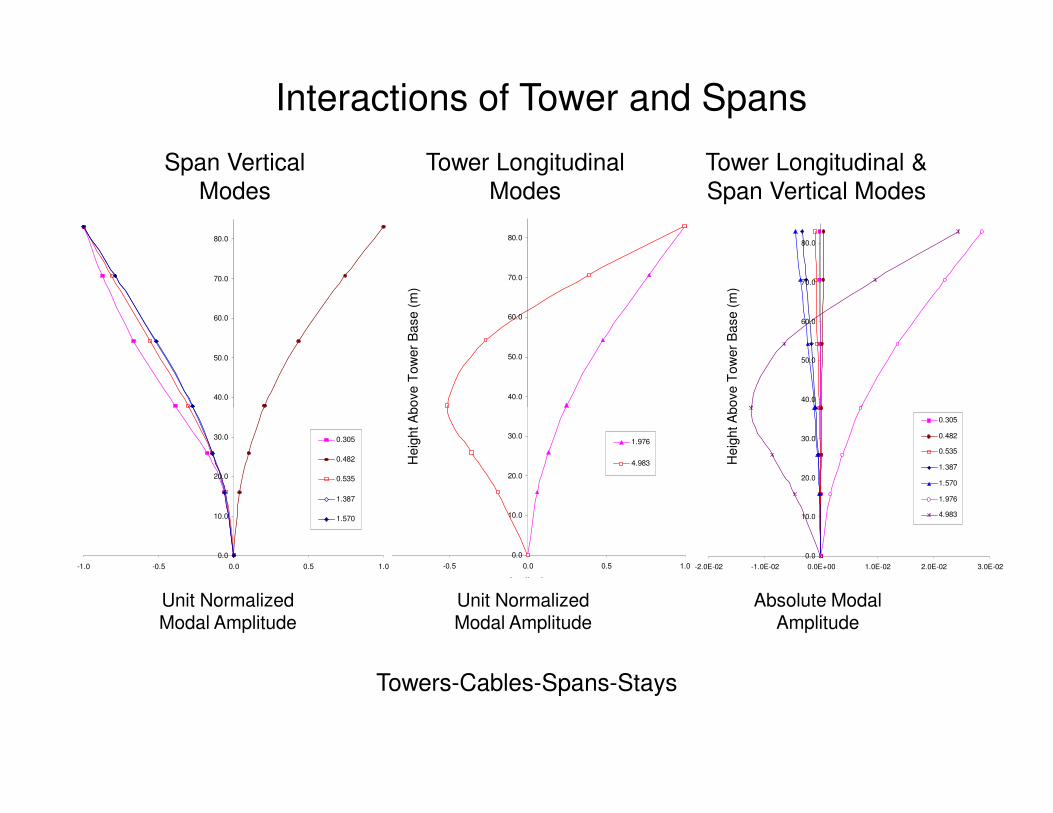
Span Vertical Modes
Tower Longitudinal Modes
Tower Longitudinal & Span Vertical Modes
Interactions of Tower and Spans
0.0
10.0
20.0
30.0
-2.0E-02 -1.0E-02 0.0E+00 1.0E-02 2.0E-02 3.0E-02
0.305
0.482
0.535
1.387
1.570
1.976
4.983
0.0
10.0
20.0
30.0
-1.0 -0.5 0.0 0.5 1.0
Amplitude
1.976
4.983
0.0
10.0
20.0
30.0
-1.0 -0.5 0.0 0.5 1.0
0.305
0.482
0.535
1.387
1.570
Heig
ht A
bove
Tow
er
Base (
m)
Heig
ht A
bove
Tow
er
Base (
m)
Unit Normalized Modal Amplitude
Absolute Modal Amplitude
Unit Normalized Modal Amplitude
Towers-Cables-Spans-Stays
Observations
• Tower modes remain distinct in each model case – frequencies change but shapes generally consistent
• Interaction of towers and spans – insignificant compared to tower response at the tower modes
• 3D response for towers at all modes – usually significant in only one response direction
• Brooklyn Bridge may be characterized as a weakly-coupled dynamic system: Distinct modes (resonance) associated with spans are different from modes associated with Towers – Pure Tower Modes
• Cannot identify towers by only measuring span responses – need to characterize entire structure to validate FE model of cable supported bridge
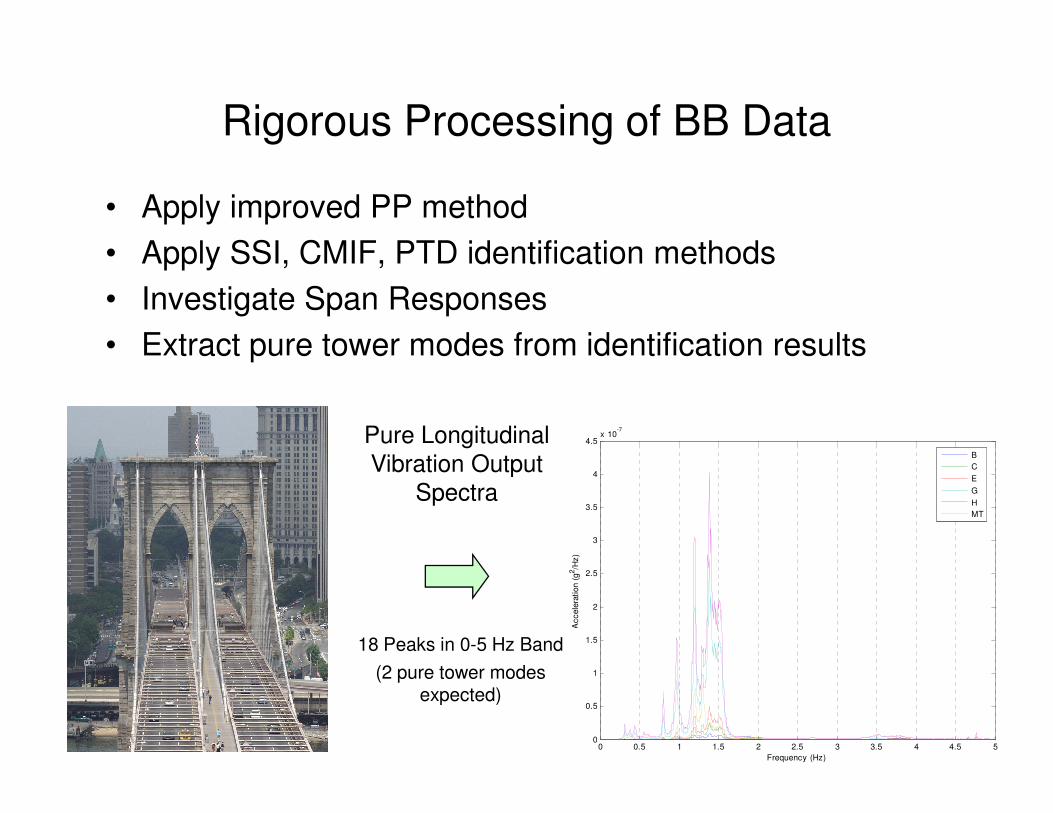
Rigorous Processing of BB Data
• Apply improved PP method
• Apply SSI, CMIF, PTD identification methods
• Investigate Span Responses
• Extract pure tower modes from identification results
0 0.5 1 1.5 2 2.5 3 3.5 4 4.5 50
0.5
1
1.5
2
2.5
3
3.5
4
4.5x 10
-7
Frequency (Hz)
Accele
ration (
g2/H
z)
B
C
E
G
H
MT
Pure Longitudinal Vibration Output
Spectra
18 Peaks in 0-5 Hz Band
(2 pure tower modes expected)
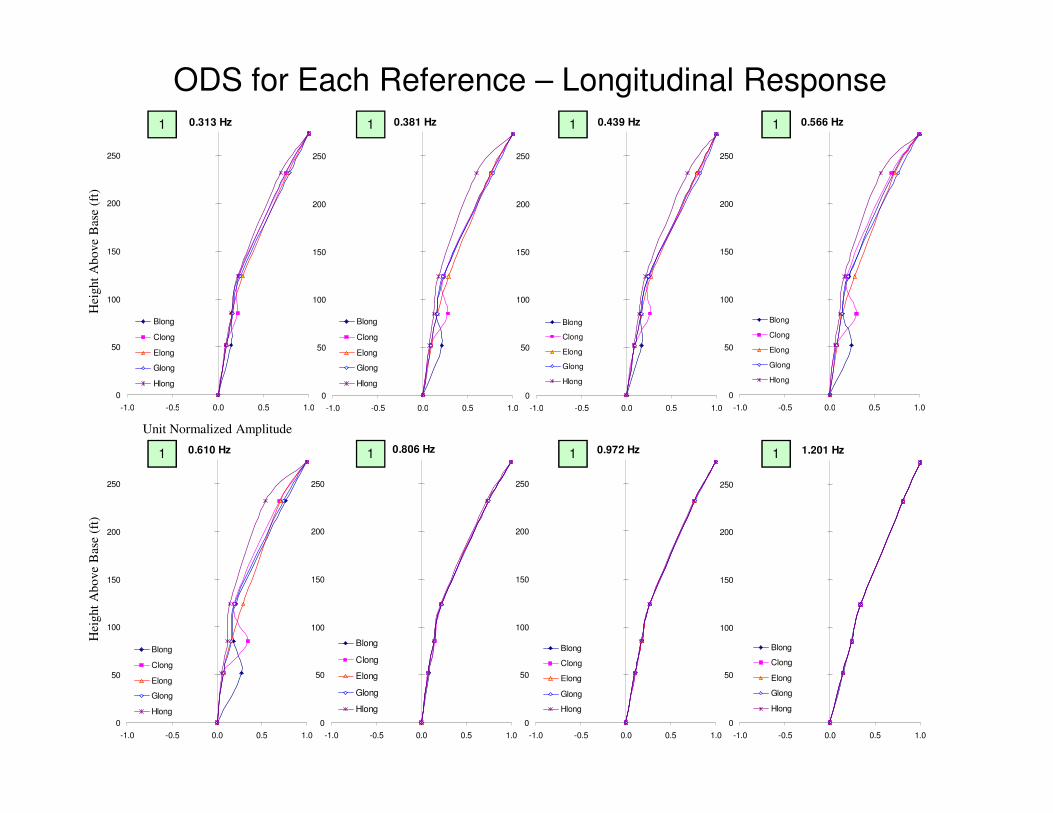
ODS for Each Reference – Longitudinal Response0.313 Hz
0
50
100
150
200
250
-1.0 -0.5 0.0 0.5 1.0
Blong
Clong
Elong
Glong
Hlong
0.381 Hz
0
50
100
150
200
250
-1.0 -0.5 0.0 0.5 1.0
Blong
Clong
Elong
Glong
Hlong
0.439 Hz
0
50
100
150
200
250
-1.0 -0.5 0.0 0.5 1.0
Blong
Clong
Elong
Glong
Hlong
0.566 Hz
0
50
100
150
200
250
-1.0 -0.5 0.0 0.5 1.0
Blong
Clong
Elong
Glong
Hlong
Hei
ght
Ab
ove
Bas
e (f
t)
1 1 1 1
-1.0 -0.5 0.0 0.5 1.0 -1.0 -0.5 0.0 0.5 1.0 -1.0 -0.5 0.0 0.5 1.0 -1.0 -0.5 0.0 0.5 1.0
0.610 Hz
0
50
100
150
200
250
-1.0 -0.5 0.0 0.5 1.0
Blong
Clong
Elong
Glong
Hlong
0.806 Hz
0
50
100
150
200
250
-1.0 -0.5 0.0 0.5 1.0
Blong
Clong
Elong
Glong
Hlong
0.972 Hz
0
50
100
150
200
250
-1.0 -0.5 0.0 0.5 1.0
Blong
Clong
Elong
Glong
Hlong
1.201 Hz
0
50
100
150
200
250
-1.0 -0.5 0.0 0.5 1.0
Blong
Clong
Elong
Glong
Hlong
Unit Normalized Amplitude
Hei
ght
Ab
ove
Bas
e (f
t)
1 1 1 1
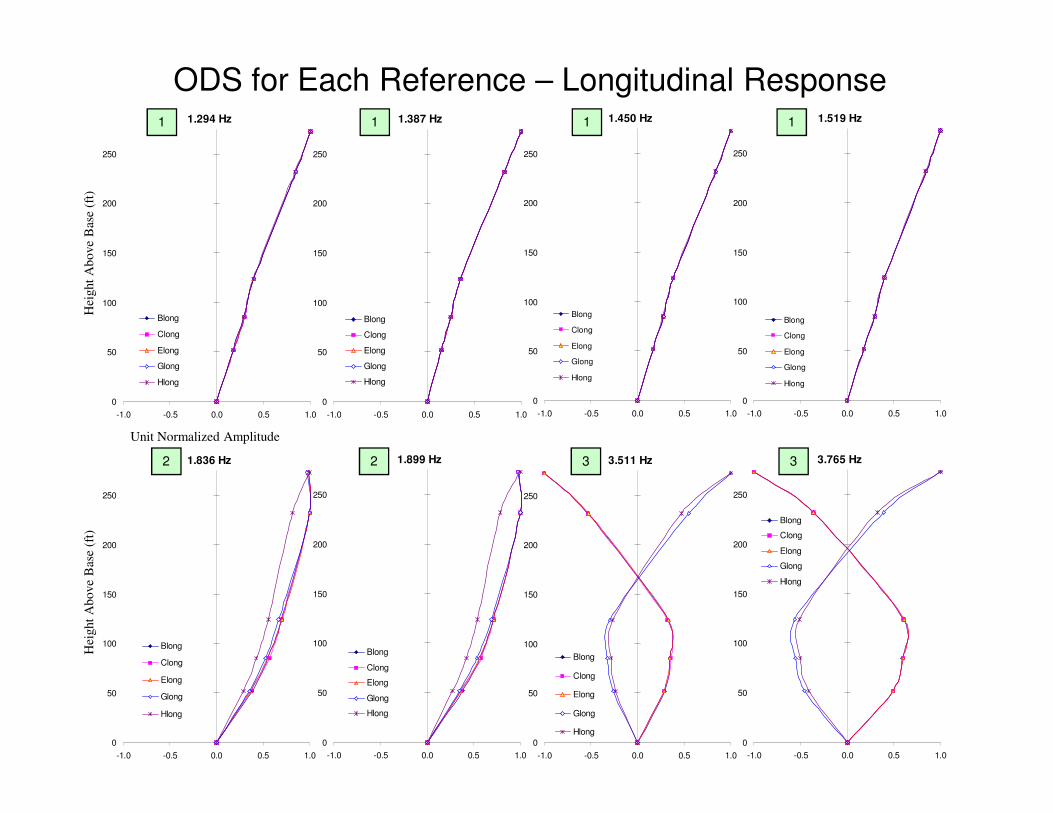
1.294 Hz
0
50
100
150
200
250
Blong
Clong
Elong
Glong
Hlong
1.387 Hz
0
50
100
150
200
250
Blong
Clong
Elong
Glong
Hlong
1.450 Hz
0
50
100
150
200
250
Blong
Clong
Elong
Glong
Hlong
1.519 Hz
0
50
100
150
200
250
Blong
Clong
Elong
Glong
Hlong
Hei
ght
Ab
ove
Bas
e (f
t)
1 1 1 1
ODS for Each Reference – Longitudinal Response
-1.0 -0.5 0.0 0.5 1.0 -1.0 -0.5 0.0 0.5 1.0 -1.0 -0.5 0.0 0.5 1.0 -1.0 -0.5 0.0 0.5 1.0
1.836 Hz
0
50
100
150
200
250
-1.0 -0.5 0.0 0.5 1.0
Blong
Clong
Elong
Glong
Hlong
1.899 Hz
0
50
100
150
200
250
-1.0 -0.5 0.0 0.5 1.0
Blong
Clong
Elong
Glong
Hlong
3.511 Hz
0
50
100
150
200
250
-1.0 -0.5 0.0 0.5 1.0
Blong
Clong
Elong
Glong
Hlong
3.765 Hz
0
50
100
150
200
250
-1.0 -0.5 0.0 0.5 1.0
Blong
Clong
Elong
Glong
Hlong
Unit Normalized Amplitude
Hei
ght
Ab
ove
Bas
e (f
t)
2 2 3 3
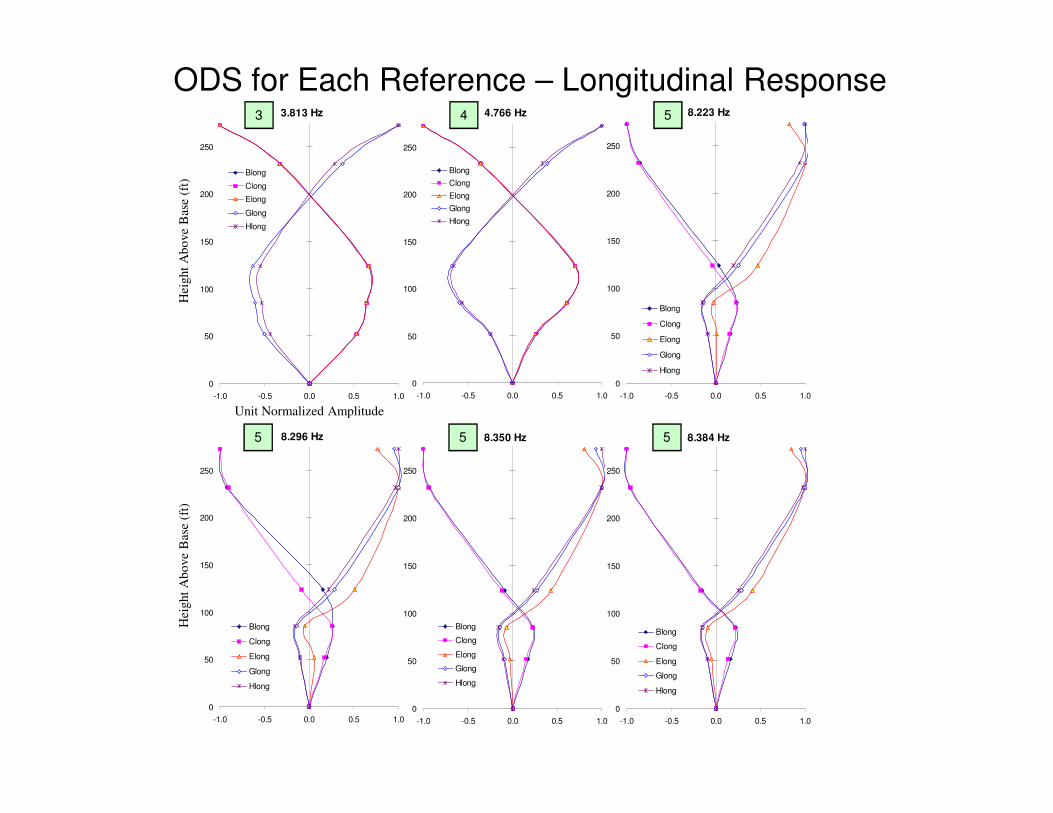
3.813 Hz
0
50
100
150
200
250
-1.0 -0.5 0.0 0.5 1.0
Blong
Clong
Elong
Glong
Hlong
4.766 Hz
0
50
100
150
200
250
-1.0 -0.5 0.0 0.5 1.0
Blong
Clong
Elong
Glong
Hlong
8.223 Hz
0
50
100
150
200
250
-1.0 -0.5 0.0 0.5 1.0
Blong
Clong
Elong
Glong
Hlong
Hei
ght
Ab
ove
Bas
e (f
t)
Unit Normalized Amplitude
3 4 5
ODS for Each Reference – Longitudinal Response
8.296 Hz
0
50
100
150
200
250
-1.0 -0.5 0.0 0.5 1.0
Blong
Clong
Elong
Glong
Hlong
8.350 Hz
0
50
100
150
200
250
-1.0 -0.5 0.0 0.5 1.0
Blong
Clong
Elong
Glong
Hlong
8.384 Hz
0
50
100
150
200
250
-1.0 -0.5 0.0 0.5 1.0
Blong
Clong
Elong
Glong
Hlong
Unit Normalized Amplitude
Hei
ght
Ab
ove
Bas
e (f
t)
5 5 5
Discussion
• Multiple peaks identified no matter which identification method was used
• Most likely modes may be identified by considering spectrum of characteristics and parameters – Peak Amplitude, Coherence, Visual Consistency of ODS, Phase, Experimental MAC, Theoretical MAC
• Analytical model is used as a guide in conjunction with experimental results not in lieu of them
• Span results considered – indicate some tower peaks at span modes –span characterization was generally insufficient to fully assess its span characterization was generally insufficient to fully assess its usefulness for the tower identification
• Peak Picking more transparent identification approach – could evaluate the identified results to subsequently rule out spurious identification results
• Consistency of ODS very effective for ruling out spurious results, but still must consider other characteristics for identifying modes
• Some uncertainty remains in identification results – less a function of data quality than complexity of dynamic behavior
Conclusions
• Fundamental Dynamic Behavior of a Tower in a CSB
� Resonant tower modes distinct in global structural system – the same modes that exist for the free-standing towers can be identified in the dynamic response of the global structure
� Towers participate with span modes and the modal configuration of this participation is similar to tower response at tower modes – similar ODS for resonant and non-resonant oscillations
� Maximum tower responses were associated with the tower modes
� Coupled modes are associated with maximum simultaneous response of multiple components (towers-spans, etc.) – not observed for BB Towers
� Tower responds in multiple directions at all frequencies – response is dominant in one direction – pure tower modes
� Focus of experimental characterization should be pure tower modes (and any coupled modes if they exist)
� Less significant interactions between towers and spans will appear as peaks in the output spectra and can obscure the identification of the critical tower modes
Conclusions
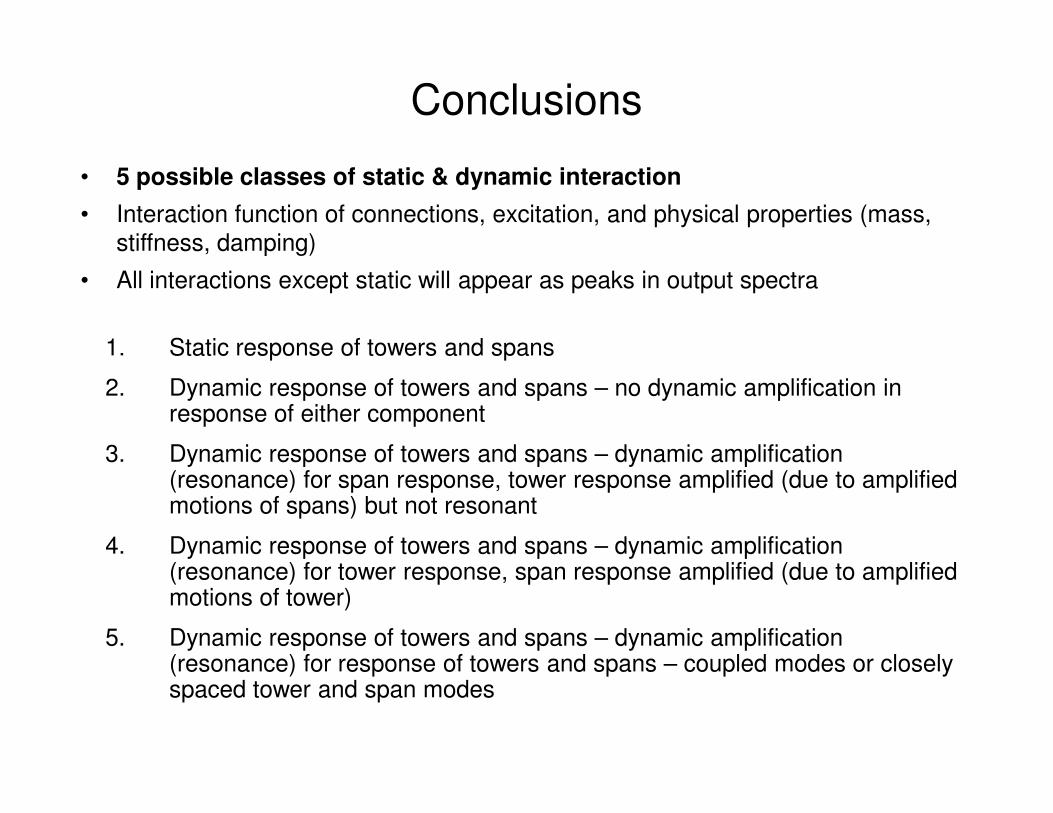
1. Static response of towers and spans
2. Dynamic response of towers and spans – no dynamic amplification in response of either component
• 5 possible classes of static & dynamic interaction
• Interaction function of connections, excitation, and physical properties (mass, stiffness, damping)
• All interactions except static will appear as peaks in output spectra
response of either component
3. Dynamic response of towers and spans – dynamic amplification (resonance) for span response, tower response amplified (due to amplified motions of spans) but not resonant
4. Dynamic response of towers and spans – dynamic amplification (resonance) for tower response, span response amplified (due to amplified motions of tower)
5. Dynamic response of towers and spans – dynamic amplification (resonance) for response of towers and spans – coupled modes or closely spaced tower and span modes
Conclusions
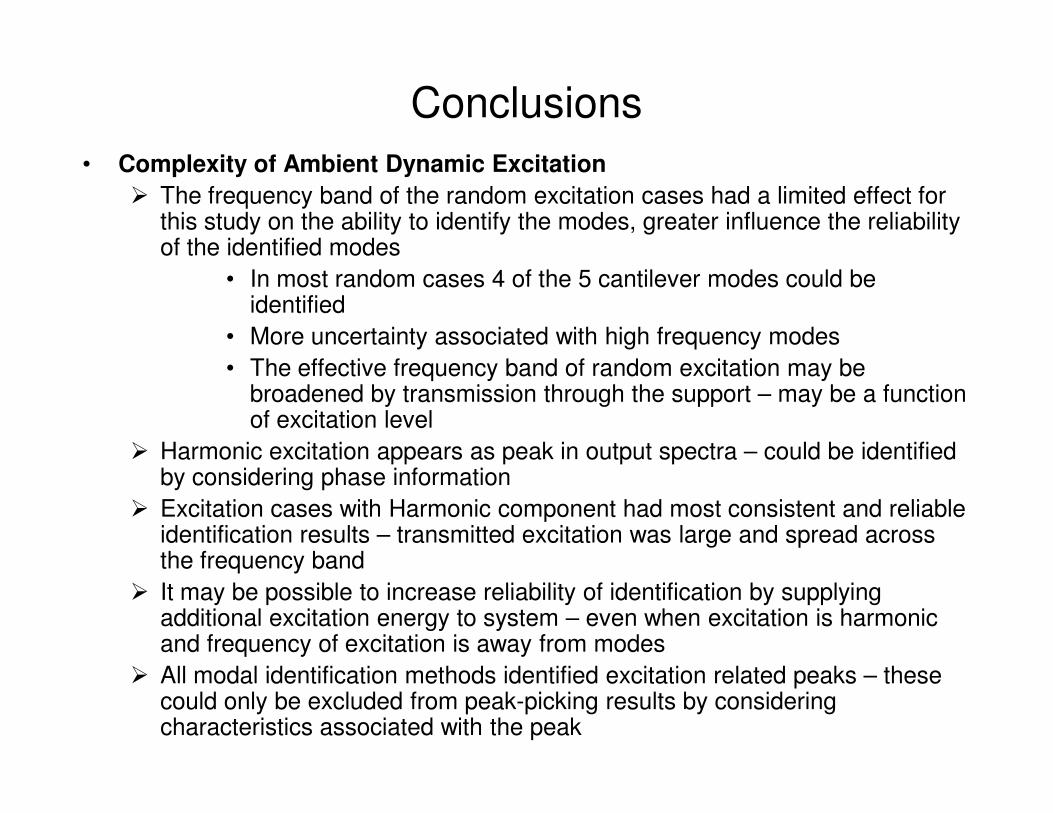
• Complexity of Ambient Dynamic Excitation
� The frequency band of the random excitation cases had a limited effect for this study on the ability to identify the modes, greater influence the reliability of the identified modes
• In most random cases 4 of the 5 cantilever modes could be identified
• More uncertainty associated with high frequency modes
• The effective frequency band of random excitation may be broadened by transmission through the support – may be a function of excitation levelof excitation level
� Harmonic excitation appears as peak in output spectra – could be identified by considering phase information
� Excitation cases with Harmonic component had most consistent and reliable identification results – transmitted excitation was large and spread across the frequency band
� It may be possible to increase reliability of identification by supplying additional excitation energy to system – even when excitation is harmonic and frequency of excitation is away from modes
� All modal identification methods identified excitation related peaks – these could only be excluded from peak-picking results by considering characteristics associated with the peak
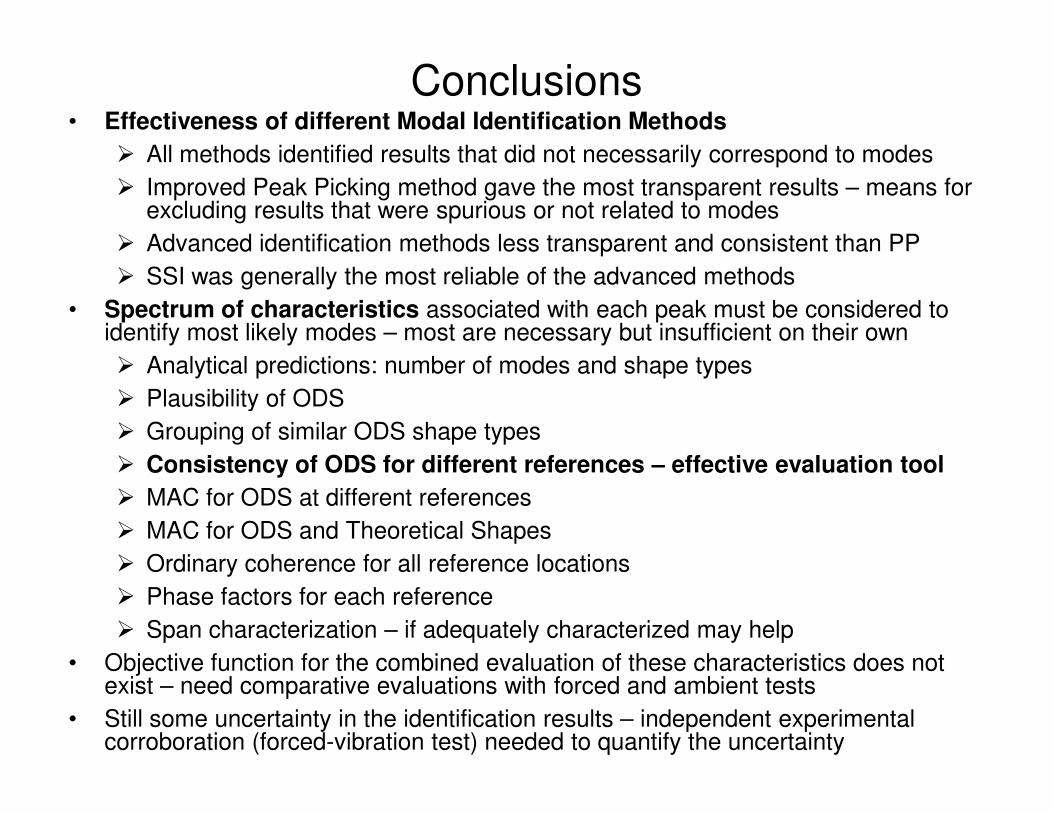
Conclusions• Effectiveness of different Modal Identification Methods
� All methods identified results that did not necessarily correspond to modes
� Improved Peak Picking method gave the most transparent results – means for excluding results that were spurious or not related to modes
� Advanced identification methods less transparent and consistent than PP
� SSI was generally the most reliable of the advanced methods
• Spectrum of characteristics associated with each peak must be considered to identify most likely modes – most are necessary but insufficient on their own
� Analytical predictions: number of modes and shape types
� Plausibility of ODS� Plausibility of ODS
� Grouping of similar ODS shape types
� Consistency of ODS for different references – effective evaluation tool
� MAC for ODS at different references
� MAC for ODS and Theoretical Shapes
� Ordinary coherence for all reference locations
� Phase factors for each reference
� Span characterization – if adequately characterized may help
• Objective function for the combined evaluation of these characteristics does not exist – need comparative evaluations with forced and ambient tests
• Still some uncertainty in the identification results – independent experimental corroboration (forced-vibration test) needed to quantify the uncertainty
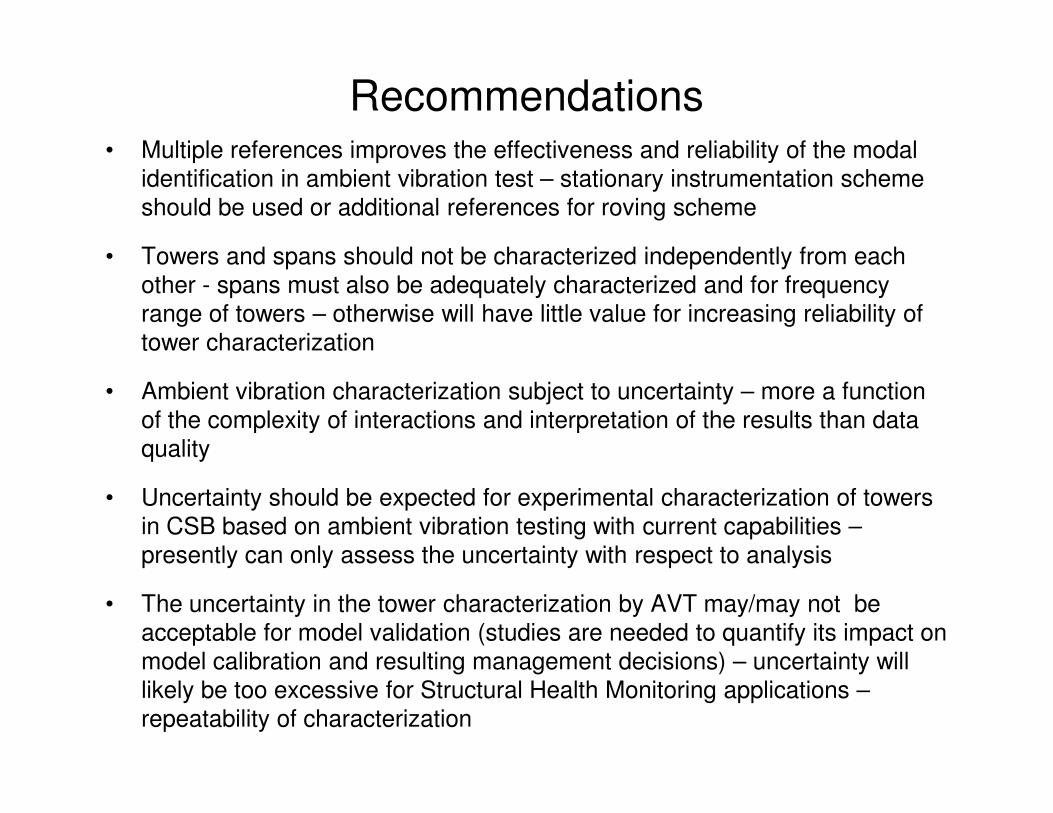
Recommendations• Multiple references improves the effectiveness and reliability of the modal
identification in ambient vibration test – stationary instrumentation scheme should be used or additional references for roving scheme
• Towers and spans should not be characterized independently from each other - spans must also be adequately characterized and for frequency range of towers – otherwise will have little value for increasing reliability of tower characterization
• Ambient vibration characterization subject to uncertainty – more a function of the complexity of interactions and interpretation of the results than data of the complexity of interactions and interpretation of the results than data quality
• Uncertainty should be expected for experimental characterization of towers in CSB based on ambient vibration testing with current capabilities –presently can only assess the uncertainty with respect to analysis
• The uncertainty in the tower characterization by AVT may/may not be acceptable for model validation (studies are needed to quantify its impact on model calibration and resulting management decisions) – uncertainty will likely be too excessive for Structural Health Monitoring applications –repeatability of characterization
Significance of Research
• Problem of modal identification for tower in cable supported bridge has been investigated in a systematic manner
• Fundamental dynamic behavior for the towers has been characterized
– Pure Tower Modes: these are the critical responses
– Coupled Modes: Occur only when there is simultaneous resonance in multiple components or directions – coupled motions not necessarily coupled modes
• Significance of identification problem has been described
– Classification of tower-span interactions – nature of responses – Classification of tower-span interactions – nature of responses established – challenge remains to reliably extract the modes from the results
• Enhancements to basic peak picking method have been proposed and a methodology for evaluating the results to extract the most likely pure tower modes has been proposed and evaluated
• Demonstrated that advanced identification methods are not sufficient for extracting the tower modes – at best may corroborate results from more transparent identification approach
• Consistency of ODS for multiple reference locations has been shown to be an effective filter for improving the reliability of the identification results
Future Work• Comparative evaluation of forced and ambient vibration
characterizations of towers are needed to further evaluate the effectiveness of the PP approach used to extract modes and to quantify the uncertainty associated with the identified modes
– May be accomplished with physical models
– Ultimately must be conducted for full-scale structures
• The static and dynamic interactions of the components has been investigated and classified by evaluating analytical and experimental results for Brooklyn Bridge – more general characterization of the global and component modes should be developed to cover a wider class of structures – physical models