Embed Size (px)
Citation preview
Experimental and Techno-economic Studies of Pipeline Hydro-transport of Agricultural Residue
Biomass to a Biorefinery
by
Mahdi Vaezi
A thesis submitted in partial fulfillment of the requirements for the degree of
Doctor of Philosophy
Department of Mechanical Engineering
University of Alberta
© Mahdi Vaezi, 2014
ii
Abstract
Pipeline hydro-transport of agricultural residue biomass to bio-based energy facilities,
e.g. a bio-refinery, is considered to be a more economically favorable method than truck
delivery. Pipeline hydro-transport not only benefits from economy of scale, but also
reduces the environmental and traffic congestion issues compared to truck delivery. In
this research, a 25 m closed-circuit lab-scale pipeline facility was designed and fabricated
to experimentally investigate pipeline hydro-transport of knife-milled and pre-classified
wheat straw and corn stover agricultural residues. Agricultural residue particle-water
mixtures (or slurries) were prepared over a wide range of particle size, slurry solid mass
content, and slurry bulk velocity, and were pumped into the closed-circuit. Several
morphological and mechanical parameters were measured prior to and during pipelining
agricultural residue particles through the pipeline. The main objectives of the research
were to (1) study the particle size, particle size distribution, and morphological features
of agricultural residue biomass; (2) study the technical feasibility of replacing truck with
pipeline in agricultural residue biomass delivery; (3) experimentally investigate friction
loss and rheological behaviors of agricultural residue biomass slurry through a pipeline at
various slurry solid mass content, slurry bulk velocity, and agricultural residue biomass
particles types and sizes; (4) develop an empirical correlation to predict the agricultural
residue biomass slurry pressure drop across the pipeline; (5) evaluate the performance of
centrifugal slurry pumps handling agricultural residue biomass slurry; and finally (6)
conduct a series of techno-economic analyses on pipeline hydro-transport of agricultural
residue biomass. Based on the results obtained in the study, agricultural residue biomass
particles studied here were found to be fibrous in nature, and the slurry of fibrous
iii
agricultural residue biomass particles exhibited unique drag-reduction characteristics for
more concentrated slurries at elevated velocities. In addition, the proposed empirical
correlation was found capable of precisely predicting the longitudinal pressure gradient
of the flow of agricultural residue biomass slurry in pipes, and the efficiency of the pump
handling small (<3.2 mm) wheat straw particles was found to be more than the efficiency
of the same pump handling pure water only. Finally, all the pipelines hydraulically
transporting agricultural residue biomass with capacities of 1.0 M dry t/yr and more were
found to have lower fixed and incremental costs compared to alternatives of hauling by
truck. The results obtained here would help in optimizing the design and operation of
commercial agricultural residue biomass pipeline hydro-transport processes and the
development of large-scale bio-based energy facilities.
iv
Preface
The pipeline facility referred to in chapter 3 was originally fabricated by H. Safaei and J.
Luk in the Large Scale Fluids Lab and was further modified by me. All other technical
apparatus referred were designed, fabricated, and calibrated by me with the assistance of
Dr. A. Kumar. All of the modeling, data analyses, and concluding remarks in chapters 4
to 8 are my original work, as well as the literature review in chapter 2.
Chapter 3 of this thesis was published as Vaezi, M., Pandey, V., Kumar, A., and
Bhattacharyya, S., ″Lignocellulosic biomass particle shape and size distribution analysis
using digital image processing for pipeline hydro-transportation,″ Biosystems
Engineering, Volume 114 (2013), Pages 97-112. I was responsible for the data collection
and analysis as well as the manuscript composition. V. Pandey assisted with the data
collection. A. Kumar was the supervisory author and was involved with concept
formation and manuscript composition. S. Bhattacharyya was a supervisory author as
well.
Chapter 4 of this thesis was published as Vaezi, M., Katta, A.K., and Kumar, A.,
″Investigation into the mechanisms of pipeline transport of slurries of wheat straw and
corn stover to supply a bio-refinery,″ Biosystems Engineering, Volume 118 (2014), Pages
52–67. I was responsible for the performance of the experiments and analysis of the data
as well as the manuscript composition. A.K. Katta assisted with some viscosity
measurements. A. Kumar was the supervisory author and was involved with concept
formation and manuscript composition.
Chapter 5 of this thesis was published as Vaezi, M. and Kumar, A., ″The flow of wheat
straw suspensions in an open-impeller centrifugal pump,″ Biomass and Bioenergy,
Volume 69 (2014), Pages 106-126. I was responsible for the performance of the
experiments and analysis of the data as well as the manuscript composition. A. Kumar
was the supervisory author and was involved with concept formation and manuscript
composition.

v
This thesis is dedicated to my parents,
Mohammad and Massoumeh,
for their unconditional love, support, and encouragement.

vi
Acknowledgment
First and foremost, I would like to express sincere gratitude to my research supervisor,
Dr. Amit Kumar, without whose endless support, invaluable advice, and active
participation in every step of the process this thesis may never have been completed. Not
only did he give generously of his time and expertise while carrying out the experiments,
he also remained particularly involved while I wrote the papers and this thesis. I have
been extremely fortunate to work with Dr. Kumar, whose enthusiasm for science and
understanding of/kindness to people has set the norm for my future career.
I am thankful to my supervising committee, Dr. Michael Lipsett and Dr. Rajender Gupta.
Their discussions and comments during the candidacy exam were extremely beneficial in
the completion of this thesis.
Special recognition must be given to Prof. Geoff Duffy at The University of Auckland for
offering helpful feedback on the pump performance evaluation, as well as guides and
suggestions on the numerical modeling section of this dissertation.
This work could not have been completed without the support of the staff at the
Department of Mechanical Engineering. Special thanks must be made to Teresa Gray and
Richard Groulx for their administrative support, as well as to Roger Marchand, Rick
Bubenko, and Ryan Shoults at the Machine Shop and Rick Conrad in the Electrical Lab
for their technical advice and all the time spent in my lab to fabricate, program, and
calibrate devices.
I truly appreciate my summer students Vivek Pandey, Rohit Ragupal, Anil Katta, and
Jonathan Down, also my lab assistants Abrar Foad, Tanveer Hassan, Asif Ankur, and Md.
Abdul Mirdad, whose contributions in experimental measurements were extremely
notable.
I wish to acknowledge Astrid Blodgett for editing/proofreading countless pages from my
papers and thesis.

vii
I would like to thank all my friends at the University of Alberta, all former and current
graduate students in the Sustainable Energy Research Group for their support. My
heartfelt gratitude particularly to the people in Ring House # 3 for their pure friendship,
for all the pleasant days spent, parties thrown, and memories colored together.
The author is grateful to Alberta Agriculture, Alberta Innovates – Bio Solutions, and the
National Sciences and Engineering Research Council of Canada (NSERC) for the
financial support to carry out this project.
Above all, I wholeheartedly thank my mighty God for giving me the vision, power, spirit,
and endurance to complete this interesting research.
viii
Table of Contents
Chapter 1 1
Introduction
1.1. Background 1
1.2. Objectives of the Research 4
1.3. Scope and Limitations 5
1.4. Organization of the Thesis 6
References 8
Chapter 2 11
Pipeline Hydraulic Transport of Biomass Materials: A Review
2.1. Introduction 11
2.2. Experimental Measurements 13
2.2.1. Wood Chip-Water Mixtures in Pipes 13
2.2.2. Agricultural Residue Biomass Slurries in Pipes 17
2.2.3. Summary 18
2.3. Modeling Studies 19
2.3.1. Summary 24
2.4. Techno-economic Analyses 25
2.4.1. Summary 33
2.5. Conclusion 33
Nomenclature 35
References 37
ix
Chapter 3 41
Lignocellulosic Biomass Particle Shape and Size Distribution
Analysis Using Digital Image Processing for Pipeline Hydro-
transportation
3.1. Introduction 41
3.2. Materials and Methods 43
3.2.1. Feedstock and Pre-processing 43
3.2.2. Image acquisition and processing technique 44
3.2.3. Particle Size and Distribution Analysis 47
3.3. Results and Discussion 50
3.3.1. Particle Size Analysis of Knife-milled Pre-classified Wheat
Straw and Corn Stover
50
3.3.1.1. Particle Size and PSD Algorithm 50
3.3.1.2. Sample Quantity and Accuracy of Approach 53
3.3.1.3. Particles Shape Factors 54
3.3.1.4. Comparison of Nominal and Measured Dimensions 55
3.3.1.5. Knife Mill Operating Factor 56
3.3.2. Particle Size Distribution Functions 57
3.3.3. Particle Size Distribution Parameters 58
3.3.4. Post Pumping Image Processing 62
3.4. A Different Methodology to Measure a New Quality 63
3.5. Conclusion 65
Nomenclature 66
References 67
x
Chapter 4 71
Investigation into the Mechanisms of Pipeline Transport of
Slurries of Wheat Straw and Corn Stover to Supply a
Biorefinery
4.1. Introduction 71
4.2. Methodology 72
4.2.1. Feedstock Properties and Preparation 72
4.2.2. Image Processing and Morphological Studies 73
4.2.3. Experiment Apparatus 74
4.2.4. Carrier Liquid Viscosity Measurements 76
4.2.5. Calibration of the Experimental Set-up 77
4.2.6. Slurry Preparation and Friction Loss Measurement 78
4.2.7. Uncertainty Analysis 79
4.3. Experimental Results and Discussion 80
4.3.1. Investigating the Applicability of Wood Chip Friction Loss
Correlations for Agricultural Residue Biomass Particles
80
4.3.2. Fibre Suspension Flow Regimes 81
4.3.3. Drag-reducing Characteristics 83
4.3.3.1. Drag Reduction in Wood Pulp Fibre Suspension Flows 83
4.3.3.2. Drag Reduction in Agricultural Residue Biomass Particles
Slurry Flow
85
4.3.4. Effect of Slurry Solid Mass Content 89
4.3.5. The Effect of Solid Particle Properties 93
4.3.5.1. The Effects of Solid Particle Dimension on Slurry Rheology 95
4.3.5.2. The Effect of Solid Particle Dimension on Slurry Flow 95
xi
Momentum Transfer Mechanisms
4.3.5.3. The Effects of Solid Particle Dimension on Drag-reduction
Onset Velocity
99
4.4. Conclusions 99
Nomenclature 101
References 103
Chapter 5 107
The Flow of Wheat Straw Suspensions in an Open-impeller
Centrifugal Pump
5.1. Introduction 107
5.2. Experimental Measurements 109
5.2.1. Agricultural Residue Biomass Material Preparation and
Properties
109
5.2.1.1 Image Processing and Morphological Studies 110
5.2.1.2. Particle Shape Factor 112
5.2.2. Experimental Apparatus 113
5.2.3. Experimental Procedure 114
5.2.3.1. Agricultural Residue Biomass Slurry Preparation 114
5.2.3.2. Sand Slurry Preparation 117
5.2.4. Electrical Efficiency Calculations 119
5.2.5. Uncertainty Analysis 120
5.3. Experimental Result and Discussion 122
5.3.1. Characterizing the Slurry Flow of Agricultural Residue Biomass 122
5.3.2. Evaluating the Performance of the Pump Handling Pure Water 123
5.3.3. Evaluating the Performance of the Pump Handling Wheat Straw 124
xii
Slurries
5.3.3.1. Analyzing the Head Height of the Centrifugal Slurry Pump 125
5.3.3.2. Analyzing the Power Consumption of the Centrifugal Slurry
Pump
126
5.3.3.3. Analyzing the Efficiency of the Centrifugal Slurry Pump 127
5.3.3.4. Head Ratio, Power Ratio, and Efficiency Ratio 130
5.4. Empirical Correlation 132
5.4.1. Existing Correlations vs. Experimental Measurements 133
5.4.2. A Modified Empirical Correlation 134
5.4.3. Comparison Between Head and Efficiency Ratios 136
5.5. Effect of Pump Size 137
5.6. Conclusion 138
Nomenclature 139
References 140
Chapter 6 145
A Design Correlation for the Flow of Agricultural Residue
Biomass Slurries in Pipes
6.1. Introduction 145
6.2. Experimental Methodology 148
6.2.1. Feedstock Properties and Preparation 148
6.2.2. Image Processing and Morphological Studies 148
6.2.3. Experimental Set-up 150
6.2.4. Slurry Preparation and Frictional Pressure Gradient
Measurement
151
6.2.5. Uncertainty Analysis 151
xiii
6.3. Experimental Results 152
6.4. Empirical Correlation Development 155
6.4.1. Numerical Modeling 155
6.4.2. Model Validation 156
6.4.3. Model Applications 158
6.5. Scale-up Approach 158
6.5.1. Scale-up Approaches for the Pulp Fibre Suspension Flows in
Pipes
159
6.5.2. Scale-up Approaches for the Flow of Classical Solid-Liquid
Mixtures in Pipes
161
6.5.3. Scale-up Approaches for the Flow of Agricultural Residue
Biomass Slurries in Pipes
162
6.5.4. Numerical Modeling 163
6.5. Conclusion 166
Nomenclature 167
References 168
Chapter 7 173
Is the Pipeline Hydro-transport of Wheat Straw and Corn Stover
to a Biorefinery Realistic?
7.1. Introduction 173
7.2. Techno-economic Modeling 176
7.2.1. Truck Delivery 176
7.2.2. Pipeline Hydro-transport 177
7.3. Results and Discussion 183
7.3.1. Sensitivity Analysis 183
xiv
7.3.2. Truck Delivery vs. Pipeline Hydro-transport of Biomass 187
7.3.3. Integrated Truck/Pipeline ransport of Biomass 191
7.4. Conclusions 192
References 194
Chapter 8 198
Conclusions and Recommendations for Future Research
8.1. Conclusions 198
8.2. Recommendations for Future Research 202
8.2.1. Investigating the Effect of Pipe Diameter on Slurry Mechanical
Behavior
203
8.2.2. Investigating the Slurry Flow Mechanical Behavior over
Vertical, Inclined, and Bent Sections throughout the Pipeline
203
8.2.3. Investigating the Transient Biomass Slurry Behavior 203
8.2.4. Measuring Slurry Deposition Velocity 204
8.2.5. Using Flow Imaging Techniques to Study Slurry Flow Patterns 204
References 205
References 206
xv
List of Figures
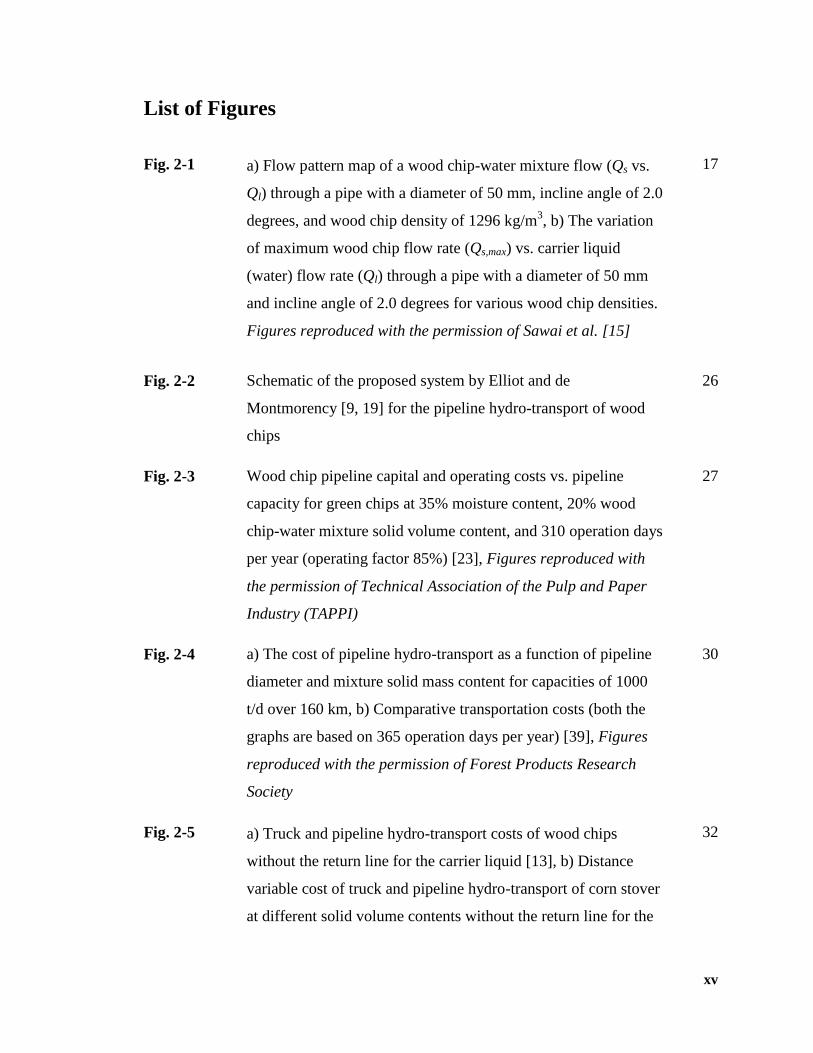
Fig. 2-1 a) Flow pattern map of a wood chip-water mixture flow (Qs vs.
Ql) through a pipe with a diameter of 50 mm, incline angle of 2.0
degrees, and wood chip density of 1296 kg/m3, b) The variation
of maximum wood chip flow rate (Qs,max) vs. carrier liquid
(water) flow rate (Ql) through a pipe with a diameter of 50 mm
and incline angle of 2.0 degrees for various wood chip densities.
Figures reproduced with the permission of Sawai et al. [15]
17
Fig. 2-2 Schematic of the proposed system by Elliot and de
Montmorency [9, 19] for the pipeline hydro-transport of wood
chips
26
Fig. 2-3 Wood chip pipeline capital and operating costs vs. pipeline
capacity for green chips at 35% moisture content, 20% wood
chip-water mixture solid volume content, and 310 operation days
per year (operating factor 85%) [23], Figures reproduced with
the permission of Technical Association of the Pulp and Paper
Industry (TAPPI)
27
Fig. 2-4 a) The cost of pipeline hydro-transport as a function of pipeline
diameter and mixture solid mass content for capacities of 1000
t/d over 160 km, b) Comparative transportation costs (both the
graphs are based on 365 operation days per year) [39], Figures
reproduced with the permission of Forest Products Research
Society
30
Fig. 2-5
a) Truck and pipeline hydro-transport costs of wood chips
without the return line for the carrier liquid [13], b) Distance
variable cost of truck and pipeline hydro-transport of corn stover
at different solid volume contents without the return line for the
32
xvi
carrier liquid [14], truck transport (1): study by Marrison and
Larson [43], truck transport (2): study by Jenkins et al. [44] and
Kumar et al. [45], truck transport (3): study by Glassner et al. at
NREL [46], Figures reproduced with the permission of Springer
and Elsevier Publications
Fig. 3-1 Original colour and ImageJ processed images of a) ~3.2 mm
wheat straw, b) ~19.2 mm wheat straw, c) ~3.2 mm corn stover,
d) ~19.2 mm corn stover
45
Fig. 3-2 PSD algorithms of ~6.4 mm corn stover 52
Fig. 3-3 PSD of wheat straw particles (curves best fitted to better
distinguish the boundaries of the graphs)
52
Fig. 3-4 cumulative number fraction of particles vs. particle length for
corn stover particles with nominal size of ~3.2 mm
54
Fig. 3-5 Aspect ratio vs. nominal size of pre-classified particles 55
Fig. 3-6 Circularity and roundness vs. nominal size of pre-classified
particles
56
Fig. 3-7 Comparison of particles nominal and measured dimensions (d50) 57
Fig. 3-8 Comparing measured lengths of wheat straw and corn stover
knife-milled pre-classified particles for two various knife mill
screens with 4 and 6 mm opening sizes
57
Fig. 3-9 Particles size distributions obtained via three distribution
functions and image analysis: (a) ~3.2 mm wheat straw, (b)
~19.2 mm corn stover
59
Fig. 3-10 Sum of squares errors (SSE) corresponding with three
distribution functions
60
xvii
Fig. 3-11 Variation in Rosin-Rammler PSD parameters of wheat straw and
corn stover particles for four nominal sizes
60
Fig. 3-12 Confocal scanning microscope images of a) wheat straw b) corn
stover particles at 10X magnification
64
Fig. 4-1 Schematic diagram of experimental set-up consisting of (1)
electric motor, (2) centrifugal pump, (3) heat exchanger, (4)
magnetic flow meter, (5) temperature sensor, (6) test section, (7)
pressure transducer, (8) sampler-discharger, (9) mixing tank,
(10) water supply tank, (11) variable frequency drive controller,
(12) watt transducer, (13) data logger/analyser
76
Fig. 4-2 a) Filtering the pumped agricultural residue biomass slurry to
separate fine particles (<50 μm) + fluid, b) Rotational
viscometer, c) Concentric cylinder geometry chosen for the
experiment
77
Fig. 4-3 a) Friction factor vs. Reynolds number for clear water through
the experimental set-up, b) Moisture content variation of 19.2
mm wheat straw particles in a mixture of 3.2% solid mass
fraction pumped at 3.3 m/s and 15 kPa pressure through the
experimental set-up
79
Fig. 4-4
a) The repeatability of two sets of experiments on wheat straw
and corn stover slurries based on experimental measurement
using the experimental set-up, b) Friction loss parameter vs.
mixture velocity for 6.5% mixture of 6.4 mm corn stover
particles based on measurement using the experimental set-up
80
Fig. 4-5 a) Viscosity of the filtered carrier liquid of 2.0 to 7.6%
suspensions of 3.2 mm wheat straw particles at 15°C, b)
Viscosity of the filtered carrier liquid of 2.2 to 8.8% suspensions
of <3.2 mm wheat straw particles at 15°C, based on the
83
xviii
experimental measurement using the experimental set-up
Fig. 4-6 Typical friction - velocity curve for fibre suspensions in pipes,
adopted from Duffy and Lee, and Moller, a) logarithm of friction
loss versus logarithm of mixture velocity, b) logarithm of
friction factor versus logarithm of mixture velocity
84
Fig. 4-7 a) Pressure drop vs. mixture velocity over the entire velocity
range, b) friction factor vs. generalised Reynolds number for
velocities above 2.0 m/s, for various slurries of wheat straw and
corn stover particles measured using the experimental set-up (the
points D and E on Fig. 4-7(b) adopted from Fig. 4-6)
87
Fig. 4-8 Drag ratio vs. mixture velocity for various mixture solid mass
fractions of wheat straw particles of a) <3.2 mm, b) 3.2 mm, c)
6.4 mm, d) 19.2 mm through the laboratory-scale pipeline (the
points D and E on Fig. 4-8(a) adopted from Fig. 4-6)
88
Fig. 4-9 Drag reduction as a function of slurry solid mass fractions
measured using the experimental set-up (data not available for
19.2 mm corn stover particles)
89
Fig. 4-10 Pressure drop vs. velocity for a) <1.5 mm typical solid particles
(i.e., coal, sand, etc.) in 230 mm diameter pipeline as a function
of slurry solid volume fraction), b) 6.4 mm wheat straw particles
as a function of solid mass fraction measured using the
experimental set-up
91
Fig. 4-11 Excess pressure gradient as a function of mixture velocity and
solid mass fraction for a) <1.5 mm typical solid particles in 230
mm diameter pipeline, b) 6.4 mm wheat straw particles
measured using the experimental set-up
91
Fig. 4-12 Slurry solid mass fraction vs. pressure drop at constant velocities
for slurries of <3.2 mm, 3.2 mm, and 6.4 mm corn stover
93
xix
particles, and a slurry of 19.2 mm wheat straw particles
measured using experimental set-up
Fig. 4-13 a) Particle size distribution of wheat straw and corn stover
particles, b) Pressure drop vs. pumping velocity for 5.4% slurries
of various size wheat straw particles, c) Pressure drop vs.
pumping velocity for 6.5% slurries of various size corn stover
particles, d) Average mixture bulk velocity and pressure drop
variation of a 7.6% solid mass fraction mixture of 3.2 mm wheat
straw particles at first 15 h of pumping (the points D, E, and F
on Fig. 4-13(c) adopted from Fig. 4-6) – all the results obtained
from the experimental set-up
98
Fig. 5-1 a) Particle size distribution (PSD) of wheat straw and corn stover
particles used during the course of present research, b) Water
mass content and median length (d50) variation of 19.2 mm
wheat straw particles in a mixture of 3.2% dry matter solid mass
content pumped at 3.3 m/s and 15.0 kPa pressure measured in
this study
111
Fig. 5-2 Schematic diagram of the pipeline facility [(1) electric motor, (2)
centrifugal pump, (3) heat exchanger, (4) magnetic flow meter,
(5) temperature sensor, (6) test section, (7) pressure transducer,
(8) sampler-discharger, (9) mixing tank, (10) water supply tank,
(11) variable frequency drive controller, (12) watt transducer,
(13) data logger/analyzer]
115
Fig. 5-3 a) Electric motor efficiency vs. load at 188 rad/s (1800 rpm), b)
VFD controller efficiency factor
120
Fig. 5-4 The reproducibility of two sets of pump performance evaluation
experiments using 6.4 mm and <3.2 mm wheat straw particles at
122
xx
185 rad/s (1765 rpm) and 146 rad/s (1400 rpm)
Fig. 5-5 Friction factor vs. slurry bulk velocity for velocities above 1.0
m/s in a 50 mm diameter pipeline for various dry matter solid
mass content slurries of a) wheat straw and corn stover particles
and b) play sand particles
123
Fig. 5-6 Performance curve developed for the centrifugal slurry pump
while handling pure water
124
Fig. 5-7 Centrifugal slurry pump performance characteristics (pump
head, input power, and efficiency) over a range of flow rates (0.5
to 5.0 m/s) and dry matter solid mass contents (2.0 to 8.8%) at
185 rad/s (1765 rpm). a), c), and e) show characteristics for <3.2
mm wheat straw particle slurries; b), d), and f) show
characteristics for 6.4 mm wheat straw particle slurries
129
Fig. 5-8 Centrifugal slurry pump performance characteristics over a
range of flow rates (0.5 to 3.5 m/s) and dry matter solid mass
contents (2.0 to 6.5%) at 125 rad/s (1200 rpm). a) shows pump
head for 3.2 mm wheat straw particle slurries; b) shows
efficiency for 19.2 mm wheat straw particle slurries
129
Fig. 5-9 Pressure drop per unit length of the pipeline vs. flow rate for
slurries of a) <3.2 mm and b) 6.4 mm wheat straw particles
through a 50 mm diameter pipeline
130
Fig. 5-10 Variation of a) head ratio, b) efficiency ratio, and c) power ratio
with particle diameters and slurry dry matter solid mass contents
at 185 rad/s (1765 rpm)
132
Fig. 5-11 The variation of head, efficiency, and power ratios with slurry
velocity
132
xxi
Fig. 5-12 Accuracy of proposed correlations in the literature for prediction
of head ratio of slurries of <3.2 mm wheat straw particles
134
Fig. 5-13 Accuracy of modified correlation for prediction of head ratio of
the slurry of agricultural residue biomass particles
136
Fig. 5-14 a) Accuracy of modified correlation for predicting the efficiency
ratio of the slurry of agricultural residue biomass particles, b)
Variation of efficiency ratios with wheat straw particle diameter
and slurry dry matter solid mass content at 185 rad/s (1765 rpm)
137
Fig. 6-1 a) Cumulative particle size distribution of wheat straw and corn
stover particles, b) Repeatability of two sets of pressure gradient
measurements of the flows of wheat straw and corn stover
slurries in 50 mm diameter and 25 m length pipeline
150
Fig. 6-2 Schematic diagram of the experimental set-up 151
Fig. 6-3 Friction factor vs. generalized Reynolds number for velocities
above 2.0 m/s in a 50 mm diameter pipeline for various solid
mass content slurries of a) wheat straw and corn stover particles
and b) play sand particles
153
Fig. 6-4 a) Pressure gradient vs. slurry bulk velocity of various particle
types, particle diameters, and solid mass contents, b) Drag
reduction produced by the slurries shown on Fig. 6-4(a) at 5.0
m/s slurry bulk velocity
154
Fig. 6-5 Residuals of the model, together with a sample of experimental
and predicted results
157
Fig. 6-6 a) A comparison of experimentally measured and numerically
predicted pressure gradients for a slurry of 3.2 mm wheat straw
particles, b) Accuracy of the numerical model in predicting
157

xxii
pressure gradients for the entire 837 experimental measurements
Fig. 6-7 The CSIR pressure gradient scale-up approach applied to the
agricultural residue biomass slurry flows in pipelines
163
Fig. 6-8 a) Comparing the pressure gradients experimentally measured
and numerically predicted by Eq. 6 for 5.4% slurries of various
types and particle diameters in a 50 mm diameter pipeline, b)
Comparing pressure gradients scaled up proportional to D-1.2
and
numerically predicted by Eq. 6 for a 7.6% slurry of <3.2 mm
wheat straw particles in 50, 100, 150, 200, and 250 mm diameter
165
Fig. 7-1 a) Friction factor of the wood chip-water mixtures and slurries of
wheat straw and corn stover particles vs. slurry flow Reynolds
number, b) Input power to the centrifugal slurry pump handling
slurries of 3.2 mm wheat straw particles at 1800 rpm
179
Fig. 7-2 Distance variable cost of pipeline hydro-transport of wheat straw
particles as a function of slurry velocity and solid mass fraction
185
Fig. 7-3 Cost of pipeline transport of various biomass particle diameters 186
Fig. 7-4 Costs of a) one-way and b) two-way pipeline hydro-transport of
<3.2 mm wheat straw particles at 2.5 m/s over 150 km as a
function of pipeline capacity and slurry solid mass fraction
189
Fig. 7-5 Cost of a) one-way and b) two-way pipeline transport of 8.8%
solid mass fraction slurry of <3.2 mm wheat straw particles at
2.5 m/s as a function of pipeline length and capacity
190
Fig. 7-6 Comparison of integrated truck/pipeline transport with truck-
only delivery of <3.2 mm wheat straw particles at one-way
pipeline capacities of 0.5 and 2 M dry t/yr and two-way pipeline
capacity of 1.4 M dry t/yr, slurry solid mass content of 8.8%,
and pipeline slurry velocity of 2.5 m/s
192
xxiii
List of Tables
Table 2-1 Historical development of biomass slurry pipelines 12
Table 2-2 Data for a generalized economic model by Hunt [39] (Originally
presented in imperial units). Table reproduced with the
permission of Forest Products Research Society
29
Table 2-3 Economic and technical parameters used by Kumar et al. to
estimate the capital and operating costs of a wood chip-water
mixture pipeline [13], Table reproduced with the permission of
Springer Publication
31
Table 3-1 Particle size classification according to classifier sieve sizes 44
Table 3-2 Effect of limiting "analyzing threshold" on number/area of
processed particles
45
Table 3-3 Nominal and measured particle dimensions of samples 51
Table 3-4 Theoretical and predicted uniformity index and size guide
number, skewness, and graphic kurtosis
62
Table 3-5 Nominal and measured particles dimensions of pumped samples 63
Table 3-6 Particles surface roughness parameters 64
Table 4-1 Nominal and measured particles dimensions of wheat straw and
corn stover samples
74
Table 5-1 Physical properties of particles and slurries of agricultural
residue biomass
111
Table 5-2 Physical properties and shape specifications of wheat straw
particles
113
Table 5-3 Dimensions and performance parameters (as per manufacturer)
of the centrifugal slurry pump used in this study
116
Table 5-4 Performance data of the electric motor and variable frequency 117

xxiv
drive controller (VFD) used in this study
Table 5-5 Saturated and dry-matter (oven-dried) solid volume and mass
fractions of wheat straw slurries
118
Table 5-6 Physical properties of particles and slurries of play sand and
other conventional solids
118
Table 5-7 Repeatability and systematic uncertainty in suction/discharge
pressure measurements
121
Table 6-1 Physical properties and shape specifications of wheat straw and
corn stover particles, together with classical solid particles
149
Table 6-2 Coefficients for empirical correlations 3 and 6 155
Table 6-3 Estimated regression coefficients and statistics associated with
regression coefficients and regression analysis of experimental
data
156
Table 6-4 Values proposed for the exponents p, q, and r in equation 4 160
Table 6-5 Estimated regression coefficients and statistics associated with
coefficients and regression analysis of scaled-up data
164
Table 7-1 Distance variable and fixed cost of biomass transportation by
truck in North America
177
Table 7-2 Physical properties and shape specifications of wheat straw and
corn stover knife-milled and size-classified particles
179
Table 7-3 Input parameters of the techno-economic model 180
Table 7-4 General economic parameters of the techno-economic model 180
Table 7-5 The major unit operations and corresponding capital, operating,
and maintenance costs of inlet, booster stations, and receiving
facilities
182

1
CHAPTER 1
Introduction
1.1. Background
With the depletion of fossil fuels and their undesirable impacts on the environment,
biomass is receiving increased attention as a potential source of renewable energy.
Biomass refers to a renewable fuel derived from a currently living organism or by-
product of a currently living organism. These could be forest-based (e.g., whole tree,
forest harvest residues, mill residues), agriculture-based (e.g., grains, straw, corn stover),
animal-based (e.g., animal waste, manure), and energy crops (e.g. switchgrass,
miscanthus, willow, poplar). Biomass is considered one of the promising amongst
renewable resources for fuel production as it is considered a renewable resource and is
nearly carbon neutral [1]. Today, commercial scale biomass-based (bio-based) liquid fuel
production facilities mostly operate on grain-based (starchy) biomass (e.g., canola, corn,
wheat) and are at capacities significantly below those of current fossil-fuel based plants.
The liquid fuel production plants based on lignocellulosic biomass (e.g., straw, corn
stover, wood chips) are at various stages of development and currently not operating
commercially on a large scale. This is partly because of immature conversion
technologies but mainly due to the high cost of transporting feedstock by truck to the
plants [2-4].
In the use of lignocellulsic biomass for the production of fuels, there is a trade-off
between the capital cost of production per unit output and the costs of transportation.
Such a trade-off results in an economic optimum size of the field/forest-sourced bio-
based energy facilities at which the cost of the production of fuels or chemicals is
minimum [5]. Currently, most bio-based energy facilities are constructed below such
economic optimum size, making them uncompetitive with fossil fuel-based facilities.
Low biomass bulk density, the high cost of biomass transportation by truck, security of
supply, traffic congestion issues of supplying large-scale plants, and anticipated local
2
community oppositions are major barriers towards increasing the scale of bio-based
energy facilities [3].
In terms of traffic issues, approximately one chip van (36 tonne capacity) is required
every four minutes by a plant using 4.3 M t/yr of wood chips to produce 900 MW
electricity [6], and 15 standard highway trucks (20 tonne capacity) per hour are required
by a plant using 2 M dry t/yr of corn stover to produce up to 960 ML/yr of ethanol [7], a
very small production capacity compared to 25 GL/yr capacity of a typical oil refinery [4,
8]. In terms of economic issues, the transport and logistics arrangements of biomass from
its point of availability, i.e., farm or forest, to its point of use, e.g., bio-based energy
facility, contribute significantly to the total delivered cost of biomass. This cost is directly
proportional to the number and frequency of trucks required and the distance over which
the fuel has to be moved, factors that increase with increasing scale, i.e., economies of
scale do not apply to truck delivery. Allen and Browne [9] reported the cost of
transporting biomass to be 29%, 22%, 17%, and 12% of the total delivered cost of straw,
forest biomass, coppice, and miscanthus, respectively. Epplin [10] estimated the cost to
transport switchgrass to a conversion facility to be 8.8 $/dry t or 24% of the total
delivered cost. Morey et al. [11] found the truck transport of round bales of corn stover to
contribute 24.9% to the total cost. Aden et al. [2] showed that the contribution of corn
stover delivery to the total delivered cost was 24%. Perlack and Turhollow [12] reported
the cost of truck delivery to contribute as much as 45% to the delivered cost of corn
stover at a bio-ethanol plant with a capacity of less than 1 M dry t/yr and a hauling
distance of 50 to 80 km [13]. Mobile pelleting stations for biomass densification was
investigated by Krishnakumar and Ileleji [14] as well, when the cost of truck delivery did
not decrease drastically because of the new cost incurred in pelleting and handling. The
sustainability of the delivery system thus requires a more cost-effective mode of transport
to replace truck delivery to resolve the traffic congestion issue and improve the cost-
competitiveness of the bio-energy sector.
Pipeline transport of agricultural residue biomass (e.g., wheat straw and corn stover) in
the form of slurry (chopped straw- or wood chip-water mixture) can be considered as an
alternative approach to enable bio-based energy facilities to achieve higher capacities;
3
such transport both creates benefits from economies of scale [15] and reduces traffic
congestion issues of overland transportation. Although such an approach comes with
limitations for applications involving combustion [15], there is no penalty in pipeline
hydro-transport of biomass in the form of a solid-liquid mixture (slurry1) for bio-ethanol
production purposes via fermentation [4], hydrothermal liquefaction [16], hydrothermal
hydrolysis [17], or hydrothermal pre-treatment process where the process itself is
aqueous. In these cases, most of the equipment at the pipeline inlet facility replaces
equipment at the bio-refinery that would otherwise be required if biomass were directly
delivered to the plant, e.g., washing, shredding, sizing, and slurrying machines [4].
Biomass slurry would contain almost the required amount of process water, and the slurry
would enter the facility directly with or without minor adjustments in the biomass-water
ratio, depending on the concentration at which the slurry is pipelined [18]. The pipeline
system would be comprised of a number of local receiving facilities, which use pipelines
to hydro-transport biomass to a central bio-ethanol refinery. These receiving facilities
would receive biomass from fields by trucks. That would result in small-scale short hauls
over a limited rural area instead of frequent large-scale truck deliveries between farms
and refineries via main urban roads. In other words, pipeline hydro-transport could be an
integrated operation of truck and pipeline with the initial transport of biomass by trucks
using existing rural roads [3, 15], but it would not be a truck-independent procedure.
Through a series of techno-economic analyses, Kumar et al. [3, 4, 15] studied various
scenarios of pipelining wood chips and corn stover biomass. They investigated one-way
and two-way pipeline scenarios wherein a one-way pipe would discharge/use the carrier
liquid at the receiving facility and a two-way pipe would return all or a portion of the
carrier liquid to the inlet facility. They found the cost of transporting wood chips by
pipeline at a solid volume content of 30% to be less than the midrange distance cost of
truck delivery (0.1167 $/t.km - 2000 U.S. dollar basis) at capacities above 0.5 M dry t/yr
for a one-way pipeline and 1.25 M dry t/yr for a two-way pipeline. They also studied the
cost of pipeline hydro-transport of corn stover agricultural residue (lignocellulosic)
biomass at a 20% solids volume content, compared it with the cost of truck delivery, and
1The terms ″slurry″ and ″suspension″, ″fibre″ and ″particle″, ″pressure drop″ and ″friction loss″, ″size″ and ″diameter″ are used interchangeably throughout the thesis.
4
found that pipeline hydro-transport costs less than truck delivery at capacities above 1.4
M dry t/yr for a one-way pipeline and 4.4 M dry t/yr for a two-way pipeline. However,
while the economic feasibility of agricultural residue biomass pipeline hydro-transport
has been proved, its technical and chemical feasibility have been never studied before.
Furthermore, pressure drop correlations used to obtain the pipeline cost estimates for corn
stover had been originally proposed for transporting wood chip-water mixtures in pipes
[19, 20]. Corn stover and wood chips are of diverse shapes; the former is fibrous in nature
with a wide aspect ratio [21]; the wide aspect ratio gives rise to a variety of unique
mechanisms in slurry flow (e.g., drag reduction) [18, 22] that are often not encountered in
classical solid-liquid slurry systems.
Although a number of hypotheses has been proposed to explain certain aspects of
observed phenomena in slurry flows of fibrous particles, more complete expressions of
the functional relationships between the numerous variables governing the hydro-
transport of fibrous materials in pipes were achieved based upon purely empirical
correlations. Mohamadabadi [23] investigated the effect of long time exposure to water
during pipeline transport on the physical properties of wheat straw particles. Luk et al.
[24], using the same experimental facility as the one used in the current research, studied
the technical feasibility of pipelining wheat straw slurries. The present research attempts
to, for the first time, experimentally investigate pipeline hydro-transport of slurries of
fibrous agricultural residue biomass, specifically wheat straw and corn stover, and to
study technical limitations, potential advantages, governing equations, and economic
feasibilities. The output of the research will help others design and operate future
agricultural residue biomass pipelines.
1.2. Objectives of the Research
While the overall objective of the research was to experimentally investigate various
aspects of agricultural residue biomass pipeline hydro-transport, the specific objectives of
the research are:
a) To study the technical feasibility of replacing truck by pipeline in the large-scale
agricultural residue biomass transport sector, assess the potential difficulties in handling
5
agricultural residue biomass slurries, and propose a standard operating procedure for
pipelining irregular-shaped agricultural residue biomass particles.
b) To investigate the dimensions, size distributions, size distribution algorithms,
morphological features (including shape factors, the effect of knife mill operating factors
on particle dimensions, particle size reduction effect during pipelining), and micro-scale
surface features of knife-milled pre-classified wheat straw and corn stover.
c) To investigate the effect of fine (<50 μm) particles on the viscosity of the carrier liquid
of the agricultural residue biomass slurry during pipeline hydro-transport, critically
examine the applicability of wood chips pressure drop correlations to calculate friction
losses while hydro-transporting wheat straw and corn stover particles, study the
mechanical behavior, specifically the pressure drop, of agricultural residue biomass slurry
at various slurry solid mass contents, slurry flow rates, and agricultural residue biomass
particles types and sizes, and try to obtain the optimum operating conditions.
d) To establish the effect of slurries of fibrous wheat straw biomass particles over a range
of slurry solid mass contents on performance characteristics of centrifugal slurry pumps,
particularly on produced head, efficiency, and power consumption of the pump, and
develop an empirical correlation to predict the agricultural residue biomass slurry
pressure drop throughout the pipeline.
e) To conduct a series of techno-economic analyses on biomass pipeline hydro-transport
using empirically obtained technical features and pressure drop correlation and compare
the results with previously published analyses.
1.3. Scope and Limitations
- For the present research, the experiments were conducted in a pipeline of diameter of 50
mm (or 2″) only. While the pipe diameter is not considered an experimental variable,
efforts have been made to extrapolate the results for larger diameter pipelines.
- The range of slurry bulk velocity studied here varies between 0.5 m/s and 5.0 m/s.
Instrument and technical limitations prevented achieving lower and higher velocities.
6
- The size (d50) of particles studied here is limited to 1.9 to 8.3 mm. The authors are not
able to extend the results obtained here to the particles out of this range.
- The experimental measurements were limited to the study of corn stover and wheat
straw slurries.
1.4. Organization of the Thesis
The thesis consists of eight chapters, six of which are based on published/submitted
papers. This thesis is a consolidation of papers, each chapter of which is intended to be
read independently. As a result, some concepts and data are repeated.
The current chapter provides a background on the economic challenges of pipeline hydro-
transport of biomass materials to bio-based energy facilities and outlines the objectives
and limitations of this research.
The second chapter reviews the literature published on the technical, modeling, and
economic aspects of pipeline hydro-transport of biomass (mainly wood chips) particles.
Chapter three investigates particle size, particle size distribution (PSD), and
corresponding parameters, PSD functions, morphological features, and micro-scale
features of knife-milled pre-classified wheat straw and corn stover.
Chapter four critically examines the applicability of wood chips pressure drop
correlations to calculate friction losses while hydro-transporting wheat straw and corn
stover particles in pipes and studies mechanical behavior of biomass slurry at various
slurry solid mass contents, slurry flow rates, and agricultural residue biomass particles
types and sizes.
Chapter five attempts to establish the effect of concentrated slurries of fibrous wheat
straw biomass particles over a wide range of slurry solid mass contents on the
performance characteristics of a centrifugal slurry pump specifically produced head,
efficiency, and power consumption of the centrifugal pump.
7
In chapter six, an empirical correlation is developed based on experimental measurements
to predict longitudinal pressure gradients of the flow of the slurry of agricultural residue
biomass in a 50 mm diameter pipeline. The pressure gradient correlation is then scaled up
to account for pipe diameters larger than 50 mm.
In chapter seven, the technical parameters and constraints as well as the empirical
correlations obtained through the course of experimental study, together with the pipeline
economic structure proposed by Kumar et al. [15, 25, 26], are used to develop a data-
intensive techno-economic model to estimate the cost of pipeline hydro-transport of
wheat straw and corn stover agricultural residue biomass to bio-ethanol refinery.
Finally, chapter eight presents the conclusions and provides recommendations for future
research.
8
References
[1] UN. Green energy: biomass fuels and the evironment. Geneva, Switzerland
United Nations; 1991.
[2] Aden, A., Ruth, M., Ibsen, K., Jechura, J., Neeves, K., Sheehan, J., et al.
Lignocellulosic biomass to ethanol process design and economics utilizing co-current
dilute acid prehydrolysis and enzymatic hydrolysis for corn stover (Report No TP-510-
32438). National Renewable Energy Laboratory (NREL); 2002.
[3] Kumar, A., Cameron, J.B., Flynn, P.C. Large-scale ethanol fermentation through
pipeline delivery of biomass. Applied Biochemistry and Biotechnology, 2005 (a); 121:
47-58.
[4] Kumar, A., Cameron, J.B., Flynn, P.C. Pipeline transport and simultaneous
saccharification of corn stover. Bioresource Technology, 2005 (b); 96: 819-29.
[5] Ruth, M. Large Scale Ethanol Facilities and Short Cut for Changing Facility Size.
Internal Report, National Renewable Energy Laboratory Technical Memo; 1999.
[6] Kumar, A., Cameron, J.B., Flynn, P.C. Biomass power cost and optimum plant
size in western Canada. Biomass and Bioenergy, 2003; 24: 445-64.
[7] Sokhansanj, S., Turhollow, A., Cushman, J., Cundiff, J. Engineering aspects of
collecting corn stover for bioenergy. Biomass & Bioenergy, 2002; 23: 347-55.
[8] Wallace, B., Yancey, M., Easterly, J. Bioethanol co-location with a coal-fired
power plant. 25th Symposium on Biotechnology for Fuels and Chemicals Breckenridge,
CO; 2003.
[9] Allen, J., Browne, M. Logistics management and costs of biomass fuel supply.
International Journal of Physical Distribution & Logistics Management, 1998; 28: 463-
77.
[10] Epplin, F.M. Cost to produce and deliver switchgrass biomass to an ethanol-
conversion facility in the Southern Plains of the United States. Biomass & Bioenergy,
1996; 11: 459-67.
[11] Morey, R.V., Kaliyan, N., Tiffany, D.G., Schmidt, D.R. A biomass supply
logistics system. 2009, p. 4802-14.
9
[12] Perlack, R.D., Turhollow, A.F. Assessment of options for the collection, handling,
and transport of corn stover. Available from: http://bioenergy.ornl.gov/pdfs/ornltm-
200244.pdf. Report no ORNL/TM-2002/44; 2002.
[13] Glassner, D., Hettenhaus, J., Schechinger, T. Corn stover collection project.
Bioenergy 1998; 1998.
[14] Krishnakumar, P., Ileleji, K.E. A Comparative Analysis of the Economics and
Logistical Requirements of Different Biomass Feedstock Types and Forms for Ethanol
Production. Applied Engineering in Agriculture, 2010; 26: 899-907.
[15] Kumar, A., Cameron, J.B., Flynn, P.C. Pipeline transport of biomass. Applied
Biochemistry and Biotechnology, 2004; 113: 27-39.
[16] Zhu, Y., Biddy, M.J., Jones, S.B., Elliott, D.C., Schmidt, A.J. Techno-economic
analysis of liquid fuel production from woody biomass via hydrothermal liquefaction
(HTL) and upgrading. Applied Energy, 2014; 129: 384-94.
[17] Thangavelu, S.K., Ahmed, A.S., Ani, F.N. Bioethanol production from sago pith
waste using microwave hydrothermal hydrolysis accelerated by carbon dioxide. Applied
Energy, 2014; 128: 277-83.
[18] Vaezi, M., Katta, A.K., Kumar, A. Investigation into the mechanisms of pipeline
transport of slurries of wheat straw and corn stover to supply a bio-refinery. Biosystems
Engineering, 2014; 118: 52-67.
[19] Hunt, W.A. Friction factors for mixtures of wood chips and water flowing in
pipelines,. 4th International Conference on the Hydraulic Transport of Solids in Pipes.
Alberta, Canada; 1976., p. 1-18.
[20] Wasp, E.J., Aude, T.C., Thompson, T.L., Bailey, C.D. Economics of chip
pipelining. Tappi, 1967; 50: 313-18.
[21] Vaezi, M., Pandey, V., Kumar, A., Bhattacharyya, S. Lignocellulosic biomass
particle shape and size distribution analysis using digital image processing for pipeline
hydro-transportation. Biosystems Engineering, 2013; 114: 97-112.
[22] Duffy, G.G., Lee, P.F.W. Drag reduction in turbulent flow of wood pulp
suspensions. Appita, 1978; 31: 280-86.
[23] Mohamadabadi, H.S. Characterization and pipelining of biomass slurries
University of Alberta; 2009.
10
[24] Luk, J., Mohammadabadi, H.S., Kumar, A. Pipeline transport of biomass:
Experimental development of wheat straw slurry pressure loss gradients Biomass and
Bioenergy, 2014; 64: 329-36.
[25] Kumar, A., Flynn, P.C., Cameron, J.B. Large-scale ethanol fermentation through
pipeline delivery of biomass. Applied Biochemistry and Biotechnology, 2005; 121: 47-
58.
[26] Kumar, A., Flynn, P.C., Cameron, J.B. Pipeline transport and simultaneous
saccharification of corn stover. Bioresource Technology, 2005; 96: 819-29.
11
CHAPTER 2
Pipeline Hydraulic Transport of Biomass Materials: A Review1
2.1. Introduction
Hydraulic transport (hydro-transport) of solids in pipes has been the subject of
investigations since the turn of the last century. Nora Blatch (1906) was probably the first
person to conduct a systematic investigation on solid-liquid mixture flows through a 25
mm horizontal pipe [1]. Since then, particularly owing to the improvements in centrifugal
pump design and the advances in solid-liquid mixture flow knowledge in the 1960s [2], a
number of short and long solid-liquid mixture pipelines have been constructed to
hydraulically transport a variety of solids, from coal to limestone to complex bitumen.
The technical and economic advantages of pipeline hydro-transport have encouraged
various sectors to consider replacing conventional modes of transport, e.g., road and rail,
with pipelines for long-distance transport purposes. Major advantages include benefits
from economies of scale in the construction of the pipeline and associated equipment,
large transportation volume (e.g., 2273 Mt/yr of phosphate concentrate [1, 3]), excellent
safety record (fewer than two incidents per 10,000 km of pipeline reported per year [4]),
continuous operation, and reduced in-transit inventory.
While, to the best knowledge of the authors, there is no large-scale long-distance biomass
pipeline in operation at the moment, the pulp and paper industry uses hydro-transport for
wood pulp fibres for on-site processing over short distances [5-8]. The pulp and paper
industry has also conducted some laboratory-scale research projects on wood chip
pipeline hydro-transport for feedstock supply purposes [9-11]. Besides the pulp and paper
industry, pipeline hydro-transport of biomass, more specifically lignocellulosic biomass,
is now receiving new interest as an alternative means of delivering biomass to bio-based
plants [12-18] that can potentially reduce the cost of feedstock delivery [13] and enable
bio-based energy facilities to reach higher capacities.
1 Paper submitted to the Journal of Biomass and Bioenergy, 2014
12
Wood pulp fibre is not a natural biomass but a mechanically or chemically processed
biomass, and, therefore, its hydro-transport is not reviewed here. This paper instead
reviews the literature published on pipeline hydro-transport of unprocessed biomass in
the pulp and paper industry as well as in the bio-based energy sector. The literature is
reviewed in chronological order and is classified into experimental measurements,
modeling studies, and techno-economic analyses. All the costs reported in the economic
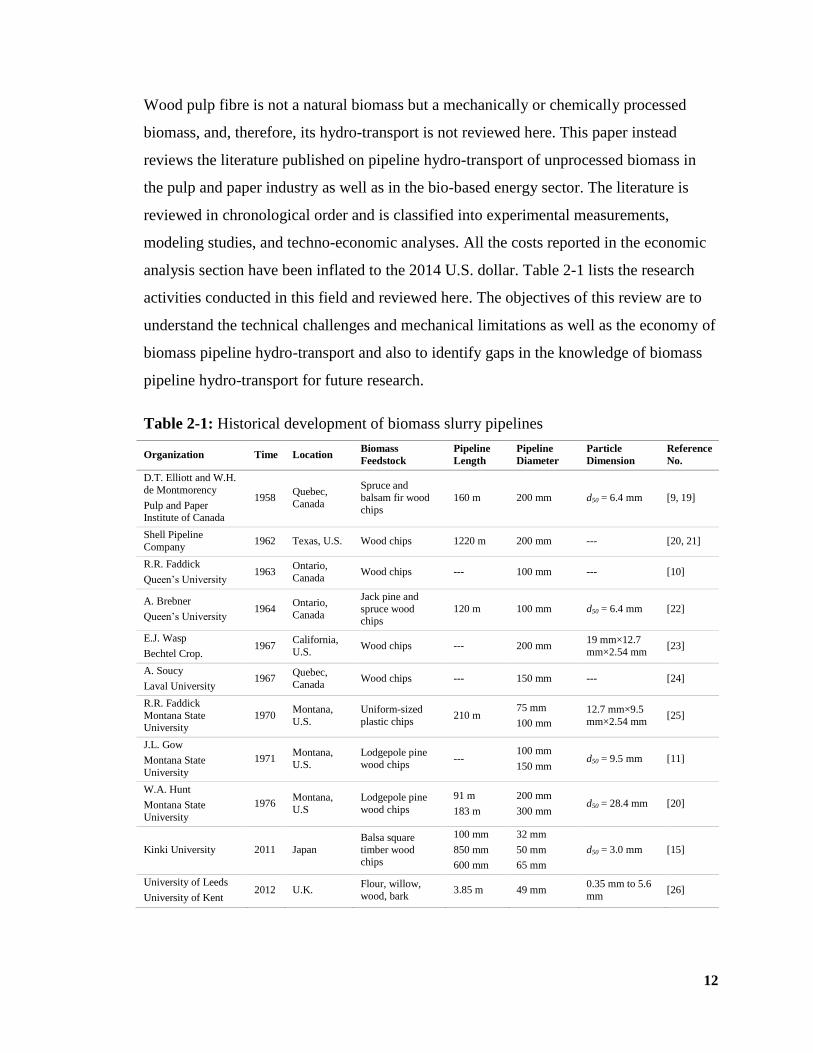
analysis section have been inflated to the 2014 U.S. dollar. Table 2-1 lists the research
activities conducted in this field and reviewed here. The objectives of this review are to
understand the technical challenges and mechanical limitations as well as the economy of
biomass pipeline hydro-transport and also to identify gaps in the knowledge of biomass
pipeline hydro-transport for future research.
Table 2-1: Historical development of biomass slurry pipelines
Organization Time Location Biomass
Feedstock
Pipeline
Length
Pipeline
Diameter
Particle
Dimension
Reference
No.
D.T. Elliott and W.H.
de Montmorency
Pulp and Paper Institute of Canada
1958 Quebec,
Canada
Spruce and
balsam fir wood
chips
160 m 200 mm d50 = 6.4 mm [9, 19]
Shell Pipeline
Company 1962 Texas, U.S. Wood chips 1220 m 200 mm --- [20, 21]
R.R. Faddick
Queen’s University 1963
Ontario,
Canada Wood chips --- 100 mm --- [10]
A. Brebner
Queen’s University 1964
Ontario,
Canada
Jack pine and
spruce wood chips
120 m 100 mm d50 = 6.4 mm [22]
E.J. Wasp
Bechtel Crop. 1967
California,
U.S. Wood chips --- 200 mm
19 mm×12.7
mm×2.54 mm [23]
A. Soucy
Laval University 1967
Quebec,
Canada Wood chips --- 150 mm --- [24]
R.R. Faddick
Montana State University
1970 Montana,
U.S.
Uniform-sized
plastic chips 210 m
75 mm
100 mm
12.7 mm×9.5
mm×2.54 mm [25]
J.L. Gow
Montana State
University
1971 Montana,
U.S.
Lodgepole pine
wood chips ---
100 mm
150 mm d50 = 9.5 mm [11]
W.A. Hunt
Montana State
University
1976 Montana,
U.S
Lodgepole pine
wood chips
91 m
183 m
200 mm
300 mm d50 = 28.4 mm [20]
Kinki University 2011 Japan Balsa square
timber wood chips
100 mm
850 mm
600 mm
32 mm
50 mm
65 mm
d50 = 3.0 mm [15]
University of Leeds
University of Kent 2012 U.K.
Flour, willow,
wood, bark 3.85 m 49 mm
0.35 mm to 5.6
mm [26]
13
2.2. Experimental Measurements
2.2.1. Wood Chip-Water Mixtures in Pipes
Elliott and de Montmorency [9, 19] at the Pulp and Paper Research Institute of Canada
(PAPRICAN) were the first to install a laboratory-scale experimental facility to study the
hydro-transport of wood chips in pipes. The facility was composed of 160 m of 200 mm
diameter aluminum pipe, and the chips consisted of spruce and balsam fir, with d50 of 6.4
mm that, at a fully saturated condition, attained a moisture content (water mass content)
of 68% to 70% and specific gravity of 1.03 to 1.06 [9]. Elliott [19] observed a
deterioration (also referred to as degradation or particle size reduction) caused mainly by
the pump and reported the production of wood chips smaller than 12.7 mm to be 39%
compared to 10% in control chips from the original batch after four hours of circulation.
The optimum mixture solid volume content was reported to be about 30%, since at a solid
volume content of 35% the pump power consumption began to increase slightly and at
47% the mixing operation became erratic because the equipment was not designed for
such a heavy mixture. Considering pressure drop measurements, Elliot and de
Montmorency [9], using a pressure drop-velocity plot, showed that with increasing
velocity the curves corresponding to the mixtures above 20% solid volume contents go
through a minimum of friction loss, where chips along the bottom start to build up toward
plugging conditions. Afterwards, the curves straighten and become parallel/close to the
pure water line where chips are in complete suspension.
The research and development section of the Shell Pipeline Company [21] studied hydro-
transport of wood chip-water mixtures on a closed-circuit pipeline facility of 1220 m
length and 200 mm diameter in Houston, Texas, U.S.A. The results were inconclusive
and the system was later dismantled; further experiments were conducted on shorter and
smaller clear plastic pipelines 50 mm in diameter. The results, however, were proprietary
and not released [20].
Faddick [10] conducted an experimental investigation on wood chip-water mixtures on a
100 mm diameter pipeline. Later, he tried to simulate the pipeline hydro-transport of
14
wood chips using uniform-sized plastic chips instead [25] (discussed in a subsequent
section).
To verify the feasibility of the concept of wood chip hydro-transport and to determine the
empirical laws relating various variables, Brebner [22] performed a series of experiments
on a test circuit that was made up of 120 m of 100 mm diameter aluminum pipe. He used
standard jack pine and spruce chips with d50 of 6.4 mm, which at fully saturated
conditions attained a moisture content of 70% and specific gravity of 1.15. Considering
slurry flow regimes, Brebner observed three regimes at velocities between 1.5 and 4.5
m/s consisted of ″suspension″ for solid volume contents below 5%, ″discontinuous
sliding bed with saltation″ for solid volume contents between 5% and 12%, and
″continuous sliding bed″ for solid volume contents above 12%. In the latter, chips were
physically interlocked while loose chips progressed at a slightly faster rate above the
sliding bed.
Wasp et al. [23] conducted an experiment on conveying wood chips of specific gravity of
(fully saturated) 1.13 and dimensions of 19 mm×12.7 mm×2.5 mm through a 200 mm
diameter pipe at 3.0 m/s velocity. They applied the homogeneous-heterogeneous model
[27] (see section 3, Eqs. 5 and 6) to identify the flow regime and mixture solid volume
content across the pipe cross section.
Soucy [24], using 150 mm diameter acrylic pipes, conducted a series of experiments to
measure the pressure drop of wood chip-water mixtures in pipes. Soucy’s data were later
used by Faddick [25] and Gow [11].
In 1962, the Montana State University entered into a cooperative aid agreement with the
U.S. Forest Service to conduct a series of technical and economic analyses to establish
criteria to design, construct, and operate wood chip pipeline systems to feed the pulp and
paper industry [11, 25, 28]. As a part of this study and to simulate the pipeline hydro-
transport of wood chips as well as investigate friction loss parameters, Faddick [25]
transported uniform-sized plastic chips of a specific gravity of 0.92 and 1.05 and
dimensions of 12.7 mm×9.5 mm×2.5 mm through 75 mm and 100 mm diameter and 210
m long acrylic pipes. Later, Gow [11] modified Faddick’s laboratory pipeline system to
15
study wood chip-water mixtures and correlated experimental friction loss data over a
range of mixture velocities, pipe diameters, wood chip sizes, and mixture solid volume
contents. The use of lodgepole pine wood chips with d50 of 9.5 mm, a fully saturated
moisture content of 50%, and a specific gravity of 1.015 resulted in the mixture velocity’s
being limited to 3.3 m/s and 1.3 m/s through 100 mm diameter acrylic plastic and 150
mm diameter aluminum pipes, respectively. Gow’s investigation was directly comparable
to Faddick’s experimental data [10] (the two experiments were conducted with a 100 mm
diameter pipe). Gow concluded that at a given mixture velocity, the friction factor
increases in magnitude with increasing solid volume content. Also at a given mixture
velocity and solid volume content, the friction factor decreases with increasing pipe
diameter. However, Gow noted the dependence of friction factor on pipe diameter was
non-linear for high solid volume contents and insignificant at high velocities. An abrupt
change was also observed in friction factor in which the corresponding velocity (critical
velocity) depended on mixture solid volume contents and was due to the change in the
mode of transport of wood chips from ″heterogeneous discontinuous sliding bed with
saltation″ to ″continuous sliding bed.″ This study employed the terms ″pseudo-laminar″
and ″pseudo-turbulent″ to refer to sliding bed and saltation flows, respectively, to
distinguish these phenomena from classical laminar and turbulent pipe flows.
Hunt [20] studied the hydro-transport of wood chip-water mixtures using elongated
oblong plate-shaped lodgepole pine wood chips with d50 of 28.4 mm and approximate
specific gravity of 1.0 to 1.05. He used 200 mm and 300 mm diameter and 91 m and 183
m long steel pipes in order to scale up the experiments conducted on 75 mm, 100 mm,
and 150 mm diameter pipes and to examine the applicability of the extrapolation
approach to friction loss correlations proposed by others [11, 25]. The friction loss
correlation proposed by Hunt will be reviewed in the next section.
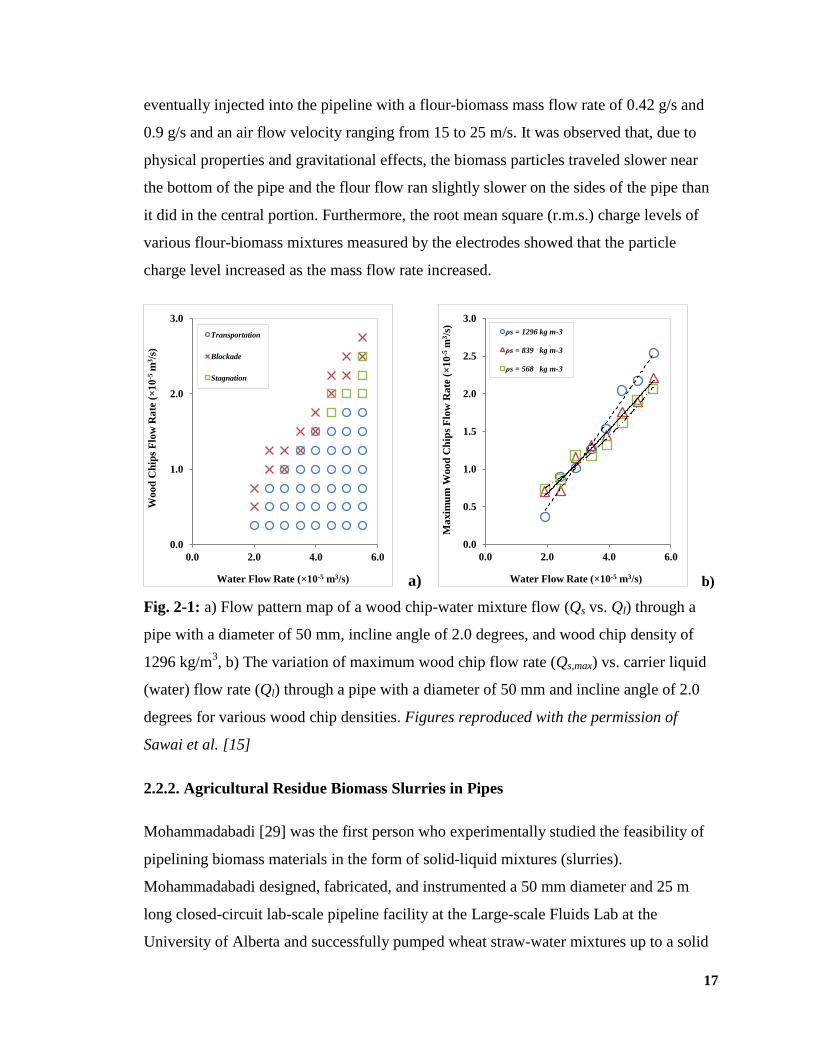
Sawai et al. [15] studied the hydro-transport of wood chip-water mixtures in sloped
pipelines to understand the mechanism of wood chip blockade and effects of wood chip
density, carrier liquid (water) flow rate, pipe diameter, and the inclination angle of the
pipeline on maximum flow rate of wood chip-water mixtures. Using balsa square timber
wood chips with d50 of 3.0 mm and (fully saturated) specific gravity of 0.6 to 1.0, they
16
designed the sloped (hilly terrain) pipeline in three sections: the upstream section with an
incline of 30 degrees and length of 100 mm, the midstream section mounted horizontally
or with an upward or downward incline of 2.0 degrees and length of 850 mm, and the
downstream section with an incline of 30 degrees and length of 600 mm; all three
sections were available in diameters of 32 mm, 50 mm, and 65 mm. Fig. 2-1(a) shows the
flow pattern of wood chip-water flow through the midstream section using a pipe
diameter of 50 mm, incline angle of 2.0 degrees, and wood chip density of 1296 kg/m3.
Flowing through the midstream section, the carrier liquid changed from supercritical to
subcritical flow, which was then followed by a drastic increase in the depth and width of
liquid film (hydraulic jump) in which the maximum wood chip flow rate (Qs,max) was
recorded and a blockade of wood chips subsequently occurred. The stagnation of wood
chips was observed right after the hydraulic jump; however, the wood chips arranged in
layers were slowly transported with the carrier liquid. In the midstream section, which
was mounted upward with an incline of 2.0 degrees, it was not possible to transport the
wood chips with carrier liquid in any of the flow conditions. Fig. 2-1(b) presents the
variation of maximum wood chip flow rate with carrier liquid rate for various wood chip
densities. The maximum flow rate for wood chips with densities larger than water density
was larger than the flow rate for wood chips with densities smaller than that of water.
However, the general effect of wood chip density on the wood chip maximum flow rate
was negligible. Sawai et al. [15] also studied the effect of pipe diameter on maximum
wood chip flow rate and observed that the flow rate decreased as the pipe diameter
decreased. They also analytically investigated the maximum flow rate of wood chips
when a midstream section was mounted horizontally.
Using a pipe with a diameter of 49 mm and length of 3.85 m, Gubba et al. [26] studied
pneumatic pipeline transport of biomass particles on burner feeding applications in
biomass-coal co-firing power plants and compared the results with those obtained
through computational fluid dynamics (CFD) techniques. Because the particle-particle,
particle-air, and particle-wall interactions generate a net electrostatic charge on the
particles, the electrostatic sensing and correlation techniques were applied to measure
particle velocity and solid volume content distribution. Flour was substituted for coal (for
health and safety regulations) and mixed with willow, wood, or bark. The mixture was
17
eventually injected into the pipeline with a flour-biomass mass flow rate of 0.42 g/s and
0.9 g/s and an air flow velocity ranging from 15 to 25 m/s. It was observed that, due to
physical properties and gravitational effects, the biomass particles traveled slower near
the bottom of the pipe and the flour flow ran slightly slower on the sides of the pipe than
it did in the central portion. Furthermore, the root mean square (r.m.s.) charge levels of
various flour-biomass mixtures measured by the electrodes showed that the particle
charge level increased as the mass flow rate increased.
a) b)
Fig. 2-1: a) Flow pattern map of a wood chip-water mixture flow (Qs vs. Ql) through a
pipe with a diameter of 50 mm, incline angle of 2.0 degrees, and wood chip density of
1296 kg/m3, b) The variation of maximum wood chip flow rate (Qs,max) vs. carrier liquid
(water) flow rate (Ql) through a pipe with a diameter of 50 mm and incline angle of 2.0
degrees for various wood chip densities. Figures reproduced with the permission of
Sawai et al. [15]
2.2.2. Agricultural Residue Biomass Slurries in Pipes
Mohammadabadi [29] was the first person who experimentally studied the feasibility of
pipelining biomass materials in the form of solid-liquid mixtures (slurries).
Mohammadabadi designed, fabricated, and instrumented a 50 mm diameter and 25 m
long closed-circuit lab-scale pipeline facility at the Large-scale Fluids Lab at the
University of Alberta and successfully pumped wheat straw-water mixtures up to a solid
0.0
1.0
2.0
3.0
0.0 2.0 4.0 6.0
Wo
od
Ch
ips
Flo
w R
ate
(×
10
-5 m
3/s
)
Water Flow Rate (×10-5 m3/s)
Transportation
Blockade
Stagnation
0.0
0.5
1.0
1.5
2.0
2.5
3.0
0.0 2.0 4.0 6.0
Ma
xim
um
Wo
od
Ch
ips
Flo
w R
ate
(×
10
-5 m
3/s
)
Water Flow Rate (×10-5 m3/s)
ρs = 1296 kg m-3
ρs = 839 kg m-3
ρs = 568 kg m-3
18
volume content of 30%. Mohammadabadi mainly focused on the change in wheat straw
particles’ physical properties through exposure to water. For instance, the change in wet-
basis moisture content of particles with nominal dimensions of 3.2 mm and 19.2 mm was
measured while the particles were being soaked and mechanically mixed for 192 hours.
The samples containing small size particles absorbed water faster, the final moisture level
(saturation level) of the samples of large size particles was greater (81.2% vs. 81.0%),
and mechanical mixing compared to soaking increased the magnitude of absorption
(82.4% vs. 81.2% for 19.2 mm particles) as well as the rate of absorption of water into
wheat straw particles. In addition, the saturated particle density of wheat straw samples
was found to be greater for smaller particles compared to larger ones (1050 kg/m3 vs.
1030 kg/m3) and greater after 192 hours of mixing compared to the density obtained
after the same amount of soaking time (1060 kg/m3
vs. 1050 kg/m3
for 3.2 mm particles).
The lab-scale closed-circuit pipeline facility created by Mohammadabadi was used later
by Luk et al. [30, 31] and Vaezi et al. [16, 17] to experimentally investigate the
hydraulics of pipeline hydro-transport of agricultural residue biomass.
Luk et al. [30, 31] studied the pressure drop behavior of wheat straw-water mixtures for
wheat straw particles of dimensions of 3.2, 6.4, and 19.2 mm, solid mass contents (dry
matter) of 1.92, 3.90, and 5.94%, and slurry bulk velocities of 1.5 to 3.0 m/s. Luk et al.
realized that fibre-like wheat straw particles can suppress the flow turbulence at elevated
velocities of more concentrated flows and cause the pressure drop to fall below the
pressure drop of water alone (the drag-reducing effect).
2.2.3. Summary
A series of experiments has been conducted on pipeline hydro-transport of wood chips
for a wide range of variables, including pipeline materials of aluminum, clear plastic, and
acrylic; pipeline lengths of 91 to 1220 m; pipeline diameters of 50 to 300 mm; wood chip
moisture contents of 50 to 70%; wood chip diameters (d50) of 3.0 to 28.4 mm; and wood
chip-water mixture velocities of 0.5 to 4.5 m/s. Economic and technical issues limited the
maximum mixture solid volume content achieved to 30%, where at solid volume contents
above 20% and mixture velocities above 1.5 m/s the wood chip-water mixture friction
19
losses dropped to close to pure water. It was found that mounting the pipeline
horizontally, increasing the pipe diameter, and decreasing mixture solid volume content
bring about optimum pipeline conditions and reduce the probability of a wood chip
blockade throughout the pipe.
Researchers have studied pipeline hydro-transport of wheat straw agricultural residue
biomass on a 50 mm diameter and 25 m long closed-circuit lab-scale pipeline facility.
Changes in physical properties of wheat straw particles due to long-time exposure to
water and general friction loss behavior of wheat straw-water mixture have been studied.
However, differences between pressure drop behavior of agricultural residue biomass-
water mixtures and conventional solid particles slurries; changes in friction loss and
rheological behaviors of agricultural residue-water mixtures with changes in biomass
particles type (wheat straw and corn stover), particle dimension, slurry solid mass
content, and slurry velocity; and the performance of the centrifugal pumps handling
slurries of agricultural residue biomass need to be yet investigated.
2.3. Modeling Studies
In 1952 Durand and Condolios [32] presented a universal correlation to estimate the
friction loss in solid-liquid pipelines (Eq. 1). α and β constants were later empirically
determined by Worster [33] and Gibert [34]. The former found constants of 81 and -1.5
for coal-water mixtures, and the latter found constants of 180 and -1.5 for sand- and
gravel-water mixtures. Following a study on hydro-transport of spruce and balsam fir
wood chips, Elliott and de Montmorency [9, 19] modified the Durand equation and
proposed an empirical correlation (Eq. 2) for estimating friction loss in wood chip-water
mixtures flowing in pipes. They also recommended a pumping velocity close to 1.2 m/s
where the friction losses were high enough to be technically and economically
satisfactory.
√
(1)
20
√
(2)
Faddick [10] presented the following Durand-type correlation (Eq. 3) for friction loss in
wood chip pipelines based on experimental studies. Faddick’s results appeared to give
predicted friction loss values as much as 30% higher than those of Elliot and de
Montmorency [20].
(3)
Brebner [22] experimentally studied the feasibility of hydro-transporting jack pine and
spruce wood chips and measured the friction loss throughout the pipe. With results
similar to Elliott’s [9, 19], Brebner reported the hydraulic gradients of wood chip-water
mixtures in a Durand-type equation as follows:
(4)
While adopting the Durand equation (Eq. 1) for wood chip results in an equation constant
of 6.0, Brebner measured a three-times-larger friction loss with a constant of 18.0.
Brebner attributed his findings to the interlocking sliding bed mode of transport. He also
successfully tried a pumping velocity as low as 1.5 m/s in which, since it was the
commonly accepted velocity for water alone, he found no advantage going below such
velocity.
Wasp et al. [27] introduced a model that is widely used in coal pipeline hydro-transport to
classify the particles as either uniformly distributed (homogeneous) or with solid volume
fraction gradient across a cross section (heterogeneous or partially stratified). Wasp’s
model calculates the friction loss per unit pipe length as the sum of losses due to
water+suspended fine particles flow (Eq. 5) and water+coarse particles flow (Eq. 1)
together with the amount of suspended particles contributing to the former flow (Eq. 6).
21
Following an experimental study on pipeline hydro-transport of wood chips [23], Wasp
investigated solid volume content distribution and calculated the solid volume fraction at
the top (Ctop) and middle (Cmid) of the pipe. It was found that for every 7 chips at the top,
there were 100 chips at the center. This implied that the solid volume content distribution
was non-uniform and that the nature of the flow was heterogeneous.
(5)
√ ⁄
(6)
Wasp et al. [27] examined the compatibility of the Durand correlation with the published
data of Elliott and de Montmorency. While a good agreement was observed for 10-20%
solid volume content, a systematic trend for the Durand equation to predict high values
for low concentrates (i.e., 5% solid volume content) and low values for high concentrates
was found. Zandi and Govatos [35] proposed a criterion to determine the transition in
flow regimes from heterogeneous (suspension) to discontinuous sliding bed with saltation
and improved the original Durand equation by eliminating the corresponding saltation
data. Observing the apparent inconsistency between Elliott and de Montmorency’s [9]
and Faddick’s [10] experimental results, Wasp et al. also attempted to refine the Durand
equation by modifying its constants, as proposed by Zandi and Govatos [35]. However,
the Wasp correlation did not fit the data any better than the old Durand equation, which
pointed out the need for additional experimental work.
Faddick [25] simulated the pipeline hydro-transport of wood chips using uniform-sized
plastic chips to investigate friction loss parameters. With the data from four sets of
experiments using plastic chips and three sets of experiments (by other researchers) using
wood chips, Faddick proposed calculating the friction loss in wood chip pipelines using
the Darcy-Weisbach equation and evaluated the mixture friction factor using curve-fitting
techniques as follows:
22
(7)
where a1, a2, a3, x, and y are empirical coefficients determined experimentally.
Metzner and Reed [36] developed a semi-theoretical correlation to analyze friction loss of
laminar non-Newtonian fluids (Eq. 9), and Dodge and Metzner [37] extended their
method to include turbulent non-Newtonian fluids (Eq. 10). Gow found Metzner and
Reed’s method for laminar non-Newtonian flows to be capable of analyzing the friction
loss data for wood chip-water mixtures in pseudo-laminar flow (sliding bed) conditions,
where n and K coefficients were obtained from wood chip-water mixture friction loss
data as functions of solid volume contents. Gow also indicated that the ratio of friction
factors of two various pipe diameters equals the reciprocal ratio of the pipe diameters to
the n power (Eq. 11).
(8)
(9)
√
(
⁄)
(10)
(11)
However, the correlation for turbulent non-Newtonian flows proposed by Dodge and
Metzner [37] was not applicable for wood chip-water mixtures in pseudo-turbulent
(saltation flow) regions. Because of the similarity between friction loss curves for wood
chip-water mixtures in pseudo-turbulent regions and clear water lines defined by
Prandtl’s universal law of friction for turbulent pipe flow (Eq. 12), Gow [11] proposed a
new correlation (Eq. 14) where, with friction loss experimental data, a plot of √ ⁄
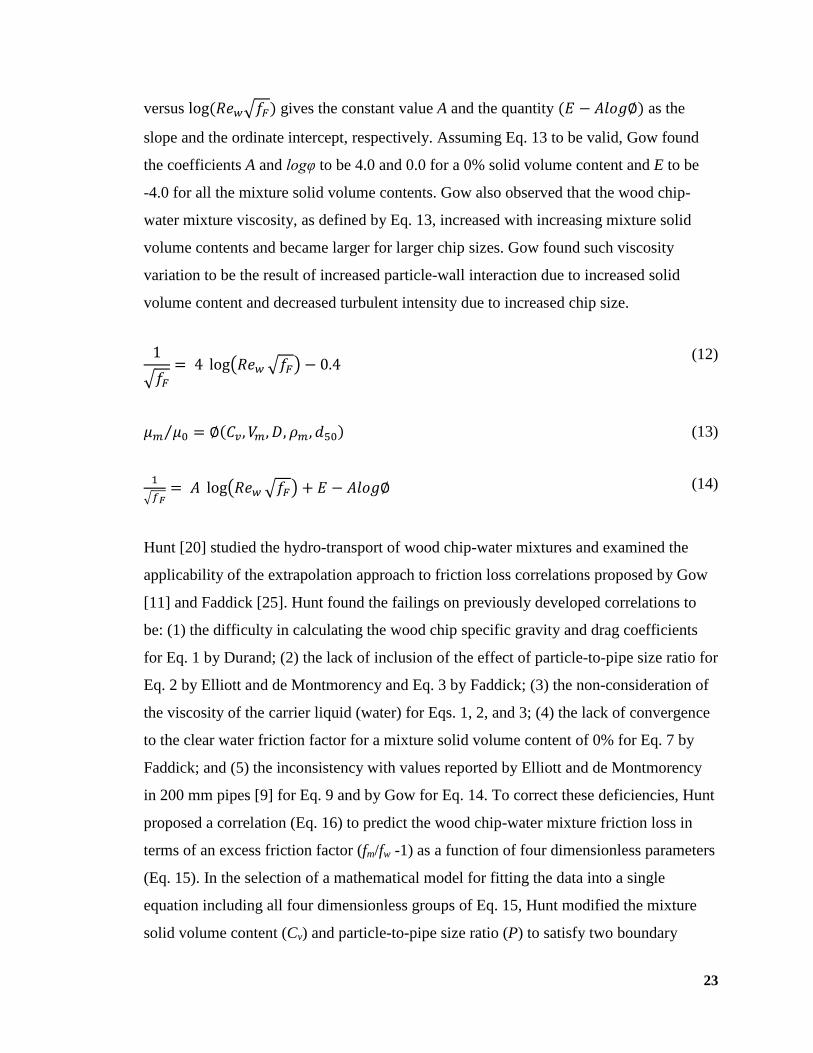
23
versus √ gives the constant value A and the quantity as the
slope and the ordinate intercept, respectively. Assuming Eq. 13 to be valid, Gow found
the coefficients A and logφ to be 4.0 and 0.0 for a 0% solid volume content and E to be
-4.0 for all the mixture solid volume contents. Gow also observed that the wood chip-
water mixture viscosity, as defined by Eq. 13, increased with increasing mixture solid
volume contents and became larger for larger chip sizes. Gow found such viscosity
variation to be the result of increased particle-wall interaction due to increased solid
volume content and decreased turbulent intensity due to increased chip size.
√ ( √ )
(12)
⁄ (13)
√ ( √ ) (14)
Hunt [20] studied the hydro-transport of wood chip-water mixtures and examined the
applicability of the extrapolation approach to friction loss correlations proposed by Gow
[11] and Faddick [25]. Hunt found the failings on previously developed correlations to
be: (1) the difficulty in calculating the wood chip specific gravity and drag coefficients
for Eq. 1 by Durand; (2) the lack of inclusion of the effect of particle-to-pipe size ratio for
Eq. 2 by Elliott and de Montmorency and Eq. 3 by Faddick; (3) the non-consideration of
the viscosity of the carrier liquid (water) for Eqs. 1, 2, and 3; (4) the lack of convergence
to the clear water friction factor for a mixture solid volume content of 0% for Eq. 7 by
Faddick; and (5) the inconsistency with values reported by Elliott and de Montmorency
in 200 mm pipes [9] for Eq. 9 and by Gow for Eq. 14. To correct these deficiencies, Hunt
proposed a correlation (Eq. 16) to predict the wood chip-water mixture friction loss in
terms of an excess friction factor (fm/fw -1) as a function of four dimensionless parameters
(Eq. 15). In the selection of a mathematical model for fitting the data into a single
equation including all four dimensionless groups of Eq. 15, Hunt modified the mixture
solid volume content (Cv) and particle-to-pipe size ratio (P) to satisfy two boundary
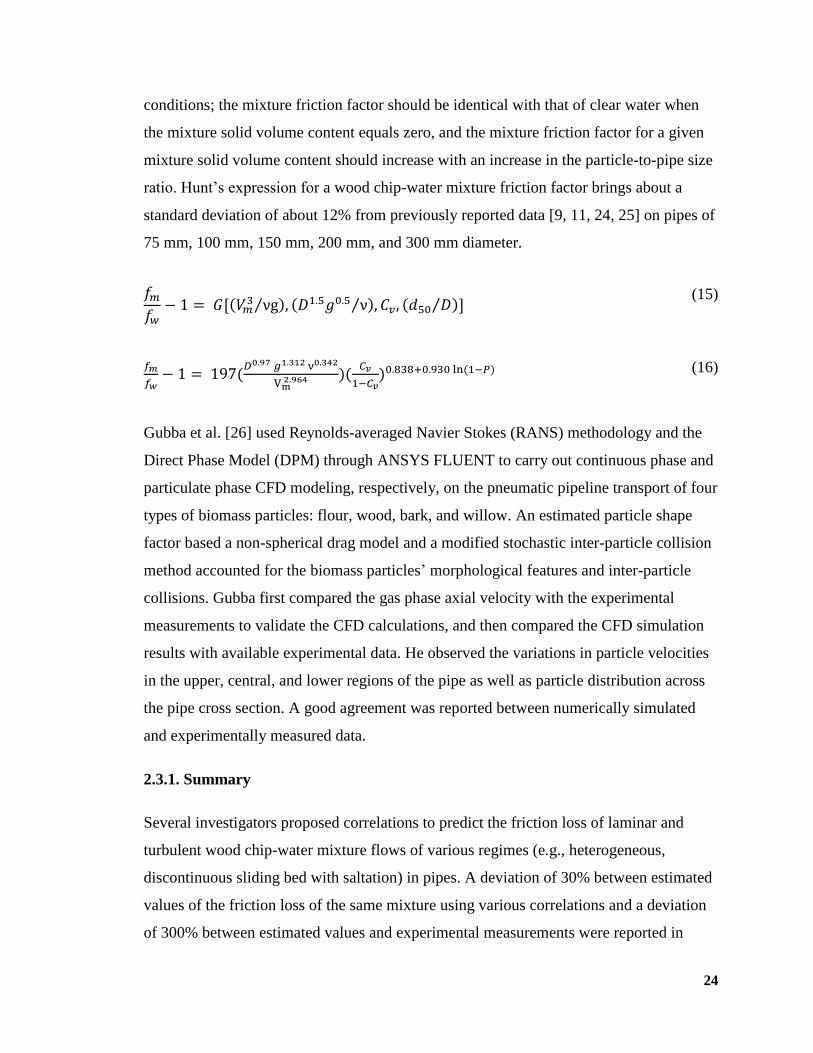
24
conditions; the mixture friction factor should be identical with that of clear water when
the mixture solid volume content equals zero, and the mixture friction factor for a given
mixture solid volume content should increase with an increase in the particle-to-pipe size
ratio. Hunt’s expression for a wood chip-water mixture friction factor brings about a
standard deviation of about 12% from previously reported data [9, 11, 24, 25] on pipes of
75 mm, 100 mm, 150 mm, 200 mm, and 300 mm diameter.
⁄ ⁄ ⁄
(15)
(16)
Gubba et al. [26] used Reynolds-averaged Navier Stokes (RANS) methodology and the
Direct Phase Model (DPM) through ANSYS FLUENT to carry out continuous phase and
particulate phase CFD modeling, respectively, on the pneumatic pipeline transport of four
types of biomass particles: flour, wood, bark, and willow. An estimated particle shape
factor based a non-spherical drag model and a modified stochastic inter-particle collision
method accounted for the biomass particles’ morphological features and inter-particle
collisions. Gubba first compared the gas phase axial velocity with the experimental
measurements to validate the CFD calculations, and then compared the CFD simulation
results with available experimental data. He observed the variations in particle velocities
in the upper, central, and lower regions of the pipe as well as particle distribution across
the pipe cross section. A good agreement was reported between numerically simulated
and experimentally measured data.
2.3.1. Summary
Several investigators proposed correlations to predict the friction loss of laminar and
turbulent wood chip-water mixture flows of various regimes (e.g., heterogeneous,
discontinuous sliding bed with saltation) in pipes. A deviation of 30% between estimated
values of the friction loss of the same mixture using various correlations and a deviation
of 300% between estimated values and experimental measurements were reported in

25
literature, both of which pointed out the need for additional experimental work. Wood
chip size, and density and viscosity of the carrier liquid were the variables not considered
in some of the proposed correlations. However, all the effective variables were included
in the more recently developed equations, where a standard deviation of only 12% from
previously obtained experimental data was reported.
2.4. Techno-economic Analyses
Following an empirical study on pipeline hydro-transport of pulpwood chips, Elliot and
de Montmorency [9, 19] studied the economic feasibility of wood chip transport via a
hypothetical system of pipelines leading from a landing to the mill (Fig. 2-2). The forest
field included a productive area of 2300 km2 with an annual cut of 0.9 Mm
3. The
aluminum pipeline was composed of surface-laid branch pipelines converging into a
buried feeder line that discharged into a buried main line. Elliot and de Montmorency
argued that the amount of water required, e.g., 2.5 Mm3/yr to transport 1.5 Mm
3/yr of
wood chips in a 40% solid volume content mixture, was not exceptionally large in terms
of the amount of resources available on most timber limits. Further, they presented the
power loss per kilometer distance for 150 mm, 200 mm, and 250 mm diameter pipes
carrying wood chips at mixture solid volume contents of 20%, 30%, and 40%. It was
shown that power and operating costs could be lowered by increasing the mixture solid
volume content and decreasing the pumping velocity, which would also increase capital
investments. The direct economic benefits named by researchers included low unit
transportation costs for an annual capacity over 0.7 Mm3, a minor increase in
transportation costs over a period of 20 years due to low labor requirements, low
depreciation compared to new road or rail construction, and a drastic reduction in mill,
forest, and in-transit inventories.
26
Fig. 2-2: Schematic of the proposed system by Elliot and de Montmorency [9, 19] for the
pipeline hydro-transport of wood chips
Using only the friction losses found experimentally, Brebner [22] calculated the cost of
transport of a 35% solid volume content wood chip-water mixture in a 200 mm diameter
pipeline at 2.0 m/s pumping velocity and 55% pump/motor efficiency to be 0.095 $/t.km.
No measurements of wear, corrosion, or erosion in the pipe (all of which could increase
capital costs) were taken by Brebner.
Wasp et al. [23], while reviewing wood chip pipelining, discussed the related economics.
Fig. 2-3(a) presents the investment cost and Fig. 2-3(b) shows the capital costs (including
carbon steel pipe, external coating, installation costs, positive displacement pump stations
and related facilities, communication system, water supply system, chip injection
facilities, terminal dewatering facilities, and indirect costs including a contingency
allowance, interest during construction, working capital, and engineering management)
and the operating costs (including electrical power costs for driving the pumps and
mixing, costs of operating personnel for the pipeline system, an allowance for chemical
corrosion inhibitors, supplies and maintenance for the pipeline and pump stations,
administration costs, and a contingency allowance) of such pipelines based on a 100 km

27
long pipeline capable of hydro-transporting various amounts of so-called green (35%
moisture content) wood chips at 20% solid volume content. Wasp also found the
sensitivity to change in length to be quite low, e.g., a 50% reduction in length causes a
7% increase in total unit transportation costs. In addition to showing the concept of
economy of scale, which is found to be highly applicable to pipeline systems, Fig. 2-3
shows that capital charges account for more than 70% of the total transportation cost, i.e.,
once the pipeline is constructed, 70% of the transportation costs are not subject to
escalation. This is a distinct advantage of pipeline hydro-transport over nearly every other
mode of transport. To achieve these results, Wasp used Elliot and de Montmorency’s [9]
friction loss data. Using Faddick’s [10] data increased the total and capital costs by 25%.
a) b)
Fig. 2-3: Wood chip pipeline capital and operating costs vs. pipeline capacity based on a
100 km pipeline for green chips at 35% moisture content, 20% wood chip-water mixture
solid volume content, and 310 operation days per year (operating factor 85%) [23],
Figures reproduced with the permission of Technical Association of the Pulp and Paper
Industry (TAPPI)
Hunt [38, 39] conducted an analysis to determine the conditions under which a pipeline
system might be economically competitive with other methods of transporting wood
chips to processing plants. The economic model to determine the cost of transporting one
tonne of wood chips for one kilometer by a given transportation system included the
0.2
0.4
0.6
0.8
1.0
1.2
1.0 2.0 3.0 4.0 5.0 6.0
Tra
nsp
ort
ati
on
Co
st (
$/t
.km
)
Transport Capacity (t/d)
Thousands
0.0
5.0
10.0
15.0
20.0
25.0
1.0 2.0 3.0 4.0 5.0 6.0
Tra
nsp
ort
ati
on
Co
st (
$/t
.km
)
Transport Capacity (t/d)
Thousands
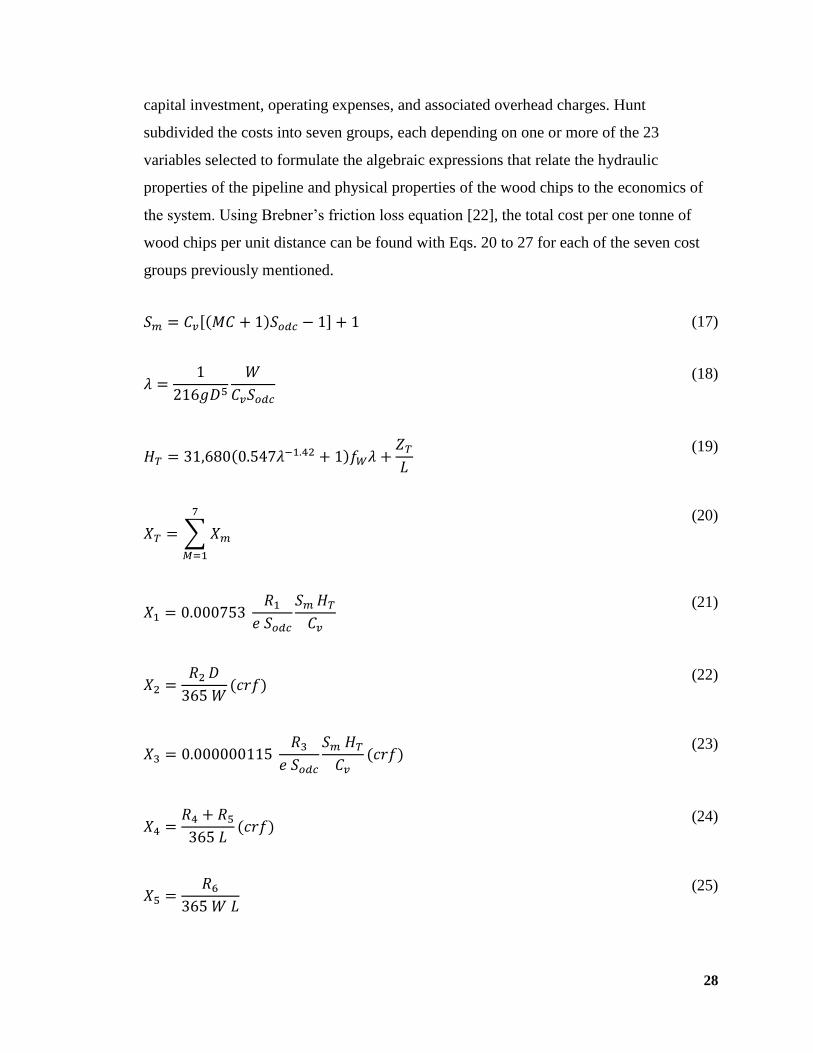
28
capital investment, operating expenses, and associated overhead charges. Hunt
subdivided the costs into seven groups, each depending on one or more of the 23
variables selected to formulate the algebraic expressions that relate the hydraulic
properties of the pipeline and physical properties of the wood chips to the economics of
the system. Using Brebner’s friction loss equation [22], the total cost per one tonne of
wood chips per unit distance can be found with Eqs. 20 to 27 for each of the seven cost
groups previously mentioned.
(17)
(18)
(19)
∑
(20)
(21)
(22)
(23)
(24)
(25)
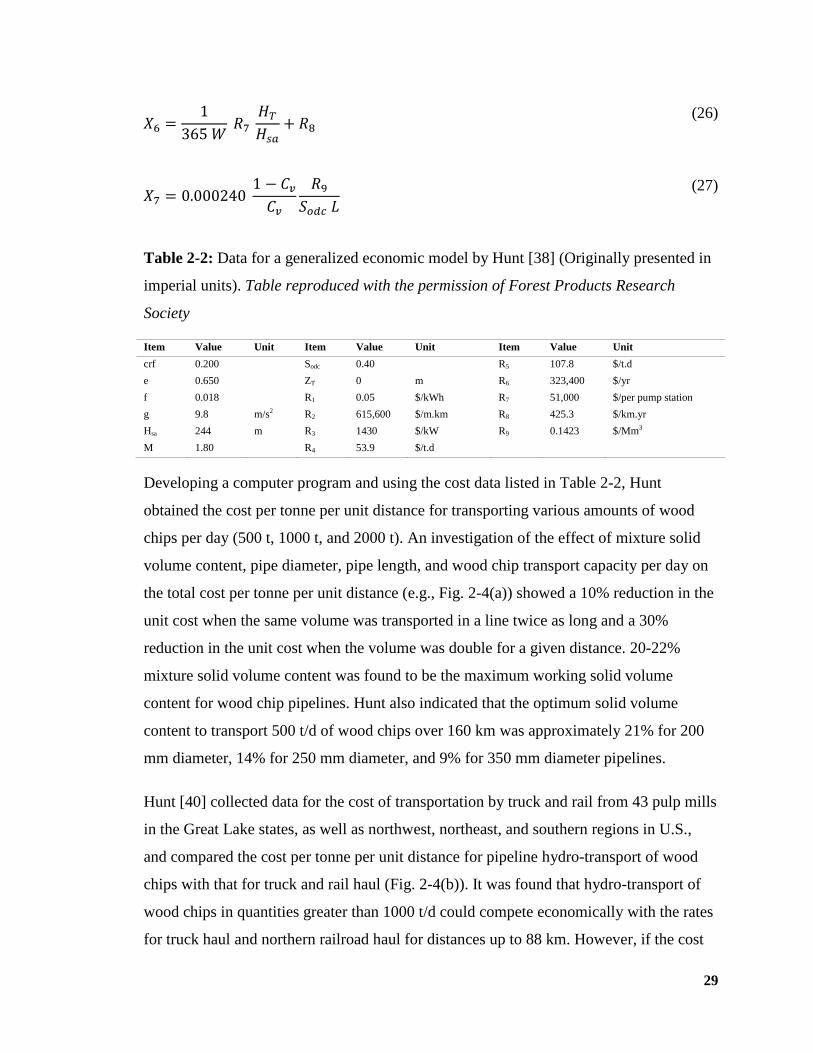
29
(26)
(27)
Table 2-2: Data for a generalized economic model by Hunt [38] (Originally presented in
imperial units). Table reproduced with the permission of Forest Products Research
Society
Item Value Unit Item Value Unit Item Value Unit
crf 0.200 Sodc 0.40 R5 107.8 $/t.d
e 0.650 ZT 0 m R6 323,400 $/yr
f 0.018 R1 0.05 $/kWh R7 51,000 $/per pump station
g 9.8 m/s2 R2 615,600 $/m.km R8 425.3 $/km.yr
Hsa 244 m R3 1430 $/kW R9 0.1423 $/Mm3
M 1.80 R4 53.9 $/t.d
Developing a computer program and using the cost data listed in Table 2-2, Hunt
obtained the cost per tonne per unit distance for transporting various amounts of wood
chips per day (500 t, 1000 t, and 2000 t). An investigation of the effect of mixture solid
volume content, pipe diameter, pipe length, and wood chip transport capacity per day on
the total cost per tonne per unit distance (e.g., Fig. 2-4(a)) showed a 10% reduction in the
unit cost when the same volume was transported in a line twice as long and a 30%
reduction in the unit cost when the volume was double for a given distance. 20-22%
mixture solid volume content was found to be the maximum working solid volume
content for wood chip pipelines. Hunt also indicated that the optimum solid volume
content to transport 500 t/d of wood chips over 160 km was approximately 21% for 200
mm diameter, 14% for 250 mm diameter, and 9% for 350 mm diameter pipelines.
Hunt [40] collected data for the cost of transportation by truck and rail from 43 pulp mills
in the Great Lake states, as well as northwest, northeast, and southern regions in U.S.,
and compared the cost per tonne per unit distance for pipeline hydro-transport of wood
chips with that for truck and rail haul (Fig. 2-4(b)). It was found that hydro-transport of
wood chips in quantities greater than 1000 t/d could compete economically with the rates
for truck haul and northern railroad haul for distances up to 88 km. However, if the cost
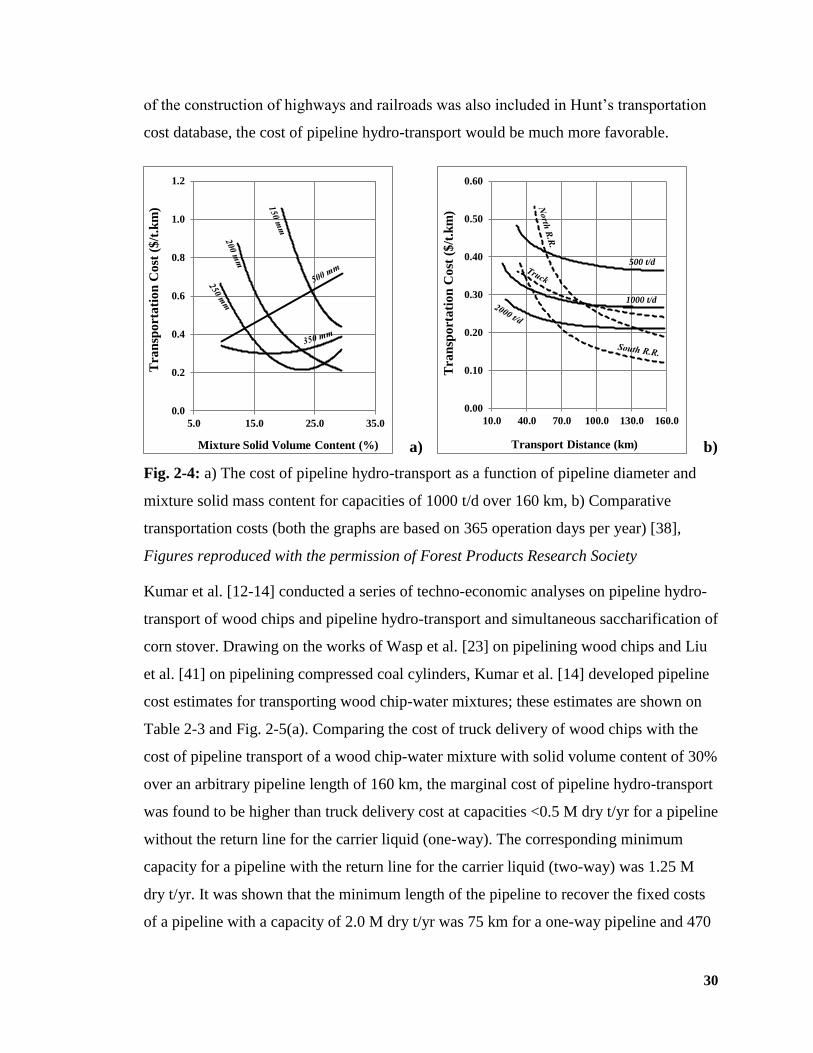
30
of the construction of highways and railroads was also included in Hunt’s transportation
cost database, the cost of pipeline hydro-transport would be much more favorable.
a) b)
Fig. 2-4: a) The cost of pipeline hydro-transport as a function of pipeline diameter and
mixture solid mass content for capacities of 1000 t/d over 160 km, b) Comparative
transportation costs (both the graphs are based on 365 operation days per year) [38],
Figures reproduced with the permission of Forest Products Research Society
Kumar et al. [12-14] conducted a series of techno-economic analyses on pipeline hydro-
transport of wood chips and pipeline hydro-transport and simultaneous saccharification of
corn stover. Drawing on the works of Wasp et al. [23] on pipelining wood chips and Liu
et al. [41] on pipelining compressed coal cylinders, Kumar et al. [14] developed pipeline
cost estimates for transporting wood chip-water mixtures; these estimates are shown on
Table 2-3 and Fig. 2-5(a). Comparing the cost of truck delivery of wood chips with the
cost of pipeline transport of a wood chip-water mixture with solid volume content of 30%
over an arbitrary pipeline length of 160 km, the marginal cost of pipeline hydro-transport
was found to be higher than truck delivery cost at capacities <0.5 M dry t/yr for a pipeline
without the return line for the carrier liquid (one-way). The corresponding minimum
capacity for a pipeline with the return line for the carrier liquid (two-way) was 1.25 M
dry t/yr. It was shown that the minimum length of the pipeline to recover the fixed costs
of a pipeline with a capacity of 2.0 M dry t/yr was 75 km for a one-way pipeline and 470
0.0
0.2
0.4
0.6
0.8
1.0
1.2
5.0 15.0 25.0 35.0
Tra
nsp
ort
ati
on
Co
st (
$/t
.km
)
Mixture Solid Volume Content (%)
0.00
0.10
0.20
0.30
0.40
0.50
0.60
10.0 40.0 70.0 100.0 130.0 160.0
Tra
nsp
ort
ati
on
Co
st (
$/t
.km
) Transport Distance (km)
500 t/d
1000 t/d

31
km for a two-way pipeline (in addition to the initial 35 km truck haul to the pipeline
inlet). In addition, the authors investigated the drop in the lower heating value (LHV) of
biomass because of the take-up of the carrier liquid and discussed the limited application
of pipeline hydro-transport of biomass to supply aqueous-based processes only, e.g., bio-
ethanol production or supercritical water gasification.
Table 2-3: Economic and technical parameters used by Kumar et al. to estimate the
capital and operating costs of a wood chip-water mixture pipeline [13], Table reproduced
with the permission of Springer Publication
Item Value Unit
Life of pipeline 30 yr
Contingency cost 20 % of total cost
Engineering cost 10 % of total capital cost
Discount rate 10 %
Operating factor 0.85
Power cost 50 $/MWh
Velocity of slurry 1.5 m/s
Velocity of water in water return line 2.0 m/s
Maximum pressure 4100 kPa
Pump efficiency 80 %
Scale factor applied to inlet, outlet, and booster station facilities excluding pumps 0.75
Kumar et al. [14] also investigated the pipeline hydro-transport of corn stover and found
the one-way pipeline at a scale of 1.0 to 2.0 M dry t/yr and mixture solid volume content
of above 15% to cost less than truck delivery (Fig. 2-5). To estimate the corn stover-
water mixture friction factor in pipes, Kumar et al. used Hunt’s correlation [20], which
was originally proposed for wood chip-water mixtures in pipes. However, they examined
the sensitivity to friction factor parameter and found that a variation of -50% to +100% in
friction factor results in a -16% to +31% change in the distance variable cost of pipeline
hydro-transport of corn stover, a sensitivity that did not invalidate the conclusion of the
study.
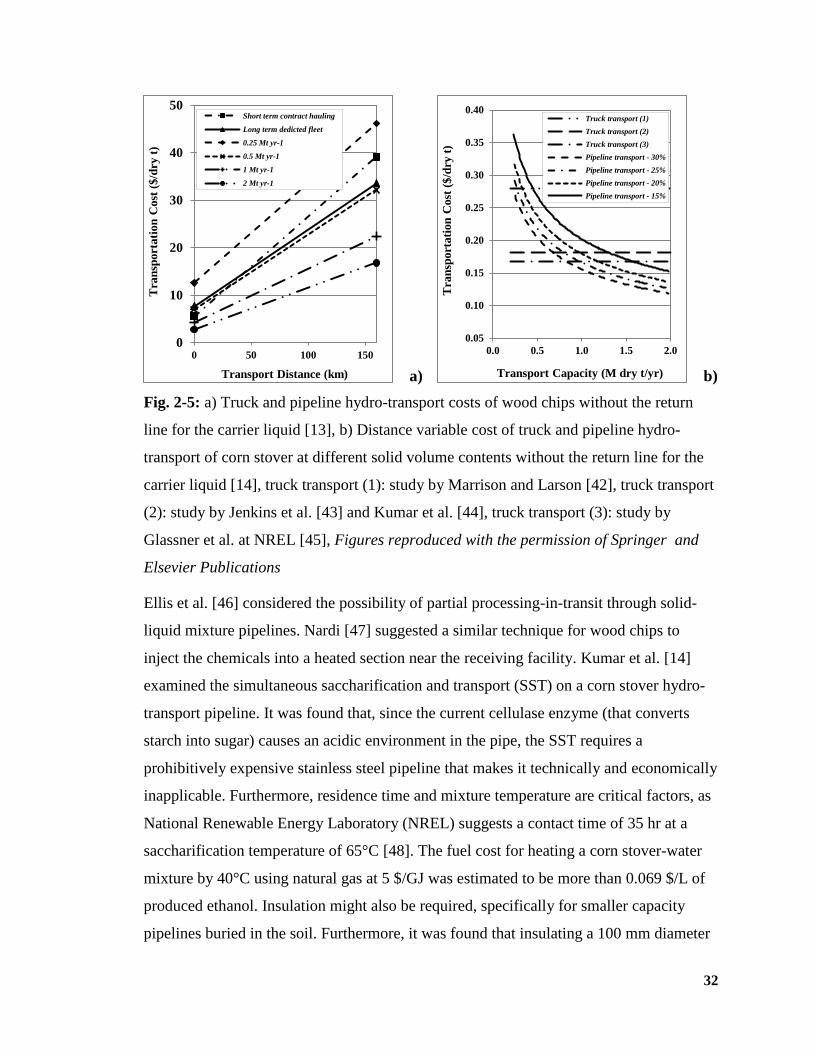
32
a) b)
Fig. 2-5: a) Truck and pipeline hydro-transport costs of wood chips without the return
line for the carrier liquid [13], b) Distance variable cost of truck and pipeline hydro-
transport of corn stover at different solid volume contents without the return line for the
carrier liquid [14], truck transport (1): study by Marrison and Larson [42], truck transport
(2): study by Jenkins et al. [43] and Kumar et al. [44], truck transport (3): study by
Glassner et al. at NREL [45], Figures reproduced with the permission of Springer and
Elsevier Publications
Ellis et al. [46] considered the possibility of partial processing-in-transit through solid-
liquid mixture pipelines. Nardi [47] suggested a similar technique for wood chips to
inject the chemicals into a heated section near the receiving facility. Kumar et al. [14]
examined the simultaneous saccharification and transport (SST) on a corn stover hydro-
transport pipeline. It was found that, since the current cellulase enzyme (that converts
starch into sugar) causes an acidic environment in the pipe, the SST requires a
prohibitively expensive stainless steel pipeline that makes it technically and economically
inapplicable. Furthermore, residence time and mixture temperature are critical factors, as
National Renewable Energy Laboratory (NREL) suggests a contact time of 35 hr at a
saccharification temperature of 65°C [48]. The fuel cost for heating a corn stover-water
mixture by 40°C using natural gas at 5 $/GJ was estimated to be more than 0.069 $/L of
produced ethanol. Insulation might also be required, specifically for smaller capacity
pipelines buried in the soil. Furthermore, it was found that insulating a 100 mm diameter
0
10
20
30
40
50
0 50 100 150
Tra
nsp
ort
ati
on
Cost
($
/dry
t)
Transport Distance (km)
Short term contract hauling
Long term dedicted fleet
0.25 Mt yr-1
0.5 Mt yr-1
1 Mt yr-1
2 Mt yr-1
0.05
0.10
0.15
0.20
0.25
0.30
0.35
0.40
0.0 0.5 1.0 1.5 2.0
Tra
nsp
ort
ati
on
Cost
($
/dry
t)
Transport Capacity (M dry t/yr)
Truck transport (1)
Truck transport (2)
Truck transport (3)
Pipeline transport - 30%
Pipeline transport - 25%
Pipeline transport - 20%
Pipeline transport - 15%
33
pipeline carrying 1.5 M dry t/yr with 25 mm of foam would cause an approximately 15%
increase in the installed cost of a corn stover-water mixture pipeline and a 10% increase
in the distance variable cost.
Sawai et al. [15], while investigating hydro-transport of wood chips by hilly terrain
pipelines, compared the energy required for pipeline hydro-transport systems with that
for cable logging systems. While Harada [49] estimated the energy required by cable
logging and mobile tower yarder to transport trees between forest and forestry road to be
about 500 MJ/t, Sawai found the energy required to transport wood chips through a
pipeline of 200 m length and 300 mm diameter across a terrain of 30° inclination to be
only about 5.0 MJ/t.
2.4.1. Summary
Based on experimental measurements and empirical correlations reported in the
literature, a few researchers studied the economic feasibility of pipelining wood chip-
water mixtures to processing plants. The concept of economy of scale was found to be
highly applicable to pipeline systems, the water required at the pipeline inlet was reported
to be not exceptionally large (in relation to the amount of resources available on most
timber limits), and a 25% variation in the total cost of a pipeline system was obtained by
using various pressure drop correlations. It was shown that the power required and,
accordingly, the operating costs of the pipeline system would decrease and the capital
costs of the pipeline system would increase with an increase in solid volume content,
decrease in mixture velocity, and increase in pipeline length. Furthermore, capital charges
were reported to account for more than 70% of the total transportation cost.
2.5. Conclusion
The potential of biomass-based fuels as economically viable replacements for fossil fuels
is being increasingly recognized. Using pipeline hydro-transport to replace traditional
truck delivery is a major step towards building large-scale bio-based fuel production
facilities. This paper reviewed the literature published on pipeline hydro-transport of
wood chips and agricultural residue biomass for pulp and paper production, as well as for
34
fuel and energy generation. The technical challenges and economic issues were reviewed,
and correlations to predict biomass-water mixture mechanical behavior were introduced.
None of the studies conducted either experimentally or theoretically considered wear,
corrosion, or erosion in a pipeline, all of which could impact the mechanical
specifications (e.g., friction loss) and economic features (e.g., capital cost) of the pipeline
and which should be measured/calculated in future studies. As described in this paper,
pipeline hydro-transport of wheat straw biomass has been experimentally studied on a 50
mm diameter and 25 m long (laboratory-scale) horizontal pipeline facility. Scaling up
such a pipeline must be studied to understand how the change in pipeline diameter and
orientation would change the slurry mechanical behavior. More research needs to be
conducted to develop empirical correlations to estimate corresponding slurry friction loss.
Such correlations could be used to study the economy of agricultural residue pipelines, as
previous studies on this field used friction loss correlations originally proposed for wood
chip-water mixtures instead. Water mixtures of other sorts of biomass materials could be
also investigated to understand how biomass physical specifications would change slurry
mechanical behavior. Chemical processing-in-transit through pipeline hydro-transport of
biomass materials is another interesting issue that, although its economic viabilities have
been analyzed, needs its mechanical and chemical feasibility to be experimentally
investigated.
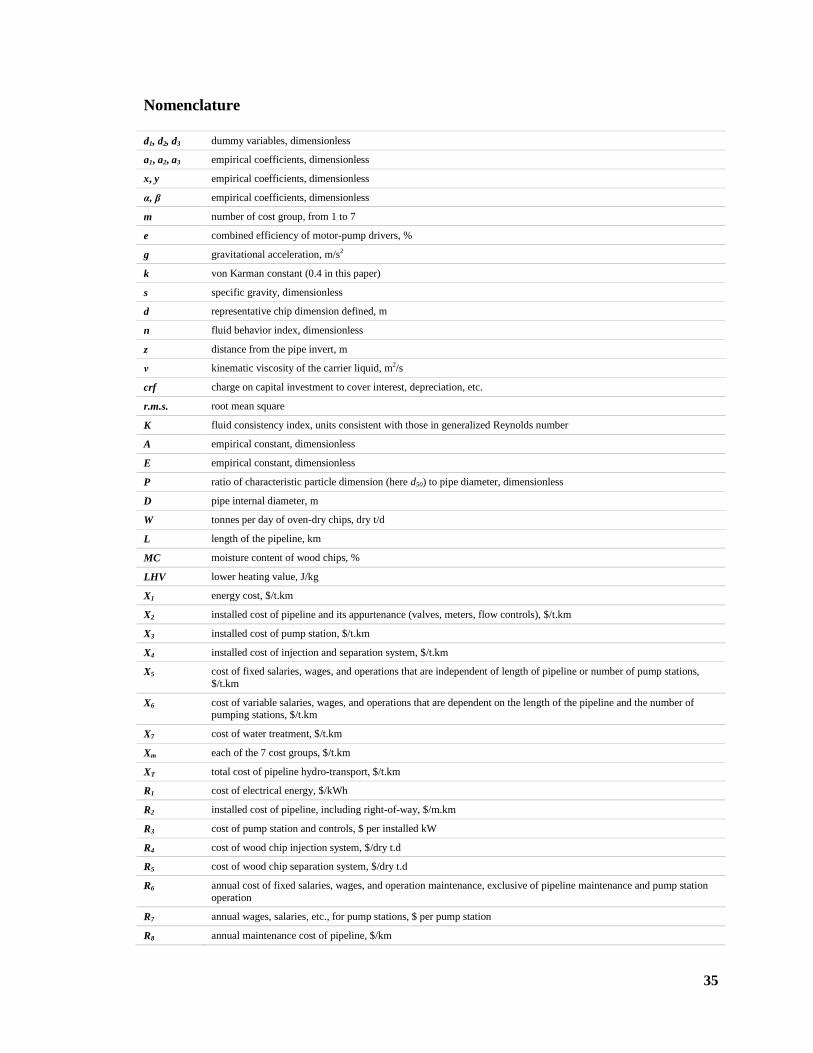
35
Nomenclature
d1, d2, d3 dummy variables, dimensionless
a1, a2, a3 empirical coefficients, dimensionless
x, y empirical coefficients, dimensionless
α, β empirical coefficients, dimensionless
m number of cost group, from 1 to 7
e combined efficiency of motor-pump drivers, %
g gravitational acceleration, m/s2
k von Karman constant (0.4 in this paper)
s specific gravity, dimensionless
d representative chip dimension defined, m
n fluid behavior index, dimensionless
z distance from the pipe invert, m
ν kinematic viscosity of the carrier liquid, m2/s
crf charge on capital investment to cover interest, depreciation, etc.
r.m.s. root mean square
K fluid consistency index, units consistent with those in generalized Reynolds number
A empirical constant, dimensionless
E empirical constant, dimensionless
P ratio of characteristic particle dimension (here d50) to pipe diameter, dimensionless
D pipe internal diameter, m
W tonnes per day of oven-dry chips, dry t/d
L length of the pipeline, km
MC moisture content of wood chips, %
LHV lower heating value, J/kg
X1 energy cost, $/t.km
X2 installed cost of pipeline and its appurtenance (valves, meters, flow controls), $/t.km
X3 installed cost of pump station, $/t.km
X4 installed cost of injection and separation system, $/t.km
X5 cost of fixed salaries, wages, and operations that are independent of length of pipeline or number of pump stations,
$/t.km
X6 cost of variable salaries, wages, and operations that are dependent on the length of the pipeline and the number of pumping stations, $/t.km
X7 cost of water treatment, $/t.km
Xm each of the 7 cost groups, $/t.km
XT total cost of pipeline hydro-transport, $/t.km
R1 cost of electrical energy, $/kWh
R2 installed cost of pipeline, including right-of-way, $/m.km
R3 cost of pump station and controls, $ per installed kW
R4 cost of wood chip injection system, $/dry t.d
R5 cost of wood chip separation system, $/dry t.d
R6 annual cost of fixed salaries, wages, and operation maintenance, exclusive of pipeline maintenance and pump station
operation
R7 annual wages, salaries, etc., for pump stations, $ per pump station
R8 annual maintenance cost of pipeline, $/km
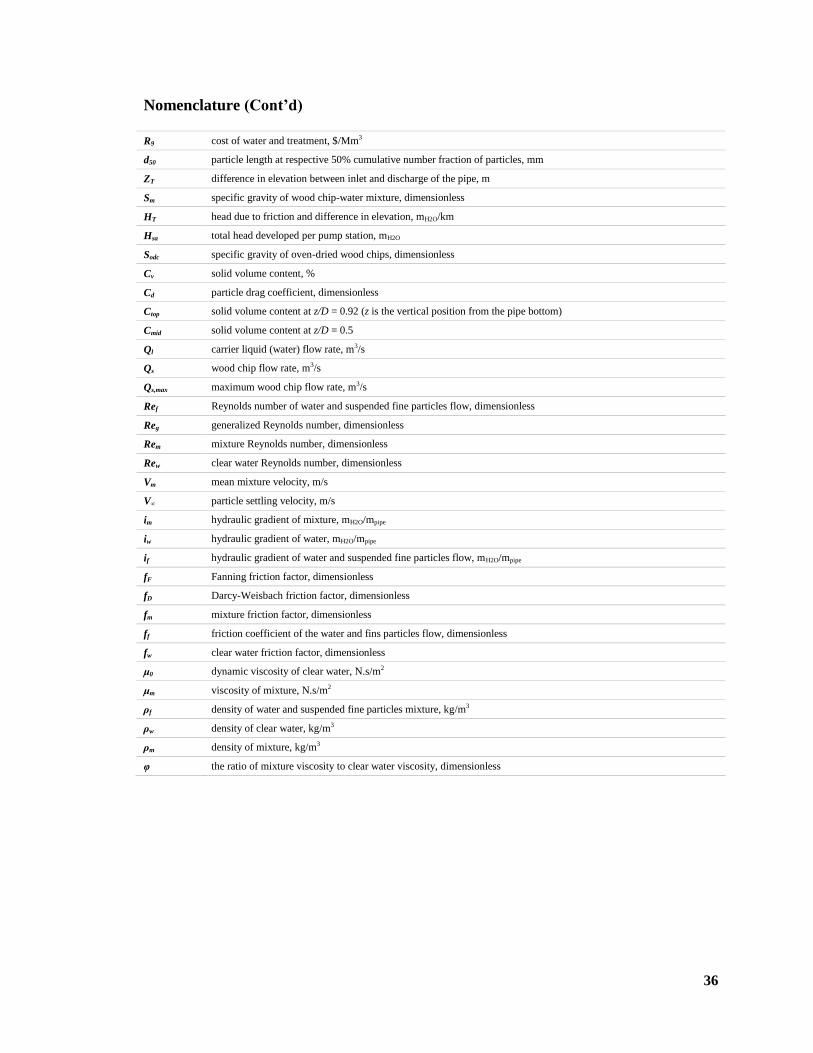
36
Nomenclature (Cont’d)
R9 cost of water and treatment, $/Mm3
d50 particle length at respective 50% cumulative number fraction of particles, mm
ZT difference in elevation between inlet and discharge of the pipe, m
Sm specific gravity of wood chip-water mixture, dimensionless
HT head due to friction and difference in elevation, mH2O/km
Hsa total head developed per pump station, mH2O
Sodc specific gravity of oven-dried wood chips, dimensionless
Cv solid volume content, %
Cd particle drag coefficient, dimensionless
Ctop solid volume content at z/D = 0.92 (z is the vertical position from the pipe bottom)
Cmid solid volume content at z/D = 0.5
Ql carrier liquid (water) flow rate, m3/s
Qs wood chip flow rate, m3/s
Qs,max maximum wood chip flow rate, m3/s
Ref Reynolds number of water and suspended fine particles flow, dimensionless
Reg generalized Reynolds number, dimensionless
Rem mixture Reynolds number, dimensionless
Rew clear water Reynolds number, dimensionless
Vm mean mixture velocity, m/s
V∞ particle settling velocity, m/s
im hydraulic gradient of mixture, mH2O/mpipe
iw hydraulic gradient of water, mH2O/mpipe
if hydraulic gradient of water and suspended fine particles flow, mH2O/mpipe
fF Fanning friction factor, dimensionless
fD Darcy-Weisbach friction factor, dimensionless
fm mixture friction factor, dimensionless
ff friction coefficient of the water and fins particles flow, dimensionless
fw clear water friction factor, dimensionless
μ0 dynamic viscosity of clear water, N.s/m2
μm viscosity of mixture, N.s/m2
ρf density of water and suspended fine particles mixture, kg/m3
ρw density of clear water, kg/m3
ρm density of mixture, kg/m3
φ the ratio of mixture viscosity to clear water viscosity, dimensionless
37
References
[1] Abulnaga, B. Slurry systems handbook: McGraw-Hill, New York, NY; 2002.
[2] Bain, A.J., Bonnington, S.T. The hydraulic transport of solids by pipeline:
Pergamon Press, New York, NY, US; 1970.
[3] Weston, M.D., Worthen, L. Chevron phosphate slurry pipeline commissioning
and start-up. 12th International Conference on Coal and Slurry Technology. Washington,
DC; 1987.
[4] TRAPIL, Petrolum pipeline transport company, How pipelines work? Available
from http://www.trapil.fr/uk/comcamarche4.asp. Accessed April 2013.
[5] Duffy, G.G. Measurement, mechanisms, and models: some important insights into
the mechanisms of flow of fibre suspensions. Annual Transaction of Nordic Rheology
Society, 2006; 14: 19-31.
[6] Lee, P.F.W., Duffy, G.G. Analysis of drag reducing regime of pulp suspension
flow. Tappi, 1976 (a); 59: 119-22.
[7] Moller, K. Correlation of pipe friction data for paper pulp suspensions. Industrial
and Engineering Chemistry Process Design and Development, 1976; 15: 16-19.
[8] Paul, T., Duffy, G., Chen, D. New insights into the flow of pulp suspensions.
Tappi Solutions, 2001; 1.
[9] Elliott, D.R., de Montmorency, W.H. The transportation of pulpwood chips in
pipelines. Report of an exploratory study. Montreal: Pulp and Paper Institute of Canada;
1963.
[10] Faddick, R.R. The aqueous transport of pulpwood chips in a four inch aluminum
pipe. Kingston, Ontario: Queen's University; 1963.
[11] Gow, J.L. Hydraulic transport of woodchips in pipelines. Bozeman: Montana
State University; 1971.
[12] Kumar, A., Cameron, J.B., Flynn, P.C. Large-scale ethanol fermentation through
pipeline delivery of biomass. Applied Biochemistry and Biotechnology, 2005; 121: 47-
58.
[13] Kumar, A., Cameron, J.B., Flynn, P.C. Pipeline transport of biomass. Applied
Biochemistry and Biotechnology, 2004; 113: 27-39.
38
[14] Kumar, A., Cameron, J.B., Flynn, P.C. Pipeline transport and simultaneous
saccharification of corn stover. Bioresource Technology, 2005; 96: 819-29.
[15] Sawai, T., Kajimoto, T., Ohmasa, M., Shibue, T., Nishi, K. Hydraulic
transportation system of chips by Hilly Terrain Pipelines. 22nd International Symposium
on Transport Phenomena. Delft, The Netherlands 2011.
[16] Vaezi, M., Katta, A.K., Kumar, A. Investigation into the mechanisms of pipeline
transport of slurries of wheat straw and corn stover to supply a bio-refinery. Biosystems
Engineering, 2014; 118: 52-67.
[17] Vaezi, M., Kumar, A. The flow of wheat straw suspensions in an open impeller
centrifugal pump. Biomass and Bioenergy, 2014; XX: XX.
[18] Vaezi, M., Pandey, V., Kumar, A., Bhattacharyya, S. Lignocellulosic biomass
particle shape and size distribution analysis using digital image processing for pipeline
hydro-transportation. Biosystems Engineering, 2013; 114: 97-112.
[19] Elliott, D.R. The transportation of pulpwood chips in pipelines. Pulp and Paper
Magazine of Canada, 1960; 61: 170-75.
[20] Hunt, W.A. Friction factors for mixtures of wood chips and water flowing in
pipelines. 4th Hydrotransport Internatinoal Conference. Banff, AB, Canada; 1976.
[21] O'donnell, J.P. Diversification of owners is common in products pipeline. Oil and
Gas Journal, 1964; 62: 88-100.
[22] Brebner, A. On pumping of wood chips through 4 inch aluminum pipe-line.
Canadian Journal of Chemical Engineering, 1964; 42: 139-42.
[23] Wasp, E.J., Aude, T.C., Thompson, T.L., Bailey, C.D. Economics of chip
pipelining. Tappi, 1967; 50: 313-18.
[24] Soucy, A. Data supplied to R.R. Faddick by Laval University. Quebec City,
Quebec; 1968.
[25] Faddick, R.R. Hydraulic transportation of solids in pipelines. Bozeman: Montana
State University; 1970.
[26] Gubba, S.R., Ingham, D.B., Larsen, K.J., Ma, L., Pourkashanian, M., Qian, X., et
al. Investigations of the transportation characteristics of biomass fuel particles in a
horizontal pipeline through CFD modelling and experimental measurement. Biomass &
Bioenergy, 2012; 46: 492-510.
39
[27] Wasp, E.J., Regan, T.J., Withers, J., Cook, P.A.C., Clancey, J.T. Crosscountry
coal pipeline hydraulics. Pipeline News, 1963; 35: 20-28.
[28] Schmidt, R.E. An investigation of the effects of pressure and time on the specific
gravity, moisture content, and volume of wood chips in a water slurry. Civil Engineering:
Montana State University; 1965.
[29] Mohamadabadi, H.S. Characterization and pipelining of biomass slurries.
University of Alberta; 2009.
[30] Luk, J., Mohammadabadi, H.S., Kumar, A. Pipeline transport of biomass:
Experimental development of wheat straw slurry pressure loss gradients Biomass and
Bioenergy, 2014; 64: 329-36.
[31] Luk, J. Pipeline transport of wheat straw slurry. University of Alberta; 2010.
[32] Durand, R., Condolios, G. The hydraulic trasnport of coal and solids in pipes.
Hydraulic Transport of Coal Conference London; 1952.
[33] Worster, R.C. Hydraulic transport of solids. Hydraulic transport of coal
conference London; 1952.
[34] Gibert, R. Hydraulic transport and discharge of mixtures in pipes. Report by
Annals of Roads and Bridges; 1960.
[35] Zandi, I., Govatos, G. Hetrogeneous flow of solids in pipelines. ASCE Journal of
the Hydraulic Devision, 1967; 93: 145-59.
[36] Metzner, A.B., Reed, J.C. Flow of non-Newtonian fluids - correlation of the
laminar, transition, and turbulent flow regions. Aiche Journal, 1955; 1: 434-40.
[37] Dodge, D.W., Metzner, A.B. Turbulent flow of non-Newtonian systems. Aiche
Journal, 1959; 5: 189-204.
[38] Hunt, W.A. Economic analysis of wood chip pipeline. Forest Products, 1967; 17:
68-74.
[39] Hunt, W.A. Continuous flow transport of low value forst products by hydraulic
pipeline [Unpublished report to Intermountain Forest and Range Experiment Station].
Bozman, Montana; 1962.
[40] Scheer, A.C. Survey on wood chips transportation charges [Unpublished report to
Intermountain Forest and Range Experiment Station]. Bozman, Montana; 1962.
40
[41] Liu, H., Noble, J., Zuniga, R., Wu, J. Economic analysis of coal log pipeline
transportation of coal. Report No 95-1. Capsule Pipeline Research Center (CPRC),
University of Missouri, Columbia, USA; 1995.
[42] Marrison, C.I., Larson, E.D. Cost versus scale for advanced plantation-based
biomass energy systems in the US and Brazil. Proceeding of Second Biomass Conference
of the Americas: Energy, Environment, Agriculture, and Industry; 1995, p. 1272-90.
[43] Jenkins, B.M., Dhaliwal, R.B., Summers, M.D., Bernheim, L.G., Lee, H.,
Huisman, W., et al. Equipment performance, costs, and constraints in the commercial
harvesting of rice straw for industrial applications. American Society of Agricultural
Engineers (ASAE) Conference; 2000.
[44] Kumar, A., Cameron, J.B., Flynn, P.C. Biomass power cost and optimum plant
size in western Canada. Biomass & Bioenergy, 2003; 24: 445-64.
[45] Glassner, D., Hettenhaus, J., Schechinger, T. Corn stover collection project.
Bioenergy Conference. Madison, WI, USA; 1998, p. 1100-10.
[46] Ellis, H.S., Redberger, P.J., Bolt, L.H. Slurries: basic principles and power
requirements. Industrial and Engineering Chemistry, 1963; 55: 18-26.
[47] Nardi, J. Pumping solids through a pipeline. Pipeline News, 1959: 26-33.
[48] Aden, A., Ruth, M., Ibsen, K., Jechura, J., Neeves, K., Sheehan, J., et al.
Lignocellulosic biomass to ethanol process design and economics utilizing co-current
dilute acid prehydrolysis and enzymatic hydrolysis for corn stover, Report no. NREL/TP-
510-32438. National Renewable Energy Laboratory; 2002.
[49] Harada, T. Energy consumption in utilization of woody biomass. Wood Industry,
2002; 57: 480-83.
41
CHAPTER 3
Lignocellulosic Biomass Particle Shape and Size Distribution
Analysis Using Digital Image Processing for Pipeline Hydro-
transportation1
3.1. Introduction
Pipeline hydro-transport of agricultural residue biomass (e.g., wheat straw or corn stover)
in the form of solid-liquid mixture (slurry) involves chopping of feedstock, classifying
based upon size, mixing with water up to certain solid mass content (concentration)
levels, and pumping through a pipeline [1-3]. Apart from several factors affecting initial
and operating parameters, biomass particles shape and size are critical factors in slurry
pipeline transport. Above certain slurry solid mass contents, the decrease in size of the
particles increases the slurry pressure drop [4-6]. Similarly, decrease in size of the
particles increases the sugar-release from the biomass during the pipeline hydro-
transport. These observations illustrate the importance of particle size in the pipeline
hydro-transport. Hence, investigating particle size distribution (PSD) and morphological
features, not only helps to analyse slurry flow behaviour, but also helps to modify the
slurry preparation processes to optimise the design and operation of agricultural residue
biomass pipelines and facilities. Knowledge of particle size also helps in understanding
how feedstock type and pre-processing procedures impact PSD and morphological
features, and ultimately the pipeline hydro-transport of biomass in the form of slurry.
PSD analysis is considered a standard procedure to evaluate the dimensional
characteristics and morphological features of particulate materials. American Society of
Agricultural and Biological Engineers (ASABE) adopted PSD analysis to determine and
express the particle size of chopped forage materials by mechanical screening [7].
However, mechanical sieving comes with drawbacks, e.g., number of available standard
1 Vaezi, M., Pandey. V., Kumar. A., Bhattacharyya. S., Biosystems Engineering, 2013; 114: 97-112.
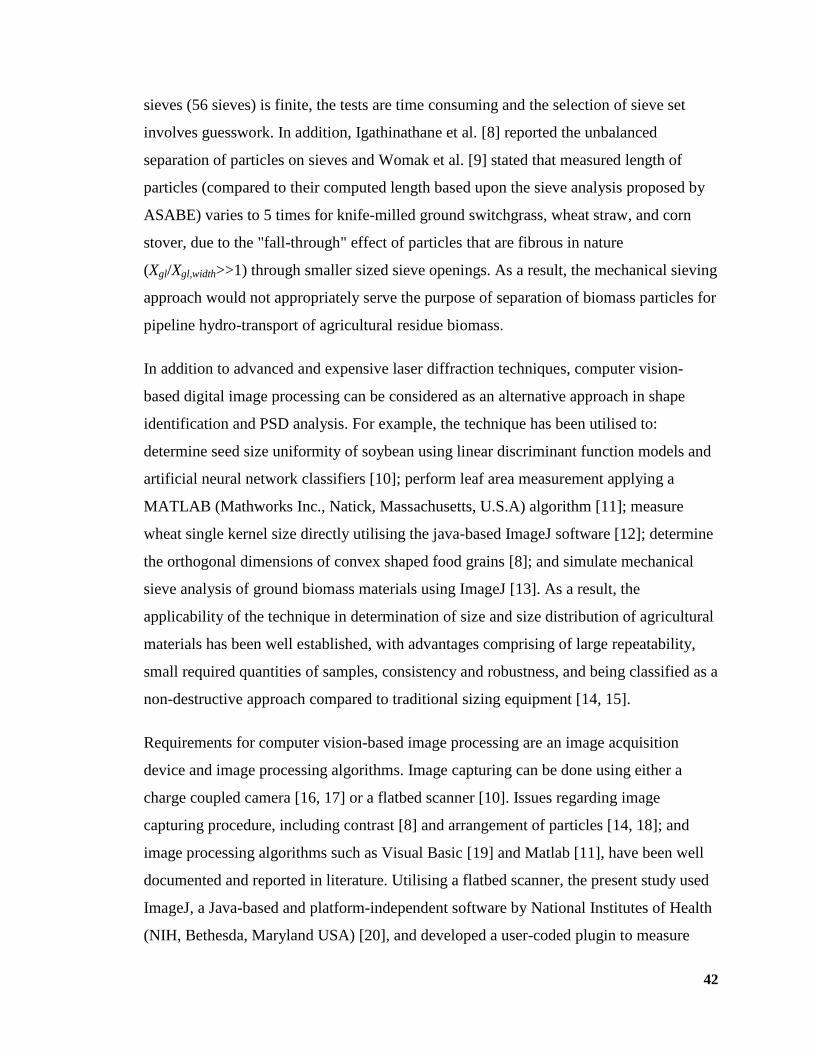
42
sieves (56 sieves) is finite, the tests are time consuming and the selection of sieve set
involves guesswork. In addition, Igathinathane et al. [8] reported the unbalanced
separation of particles on sieves and Womak et al. [9] stated that measured length of
particles (compared to their computed length based upon the sieve analysis proposed by
ASABE) varies to 5 times for knife-milled ground switchgrass, wheat straw, and corn
stover, due to the "fall-through" effect of particles that are fibrous in nature
(Xgl/Xgl,width>>1) through smaller sized sieve openings. As a result, the mechanical sieving
approach would not appropriately serve the purpose of separation of biomass particles for
pipeline hydro-transport of agricultural residue biomass.
In addition to advanced and expensive laser diffraction techniques, computer vision-
based digital image processing can be considered as an alternative approach in shape
identification and PSD analysis. For example, the technique has been utilised to:
determine seed size uniformity of soybean using linear discriminant function models and
artificial neural network classifiers [10]; perform leaf area measurement applying a
MATLAB (Mathworks Inc., Natick, Massachusetts, U.S.A) algorithm [11]; measure
wheat single kernel size directly utilising the java-based ImageJ software [12]; determine
the orthogonal dimensions of convex shaped food grains [8]; and simulate mechanical
sieve analysis of ground biomass materials using ImageJ [13]. As a result, the
applicability of the technique in determination of size and size distribution of agricultural
materials has been well established, with advantages comprising of large repeatability,
small required quantities of samples, consistency and robustness, and being classified as a
non-destructive approach compared to traditional sizing equipment [14, 15].
Requirements for computer vision-based image processing are an image acquisition
device and image processing algorithms. Image capturing can be done using either a
charge coupled camera [16, 17] or a flatbed scanner [10]. Issues regarding image
capturing procedure, including contrast [8] and arrangement of particles [14, 18]; and
image processing algorithms such as Visual Basic [19] and Matlab [11], have been well
documented and reported in literature. Utilising a flatbed scanner, the present study used
ImageJ, a Java-based and platform-independent software by National Institutes of Health
(NIH, Bethesda, Maryland USA) [20], and developed a user-coded plugin to measure
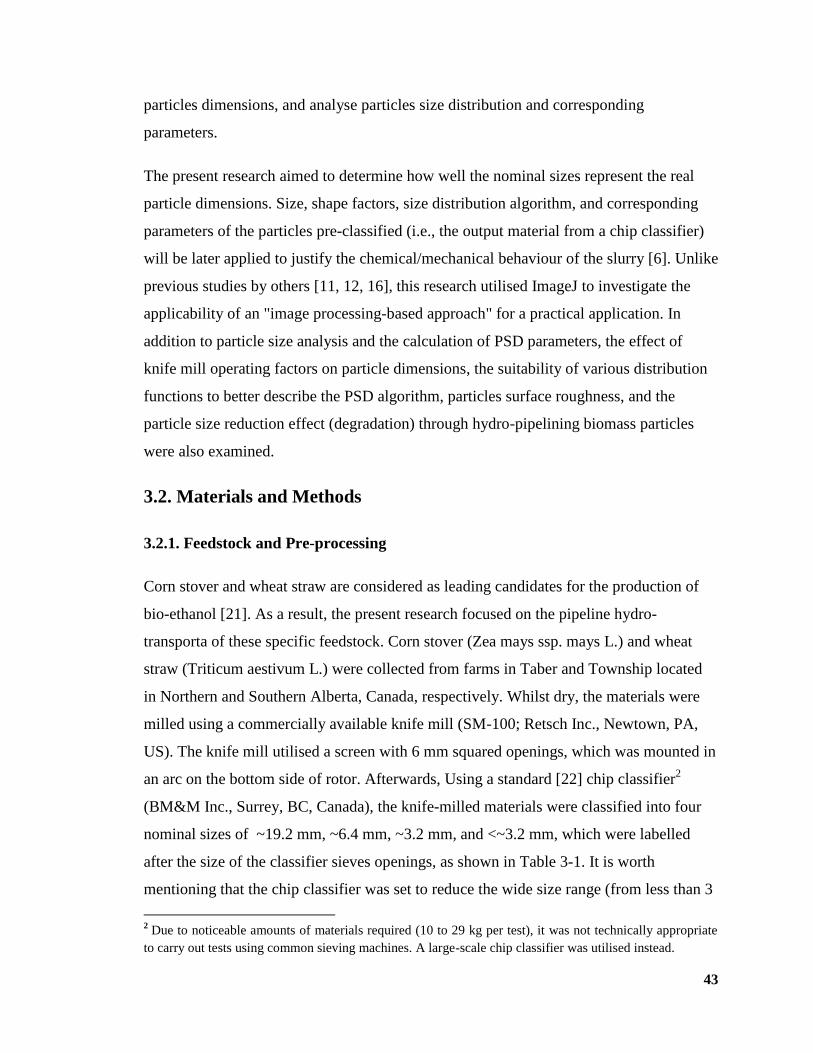
43
particles dimensions, and analyse particles size distribution and corresponding
parameters.
The present research aimed to determine how well the nominal sizes represent the real
particle dimensions. Size, shape factors, size distribution algorithm, and corresponding
parameters of the particles pre-classified (i.e., the output material from a chip classifier)
will be later applied to justify the chemical/mechanical behaviour of the slurry [6]. Unlike
previous studies by others [11, 12, 16], this research utilised ImageJ to investigate the
applicability of an "image processing-based approach" for a practical application. In
addition to particle size analysis and the calculation of PSD parameters, the effect of
knife mill operating factors on particle dimensions, the suitability of various distribution
functions to better describe the PSD algorithm, particles surface roughness, and the
particle size reduction effect (degradation) through hydro-pipelining biomass particles
were also examined.
3.2. Materials and Methods
3.2.1. Feedstock and Pre-processing
Corn stover and wheat straw are considered as leading candidates for the production of
bio-ethanol [21]. As a result, the present research focused on the pipeline hydro-
transporta of these specific feedstock. Corn stover (Zea mays ssp. mays L.) and wheat
straw (Triticum aestivum L.) were collected from farms in Taber and Township located
in Northern and Southern Alberta, Canada, respectively. Whilst dry, the materials were
milled using a commercially available knife mill (SM-100; Retsch Inc., Newtown, PA,
US). The knife mill utilised a screen with 6 mm squared openings, which was mounted in
an arc on the bottom side of rotor. Afterwards, Using a standard [22] chip classifier2
(BM&M Inc., Surrey, BC, Canada), the knife-milled materials were classified into four
nominal sizes of ~19.2 mm, ~6.4 mm, ~3.2 mm, and <~3.2 mm, which were labelled
after the size of the classifier sieves openings, as shown in Table 3-1. It is worth
mentioning that the chip classifier was set to reduce the wide size range (from less than 3
2 Due to noticeable amounts of materials required (10 to 29 kg per test), it was not technically appropriate
to carry out tests using common sieving machines. A large-scale chip classifier was utilised instead.
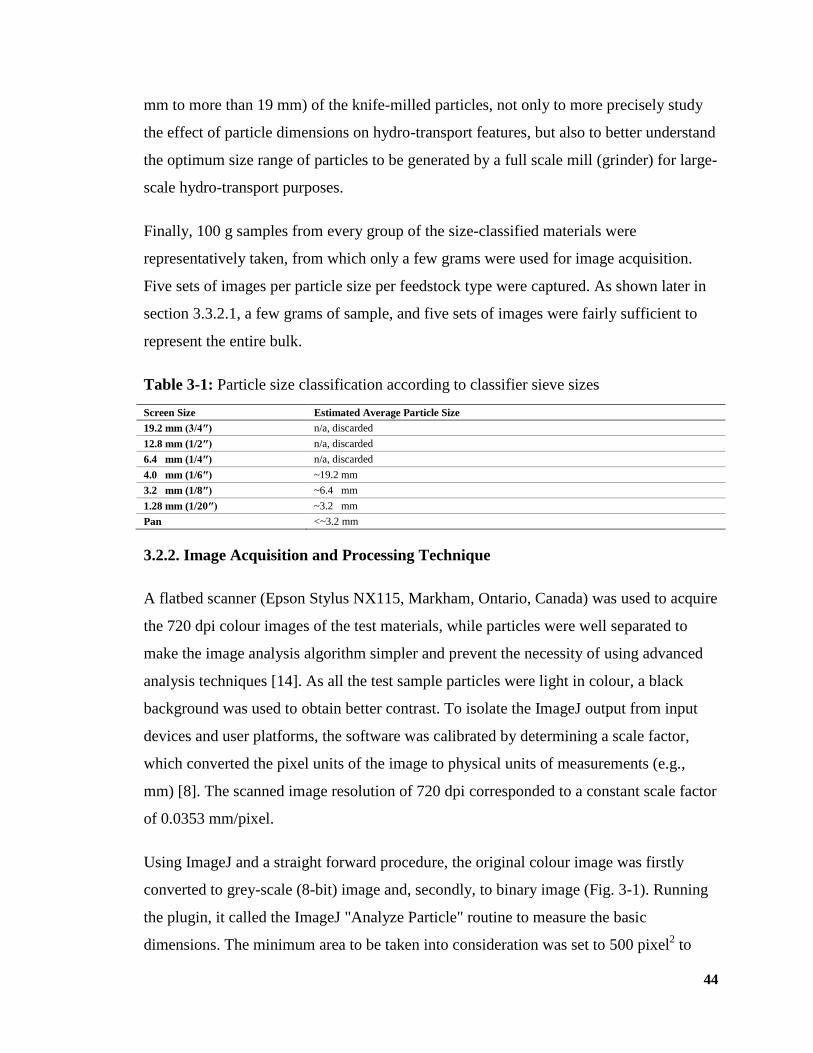
44
mm to more than 19 mm) of the knife-milled particles, not only to more precisely study
the effect of particle dimensions on hydro-transport features, but also to better understand
the optimum size range of particles to be generated by a full scale mill (grinder) for large-
scale hydro-transport purposes.
Finally, 100 g samples from every group of the size-classified materials were
representatively taken, from which only a few grams were used for image acquisition.
Five sets of images per particle size per feedstock type were captured. As shown later in
section 3.3.2.1, a few grams of sample, and five sets of images were fairly sufficient to
represent the entire bulk.
Table 3-1: Particle size classification according to classifier sieve sizes
Screen Size Estimated Average Particle Size
19.2 mm (3/4″) n/a, discarded
12.8 mm (1/2″) n/a, discarded
6.4 mm (1/4″) n/a, discarded
4.0 mm (1/6″) ~19.2 mm
3.2 mm (1/8″) ~6.4 mm
1.28 mm (1/20″) ~3.2 mm
Pan <~3.2 mm
3.2.2. Image Acquisition and Processing Technique
A flatbed scanner (Epson Stylus NX115, Markham, Ontario, Canada) was used to acquire
the 720 dpi colour images of the test materials, while particles were well separated to
make the image analysis algorithm simpler and prevent the necessity of using advanced
analysis techniques [14]. As all the test sample particles were light in colour, a black
background was used to obtain better contrast. To isolate the ImageJ output from input
devices and user platforms, the software was calibrated by determining a scale factor,
which converted the pixel units of the image to physical units of measurements (e.g.,
mm) [8]. The scanned image resolution of 720 dpi corresponded to a constant scale factor
of 0.0353 mm/pixel.
Using ImageJ and a straight forward procedure, the original colour image was firstly
converted to grey-scale (8-bit) image and, secondly, to binary image (Fig. 3-1). Running
the plugin, it called the ImageJ "Analyze Particle" routine to measure the basic
dimensions. The minimum area to be taken into consideration was set to 500 pixel2 to
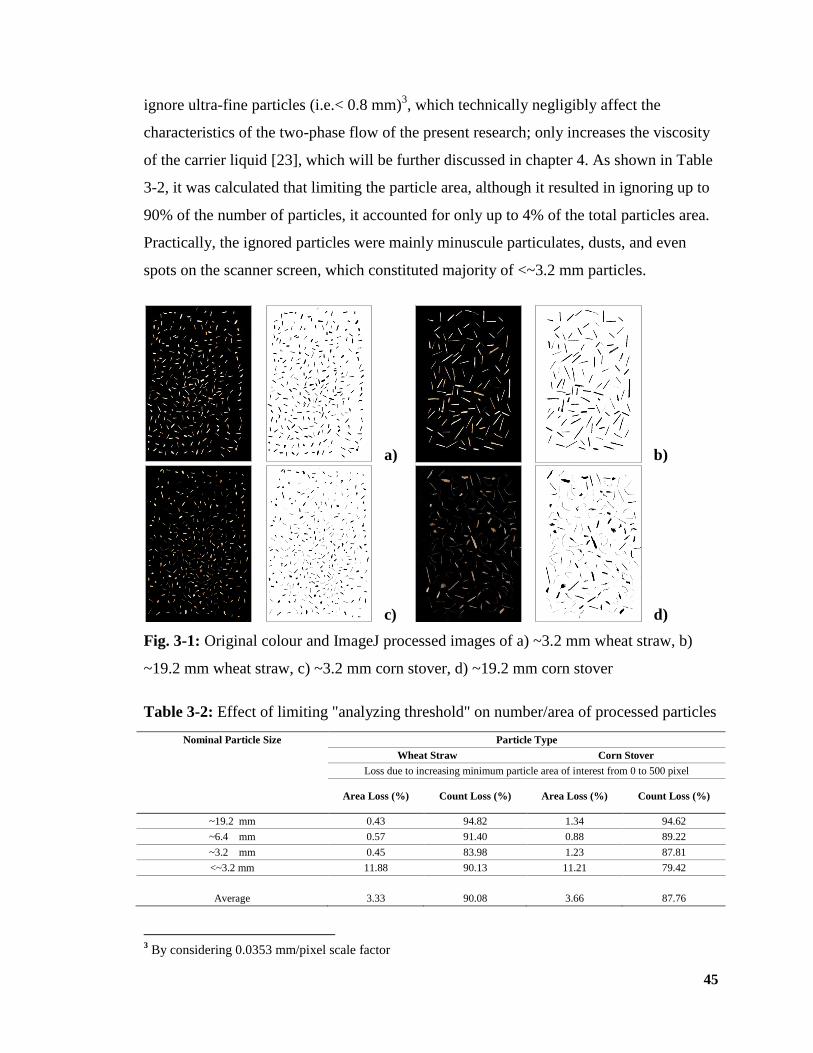
45
ignore ultra-fine particles (i.e.< 0.8 mm)3, which technically negligibly affect the
characteristics of the two-phase flow of the present research; only increases the viscosity
of the carrier liquid [23], which will be further discussed in chapter 4. As shown in Table
3-2, it was calculated that limiting the particle area, although it resulted in ignoring up to
90% of the number of particles, it accounted for only up to 4% of the total particles area.
Practically, the ignored particles were mainly minuscule particulates, dusts, and even
spots on the scanner screen, which constituted majority of <~3.2 mm particles.
a) b)
c) d)
Fig. 3-1: Original colour and ImageJ processed images of a) ~3.2 mm wheat straw, b)
~19.2 mm wheat straw, c) ~3.2 mm corn stover, d) ~19.2 mm corn stover
Table 3-2: Effect of limiting "analyzing threshold" on number/area of processed particles
Nominal Particle Size Particle Type
Wheat Straw Corn Stover
Loss due to increasing minimum particle area of interest from 0 to 500 pixel
Area Loss (%) Count Loss (%) Area Loss (%) Count Loss (%)
~19.2 mm 0.43 94.82 1.34 94.62
~6.4 mm 0.57 91.40 0.88 89.22
~3.2 mm 0.45 83.98 1.23 87.81
<~3.2 mm 11.88 90.13 11.21 79.42
Average 3.33 90.08 3.66 87.76
3 By considering 0.0353 mm/pixel scale factor
46
The binary image of any particle with a continuous boundary can be modelled as an
ellipse having equivalent area and perimeter of the particle. The distribution of the
particle boundary coordinates, after equating the second order central moments, produces
the best-fitting ellipse [24]. ImageJ follows the same approach. However, overestimation
or underestimation of the actual length and width of some basic shapes of the particles
has been observed, specifically in the case of polygonal shapes with fewer numbers of
sides, such as triangles and rectangles. Igathinathane et al. [25] proposed defining
correction factors to rectify the over/underestimation in dimension measurements. Also
they developed a shape identification strategy, as the correction factors values depend on
the geometric shapes that best represents the particle. The same idea was employed here
to develop a Java-based user-coded plugin in ImageJ, to suit the specific requirements of
a machine vision approach for this practical application.
Once the particle boundaries were located, the ImageJ analysed the geometry to measure
the area, perimeter, and other dimensions of the best fitting ellipse. Upon completion, and
for post-processing purposes, the plugin was called in ImageJ to evaluate and output all
the user specified measurements. This comprised obtaining the shape parameters to
identify the shapes of the particles, utilising the correction factors to produce corrected
length, width, and area of the actual non-circular non-elliptical particles, calculating
particles geometric and graphic mean lengths with corresponding standard deviations,
drawing PSD graphs and evaluating PSD parameters, and determining PSD describing
functions (e.g., Rosin-Rammler) and parameters.
To identify the shape, three non-dimensional shape parameters based on ImageJ standard
output properties of particles were introduced into the plugin. To correct for the under-
and over-estimation in particle diameters, the plugin calculates the area of the best fitting
ellipse and assumes the constant aspect ratio for both the ellipse and the corresponding
shape of the particle (square, rectangle, circle, and triangle) to obtain the correction
factor. Therefore, the constant correction factor, when applied to major and minor axes of
ellipse, rectifies the over- and under-estimation and produce correct length and width of
the actual shape. More on the details of these procedures can be found elsewhere [25].

47
3.2.3. Particle Size and Distribution Analysis
Although the standard screening approach [7] employs a limited number of sieves and
measures the weight of materials retained on each sieve, image processing technique
depends on the number of particles per given length through the entire range of particles,
which is considered as a weighting factor in PSD analysis. The measured lengths of
whole particles can be categorised into several distinct lengths; a concept which was first
introduced by Igathinathane et al. [26], where the majority of particles lengths will match
and form unique groups of distinct lengths. The groups of particles, represented by
distinct length particles, make up the total particles of the sample. The number of grouped
particles can be subsequently subjected to cumulative characteristics, where dimensions
of significance based on length can be derived; these dimensions are comprised of d954,
d90, d84, d75, d60, d50 (also known as the median length), d30, d25, d16, d10 (known as
effective size), and D5. Also several PSD parameters, such as uniformity index (Lu), size
guide number (Nsg) [27, 28], graphic skewness (Sig), and graphic kurtosis (Kg) [29] can be
calculated accordingly as:
(1)
(2)
[
] [
] (3)
[
] (4)
The uniformity index (Iu) characterises the spread in particle size distribution, the size
guide number (Nsg) is the median (or geometric mean) of the particle sizes; graphic
skewness (Sig) indicates the degree of asymmetry compared to a normal distribution of
4 With 95% of particles larger than this specific diameter
48
particles versus particle size; and departure from a specific ratio of 2.44 is represented by
graphic kurtosis (Kg) [30], as interval between d5 and d95 points on normal probability
curve should be exactly 2.44 times the interval between d25 and d75 points; measuring the
width of the central part of the distribution relative to the distance between the tails or
extreme values of it.
To determine ranges of lengths of particulate biomass, graphic [31] and geometric [7]
means (Xig and Xgl, respectively) together with their corresponding standard deviations
(σig and σgl) were calculated as:
(5)
[
] [
] (6)
∑
∑ (7)
∑
∑ (8)
After obtaining major particle dimensions, it is now possible to calculate particle shape
factors, which are of importance in identifying the variation of slurry mechanical
behaviour with particles type and size [32-34]. Three shape factors which were
considered include aspect ratio, circularity, and roundness, which can be calculated as:
(9)
(10)
49
(11)
As the circularity value approaches from 1.0 (a perfect circle) to 0.0, it indicates an
increasingly elongated polygon, aspect ratio represents the ratio between major and minor
axis dimensions, and roundness describes the shape of the corners on a particle.
Among PSD parameters, size guide number (Nsg) and uniformity index (Lu) are widely
used to describe the range of variation in particle sizes [27, 28]. These correspond to the
median particle size and the 5th
percentile particle size expressed as a percentage of the
95th
percentile particle size, respectively. However, this system, usually referred to as size
guide number (SGN) model, is of limited value, because it just gives two parameters
without a distribution function. Thus, even if two biomass materials posses exactly the
same parameters, it does not necessarily mean that those have the same size distribution
algorithm. Looking for a better parameterisation system, three common size distribution
functions including the log-normal, the Rosin-Rammler, and the Gaudin-Schuhmann
equations were investigated. These functions have been previously utilised to describe the
particle size distribution of various materials, such as granular mineral fertilisers [35],
and soil particles [36]. The accuracy of these approaches in determining PSD was tested
to understand which one could potentially be adopted for routine standard use.
The Rosin-Rammler equation was developed [37] to describe broken coal and other
comminuted earth materials. The equation is given by:
⁄ (12)
α (intercept) and β (slope) are parameters related to the characteristic size and spread of
distribution, respectively, as α represents the particle size corresponding to the 36.78th
percentile of the cumulative probability distribution, and β controls the shape of the
distribution function [38]. A small β denotes a wide spread of particle size and vice versa
[35]. To compare the Rosin–Rammler approach with the SGN model, the size guide
number (Nsg) and uniformity index (Iu) were estimated using α and β, following Perfect et
50
al. [35]. The present job compares the theoretical Iu and Nsg with those of predicted values
(denoted as I'u and N'sg) to analyse the corresponding variance. The predicted I'u and N'sg
are calculated as:
(13)
(14)
Epstein [39] showed that the size distribution of fragments resulting from a process of
repeated breakage is asymptotically log-normal. The log-normal size distribution function
is given by:
( ⁄ ) √ ( )⁄ (15)
and finally, when particles of homogeneous solid are repeatedly broken by a series of
single fractures, their resulting size distribution is a straight line on a log-log plot [40].
This is the Gaudin-Schuhmann function, which is given by:
⁄ (16)
3.3. Results and Discussion
3.3.1. Particle Size Analysis of Knife-milled Pre-classified Wheat Straw and Corn
Stover
3.3.1.1. Particle Size and PSD Algorithm
The sample images were processed through the developed plugin, and median length
(d50), geometric mean length (Xgl) [7], and graphic mean length (Xig) [29], besides
geometric and graphic standard deviations (σgl and σig) are presented in Table 3-3. The
determined ranges of lengths of wheat straw particles were 3.25-15.32 mm for geometric
mean, 3.4-15.86 mm for graphic mean, and 4.73-17.47 mm for arithmetic average. These
dimensions for corn stover ranged over 2.57-9.11 mm, 2.76-9.7 mm, and 4.26-15.73 mm,
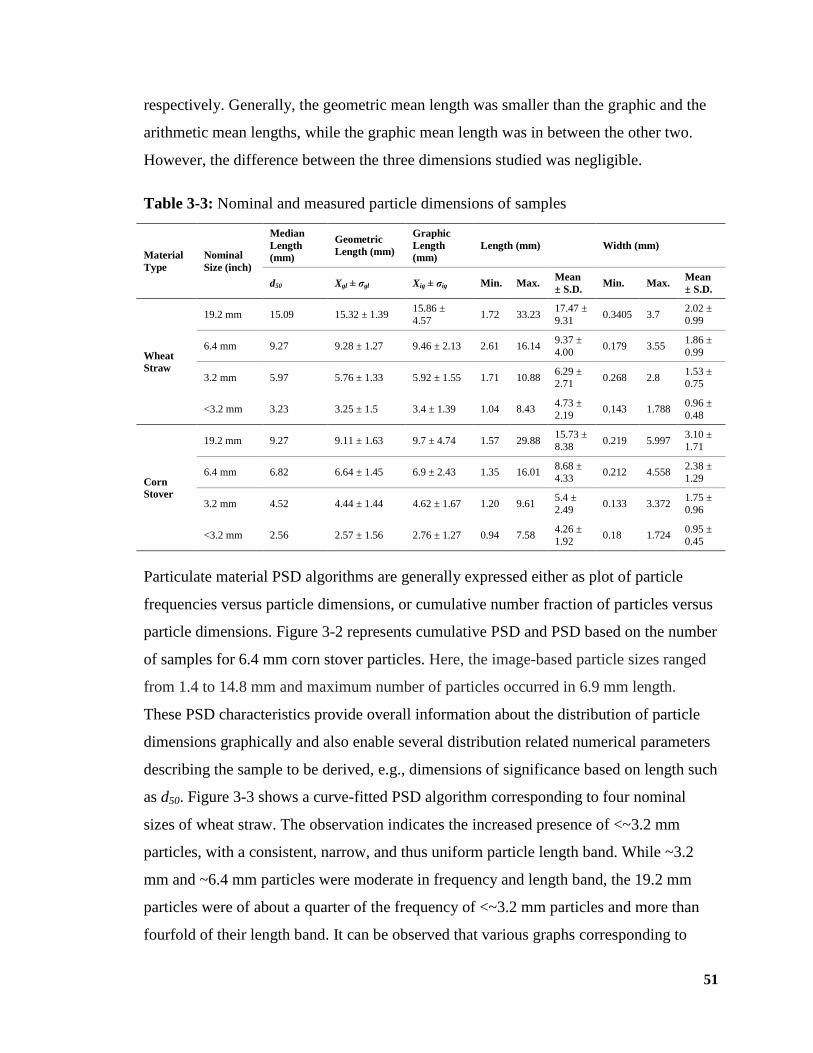
51
respectively. Generally, the geometric mean length was smaller than the graphic and the
arithmetic mean lengths, while the graphic mean length was in between the other two.
However, the difference between the three dimensions studied was negligible.
Table 3-3: Nominal and measured particle dimensions of samples
Material
Type
Nominal
Size (inch)
Median
Length
(mm)
Geometric
Length (mm)
Graphic
Length
(mm)
Length (mm) Width (mm)
d50 Xgl ± σgl Xig ± σig Min. Max. Mean
± S.D. Min. Max.
Mean
± S.D.
Wheat
Straw
19.2 mm 15.09 15.32 ± 1.39 15.86 ±
4.57 1.72 33.23
17.47 ±
9.31 0.3405 3.7
2.02 ±
0.99
6.4 mm 9.27 9.28 ± 1.27 9.46 ± 2.13 2.61 16.14 9.37 ±
4.00 0.179 3.55
1.86 ±
0.99
3.2 mm 5.97 5.76 ± 1.33 5.92 ± 1.55 1.71 10.88 6.29 ±
2.71 0.268 2.8
1.53 ±
0.75
<3.2 mm 3.23 3.25 ± 1.5 3.4 ± 1.39 1.04 8.43 4.73 ±
2.19 0.143 1.788
0.96 ±
0.48
Corn
Stover
19.2 mm 9.27 9.11 ± 1.63 9.7 ± 4.74 1.57 29.88 15.73 ±
8.38 0.219 5.997
3.10 ±
1.71
6.4 mm 6.82 6.64 ± 1.45 6.9 ± 2.43 1.35 16.01 8.68 ±
4.33 0.212 4.558
2.38 ±
1.29
3.2 mm 4.52 4.44 ± 1.44 4.62 ± 1.67 1.20 9.61 5.4 ±
2.49 0.133 3.372
1.75 ±
0.96
<3.2 mm 2.56 2.57 ± 1.56 2.76 ± 1.27 0.94 7.58 4.26 ±
1.92 0.18 1.724
0.95 ±
0.45
Particulate material PSD algorithms are generally expressed either as plot of particle
frequencies versus particle dimensions, or cumulative number fraction of particles versus
particle dimensions. Figure 3-2 represents cumulative PSD and PSD based on the number
of samples for 6.4 mm corn stover particles. Here, the image-based particle sizes ranged
from 1.4 to 14.8 mm and maximum number of particles occurred in 6.9 mm length.
These PSD characteristics provide overall information about the distribution of particle
dimensions graphically and also enable several distribution related numerical parameters
describing the sample to be derived, e.g., dimensions of significance based on length such
as d50. Figure 3-3 shows a curve-fitted PSD algorithm corresponding to four nominal
sizes of wheat straw. The observation indicates the increased presence of <~3.2 mm
particles, with a consistent, narrow, and thus uniform particle length band. While ~3.2
mm and ~6.4 mm particles were moderate in frequency and length band, the 19.2 mm
particles were of about a quarter of the frequency of <~3.2 mm particles and more than
fourfold of their length band. It can be observed that various graphs corresponding to
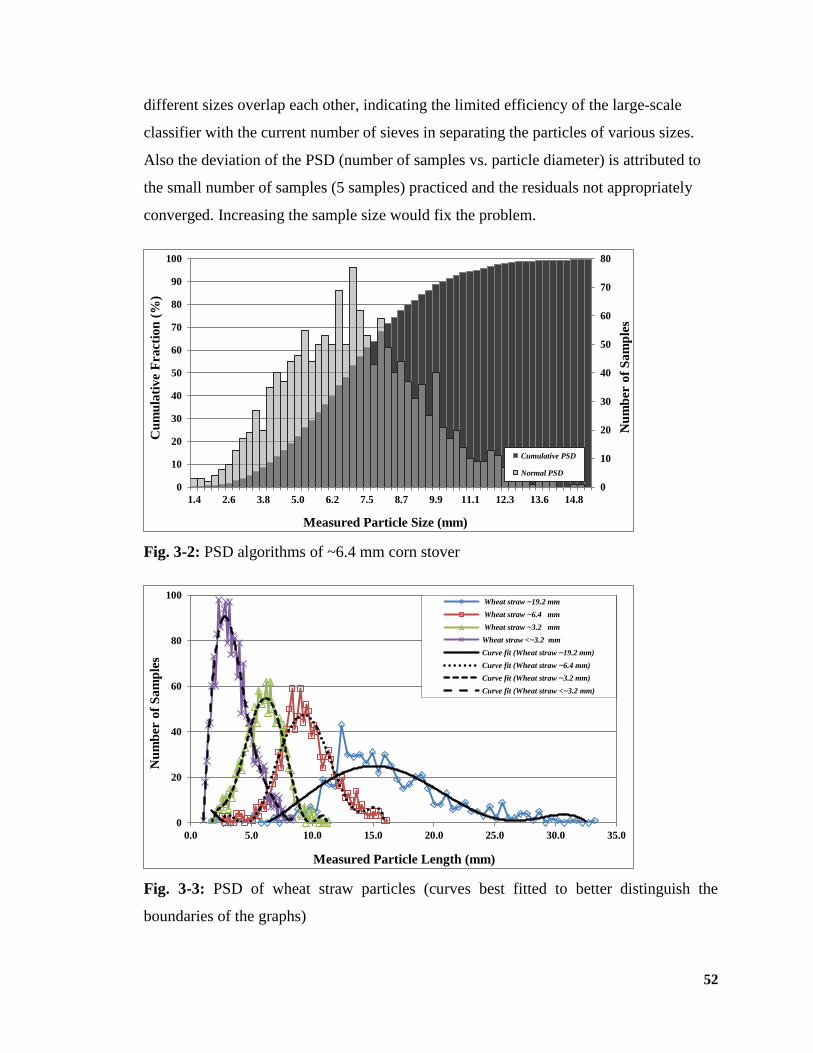
52
different sizes overlap each other, indicating the limited efficiency of the large-scale
classifier with the current number of sieves in separating the particles of various sizes.
Also the deviation of the PSD (number of samples vs. particle diameter) is attributed to
the small number of samples (5 samples) practiced and the residuals not appropriately
converged. Increasing the sample size would fix the problem.
Fig. 3-2: PSD algorithms of ~6.4 mm corn stover
Fig. 3-3: PSD of wheat straw particles (curves best fitted to better distinguish the
boundaries of the graphs)
0
10
20
30
40
50
60
70
80
0
10
20
30
40
50
60
70
80
90
100
1.4 2.6 3.8 5.0 6.2 7.5 8.7 9.9 11.1 12.3 13.6 14.8
Nu
mb
er o
f S
am
ple
s
Cu
mu
lati
ve
Fra
ctio
n (
%)
Measured Particle Size (mm)
Cumulative PSD
Normal PSD
0
20
40
60
80
100
0.0 5.0 10.0 15.0 20.0 25.0 30.0 35.0
Nu
mb
er o
f S
am
ple
s
Measured Particle Length (mm)
Wheat straw ~19.2 mm
Wheat straw ~6.4 mm
Wheat straw ~3.2 mm
Wheat straw <~3.2 mm
Curve fit (Wheat straw ~19.2 mm)
Curve fit (Wheat straw ~6.4 mm)
Curve fit (Wheat straw ~3.2 mm)
Curve fit (Wheat straw <~3.2 mm)
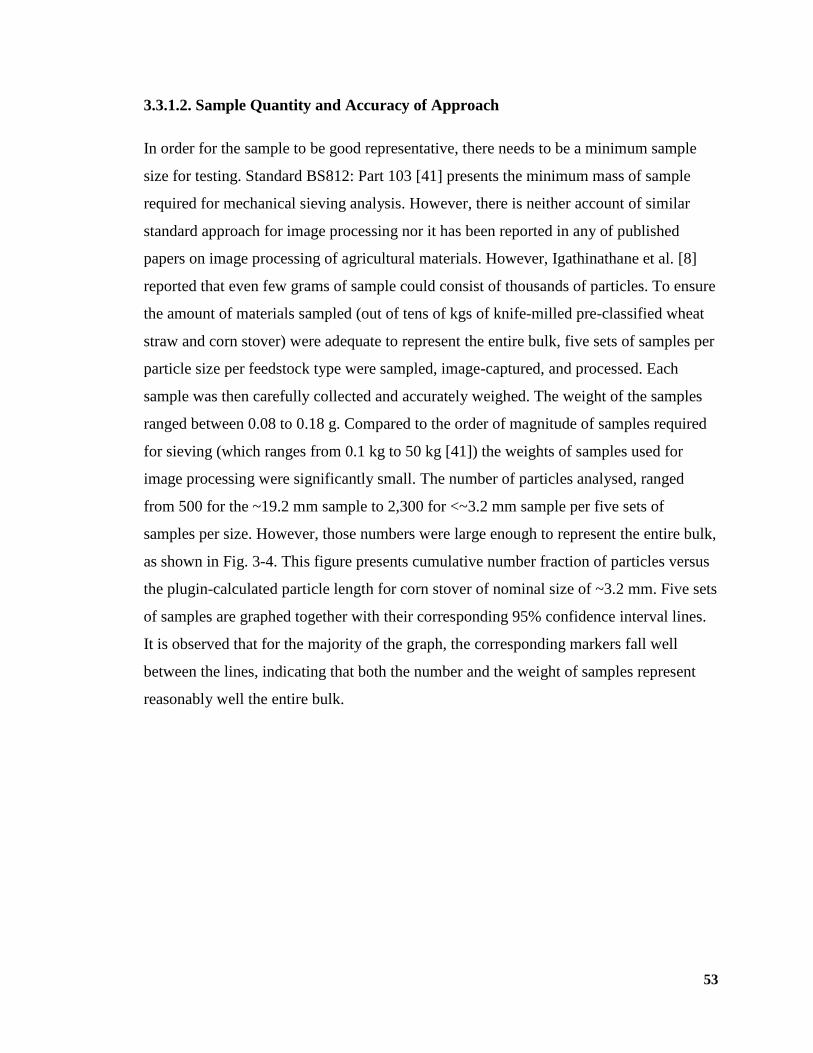
53
3.3.1.2. Sample Quantity and Accuracy of Approach
In order for the sample to be good representative, there needs to be a minimum sample
size for testing. Standard BS812: Part 103 [41] presents the minimum mass of sample
required for mechanical sieving analysis. However, there is neither account of similar
standard approach for image processing nor it has been reported in any of published
papers on image processing of agricultural materials. However, Igathinathane et al. [8]
reported that even few grams of sample could consist of thousands of particles. To ensure
the amount of materials sampled (out of tens of kgs of knife-milled pre-classified wheat
straw and corn stover) were adequate to represent the entire bulk, five sets of samples per
particle size per feedstock type were sampled, image-captured, and processed. Each
sample was then carefully collected and accurately weighed. The weight of the samples
ranged between 0.08 to 0.18 g. Compared to the order of magnitude of samples required
for sieving (which ranges from 0.1 kg to 50 kg [41]) the weights of samples used for
image processing were significantly small. The number of particles analysed, ranged
from 500 for the ~19.2 mm sample to 2,300 for <~3.2 mm sample per five sets of
samples per size. However, those numbers were large enough to represent the entire bulk,
as shown in Fig. 3-4. This figure presents cumulative number fraction of particles versus
the plugin-calculated particle length for corn stover of nominal size of ~3.2 mm. Five sets
of samples are graphed together with their corresponding 95% confidence interval lines.
It is observed that for the majority of the graph, the corresponding markers fall well
between the lines, indicating that both the number and the weight of samples represent
reasonably well the entire bulk.
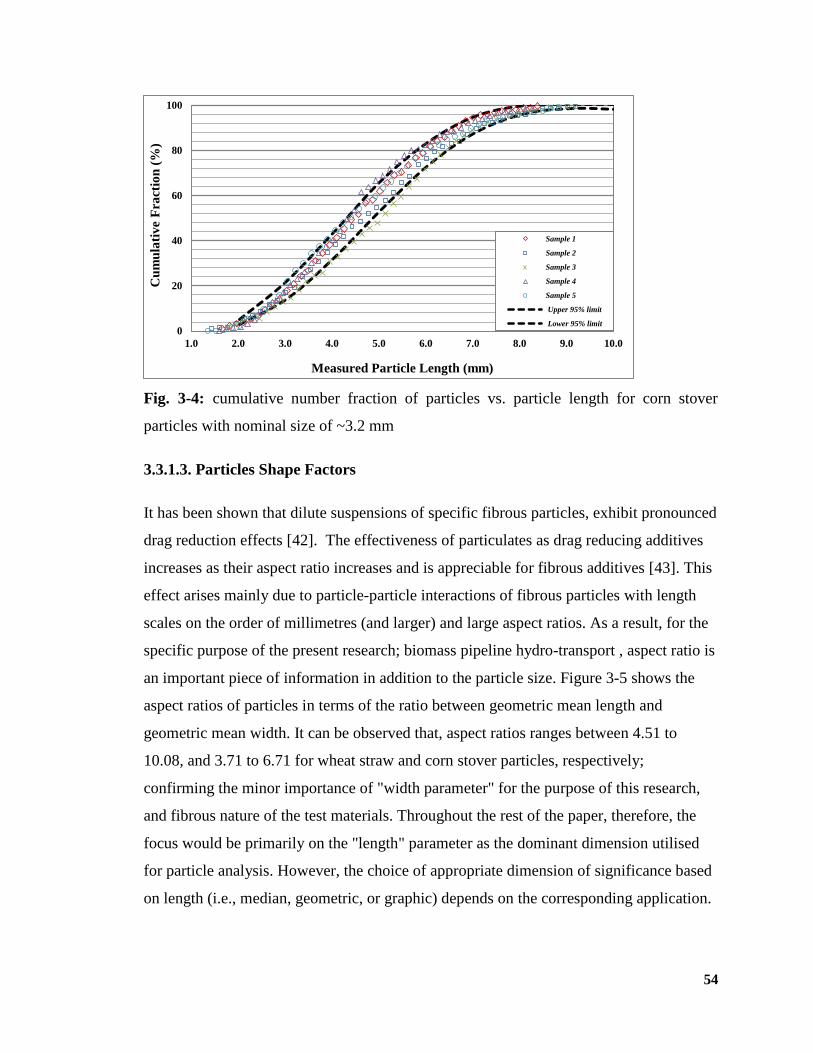
54
Fig. 3-4: cumulative number fraction of particles vs. particle length for corn stover
particles with nominal size of ~3.2 mm
3.3.1.3. Particles Shape Factors
It has been shown that dilute suspensions of specific fibrous particles, exhibit pronounced
drag reduction effects [42]. The effectiveness of particulates as drag reducing additives
increases as their aspect ratio increases and is appreciable for fibrous additives [43]. This
effect arises mainly due to particle-particle interactions of fibrous particles with length
scales on the order of millimetres (and larger) and large aspect ratios. As a result, for the
specific purpose of the present research; biomass pipeline hydro-transport , aspect ratio is
an important piece of information in addition to the particle size. Figure 3-5 shows the
aspect ratios of particles in terms of the ratio between geometric mean length and
geometric mean width. It can be observed that, aspect ratios ranges between 4.51 to
10.08, and 3.71 to 6.71 for wheat straw and corn stover particles, respectively;
confirming the minor importance of "width parameter" for the purpose of this research,
and fibrous nature of the test materials. Throughout the rest of the paper, therefore, the
focus would be primarily on the "length" parameter as the dominant dimension utilised
for particle analysis. However, the choice of appropriate dimension of significance based
on length (i.e., median, geometric, or graphic) depends on the corresponding application.
0
20
40
60
80
100
1.0 2.0 3.0 4.0 5.0 6.0 7.0 8.0 9.0 10.0
Cu
mu
lati
ve
Fra
ctio
n (
%)
Measured Particle Length (mm)
Sample 1
Sample 2
Sample 3
Sample 4
Sample 5
Upper 95% limit
Lower 95% limit
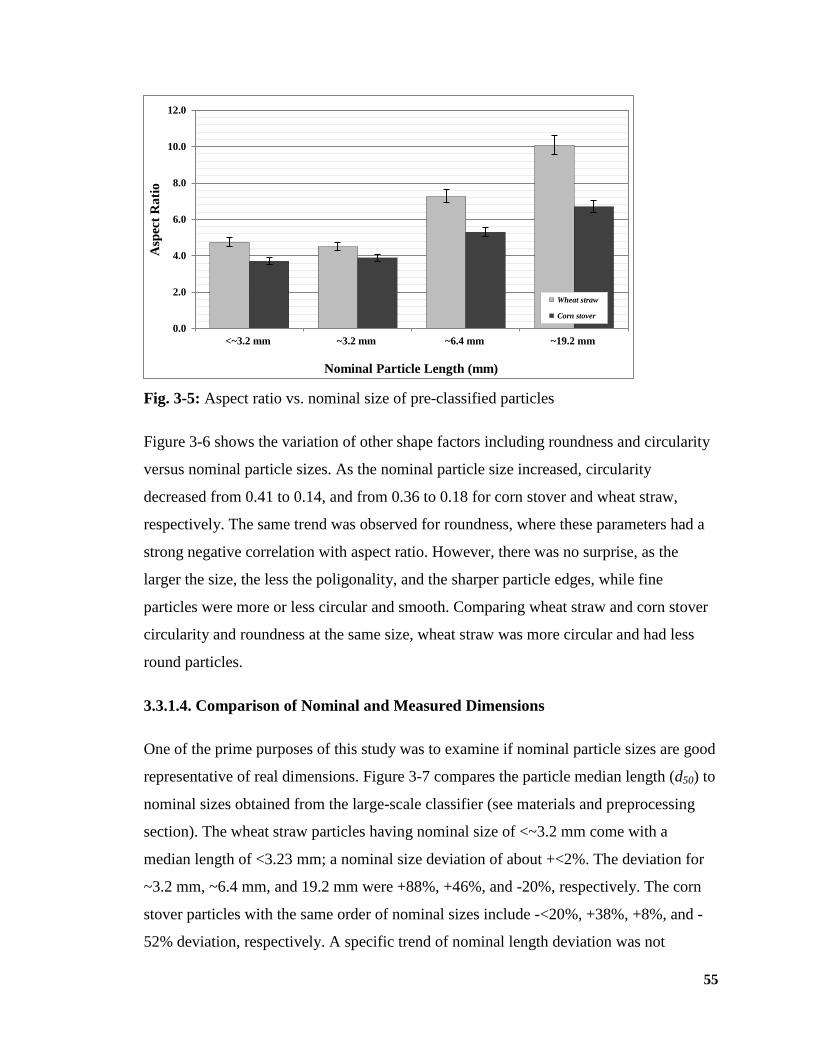
55
Fig. 3-5: Aspect ratio vs. nominal size of pre-classified particles
Figure 3-6 shows the variation of other shape factors including roundness and circularity
versus nominal particle sizes. As the nominal particle size increased, circularity
decreased from 0.41 to 0.14, and from 0.36 to 0.18 for corn stover and wheat straw,
respectively. The same trend was observed for roundness, where these parameters had a
strong negative correlation with aspect ratio. However, there was no surprise, as the
larger the size, the less the poligonality, and the sharper particle edges, while fine
particles were more or less circular and smooth. Comparing wheat straw and corn stover
circularity and roundness at the same size, wheat straw was more circular and had less
round particles.
3.3.1.4. Comparison of Nominal and Measured Dimensions
One of the prime purposes of this study was to examine if nominal particle sizes are good
representative of real dimensions. Figure 3-7 compares the particle median length (d50) to
nominal sizes obtained from the large-scale classifier (see materials and preprocessing
section). The wheat straw particles having nominal size of <~3.2 mm come with a
median length of <3.23 mm; a nominal size deviation of about +<2%. The deviation for
~3.2 mm, ~6.4 mm, and 19.2 mm were +88%, +46%, and -20%, respectively. The corn
stover particles with the same order of nominal sizes include -<20%, +38%, +8%, and -
52% deviation, respectively. A specific trend of nominal length deviation was not
0.0
2.0
4.0
6.0
8.0
10.0
12.0
<~3.2 mm ~3.2 mm ~6.4 mm ~19.2 mm
Asp
ect
Ra
tio
Nominal Particle Length (mm)
Wheat straw
Corn stover
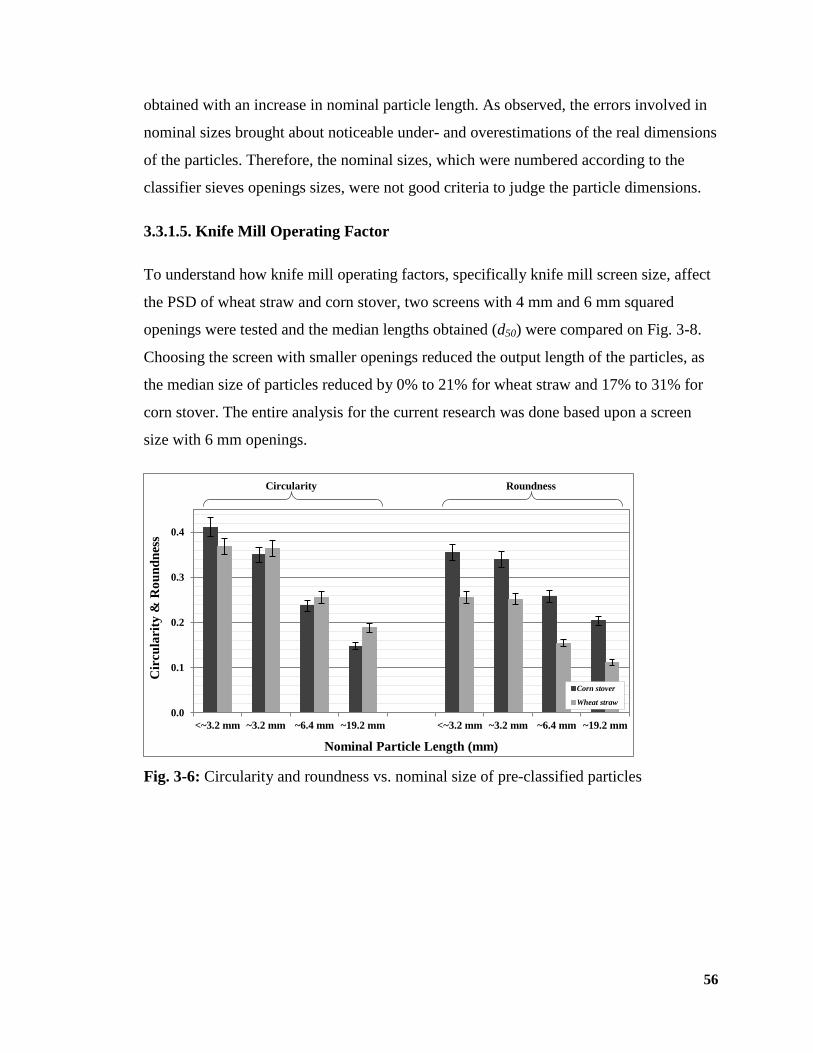
56
obtained with an increase in nominal particle length. As observed, the errors involved in
nominal sizes brought about noticeable under- and overestimations of the real dimensions
of the particles. Therefore, the nominal sizes, which were numbered according to the
classifier sieves openings sizes, were not good criteria to judge the particle dimensions.
3.3.1.5. Knife Mill Operating Factor
To understand how knife mill operating factors, specifically knife mill screen size, affect
the PSD of wheat straw and corn stover, two screens with 4 mm and 6 mm squared
openings were tested and the median lengths obtained (d50) were compared on Fig. 3-8.
Choosing the screen with smaller openings reduced the output length of the particles, as
the median size of particles reduced by 0% to 21% for wheat straw and 17% to 31% for
corn stover. The entire analysis for the current research was done based upon a screen
size with 6 mm openings.
Fig. 3-6: Circularity and roundness vs. nominal size of pre-classified particles
0.0
0.1
0.2
0.3
0.4
<~3.2 mm ~3.2 mm ~6.4 mm ~19.2 mm <~3.2 mm ~3.2 mm ~6.4 mm ~19.2 mm
Cir
cu
lari
ty &
Ro
un
dn
ess
Nominal Particle Length (mm)
Corn stover
Wheat straw
Circularity Roundness
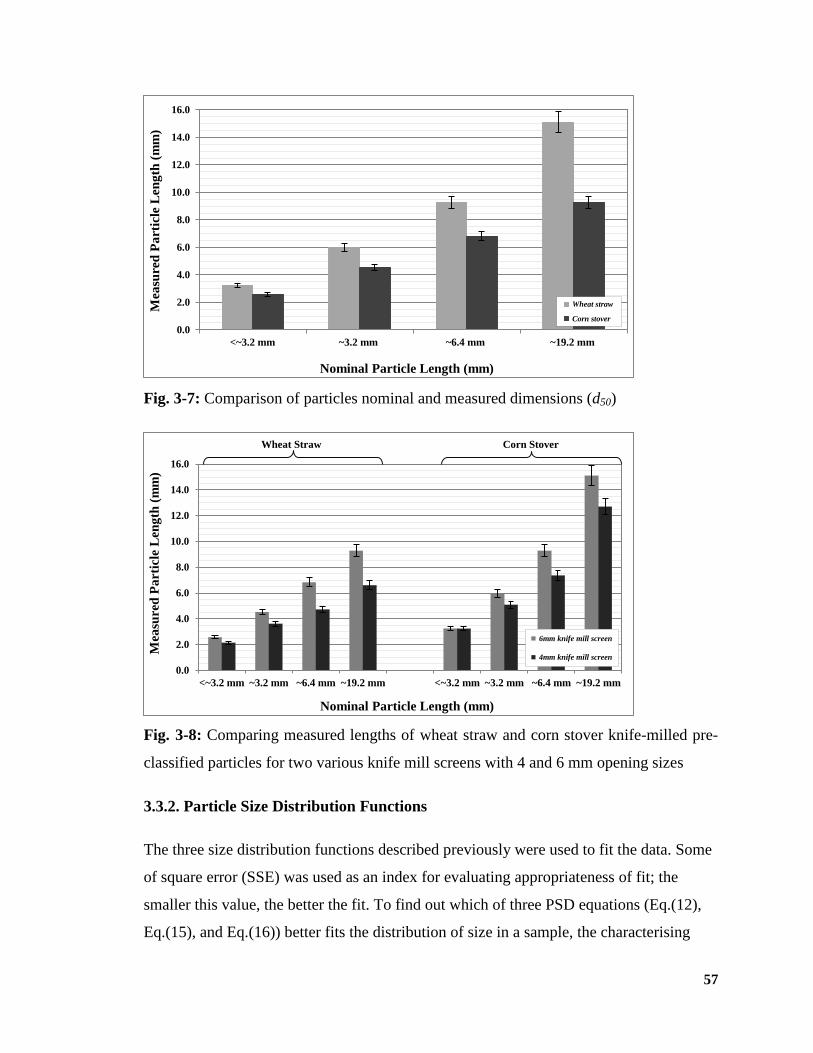
57
Fig. 3-7: Comparison of particles nominal and measured dimensions (d50)
Fig. 3-8: Comparing measured lengths of wheat straw and corn stover knife-milled pre-
classified particles for two various knife mill screens with 4 and 6 mm opening sizes
3.3.2. Particle Size Distribution Functions
The three size distribution functions described previously were used to fit the data. Some
of square error (SSE) was used as an index for evaluating appropriateness of fit; the
smaller this value, the better the fit. To find out which of three PSD equations (Eq.(12),
Eq.(15), and Eq.(16)) better fits the distribution of size in a sample, the characterising
0.0
2.0
4.0
6.0
8.0
10.0
12.0
14.0
16.0
<~3.2 mm ~3.2 mm ~6.4 mm ~19.2 mm
Mea
sure
d P
art
icle
Len
gth
(m
m)
Nominal Particle Length (mm)
Wheat straw
Corn stover
0.0
2.0
4.0
6.0
8.0
10.0
12.0
14.0
16.0
<~3.2 mm ~3.2 mm ~6.4 mm ~19.2 mm <~3.2 mm ~3.2 mm ~6.4 mm ~19.2 mm
Mea
sure
d P
art
icle
Len
gth
(m
m)
Nominal Particle Length (mm)
6mm knife mill screen
4mm knife mill screen
Wheat Straw Corn Stover
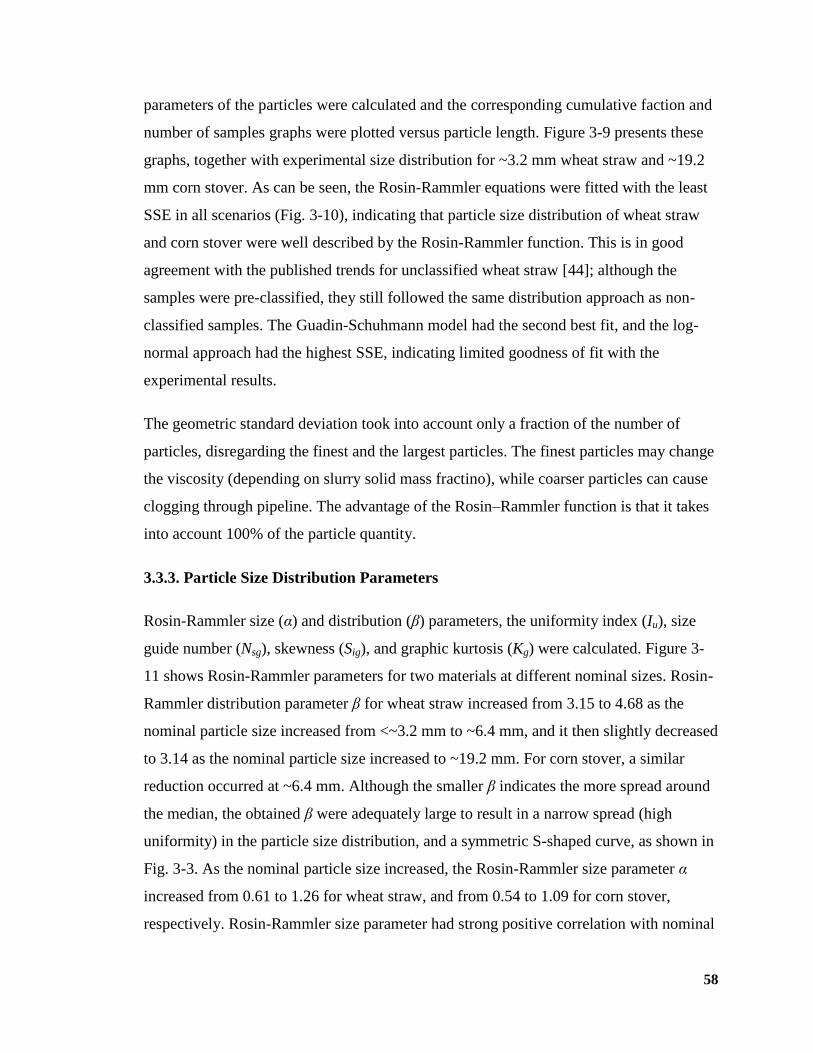
58
parameters of the particles were calculated and the corresponding cumulative faction and
number of samples graphs were plotted versus particle length. Figure 3-9 presents these
graphs, together with experimental size distribution for ~3.2 mm wheat straw and ~19.2
mm corn stover. As can be seen, the Rosin-Rammler equations were fitted with the least
SSE in all scenarios (Fig. 3-10), indicating that particle size distribution of wheat straw
and corn stover were well described by the Rosin-Rammler function. This is in good
agreement with the published trends for unclassified wheat straw [44]; although the
samples were pre-classified, they still followed the same distribution approach as non-
classified samples. The Guadin-Schuhmann model had the second best fit, and the log-
normal approach had the highest SSE, indicating limited goodness of fit with the
experimental results.
The geometric standard deviation took into account only a fraction of the number of
particles, disregarding the finest and the largest particles. The finest particles may change
the viscosity (depending on slurry solid mass fractino), while coarser particles can cause
clogging through pipeline. The advantage of the Rosin–Rammler function is that it takes
into account 100% of the particle quantity.
3.3.3. Particle Size Distribution Parameters
Rosin-Rammler size (α) and distribution (β) parameters, the uniformity index (Iu), size
guide number (Nsg), skewness (Sig), and graphic kurtosis (Kg) were calculated. Figure 3-
11 shows Rosin-Rammler parameters for two materials at different nominal sizes. Rosin-
Rammler distribution parameter β for wheat straw increased from 3.15 to 4.68 as the
nominal particle size increased from <~3.2 mm to ~6.4 mm, and it then slightly decreased
to 3.14 as the nominal particle size increased to ~19.2 mm. For corn stover, a similar
reduction occurred at ~6.4 mm. Although the smaller β indicates the more spread around
the median, the obtained β were adequately large to result in a narrow spread (high
uniformity) in the particle size distribution, and a symmetric S-shaped curve, as shown in
Fig. 3-3. As the nominal particle size increased, the Rosin-Rammler size parameter α
increased from 0.61 to 1.26 for wheat straw, and from 0.54 to 1.09 for corn stover,
respectively. Rosin-Rammler size parameter had strong positive correlation with nominal
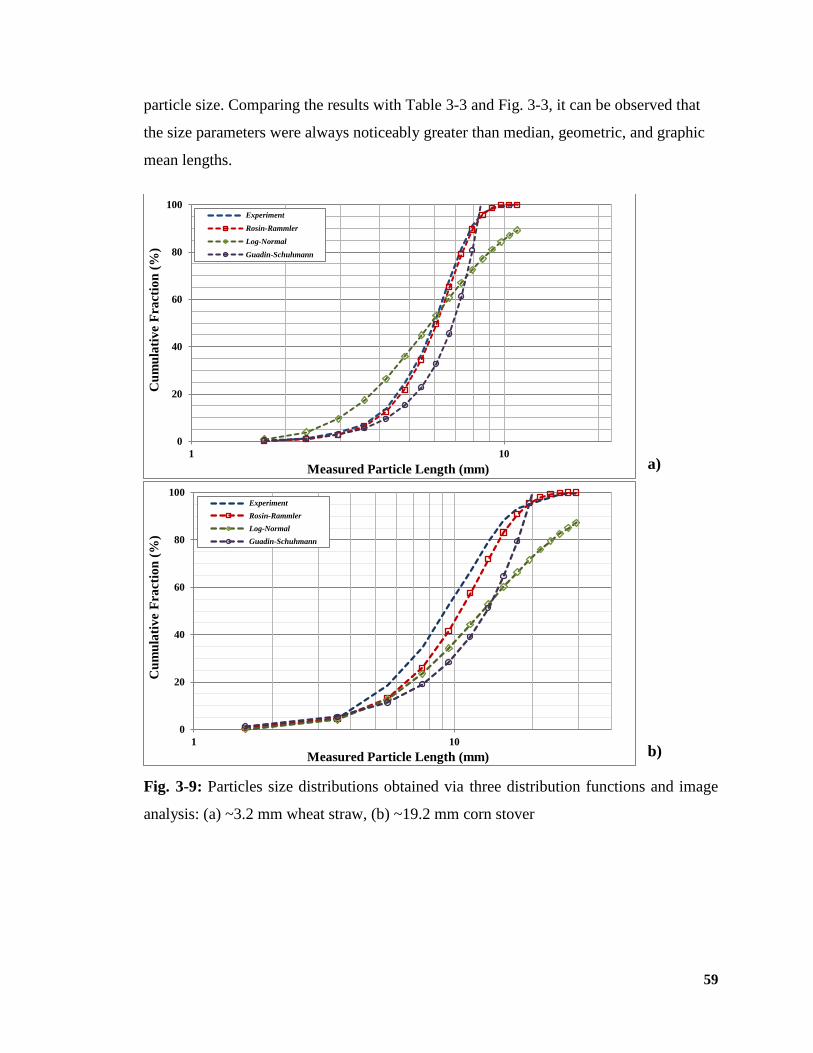
59
particle size. Comparing the results with Table 3-3 and Fig. 3-3, it can be observed that
the size parameters were always noticeably greater than median, geometric, and graphic
mean lengths.
a)
b)
Fig. 3-9: Particles size distributions obtained via three distribution functions and image
analysis: (a) ~3.2 mm wheat straw, (b) ~19.2 mm corn stover
0
20
40
60
80
100
1 10
Cu
mu
lati
ve
Fra
ctio
n (
%)
Measured Particle Length (mm)
Experiment
Rosin-Rammler
Log-Normal
Guadin-Schuhmann
0
20
40
60
80
100
1 10
Cu
mu
lati
ve
Fra
ctio
n (
%)
Measured Particle Length (mm)
Experiment
Rosin-Rammler
Log-Normal
Guadin-Schuhmann
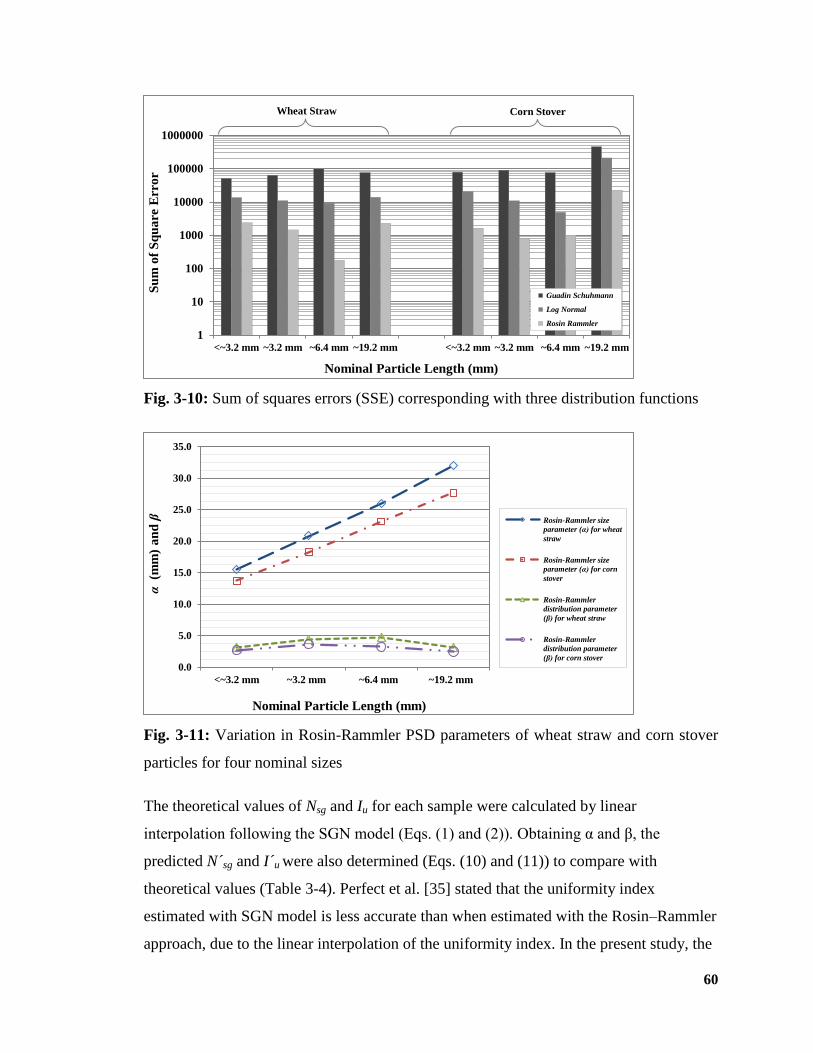
60
Fig. 3-10: Sum of squares errors (SSE) corresponding with three distribution functions
Fig. 3-11: Variation in Rosin-Rammler PSD parameters of wheat straw and corn stover
particles for four nominal sizes
The theoretical values of Nsg and Iu for each sample were calculated by linear
interpolation following the SGN model (Eqs. (1) and (2)). Obtaining α and β, the
predicted N´sg and I´u were also determined (Eqs. (10) and (11)) to compare with
theoretical values (Table 3-4). Perfect et al. [35] stated that the uniformity index
estimated with SGN model is less accurate than when estimated with the Rosin–Rammler
approach, due to the linear interpolation of the uniformity index. In the present study, the
1
10
100
1000
10000
100000
1000000
<~3.2 mm ~3.2 mm ~6.4 mm ~19.2 mm <~3.2 mm ~3.2 mm ~6.4 mm ~19.2 mm
Su
m o
f S
qu
are
Err
or
Nominal Particle Length (mm)
Guadin Schuhmann
Log Normal
Rosin Rammler
Wheat Straw Corn Stover
0.0
5.0
10.0
15.0
20.0
25.0
30.0
35.0
<~3.2 mm ~3.2 mm ~6.4 mm ~19.2 mm
α
(mm
) a
nd
β
Nominal Particle Length (mm)
Rosin-Rammler size
parameter (α) for wheat
straw
Rosin-Rammler size
parameter (α) for corn
stover
Rosin-Rammler
distribution parameter
(β) for wheat straw
Rosin-Rammler
distribution parameter
(β) for corn stover
61
uniformity indices obtained via Rosin–Rammler approach were generally slightly smaller
than corresponding SGN model values (Table 3-4). Perfect et al. (1998) also discussed
the difference between theoretical and predicted uniformity indices tends to increase with
particle size heterogeneity. This difference here was less for corn stover compared with
wheat straw, and more for the coarser wheat straw particles compared with finer ones.
Consequently, corn stover particles were more homogenous than those of wheat straw,
and coarser wheat straw particles were more heterogeneous than those of corn stover.
Concerning the SGN, the values obtained via Rosin–Rammler approach were
consistently higher than those obtained with the SGN model. This is due to the fact that,
while the Rosin–Rammler function provides the most accurate prediction of SGN for
spherical granules, it is not suitable for cylindrical shapes, since fragmentation produced
fine particles leading to a binomial distribution function, and the Rosin–Rammler
function cannot handle this type of distribution [28]. So for the case of fibrous materials,
the SGN model may be more reliable than the Rosin–Rammler approach.
Skewness decreased with an increase in wheat straw nominal particle size from <~3.2
mm to ~3.2 mm and then increased with further increase in nominal size to ~19.2 mm
(Table 3-4), while for the corn stover, the increase occurred at ~6.4 mm. Positively
skewed populations have a tail of excess fine particles (see ~19.2, ~6.4, <~3.2 mm curves
on Fig. 3-3) and negatively skew particles have a tail of excess coarse particles (see ~3.2
mm curve on Fig. 3-3) [45]. All the particles were comprised of fine-skewed particles, as
almost all the skewness values were within 0.1 to 0.3 [30]. Graphic Kurtosis values for
both feedstock and all nominal sizes ranged between 0.9 to 1.1, and corresponding
particles were termed as mesokurtic (Table 3-4) [30]. Mesokurtic is a distribution with
the same degree of peakedness5 about the mean as a normal distribution [44]. Hence,
knife mill chopping of wheat straw and corn stover resulted in fine-skewed mesokurtic
particles. The same result has been reported for unclassified wheat straw by Bitra [44].
5 Height and steepness of the frequency function near the mode.
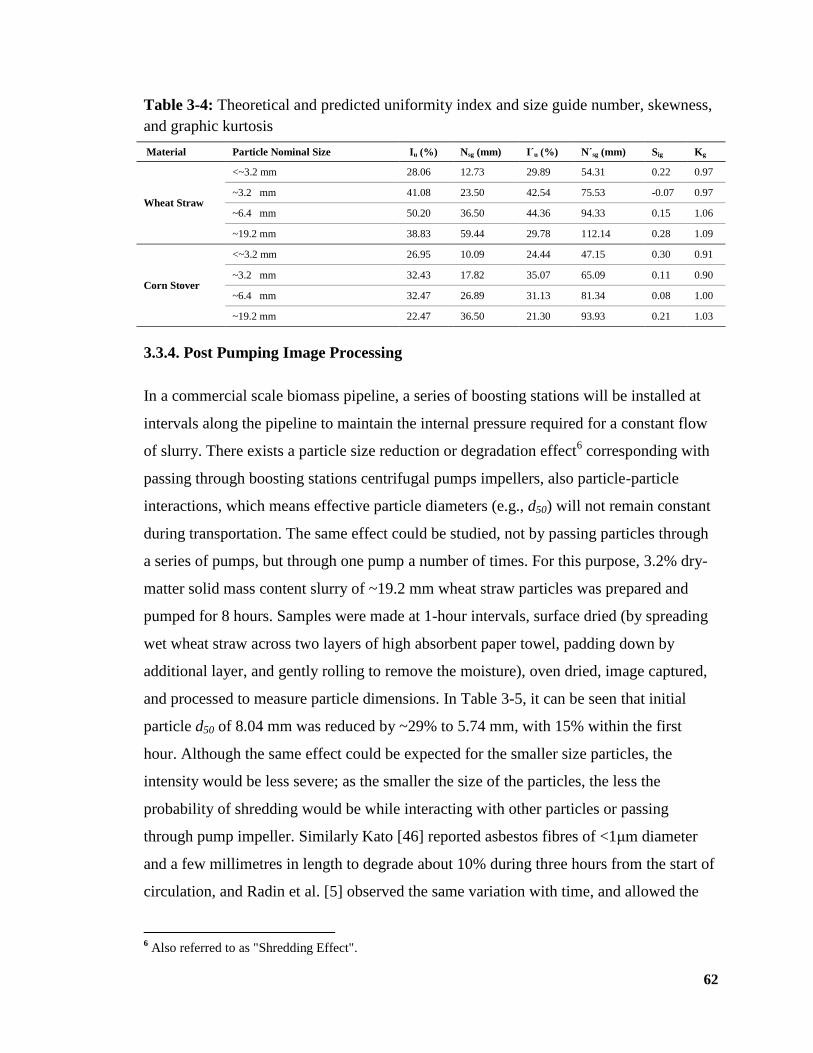
62
Table 3-4: Theoretical and predicted uniformity index and size guide number, skewness,
and graphic kurtosis
Material Particle Nominal Size Iu (%) Nsg (mm) I´u (%) N´sg (mm) Sig Kg
Wheat Straw
<~3.2 mm 28.06 12.73 29.89 54.31 0.22 0.97
~3.2 mm 41.08 23.50 42.54 75.53 -0.07 0.97
~6.4 mm 50.20 36.50 44.36 94.33 0.15 1.06
~19.2 mm 38.83 59.44 29.78 112.14 0.28 1.09
Corn Stover
<~3.2 mm 26.95 10.09 24.44 47.15 0.30 0.91
~3.2 mm 32.43 17.82 35.07 65.09 0.11 0.90
~6.4 mm 32.47 26.89 31.13 81.34 0.08 1.00
~19.2 mm 22.47 36.50 21.30 93.93 0.21 1.03
3.3.4. Post Pumping Image Processing
In a commercial scale biomass pipeline, a series of boosting stations will be installed at
intervals along the pipeline to maintain the internal pressure required for a constant flow
of slurry. There exists a particle size reduction or degradation effect6 corresponding with
passing through boosting stations centrifugal pumps impellers, also particle-particle
interactions, which means effective particle diameters (e.g., d50) will not remain constant
during transportation. The same effect could be studied, not by passing particles through
a series of pumps, but through one pump a number of times. For this purpose, 3.2% dry-
matter solid mass content slurry of ~19.2 mm wheat straw particles was prepared and
pumped for 8 hours. Samples were made at 1-hour intervals, surface dried (by spreading
wet wheat straw across two layers of high absorbent paper towel, padding down by
additional layer, and gently rolling to remove the moisture), oven dried, image captured,
and processed to measure particle dimensions. In Table 3-5, it can be seen that initial
particle d50 of 8.04 mm was reduced by ~29% to 5.74 mm, with 15% within the first
hour. Although the same effect could be expected for the smaller size particles, the
intensity would be less severe; as the smaller the size of the particles, the less the
probability of shredding would be while interacting with other particles or passing
through pump impeller. Similarly Kato [46] reported asbestos fibres of <1μm diameter
and a few millimetres in length to degrade about 10% during three hours from the start of
circulation, and Radin et al. [5] observed the same variation with time, and allowed the
6 Also referred to as "Shredding Effect".
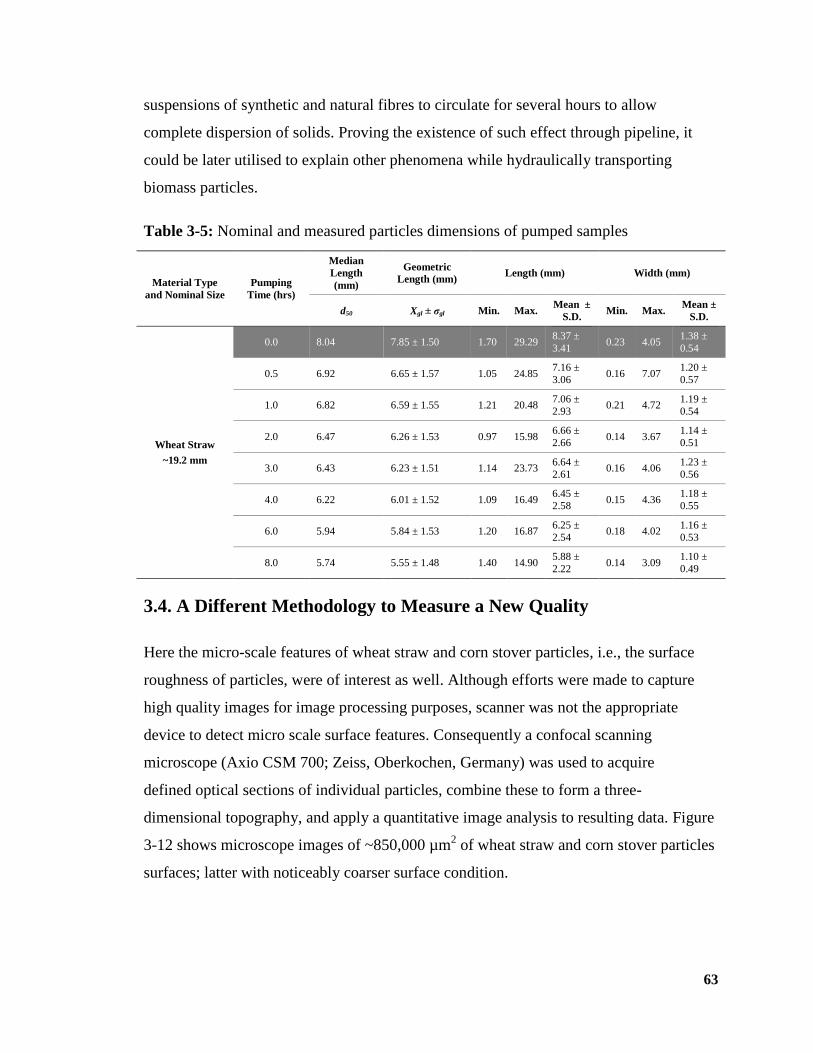
63
suspensions of synthetic and natural fibres to circulate for several hours to allow
complete dispersion of solids. Proving the existence of such effect through pipeline, it
could be later utilised to explain other phenomena while hydraulically transporting
biomass particles.
Table 3-5: Nominal and measured particles dimensions of pumped samples
Material Type
and Nominal Size
Pumping
Time (hrs)
Median
Length
(mm)
Geometric
Length (mm) Length (mm) Width (mm)
d50 Xgl ± σgl Min. Max. Mean ±
S.D. Min. Max.
Mean ±
S.D.
Wheat Straw
~19.2 mm
0.0 8.04 7.85 ± 1.50 1.70 29.29 8.37 ±
3.41 0.23 4.05
1.38 ±
0.54
0.5 6.92 6.65 ± 1.57 1.05 24.85 7.16 ±
3.06 0.16 7.07
1.20 ±
0.57
1.0 6.82 6.59 ± 1.55 1.21 20.48 7.06 ±
2.93 0.21 4.72
1.19 ±
0.54
2.0 6.47 6.26 ± 1.53 0.97 15.98 6.66 ±
2.66 0.14 3.67
1.14 ±
0.51
3.0 6.43 6.23 ± 1.51 1.14 23.73 6.64 ±
2.61 0.16 4.06
1.23 ±
0.56
4.0 6.22 6.01 ± 1.52 1.09 16.49 6.45 ±
2.58 0.15 4.36
1.18 ±
0.55
6.0 5.94 5.84 ± 1.53 1.20 16.87 6.25 ±
2.54 0.18 4.02
1.16 ±
0.53
8.0 5.74 5.55 ± 1.48 1.40 14.90 5.88 ±
2.22 0.14 3.09
1.10 ±
0.49
3.4. A Different Methodology to Measure a New Quality
Here the micro-scale features of wheat straw and corn stover particles, i.e., the surface
roughness of particles, were of interest as well. Although efforts were made to capture
high quality images for image processing purposes, scanner was not the appropriate
device to detect micro scale surface features. Consequently a confocal scanning
microscope (Axio CSM 700; Zeiss, Oberkochen, Germany) was used to acquire
defined optical sections of individual particles, combine these to form a three-
dimensional topography, and apply a quantitative image analysis to resulting data. Figure
3-12 shows microscope images of ~850,000 µm2 of wheat straw and corn stover particles
surfaces; latter with noticeably coarser surface condition.
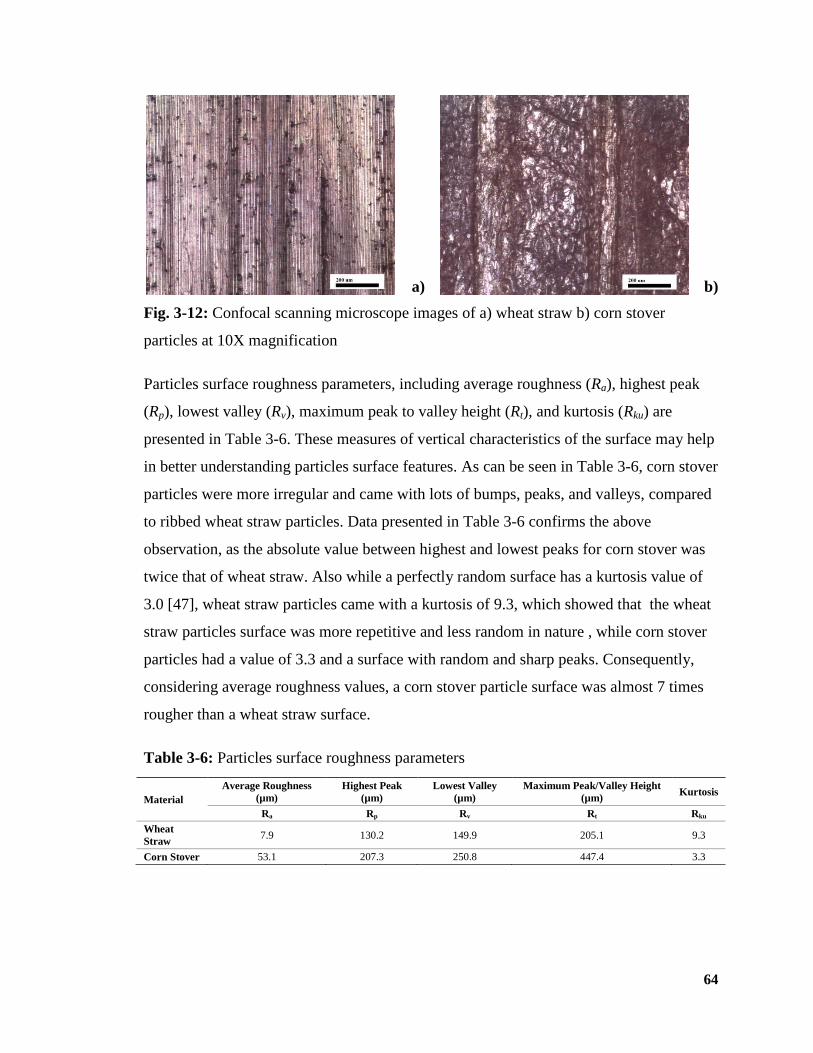
64
a)
b)
Fig. 3-12: Confocal scanning microscope images of a) wheat straw b) corn stover
particles at 10X magnification
Particles surface roughness parameters, including average roughness (Ra), highest peak
(Rp), lowest valley (Rv), maximum peak to valley height (Rt), and kurtosis (Rku) are
presented in Table 3-6. These measures of vertical characteristics of the surface may help
in better understanding particles surface features. As can be seen in Table 3-6, corn stover
particles were more irregular and came with lots of bumps, peaks, and valleys, compared
to ribbed wheat straw particles. Data presented in Table 3-6 confirms the above
observation, as the absolute value between highest and lowest peaks for corn stover was
twice that of wheat straw. Also while a perfectly random surface has a kurtosis value of
3.0 [47], wheat straw particles came with a kurtosis of 9.3, which showed that the wheat
straw particles surface was more repetitive and less random in nature , while corn stover
particles had a value of 3.3 and a surface with random and sharp peaks. Consequently,
considering average roughness values, a corn stover particle surface was almost 7 times
rougher than a wheat straw surface.
Table 3-6: Particles surface roughness parameters
Material
Average Roughness
(µm)
Highest Peak
(µm)
Lowest Valley
(µm)
Maximum Peak/Valley Height
(µm) Kurtosis
Ra Rp Rv Rt Rku
Wheat
Straw 7.9 130.2 149.9 205.1 9.3
Corn Stover 53.1 207.3 250.8 447.4 3.3
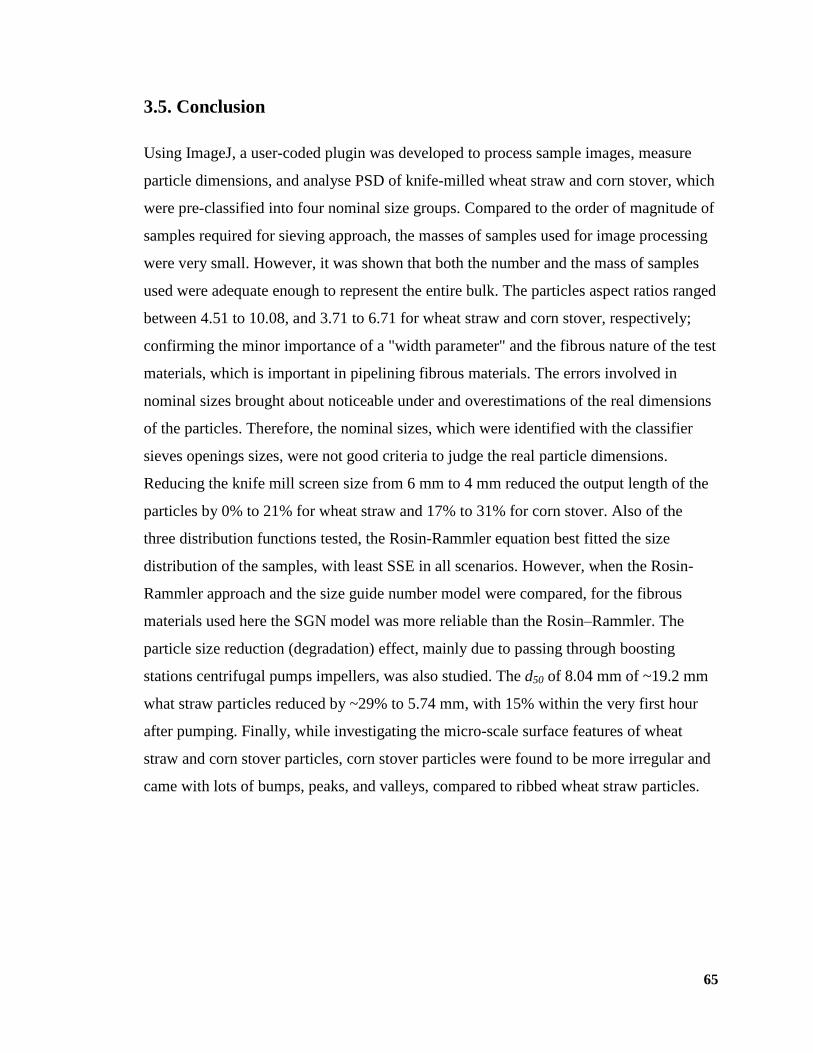
65
3.5. Conclusion
Using ImageJ, a user-coded plugin was developed to process sample images, measure
particle dimensions, and analyse PSD of knife-milled wheat straw and corn stover, which
were pre-classified into four nominal size groups. Compared to the order of magnitude of
samples required for sieving approach, the masses of samples used for image processing
were very small. However, it was shown that both the number and the mass of samples
used were adequate enough to represent the entire bulk. The particles aspect ratios ranged
between 4.51 to 10.08, and 3.71 to 6.71 for wheat straw and corn stover, respectively;
confirming the minor importance of a "width parameter" and the fibrous nature of the test
materials, which is important in pipelining fibrous materials. The errors involved in
nominal sizes brought about noticeable under and overestimations of the real dimensions
of the particles. Therefore, the nominal sizes, which were identified with the classifier
sieves openings sizes, were not good criteria to judge the real particle dimensions.
Reducing the knife mill screen size from 6 mm to 4 mm reduced the output length of the
particles by 0% to 21% for wheat straw and 17% to 31% for corn stover. Also of the
three distribution functions tested, the Rosin-Rammler equation best fitted the size
distribution of the samples, with least SSE in all scenarios. However, when the Rosin-
Rammler approach and the size guide number model were compared, for the fibrous
materials used here the SGN model was more reliable than the Rosin–Rammler. The
particle size reduction (degradation) effect, mainly due to passing through boosting
stations centrifugal pumps impellers, was also studied. The d50 of 8.04 mm of ~19.2 mm
what straw particles reduced by ~29% to 5.74 mm, with 15% within the very first hour
after pumping. Finally, while investigating the micro-scale surface features of wheat
straw and corn stover particles, corn stover particles were found to be more irregular and
came with lots of bumps, peaks, and valleys, compared to ribbed wheat straw particles.
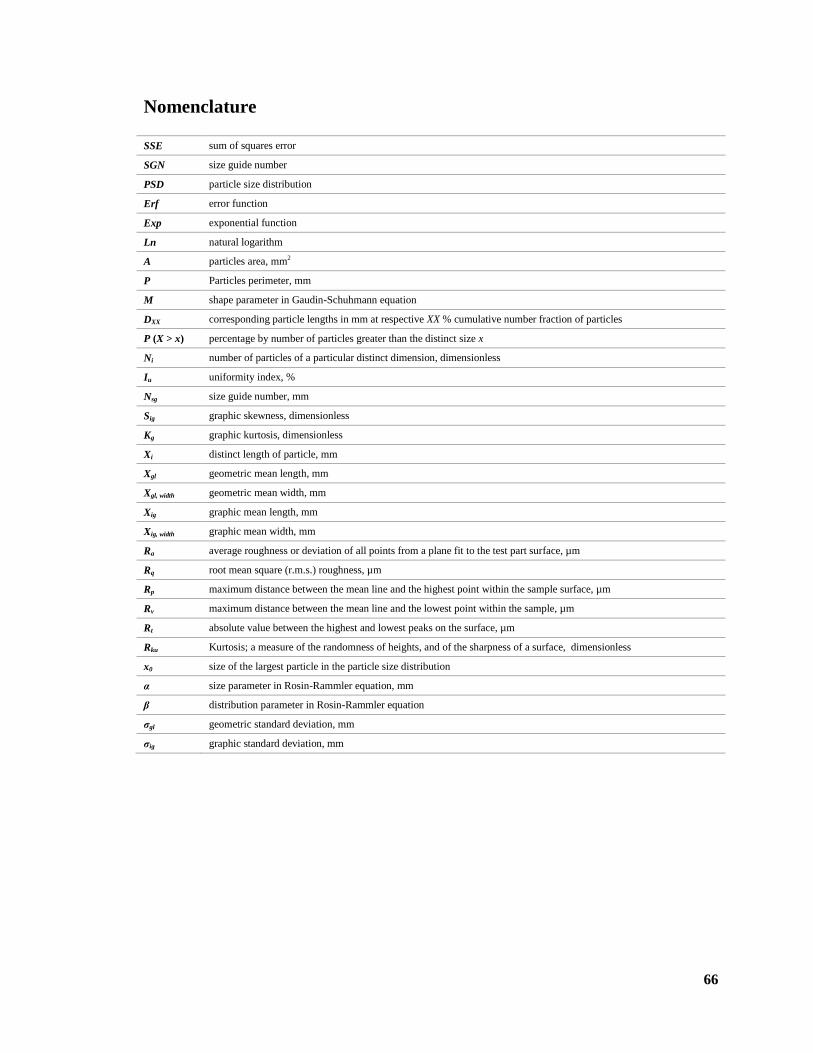
66
Nomenclature
SSE sum of squares error
SGN size guide number
PSD particle size distribution
Erf error function
Exp exponential function
Ln natural logarithm
A particles area, mm2
P Particles perimeter, mm
M shape parameter in Gaudin-Schuhmann equation
DXX corresponding particle lengths in mm at respective XX % cumulative number fraction of particles
P (X > x) percentage by number of particles greater than the distinct size x
Ni number of particles of a particular distinct dimension, dimensionless
Iu uniformity index, %
Nsg size guide number, mm
Sig graphic skewness, dimensionless
Kg graphic kurtosis, dimensionless
Xi distinct length of particle, mm
Xgl geometric mean length, mm
Xgl, width geometric mean width, mm
Xig graphic mean length, mm
Xig, width graphic mean width, mm
Ra average roughness or deviation of all points from a plane fit to the test part surface, µm
Rq root mean square (r.m.s.) roughness, µm
Rp maximum distance between the mean line and the highest point within the sample surface, µm
Rv maximum distance between the mean line and the lowest point within the sample, µm
Rt absolute value between the highest and lowest peaks on the surface, µm
Rku Kurtosis; a measure of the randomness of heights, and of the sharpness of a surface, dimensionless
x0 size of the largest particle in the particle size distribution
α size parameter in Rosin-Rammler equation, mm
β distribution parameter in Rosin-Rammler equation
σgl geometric standard deviation, mm
σig graphic standard deviation, mm
67
References
[1] Kumar, A., Cameron, J.B., Flynn, P.C. Pipeline transport of biomass. Applied
Biochemistry and Biotechnology, 2004; 113: 27-39.
[2] Kumar, A., Flynn, P.C., Cameron, J.B. Large-scale ethanol fermentation through
pipeline delivery of biomass. Applied Biochemistry and Biotechnology, 2005; 121: 47-
58.
[3] Kumar, A., Flynn, P.C., Cameron, J.B. Pipeline transport and simultaneous
saccharification of corn stover. Bioresource Technology, 2005; 96: 819-29.
[4] Bobkowic, A., Gauvin, W.H. Turbulent flow characteristics of model fibre
suspensions. Canadian Journal of Chemical Engineering, 1965; 43: 87-91.
[5] Radin, I., Zakin, J.L., Patterson, G.K. Drag reduction in solid-fluid systems. Aiche
Journal, 1975; 21: 358-71.
[6] Vaezi, M., Katta, A.K., Kumar, A. Investigation into the mechanisms of pipeline
transport of slurries of wheat straw and corn stover to supply a bio-refinery. Biosystems
Engineering, 2014; 118: 52-67.
[7] ASABE Standards. Method of determining and expressing particle size of
chopped forage materials by screening - ANSI/ASAE S424.1. American Society of
Agricultural and Biological Engineers; 2007.
[8] Igathinathane, C., Pordesimo, L.O., Columbus, E.P., Batchelor, W.D.,
Sokhansanj, S. Sieveless particle size distribution analysis of particulate materials
through computer vision. Computers and Electronics in Agriculture, 2009; 66: 147-58.
[9] Womac, A.R., Igathinathane, C., Bitra, P., Miu, P., Yang, T., Sokhansanj, S.
Biomass pre-processing size reduction with instrumented mills. ASABE Paper No
076046; 2007.
[10] Shahin, M.A., Symons, S.J., Poysa, V.W. Determining soya bean seed size
uniformity with image analysis. Biosystems Engineering, 2006; 94: 191-98.
[11] Li, Z., Hong, T.S., Wu, W.B., Liu, M.J. A novel method of object identification
and leaf area calculation in multi-leaf image. ASABE Paper No: 073047, 2007.

68
[12] Pearson, T.C., Brabec, D.L. Camera attachment for automatic measurement of
single-wheat kernel size on a perten SKCS 4100. Applied Engineering in Agriculture,
2006; 22: 927-33.
[13] Igathinathane, C., Pordesimo, L.O., Batchelor, W.D. Ground biomass sieve
analysis simulation by image processing and experimental verification of particle size
distribution. ASABE Annual International Meeting. Rhode Island Convention Center:
ASABE; 2008.
[14] Shahin, M.A., Symons, S.J. Seed sizing from images of non-singulated grain
samples CANADIAN BIOSYSTEMS ENGINEERING, 2005; 47: 49-55.
[15] Sun, D.W., Brosnan, T. Inspection and grading of agricultural and food products
by computer vision systems - a review. Computers and Electronics in Agriculture, 2002;
36: 193-213.
[16] Kwan, A.K.H., Mora, C.F., Chan, H.C. Particle size distribution analysis of
coarse aggregate using digital image processing. Cement and Concrete Research, 1998;
28: 921-32.
[17] Visen, N.S., Paliwal, J., Jayas, D.S., White, N.D.G. Image analysis of bulk grain
samples using neural networks. Canadian Agricultural Engineering, 2004; 46: 11-15.
[18] Wang, W., Paliwal, J. Separation and identification of touching kernels and
dockage components in digital images. CANADIAN BIOSYSTEMS ENGINEERING,
2006; 48: 1-7.
[19] Igathinathane, C., Prakash, V.S.S., Padma, U., Babu, G.R., Womac, A.R.
Interactive computer software development for leaf area measurement. Computers and
Electronics in Agriculture, 2006; 51: 1-16.
[20] Rasband, W.S. ImageJ. U.S. National Institutes of Health,; 2008.
[21] Kim, S., Dale, B.E. Global potential bioethanol production from wasted crops and
crop residues. Biomass & Bioenergy, 2004; 26: 361-75.
[22] Technical Association of the Pulp and Paper Industry (TAPPI). TAPPI usefull
methods NO.21, SCAN CM 40:88 2010.
[23] Shook CA, S.R. Pipeline hydrotransport with application in oilsand industry:
SRC publication No. 11508-1E02; 2002.
69
[24] Rodieck, B. EllipseFitter Class of ImageJ,
http://rsb.info.nih.gov/ij/developer/source/ij/process/EllipseFitter.java.html, Accessed
September 2011. 2007.
[25] Igathinathane, C., Pordesimo, L.O., Columbus, E.P., Batchelor, W.D., Methuku,
S.R. Shape identification and particles size distribution from basic shape parameters
using ImageJ. Computers and Electronics in Agriculture, 2008; 63: 168-82.
[26] Igathinathane, C., Melin, S., Sokhansanj, S., Bi, X., Lim, C.J., Pordesimo, L.O., et
al. Machine vision based particle size and size distribution determination of airborne dust
particles of wood and bark pellets. Powder Technology, 2009; 196: 202-12.
[27] European Blenders Association (EBA). Handbook of Solid Fertilizer Blending,
Code of Good Practices for Quality. Le Pontoury, Montviron, France: European
Blenders Association 1997.
[28] Allaire, S.E., Parent, L.E. Size guide number and Rosin-Rammler approaches to
describe particle size distribution of granular organic-based fertilisers. Biosystems
Engineering, 2003; 86: 503-09.
[29] Folk, R.L., Ward, W.C. Brazos River bar: a study in the significance of grain size
parameters Journal of sedimentary petrology, 1957; 27: 3-26.
[30] Folk, R.L. Petrology of sedimentary rocks. Austin, Texas: Hemphill Publishing
Co; 1974.
[31] Blott, S.J., Pye, K. GRADISTAT: A grain size distribution and statistics package
for the analysis of unconsolidated sediments. Earth Surface Processes and Landforms,
2001; 26: 1237-48.
[32] Duffy GG, M.K., Titchener AL. The determination of pipe friction loss. Journal
of the Australian and New Zealand pulp and paper industry technical association, 1972;
6: 191-95.
[33] Viamajala, S., McMillan, J.D., Schell, D.J., Elander, R.T. Rheology of corn stover
slurries at high solids concentrations - Effects of saccharification and particle size.
Bioresource Technology, 2009; 100: 925-34.
[34] I, K. Behaviour of extremely coarse particles in pipe flow. Hydrotransport 4.
Banff, Alberta, Canada; 1976.
70
[35] Perfect, E., Xu, Q., Terry, D.L. Improved parameterization of fertilizer particle
size distribution. Journal of Aoac International, 1998; 81: 935-42.
[36] Hwang, S.H., Lee, K.P., Lee, D.S., Powers, S.E. Models for estimating soil
particle-size distribution. Soil Science Society of America Journal, 2002; 66: 1143-50.
[37] Rosin, P., Rammler, E. The laws governing the fineness of powdered coal.
Journal of the Institute of Fuel, 1933; 7: 26-39.
[38] Gupta, A., Yan, D. Mineral processing design and operation: An introduction.
Amsterdam, Netherlans: Elsevier 2006.
[39] Epstein, B. Logarithmico-Normal Distribution in Breakage of Solids. Industrial
and Engineering Chemistry, 1948; 40: 2289-91.
[40] Gaudin, A.M., Meloy, T.P. Model and a Comminution Distribution Equation for
Single Fracture. Transactions of the Society of Mining Engineers of Aime, 1962; 223:
40-43.
[41] British Standards Institution. Testing aggregates part 103: Methods for
determination of particle size distribution, Sec. 103.1: Sieve tests 1985.
[42] Vaseleski, R.C., Metzner, B. Drag reduction in the turbulent flow of fiber
suspensions. AlChE, 1974; 20: 301-08.
[43] Lee, P.F.W., Duffy, G.G. Relationships between Velocity Profiles and Drag
Reduction in Turbulent Fiber Suspension Flow. Aiche Journal, 1976; 22: 750-53.
[44] Bitra, V.S.P., Womaca, A.R., Yang, Y.T., Miu, P.I., Igathinathane, C., Chevanan,
N., et al. Characterization of wheat straw particle size distributions as affected by knife
mill operating factors. biomass and bioenergy, 2011; 35: 3674-87.
[45] Flügel, E. Microfacies of Carbonate Rocks: Analysis, Interpretation and
Application: Springer; 2004.
[46] Kato, H., Mizunuma, H. Frictional resistance in fiber suspensions (part 1): pipe-
flow. Bulletin of the Jsme-Japan Society of Mechanical Engineers, 1983; 26: 231-38.
[47] Al-Kindi, G.A., Shirinzadeh, B. An evaluation of surface roughness parameters
measurement using vision-based data. International Journal of Machine Tools &
Manufacture, 2007; 47: 697-708.
71
CHAPTER 4
Investigation into the Mechanisms of Pipeline Transport of
Slurries of Wheat Straw and Corn Stover to Supply a
Biorefinery1
4.1. Introduction
Kumar et al. [1-3] studied various scenarios of pipelining biomass materials and
compared the costs of pipeline transport vs. truck delivery. While preliminary economic
assessments of biomass pipeline hydro-transport have been carried out via experimental
study on wood chip-water mixture (slurry) pipelines, its technical and chemical feasibility
has not been studied in detail. Moreover, the pressure drop (frictional loss) correlations
that were used to obtain the cost estimates of pipeline hydro-transport of corn stover were
originally proposed for pipeline transport of wood chip-water mixtures [4, 5]. Corn stover
and wood chips, however, have very different shapes; the former is fibrous in nature with
a wide aspect ratio that can give rise to a variety of mechanisms, including drag
reduction, during slurry flow [6] that are often not encountered in conventional solid-
liquid systems.
Although several hypotheses have been proposed to explain certain aspects of the
observed phenomena in slurry flows of woody particles, more complete expressions of
the functional relationships between the many variables governing the hydro-transport of
woody materials in pipelines have been proposed based upon purely empirical
correlations. Luk [7] experimentally studied pipeline hydro-transport of wheat straw
particles by measuring longitudinal pressure gradients. The experiment was focused on
wheat straw particles and did not include particle characteristics, the rheology of the
carrier liquid, or the mechanisms corresponding to drag reduction throughout the
pipeline.
1 Vaezi, M., Katta, A.K., Kumar, A., Biosystems Engineering, 2014; 118: 52-67.
72
The present research attempts to experimentally investigate pipelining slurries of two
types of fibrous agricultural residue biomass, wheat straw and corn stover, and to study
the technical limitations, potential advantages, and governing equations. The objectives
of the research were to:
- study the technical feasibility of pipelining agricultural residue biomass (corn stover
and wheat straw), identify potential difficulties in handling agricultural residue
biomass slurry, and propose a standard operating procedure for pipelining irregularly-
shaped agricultural residue biomass particles;
- critically examine the applicability of wood chip-water mixtures pressure drop
correlations in order to calculate friction losses while hydro-transporting wheat straw
and corn stover particles;
- study mechanical behaviour, specifically the change in the pressure drop of
agricultural residue biomass (corn stover and wheat straw) slurry for various particles
sizes, slurry solid mass contents, and slurry flow rates, and try to obtain optimum
operating conditions.
4.2. Methodology
4.2.1. Feedstock Properties and Preparation
The research specifically focused on transporting corn stover (Zea mays; leaves and
stalks of maize) and wheat straw (Triticum sativum; dry stalks of wheat) agricultural
residue biomass by pipeline. Corn stover and wheat straw were collected from farms in
southern and northern Alberta, Canada. The dry feedstock was firstly milled using a
commercially available cutting mill (SM-100; Retsch Inc., Newtown, PA, USA), then
classified using a standard [8, 9] chip classifier (BM&M Inc., Surrey, BC, Canada) into
four major groups with nominal sizes (i.e., the size of the openings of the classifier
sieves) of 19.2 mm, 6.4 mm, 3.2 mm, and <3.2 mm.
The wet-basis moisture content (water mass content - MC) of the samples was measured
according to ASABE S358.2 standard [10], wherein a sample of at least 25 g was oven-
dried at 103°C for 24 h. Particle density was evaluated according to ASTM standards
73
[11] by loosely filling a cylinder 150 mm in diameter and 150 mm in height and weighing
it in air and water. The difference in weight represented the buoyant force against the
material. Consequently, an initial moisture content of 6 ± 0.5% and preliminary particle
specific gravities of 1.1 ± 0.01 for wheat straw and 1.2 ± 0.01 for corn stover were
calculated for the corn stover and wheat straw samples. The same approach was later
followed to monitor the variation in particle moisture content during hydro-transport.
4.2.2. Image Processing and Morphological Studies
Unusual characteristics (e.g., relatively large mean particle size; wide size distribution;
extreme shapes; fibrous, pliable, flexible, and asymmetric nature; potential for forming
networks) can make agricultural residue biomass particles atypical [12]. While wood pulp
fibres (which as largely hydro-transported through pipes over short distances for on-site
processing applications) are typically 1-5 mm in length and 15-40 µm width [6, 13-15],
the particles studied here come with noticeably larger dimensions that can be visually
recognized and classified, a feature that makes transporting agricultural residue biomass
by pipeline different from pulp processing.
Understanding particle morphological features is the first step in the study of agricultural
residue biomass slurry behaviour, as they influence the deposition velocity, carrier liquid
viscosity, slurry apparent viscosity, and slurry friction loss. Using a digital image
processing approach and the ImageJ platform [16], a user-coded plugin was developed at
the University of Alberta in the Large-Scale Fluids Laboratory to process particle sample
images, measure particle dimensions, and analyse particle shape and size distribution
(PSD) as well as corresponding parameters of knife-milled pre-classified wheat straw and
corn stover [17]. Dimensions of significance based on length, including median length
(d50), geometric mean length (Xgl) and width (Xgw) and corresponding standard deviations
(σgl and σgw) [18], together with arithmetic mean length and width, are presented in Table
4-1. The results obtained here were later used to justify the behaviour of biomass slurry
and corresponding variations.
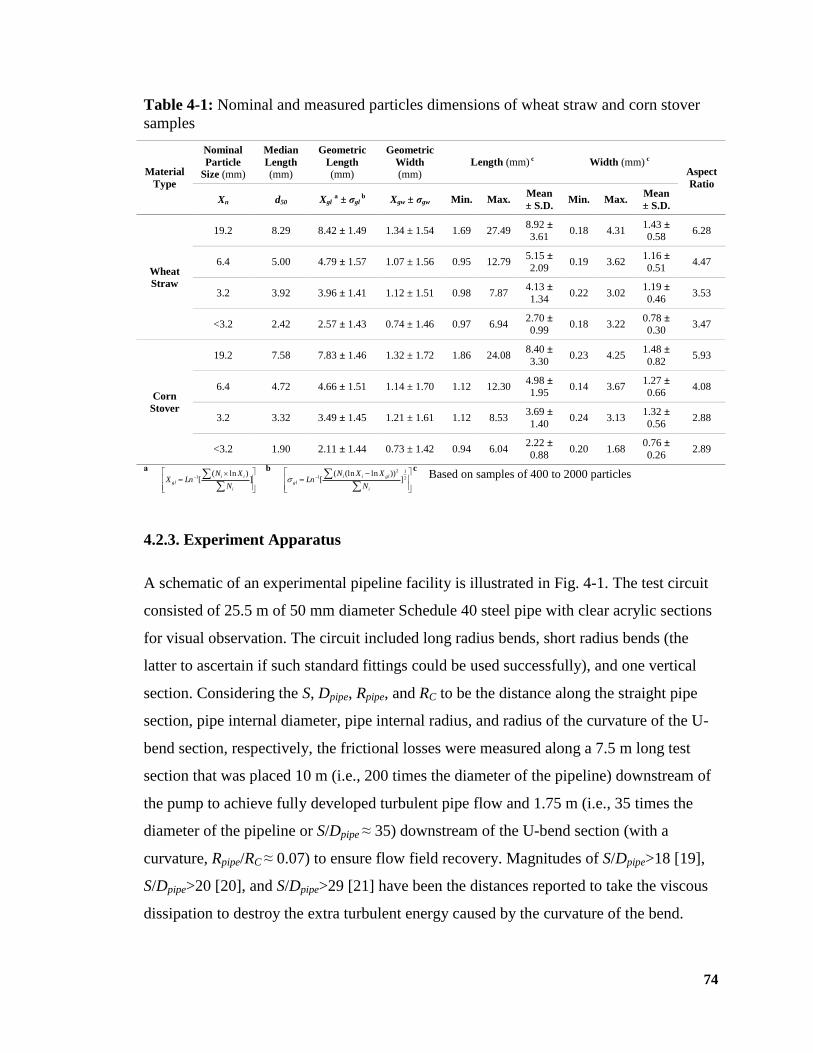
74
Table 4-1: Nominal and measured particles dimensions of wheat straw and corn stover
samples
Material
Type
Nominal
Particle
Size (mm)
Median
Length
(mm)
Geometric
Length
(mm)
Geometric
Width
(mm) Length (mm) c Width (mm) c
Aspect
Ratio
Xn d50 Xgl a ± σgl
b Xgw ± σgw Min. Max. Mean
± S.D. Min. Max.
Mean
± S.D.
Wheat
Straw
19.2 8.29 8.42 ± 1.49 1.34 ± 1.54 1.69 27.49 8.92 ± 3.61
0.18 4.31 1.43 ±
0.58 6.28
6.4 5.00 4.79 ± 1.57 1.07 ± 1.56 0.95 12.79 5.15 ±
2.09 0.19 3.62
1.16 ±
0.51 4.47
3.2 3.92 3.96 ± 1.41 1.12 ± 1.51 0.98 7.87 4.13 ±
1.34 0.22 3.02
1.19 ±
0.46 3.53
<3.2 2.42 2.57 ± 1.43 0.74 ± 1.46 0.97 6.94 2.70 ± 0.99
0.18 3.22 0.78 ± 0.30
3.47
Corn
Stover
19.2 7.58 7.83 ± 1.46 1.32 ± 1.72 1.86 24.08 8.40 ±
3.30 0.23 4.25
1.48 ±
0.82 5.93
6.4 4.72 4.66 ± 1.51 1.14 ± 1.70 1.12 12.30 4.98 ± 1.95
0.14 3.67 1.27 ± 0.66
4.08
3.2 3.32 3.49 ± 1.45 1.21 ± 1.61 1.12 8.53 3.69 ±
1.40 0.24 3.13
1.32 ±
0.56 2.88
<3.2 1.90 2.11 ± 1.44 0.73 ± 1.42 0.94 6.04 2.22 ±
0.88 0.20 1.68
0.76 ±
0.26 2.89
a
]
)ln([1
i
ii
glN
XNLnX
b
2
12
1 ]))ln(ln(
[i
glii
glN
XXNLn
c Based on samples of 400 to 2000 particles
4.2.3. Experiment Apparatus
A schematic of an experimental pipeline facility is illustrated in Fig. 4-1. The test circuit
consisted of 25.5 m of 50 mm diameter Schedule 40 steel pipe with clear acrylic sections
for visual observation. The circuit included long radius bends, short radius bends (the
latter to ascertain if such standard fittings could be used successfully), and one vertical
section. Considering the S, Dpipe, Rpipe, and RC to be the distance along the straight pipe
section, pipe internal diameter, pipe internal radius, and radius of the curvature of the U-
bend section, respectively, the frictional losses were measured along a 7.5 m long test
section that was placed 10 m (i.e., 200 times the diameter of the pipeline) downstream of
the pump to achieve fully developed turbulent pipe flow and 1.75 m (i.e., 35 times the
diameter of the pipeline or S/Dpipe ≈ 35) downstream of the U-bend section (with a
curvature, Rpipe/RC ≈ 0.07) to ensure flow field recovery. Magnitudes of S/Dpipe>18 [19],
S/Dpipe>20 [20], and S/Dpipe>29 [21] have been the distances reported to take the viscous
dissipation to destroy the extra turbulent energy caused by the curvature of the bend.
75
A 0.8 m diameter and 455 L capacity mixing tank was agitated by a 0.37 kW centrally
placed vertical mixer (EV6P50M; Lightning Inc., Rochester, NY, USA) carrying a
motor-boat propeller whose rotation caused the mixture to flow down in the centre of the
tank and rise at its periphery, where the centrifugal motion of the suction vortex caused
the particles to accumulate. Flow was provided by a 7.45 kW centrifugal slurry pump
(CD80M; Godwin Pumps Ltd., Bridgeport, NJ, USA) rated at 10.7 L/s against ~157 kPa
at 1765 rpm and ~43% efficiency for clear water, coupled to a 7.45 kW induction electric
motor (CC 068A; Madison Industrial Equipment, Vancouver, BC, Canada) and
controlled by a 14.91 kW variable frequency drive (VFD) controller (MA7200-2020-N1,
TECO-Westinghouse Co., Round Rock, TX, US). Downstream from the pump, a double-
tube heat exchanger was installed to partially control the mixture temperature at ~ 15°C.
A watt transducer (PC5; Flex-Core, Columbus, OH, USA), an electromagnetic flow
meter (FMG-401H; Omega Eng., Stamford, CT, USA) with accuracy of ±0.5% of rate at
1.0 to 10 m/s, and a resistance temperature detector (RTD-E; Omega Eng., Stamford, CT,
USA) measured the power consumption of the motor, the mixture bulk velocity, rate of
fluid flow, and mixture temperature. The conductivity of fully-saturated agricultural
residue biomass particles was measured as well to confirm the applicability of magnetic
flow meter to measure the solid particles flow rate. Two 25 mm flush diaphragm low-
pressure transmitters (PX42G7; Omega Eng., Stamford, CT, USA) with accuracy of
0.25% of linearity, hysteresis and repeatability combined, measured gauge pressures
upstream and downstream of the test section.
Finally, 4-20 mA output signals from the watt transducer, temperature probe, magnetic
flow meter, and pressure transmitters were recorded with a frequency of 100 Hz on a
data-acquisition system, comprising of a 4-channel current excitation module (NI 9219;
National Instrument Corp., Austin, TX, USA) and a data-acquisition program (LabView
V.9.0.1f2; National Instrument Corp., Austin, TX, USA).
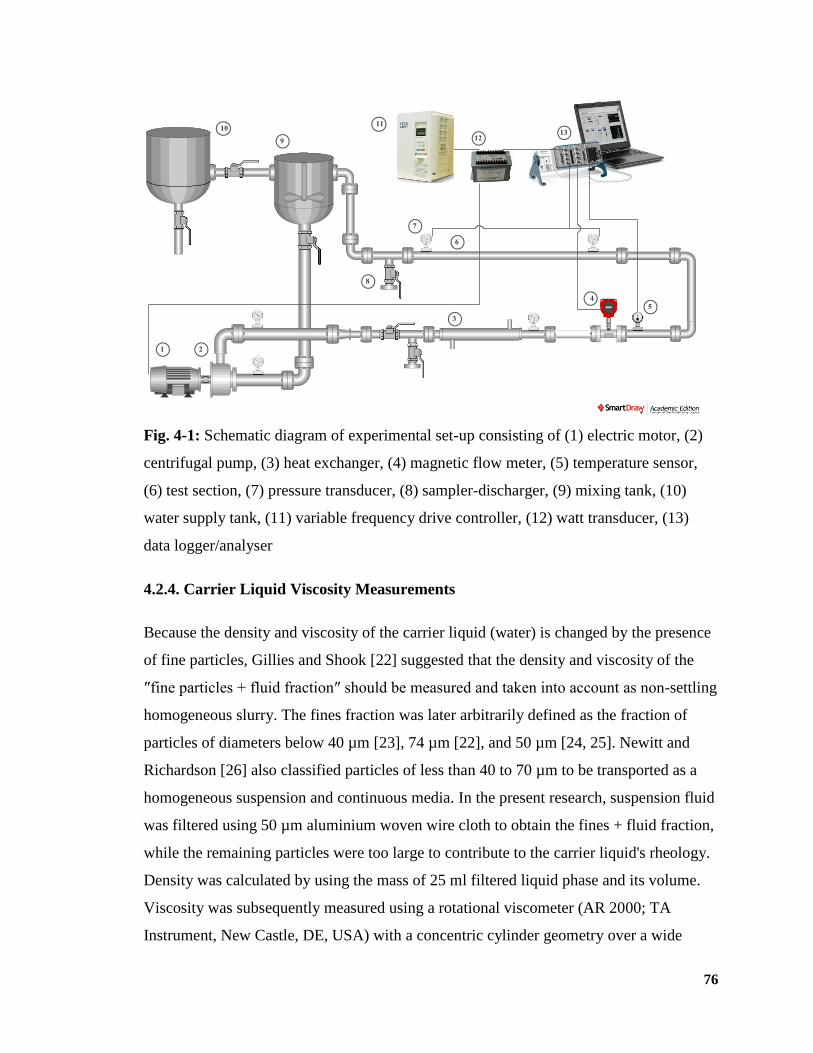
76
Fig. 4-1: Schematic diagram of experimental set-up consisting of (1) electric motor, (2)
centrifugal pump, (3) heat exchanger, (4) magnetic flow meter, (5) temperature sensor,
(6) test section, (7) pressure transducer, (8) sampler-discharger, (9) mixing tank, (10)
water supply tank, (11) variable frequency drive controller, (12) watt transducer, (13)
data logger/analyser
4.2.4. Carrier Liquid Viscosity Measurements
Because the density and viscosity of the carrier liquid (water) is changed by the presence
of fine particles, Gillies and Shook [22] suggested that the density and viscosity of the
″fine particles + fluid fraction″ should be measured and taken into account as non-settling
homogeneous slurry. The fines fraction was later arbitrarily defined as the fraction of
particles of diameters below 40 µm [23], 74 µm [22], and 50 µm [24, 25]. Newitt and
Richardson [26] also classified particles of less than 40 to 70 µm to be transported as a
homogeneous suspension and continuous media. In the present research, suspension fluid
was filtered using 50 µm aluminium woven wire cloth to obtain the fines + fluid fraction,
while the remaining particles were too large to contribute to the carrier liquid's rheology.
Density was calculated by using the mass of 25 ml filtered liquid phase and its volume.
Viscosity was subsequently measured using a rotational viscometer (AR 2000; TA
Instrument, New Castle, DE, USA) with a concentric cylinder geometry over a wide
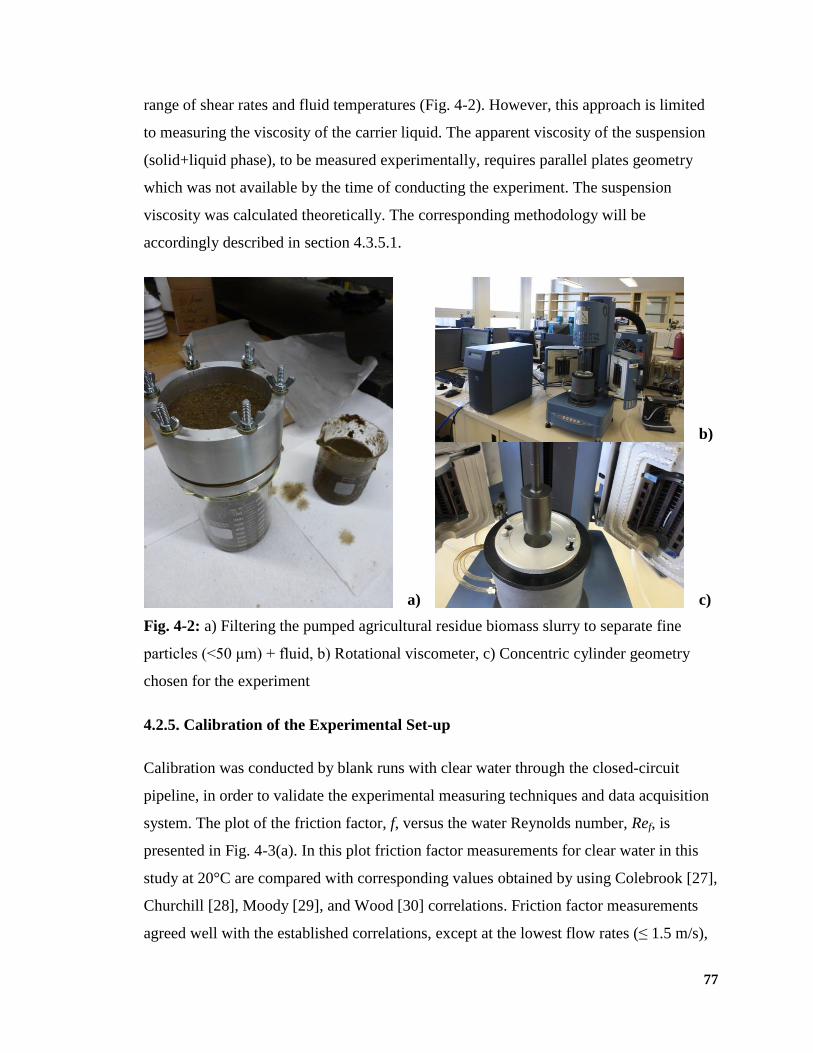
77
range of shear rates and fluid temperatures (Fig. 4-2). However, this approach is limited
to measuring the viscosity of the carrier liquid. The apparent viscosity of the suspension
(solid+liquid phase), to be measured experimentally, requires parallel plates geometry
which was not available by the time of conducting the experiment. The suspension
viscosity was calculated theoretically. The corresponding methodology will be
accordingly described in section 4.3.5.1.
a)
b)
c)
Fig. 4-2: a) Filtering the pumped agricultural residue biomass slurry to separate fine
particles (<50 μm) + fluid, b) Rotational viscometer, c) Concentric cylinder geometry
chosen for the experiment
4.2.5. Calibration of the Experimental Set-up
Calibration was conducted by blank runs with clear water through the closed-circuit
pipeline, in order to validate the experimental measuring techniques and data acquisition
system. The plot of the friction factor, f, versus the water Reynolds number, Ref, is
presented in Fig. 4-3(a). In this plot friction factor measurements for clear water in this
study at 20°C are compared with corresponding values obtained by using Colebrook [27],
Churchill [28], Moody [29], and Wood [30] correlations. Friction factor measurements
agreed well with the established correlations, except at the lowest flow rates (≤ 1.5 m/s),
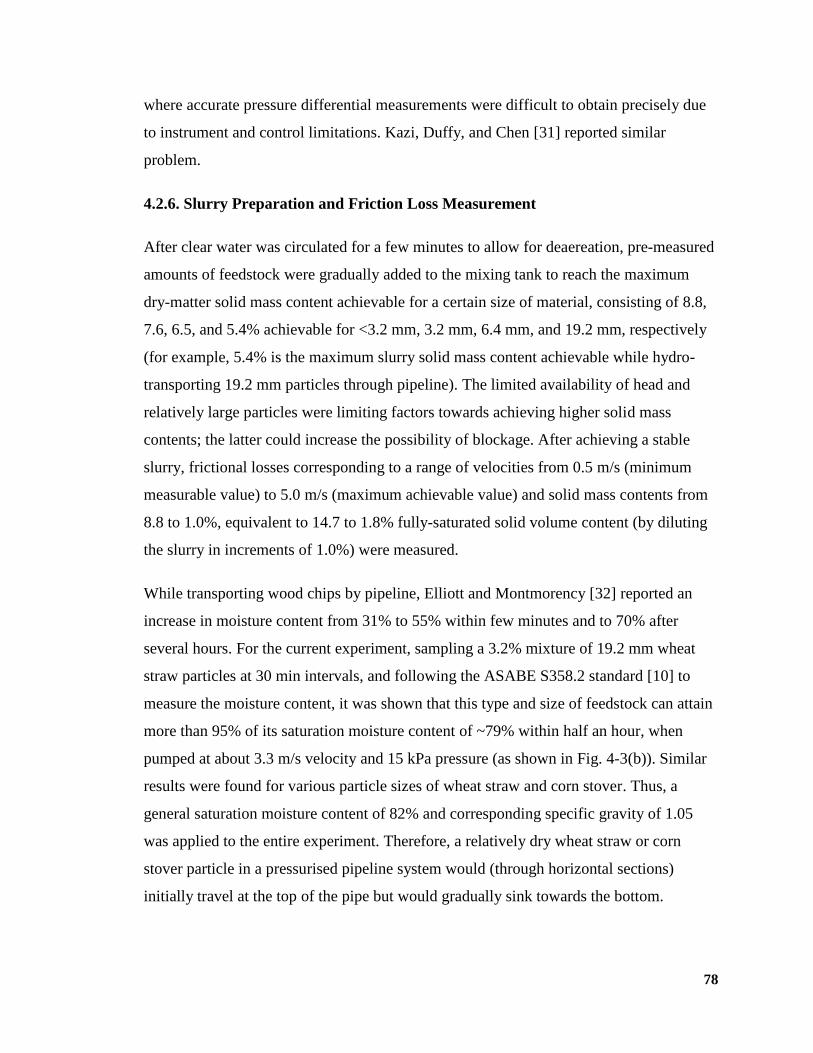
78
where accurate pressure differential measurements were difficult to obtain precisely due
to instrument and control limitations. Kazi, Duffy, and Chen [31] reported similar
problem.
4.2.6. Slurry Preparation and Friction Loss Measurement
After clear water was circulated for a few minutes to allow for deaereation, pre-measured
amounts of feedstock were gradually added to the mixing tank to reach the maximum
dry-matter solid mass content achievable for a certain size of material, consisting of 8.8,
7.6, 6.5, and 5.4% achievable for <3.2 mm, 3.2 mm, 6.4 mm, and 19.2 mm, respectively
(for example, 5.4% is the maximum slurry solid mass content achievable while hydro-
transporting 19.2 mm particles through pipeline). The limited availability of head and
relatively large particles were limiting factors towards achieving higher solid mass
contents; the latter could increase the possibility of blockage. After achieving a stable
slurry, frictional losses corresponding to a range of velocities from 0.5 m/s (minimum
measurable value) to 5.0 m/s (maximum achievable value) and solid mass contents from
8.8 to 1.0%, equivalent to 14.7 to 1.8% fully-saturated solid volume content (by diluting
the slurry in increments of 1.0%) were measured.
While transporting wood chips by pipeline, Elliott and Montmorency [32] reported an
increase in moisture content from 31% to 55% within few minutes and to 70% after
several hours. For the current experiment, sampling a 3.2% mixture of 19.2 mm wheat
straw particles at 30 min intervals, and following the ASABE S358.2 standard [10] to
measure the moisture content, it was shown that this type and size of feedstock can attain
more than 95% of its saturation moisture content of ~79% within half an hour, when
pumped at about 3.3 m/s velocity and 15 kPa pressure (as shown in Fig. 4-3(b)). Similar
results were found for various particle sizes of wheat straw and corn stover. Thus, a
general saturation moisture content of 82% and corresponding specific gravity of 1.05
was applied to the entire experiment. Therefore, a relatively dry wheat straw or corn
stover particle in a pressurised pipeline system would (through horizontal sections)
initially travel at the top of the pipe but would gradually sink towards the bottom.
79
Accordingly, it was decided to conduct all the experiments with particles fully saturated
and with a density slightly greater than the carrier liquid, water.
a) b)
Fig. 4-3: a) Friction factor vs. Reynolds number for clear water through the experimental
set-up, b) Moisture content variation of 19.2 mm wheat straw particles in a mixture of
3.2% solid mass content pumped at 3.3 m/s and 15 kPa pressure through the experimental
set-up
4.2.7. Uncertainty Analysis
Two sets of experiments were conducted on each particle type (wheat straw and corn
stover) and four particle sizes (Table 4-1) to assure repeatability and to investigate the
uncertainty of the results. Uncertainty was measured according to the standard
uncertainty analysis approach by calculating the precision uncertainty (Px) of the pressure
measurements and the bias uncertainty of the pressure transducers, which eventually give
the total uncertainty (Ux). Figure 4-4(a) represents the repeatability of experiments on a
4.3% solid mass content slurry of <3.2 mm corn stover and a 6.5% solid mass content
slurry of 6.4 mm wheat straw particles. A good agreement between corresponding tests
was observed, with an uncertainty of ±0.015 kPa/m and ±0.068 kPa/m for corn stover and
wheat straw experiments, respectively. Generally, a minimum uncertainty of 0.5% and
maximum of 10% was obtained through the course of these experiments.
0.00
0.02
0.04
0.06
0.08
0.10
2.0E+4 7.0E+4 1.2E+5 1.7E+5 2.2E+5
Fri
ctio
n F
act
or,
f
Reynolds Number, Re
Experimental
Colebrook
Churchill
Moody
Wood
6.76
75.96
76.36
76.86
77.66 77.86 78.06 78.76
1
10
100
0 2 4 6 8
Mo
istu
re C
on
ten
t (%
) Pumping Time (h)
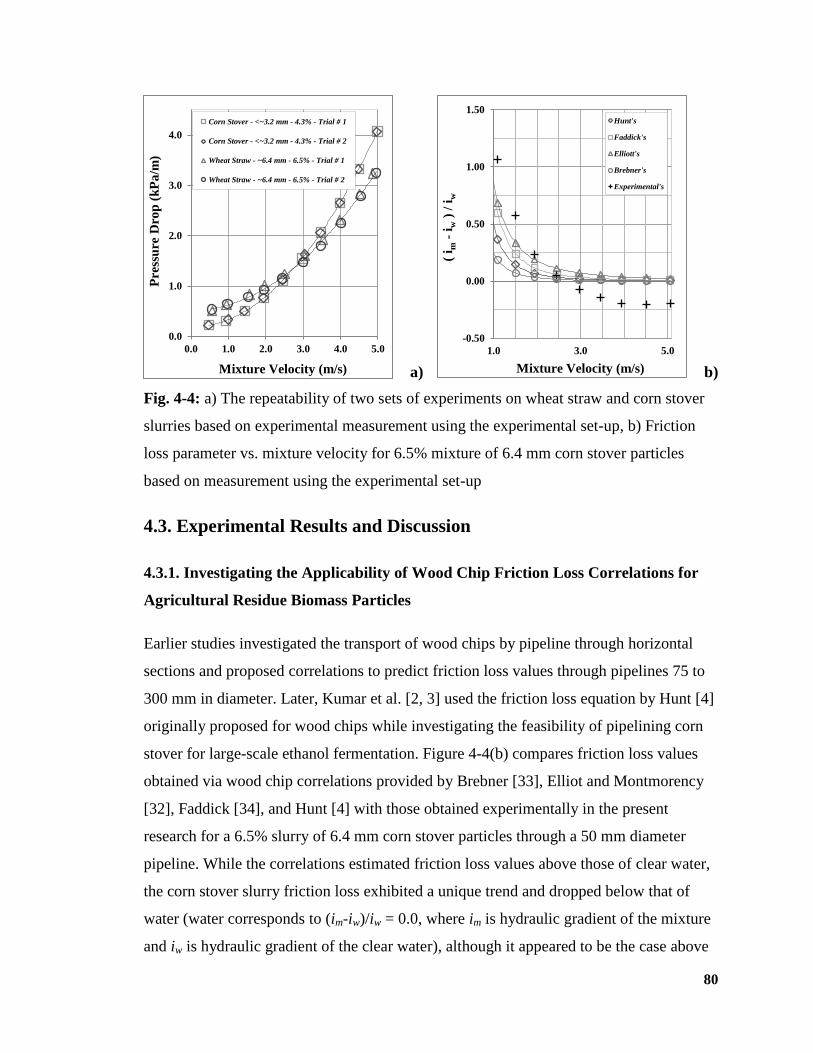
80
a) b)
Fig. 4-4: a) The repeatability of two sets of experiments on wheat straw and corn stover
slurries based on experimental measurement using the experimental set-up, b) Friction
loss parameter vs. mixture velocity for 6.5% mixture of 6.4 mm corn stover particles
based on measurement using the experimental set-up
4.3. Experimental Results and Discussion
4.3.1. Investigating the Applicability of Wood Chip Friction Loss Correlations for
Agricultural Residue Biomass Particles
Earlier studies investigated the transport of wood chips by pipeline through horizontal
sections and proposed correlations to predict friction loss values through pipelines 75 to
300 mm in diameter. Later, Kumar et al. [2, 3] used the friction loss equation by Hunt [4]
originally proposed for wood chips while investigating the feasibility of pipelining corn
stover for large-scale ethanol fermentation. Figure 4-4(b) compares friction loss values
obtained via wood chip correlations provided by Brebner [33], Elliot and Montmorency
[32], Faddick [34], and Hunt [4] with those obtained experimentally in the present
research for a 6.5% slurry of 6.4 mm corn stover particles through a 50 mm diameter
pipeline. While the correlations estimated friction loss values above those of clear water,
the corn stover slurry friction loss exhibited a unique trend and dropped below that of
water (water corresponds to (im-iw)/iw = 0.0, where im is hydraulic gradient of the mixture
and iw is hydraulic gradient of the clear water), although it appeared to be the case above
0.0
1.0
2.0
3.0
4.0
0.0 1.0 2.0 3.0 4.0 5.0
Pre
ssu
re D
rop
(k
Pa
/m)
Mixture Velocity (m/s)
Corn Stover - <~3.2 mm - 4.3% - Trial # 1
Corn Stover - <~3.2 mm - 4.3% - Trial # 2
Wheat Straw - ~6.4 mm - 6.5% - Trial # 1
Wheat Straw - ~6.4 mm - 6.5% - Trial # 2
-0.50
0.00
0.50
1.00
1.50
1.0 3.0 5.0
( i m
- i
w )
/ i
w
Mixture Velocity (m/s)
Hunt's
Faddick's
Elliott's
Brebner's
Experimental's

81
a specific velocity. Moreover, correlations studied here were found to be not capable of
predicting wood chips friction loss behaviour at velocities below 1.0 m/s. Thus, the
pressure drop correlations proposed for a wood chip slurry are not appropriate for
agricultural residue biomass slurries.
4.3.2. Fibre Suspension Flow Regimes
The distribution of particles over the cross section of a horizontal pipe is often described
in terms of flow regimes. In terms of flow features, slurries can be classified as either a
non-settling slurry (in which case the solid phase shows little or no tendency to settle
under conditions of no-flow and can often be treated as a single-phase system) or
classified as settling slurry. Durand and Condolios [23] used a different approach to
classify solid-liquid mixtures in horizontal pipes. This classification was later refined by
Newitt and Richardson [26] and others to show four flow regimes: (1) flow with a
stationary bed or flow with a moving bed and saltation (with or without suspension;
transferred by continuous or sporadic inter-granular contacts), (2) a heterogeneous
mixture with some particles present in the form of a bed and others supported by fluid
turbulence, (3) pseudo-homogeneous at very high flow rates where solids may approach
an even distribution, and (4) homogeneous mixtures with all the solids in suspension
(particles between 40 to 70 μm are transported by the fluid), a characteristic typical of
non-settling slurries [35].
Considering the minimum particle diameter (d50 = 1.9 mm, see Table 4-1), flow rates
range, and visual observations, the flow regime in the present experiment can be
classified as being a settling heterogeneous slurry through the entire range of particle
sizes and pumping velocities, where a gradient of solid mass contents exists in the
vertical plane. Therefore, the solid and liquid phases remain identifiable; there is no
increase in the viscosity of the liquid phase on account of its association with the solid
particles. This was experimentally observed here using viscometry wherein carrier liquids
of 19.2 mm, 6.4 mm, and 3.2 mm particle suspensions were filtered to contain particles <
50 μm only (as described on section 2.4). As an example, Fig. 4-5(a) represents the
viscosity of the filtered carrier liquid corresponding to 2.0 to 7.6% suspensions of 3.2 mm
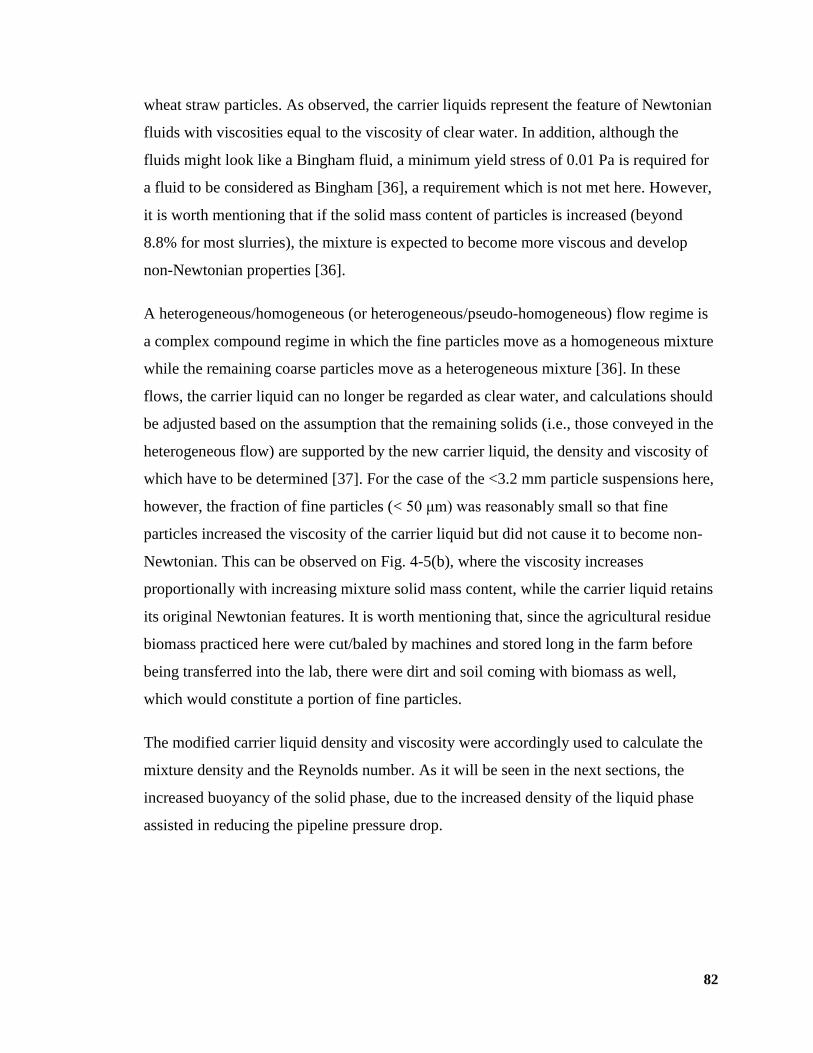
82
wheat straw particles. As observed, the carrier liquids represent the feature of Newtonian
fluids with viscosities equal to the viscosity of clear water. In addition, although the
fluids might look like a Bingham fluid, a minimum yield stress of 0.01 Pa is required for
a fluid to be considered as Bingham [36], a requirement which is not met here. However,
it is worth mentioning that if the solid mass content of particles is increased (beyond
8.8% for most slurries), the mixture is expected to become more viscous and develop
non-Newtonian properties [36].
A heterogeneous/homogeneous (or heterogeneous/pseudo-homogeneous) flow regime is
a complex compound regime in which the fine particles move as a homogeneous mixture
while the remaining coarse particles move as a heterogeneous mixture [36]. In these
flows, the carrier liquid can no longer be regarded as clear water, and calculations should
be adjusted based on the assumption that the remaining solids (i.e., those conveyed in the
heterogeneous flow) are supported by the new carrier liquid, the density and viscosity of
which have to be determined [37]. For the case of the <3.2 mm particle suspensions here,
however, the fraction of fine particles (< 50 μm) was reasonably small so that fine
particles increased the viscosity of the carrier liquid but did not cause it to become non-
Newtonian. This can be observed on Fig. 4-5(b), where the viscosity increases
proportionally with increasing mixture solid mass content, while the carrier liquid retains
its original Newtonian features. It is worth mentioning that, since the agricultural residue
biomass practiced here were cut/baled by machines and stored long in the farm before
being transferred into the lab, there were dirt and soil coming with biomass as well,
which would constitute a portion of fine particles.
The modified carrier liquid density and viscosity were accordingly used to calculate the
mixture density and the Reynolds number. As it will be seen in the next sections, the
increased buoyancy of the solid phase, due to the increased density of the liquid phase
assisted in reducing the pipeline pressure drop.
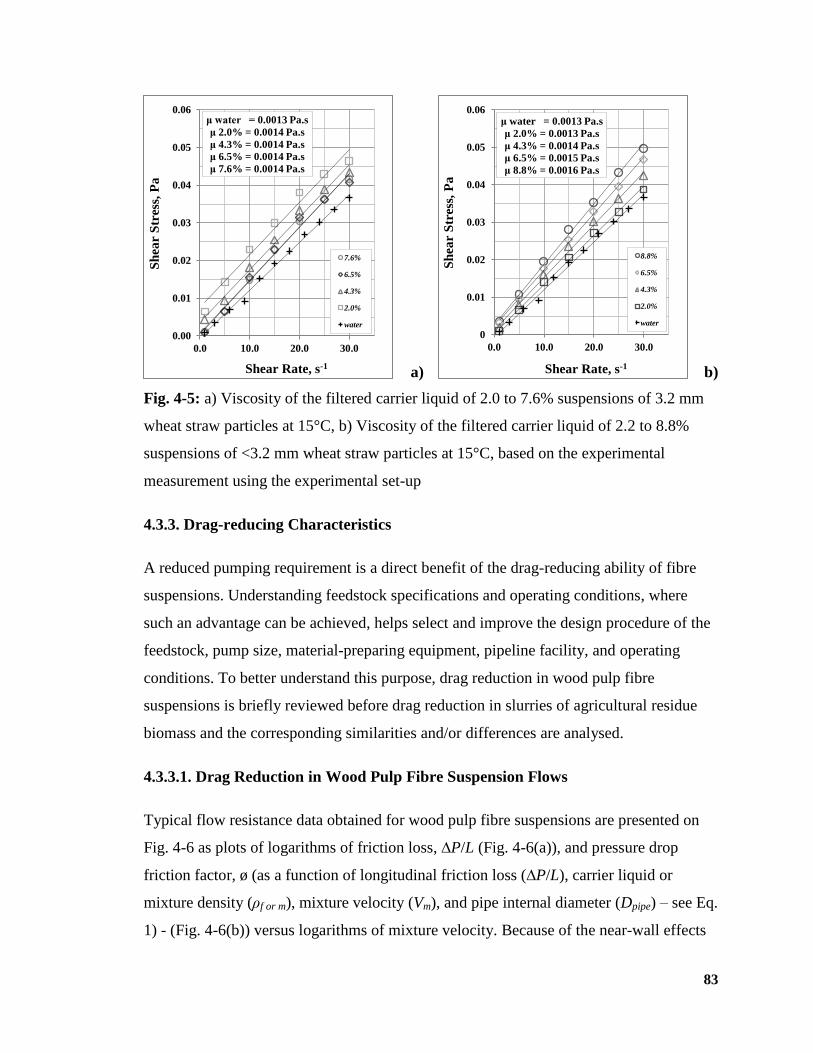
83
a) b)
Fig. 4-5: a) Viscosity of the filtered carrier liquid of 2.0 to 7.6% suspensions of 3.2 mm
wheat straw particles at 15°C, b) Viscosity of the filtered carrier liquid of 2.2 to 8.8%
suspensions of <3.2 mm wheat straw particles at 15°C, based on the experimental
measurement using the experimental set-up
4.3.3. Drag-reducing Characteristics
A reduced pumping requirement is a direct benefit of the drag-reducing ability of fibre
suspensions. Understanding feedstock specifications and operating conditions, where
such an advantage can be achieved, helps select and improve the design procedure of the
feedstock, pump size, material-preparing equipment, pipeline facility, and operating
conditions. To better understand this purpose, drag reduction in wood pulp fibre
suspensions is briefly reviewed before drag reduction in slurries of agricultural residue
biomass and the corresponding similarities and/or differences are analysed.
4.3.3.1. Drag Reduction in Wood Pulp Fibre Suspension Flows
Typical flow resistance data obtained for wood pulp fibre suspensions are presented on
Fig. 4-6 as plots of logarithms of friction loss, ∆P/L (Fig. 4-6(a)), and pressure drop
friction factor, ø (as a function of longitudinal friction loss (∆P/L), carrier liquid or
mixture density (ρf or m), mixture velocity (Vm), and pipe internal diameter (Dpipe) – see Eq.
1) - (Fig. 4-6(b)) versus logarithms of mixture velocity. Because of the near-wall effects
μ water = 0.0013 Pa.s
μ 2.0% = 0.0014 Pa.s
μ 4.3% = 0.0014 Pa.s
μ 6.5% = 0.0014 Pa.s
μ 7.6% = 0.0014 Pa.s
0.00
0.01
0.02
0.03
0.04
0.05
0.06
0.0 10.0 20.0 30.0
Sh
ear
Str
ess,
Pa
Shear Rate, s-1
7.6%
6.5%
4.3%
2.0%
water
μ water = 0.0013 Pa.s
μ 2.0% = 0.0013 Pa.s
μ 4.3% = 0.0014 Pa.s
μ 6.5% = 0.0015 Pa.s
μ 8.8% = 0.0016 Pa.s
0
0.01
0.02
0.03
0.04
0.05
0.06
0.0 10.0 20.0 30.0
Sh
ear
Str
ess,
Pa
Shear Rate, s-1
8.8%
6.5%
4.3%
2.0%
water
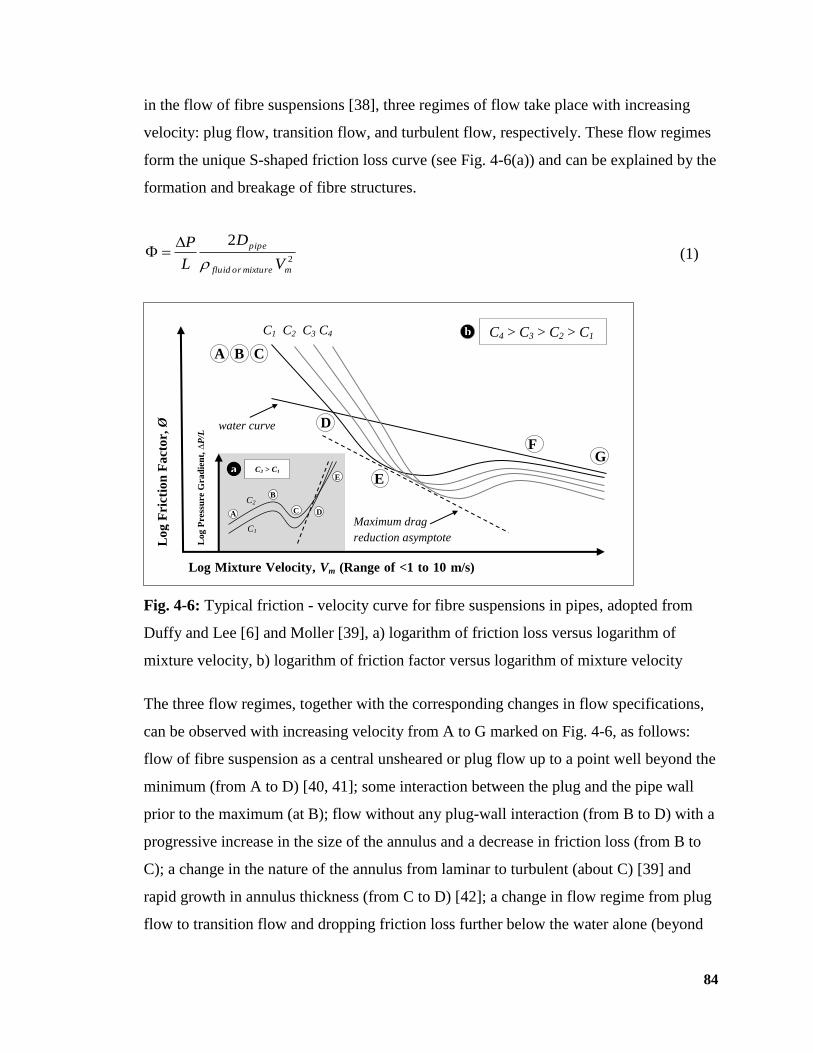
84
in the flow of fibre suspensions [38], three regimes of flow take place with increasing
velocity: plug flow, transition flow, and turbulent flow, respectively. These flow regimes
form the unique S-shaped friction loss curve (see Fig. 4-6(a)) and can be explained by the
formation and breakage of fibre structures.
2
2
mmixtureorfluid
pipe
V
D
L
P
(1)
Fig. 4-6: Typical friction - velocity curve for fibre suspensions in pipes, adopted from
Duffy and Lee [6] and Moller [39], a) logarithm of friction loss versus logarithm of
mixture velocity, b) logarithm of friction factor versus logarithm of mixture velocity
The three flow regimes, together with the corresponding changes in flow specifications,
can be observed with increasing velocity from A to G marked on Fig. 4-6, as follows:
flow of fibre suspension as a central unsheared or plug flow up to a point well beyond the
minimum (from A to D) [40, 41]; some interaction between the plug and the pipe wall
prior to the maximum (at B); flow without any plug-wall interaction (from B to D) with a
progressive increase in the size of the annulus and a decrease in friction loss (from B to
C); a change in the nature of the annulus from laminar to turbulent (about C) [39] and
rapid growth in annulus thickness (from C to D) [42]; a change in flow regime from plug
flow to transition flow and dropping friction loss further below the water alone (beyond
Lo
g F
rict
ion
Fa
cto
r, Ø
Log Mixture Velocity, Vm (Range of <1 to 10 m/s)
Lo
g P
ress
ure G
rad
ien
t, ∆
P/L
A
B
C
water curve
Maximum drag
reduction asymptote
b C4 > C3 > C2 > C1 C1 C2 C3 C4
G F
D
E B
C D
E
A
C1
C2
C2 > C1 a
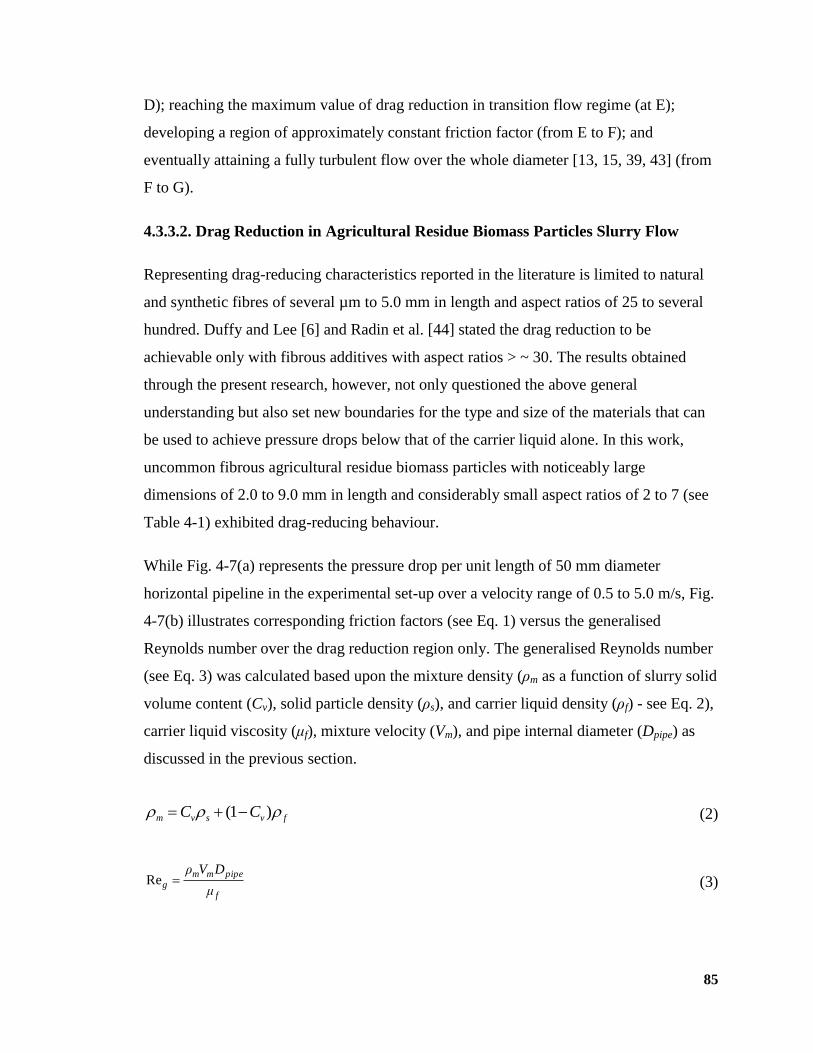
85
D); reaching the maximum value of drag reduction in transition flow regime (at E);
developing a region of approximately constant friction factor (from E to F); and
eventually attaining a fully turbulent flow over the whole diameter [13, 15, 39, 43] (from
F to G).
4.3.3.2. Drag Reduction in Agricultural Residue Biomass Particles Slurry Flow
Representing drag-reducing characteristics reported in the literature is limited to natural
and synthetic fibres of several µm to 5.0 mm in length and aspect ratios of 25 to several
hundred. Duffy and Lee [6] and Radin et al. [44] stated the drag reduction to be
achievable only with fibrous additives with aspect ratios > ~ 30. The results obtained
through the present research, however, not only questioned the above general
understanding but also set new boundaries for the type and size of the materials that can
be used to achieve pressure drops below that of the carrier liquid alone. In this work,
uncommon fibrous agricultural residue biomass particles with noticeably large
dimensions of 2.0 to 9.0 mm in length and considerably small aspect ratios of 2 to 7 (see
Table 4-1) exhibited drag-reducing behaviour.
While Fig. 4-7(a) represents the pressure drop per unit length of 50 mm diameter
horizontal pipeline in the experimental set-up over a velocity range of 0.5 to 5.0 m/s, Fig.
4-7(b) illustrates corresponding friction factors (see Eq. 1) versus the generalised
Reynolds number over the drag reduction region only. The generalised Reynolds number
(see Eq. 3) was calculated based upon the mixture density (ρm as a function of slurry solid
volume content (Cv), solid particle density (ρs), and carrier liquid density (ρf) - see Eq. 2),
carrier liquid viscosity (μf), mixture velocity (Vm), and pipe internal diameter (Dpipe) as
discussed in the previous section.
fvsvm CC )1( (2)
f
pipemmg
μ
DVρRe (3)
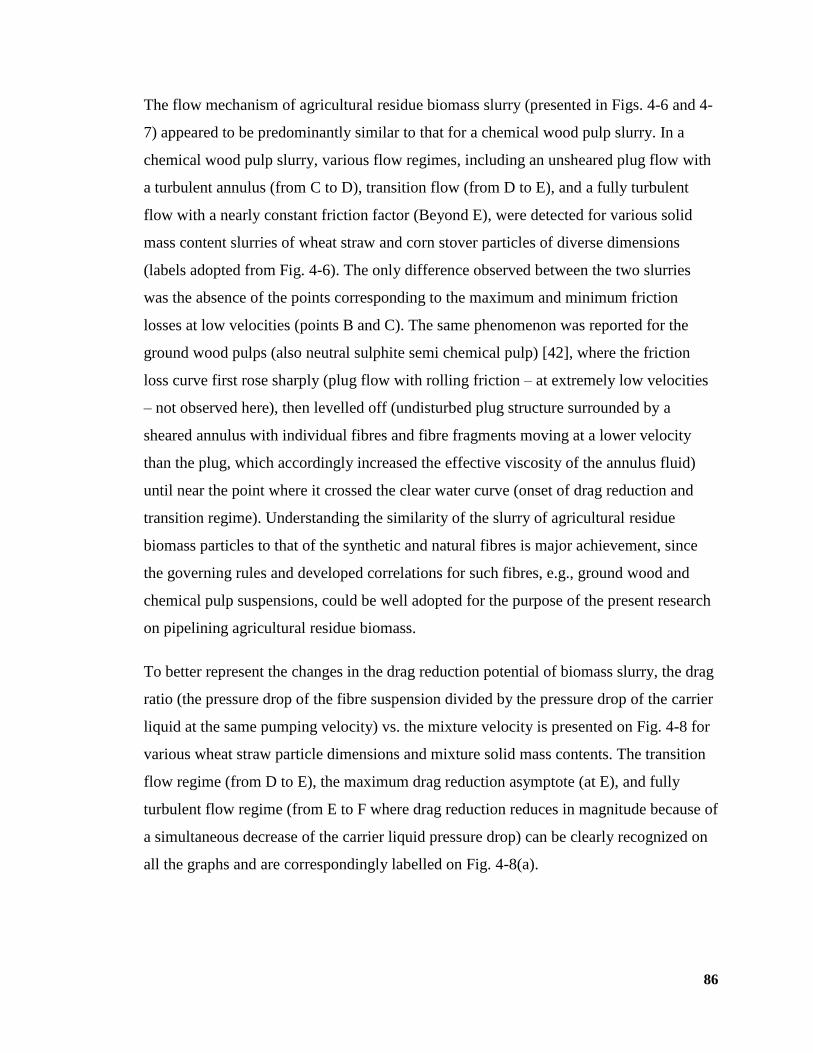
86
The flow mechanism of agricultural residue biomass slurry (presented in Figs. 4-6 and 4-
7) appeared to be predominantly similar to that for a chemical wood pulp slurry. In a
chemical wood pulp slurry, various flow regimes, including an unsheared plug flow with
a turbulent annulus (from C to D), transition flow (from D to E), and a fully turbulent
flow with a nearly constant friction factor (Beyond E), were detected for various solid
mass content slurries of wheat straw and corn stover particles of diverse dimensions
(labels adopted from Fig. 4-6). The only difference observed between the two slurries
was the absence of the points corresponding to the maximum and minimum friction
losses at low velocities (points B and C). The same phenomenon was reported for the
ground wood pulps (also neutral sulphite semi chemical pulp) [42], where the friction
loss curve first rose sharply (plug flow with rolling friction – at extremely low velocities
– not observed here), then levelled off (undisturbed plug structure surrounded by a
sheared annulus with individual fibres and fibre fragments moving at a lower velocity
than the plug, which accordingly increased the effective viscosity of the annulus fluid)
until near the point where it crossed the clear water curve (onset of drag reduction and
transition regime). Understanding the similarity of the slurry of agricultural residue
biomass particles to that of the synthetic and natural fibres is major achievement, since
the governing rules and developed correlations for such fibres, e.g., ground wood and
chemical pulp suspensions, could be well adopted for the purpose of the present research
on pipelining agricultural residue biomass.
To better represent the changes in the drag reduction potential of biomass slurry, the drag
ratio (the pressure drop of the fibre suspension divided by the pressure drop of the carrier
liquid at the same pumping velocity) vs. the mixture velocity is presented on Fig. 4-8 for
various wheat straw particle dimensions and mixture solid mass contents. The transition
flow regime (from D to E), the maximum drag reduction asymptote (at E), and fully
turbulent flow regime (from E to F where drag reduction reduces in magnitude because of
a simultaneous decrease of the carrier liquid pressure drop) can be clearly recognized on
all the graphs and are correspondingly labelled on Fig. 4-8(a).
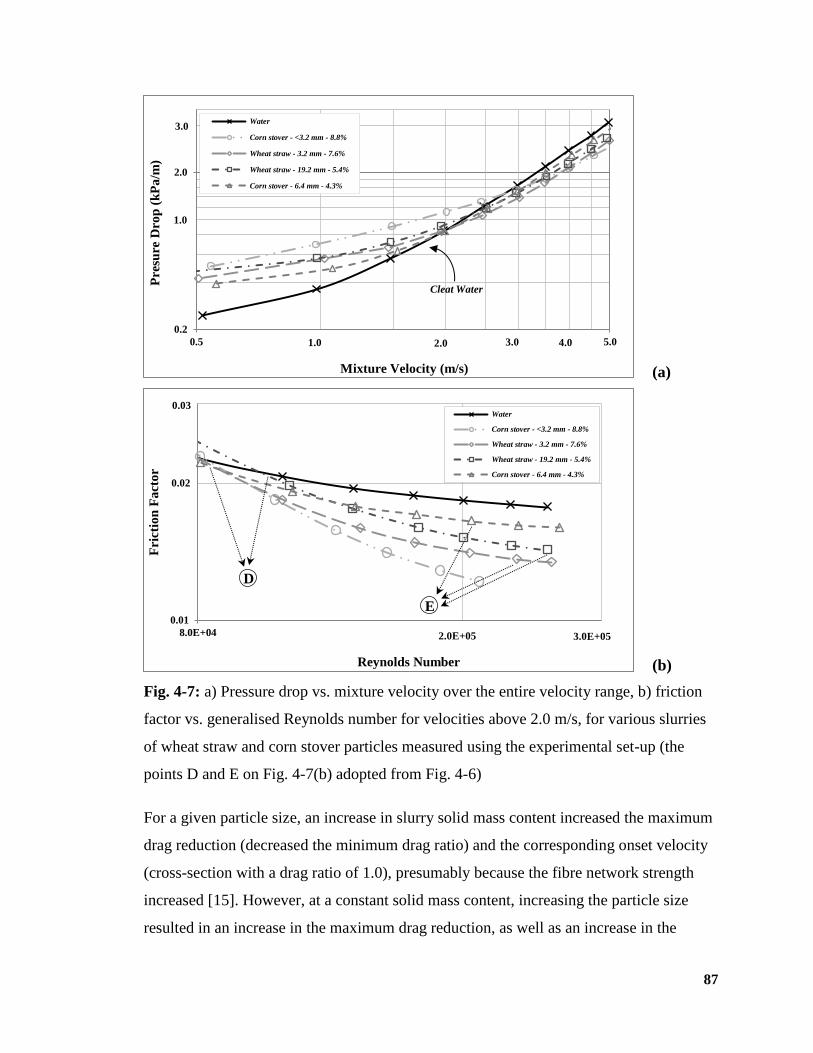
87
(a)
(b)
Fig. 4-7: a) Pressure drop vs. mixture velocity over the entire velocity range, b) friction
factor vs. generalised Reynolds number for velocities above 2.0 m/s, for various slurries
of wheat straw and corn stover particles measured using the experimental set-up (the
points D and E on Fig. 4-7(b) adopted from Fig. 4-6)
For a given particle size, an increase in slurry solid mass content increased the maximum
drag reduction (decreased the minimum drag ratio) and the corresponding onset velocity
(cross-section with a drag ratio of 1.0), presumably because the fibre network strength
increased [15]. However, at a constant solid mass content, increasing the particle size
resulted in an increase in the maximum drag reduction, as well as an increase in the
0.2
2.0
0.5 5.0
Pre
sure
Dro
p (
kP
a/m
)
Mixture Velocity (m/s)
Water
Corn stover - <3.2 mm - 8.8%
Wheat straw - 3.2 mm - 7.6%
Wheat straw - 19.2 mm - 5.4%
Corn stover - 6.4 mm - 4.3%
1.0
3.0
1.0 2.0 3.0 4.0
Cleat Water
0.01
8.0E+04
Fri
ctio
n F
act
or
Reynolds Number
Water
Corn stover - <3.2 mm - 8.8%
Wheat straw - 3.2 mm - 7.6%
Wheat straw - 19.2 mm - 5.4%
Corn stover - 6.4 mm - 4.3%
0.02
0.03
2.0E+05 3.0E+05
D
E
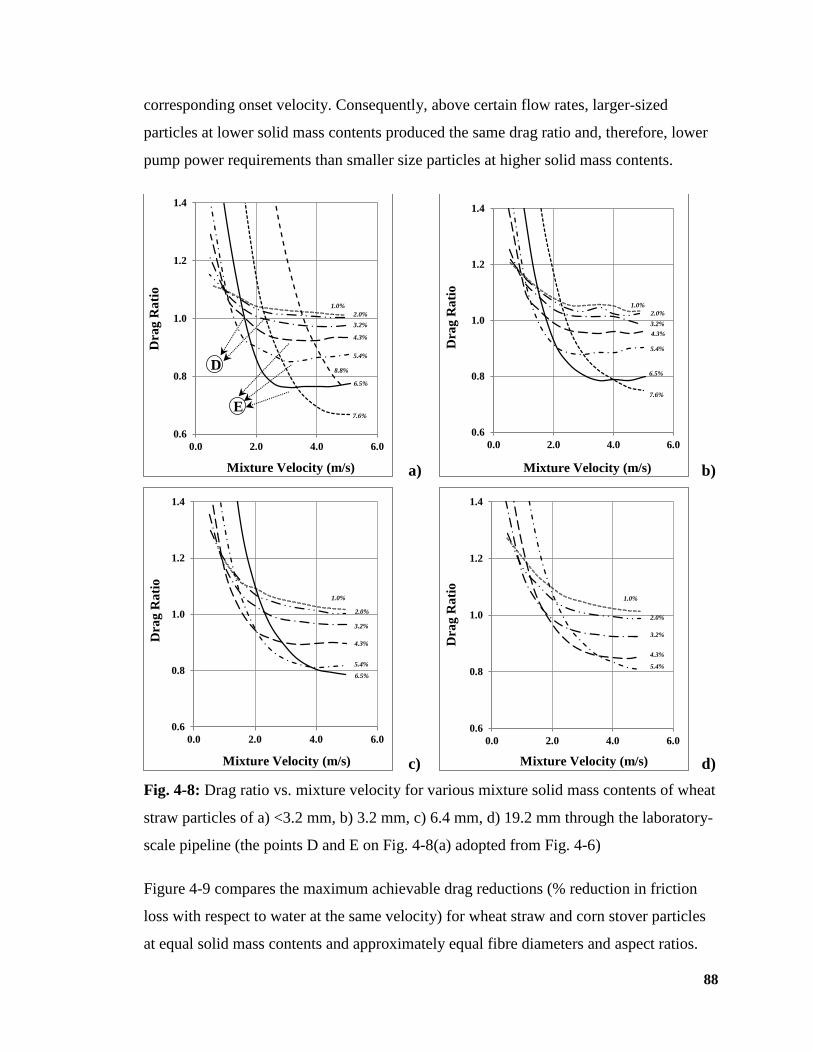
88
corresponding onset velocity. Consequently, above certain flow rates, larger-sized
particles at lower solid mass contents produced the same drag ratio and, therefore, lower
pump power requirements than smaller size particles at higher solid mass contents.
a) b)
c) d)
Fig. 4-8: Drag ratio vs. mixture velocity for various mixture solid mass contents of wheat
straw particles of a) <3.2 mm, b) 3.2 mm, c) 6.4 mm, d) 19.2 mm through the laboratory-
scale pipeline (the points D and E on Fig. 4-8(a) adopted from Fig. 4-6)
Figure 4-9 compares the maximum achievable drag reductions (% reduction in friction
loss with respect to water at the same velocity) for wheat straw and corn stover particles
at equal solid mass contents and approximately equal fibre diameters and aspect ratios.
0.6
0.8
1.0
1.2
1.4
0.0 2.0 4.0 6.0
Dra
g R
ati
o
Mixture Velocity (m/s)
6.5%
3.2%
2.0%
1.0%
8.8%
7.6%
4.3%
5.4%
D
E
0.6
0.8
1.0
1.2
1.4
0.0 2.0 4.0 6.0D
rag
Ra
tio
Mixture Velocity (m/s)
6.5%
3.2%
2.0%
1.0%
7.6%
4.3%
5.4%
0.6
0.8
1.0
1.2
1.4
0.0 2.0 4.0 6.0
Dra
g R
ati
o
Mixture Velocity (m/s)
6.5%
3.2%
2.0%
1.0%
4.3%
5.4%
0.6
0.8
1.0
1.2
1.4
0.0 2.0 4.0 6.0
Dra
g R
ati
o
Mixture Velocity (m/s)
3.2%
2.0%
1.0%
4.3%
5.4%
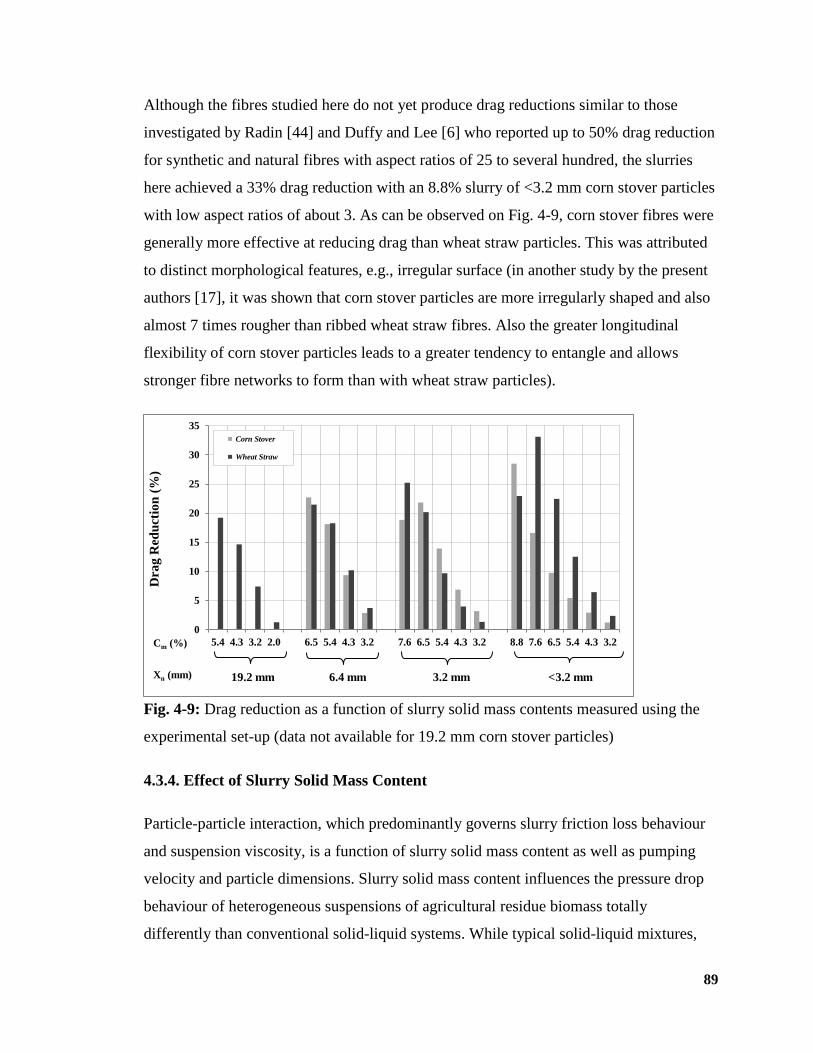
89
Although the fibres studied here do not yet produce drag reductions similar to those
investigated by Radin [44] and Duffy and Lee [6] who reported up to 50% drag reduction
for synthetic and natural fibres with aspect ratios of 25 to several hundred, the slurries
here achieved a 33% drag reduction with an 8.8% slurry of <3.2 mm corn stover particles
with low aspect ratios of about 3. As can be observed on Fig. 4-9, corn stover fibres were
generally more effective at reducing drag than wheat straw particles. This was attributed
to distinct morphological features, e.g., irregular surface (in another study by the present
authors [17], it was shown that corn stover particles are more irregularly shaped and also
almost 7 times rougher than ribbed wheat straw fibres. Also the greater longitudinal
flexibility of corn stover particles leads to a greater tendency to entangle and allows
stronger fibre networks to form than with wheat straw particles).
Fig. 4-9: Drag reduction as a function of slurry solid mass contents measured using the
experimental set-up (data not available for 19.2 mm corn stover particles)
4.3.4. Effect of Slurry Solid Mass Content
Particle-particle interaction, which predominantly governs slurry friction loss behaviour
and suspension viscosity, is a function of slurry solid mass content as well as pumping
velocity and particle dimensions. Slurry solid mass content influences the pressure drop
behaviour of heterogeneous suspensions of agricultural residue biomass totally
differently than conventional solid-liquid systems. While typical solid-liquid mixtures,
0
5
10
15
20
25
30
35
5.4 4.3 3.2 2.0 6.5 5.4 4.3 3.2 7.6 6.5 5.4 4.3 3.2 8.8 7.6 6.5 5.4 4.3 3.2
Dra
g R
edu
ctio
n (
%)
Corn Stover
Wheat Straw
19.2 mm 6.4 mm 3.2 mm <3.2 mm
Cm (%)
Xn (mm)
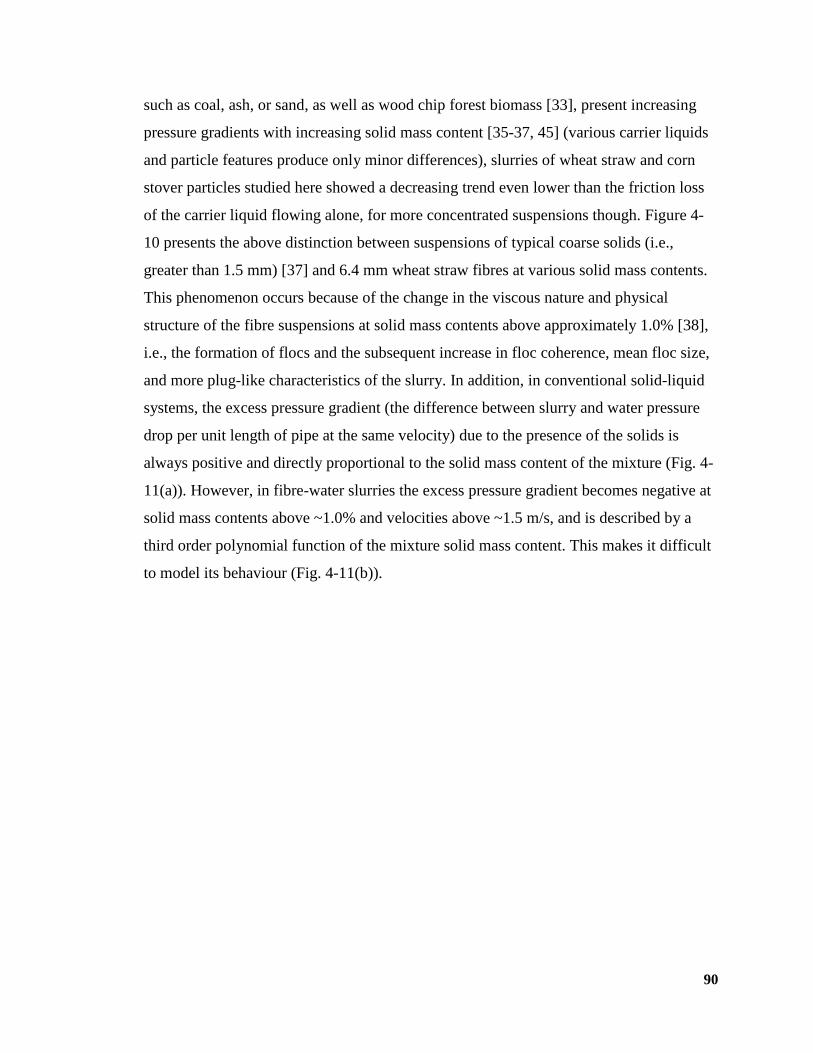
90
such as coal, ash, or sand, as well as wood chip forest biomass [33], present increasing
pressure gradients with increasing solid mass content [35-37, 45] (various carrier liquids
and particle features produce only minor differences), slurries of wheat straw and corn
stover particles studied here showed a decreasing trend even lower than the friction loss
of the carrier liquid flowing alone, for more concentrated suspensions though. Figure 4-
10 presents the above distinction between suspensions of typical coarse solids (i.e.,
greater than 1.5 mm) [37] and 6.4 mm wheat straw fibres at various solid mass contents.
This phenomenon occurs because of the change in the viscous nature and physical
structure of the fibre suspensions at solid mass contents above approximately 1.0% [38],
i.e., the formation of flocs and the subsequent increase in floc coherence, mean floc size,
and more plug-like characteristics of the slurry. In addition, in conventional solid-liquid
systems, the excess pressure gradient (the difference between slurry and water pressure
drop per unit length of pipe at the same velocity) due to the presence of the solids is
always positive and directly proportional to the solid mass content of the mixture (Fig. 4-
11(a)). However, in fibre-water slurries the excess pressure gradient becomes negative at
solid mass contents above ~1.0% and velocities above ~1.5 m/s, and is described by a
third order polynomial function of the mixture solid mass content. This makes it difficult
to model its behaviour (Fig. 4-11(b)).
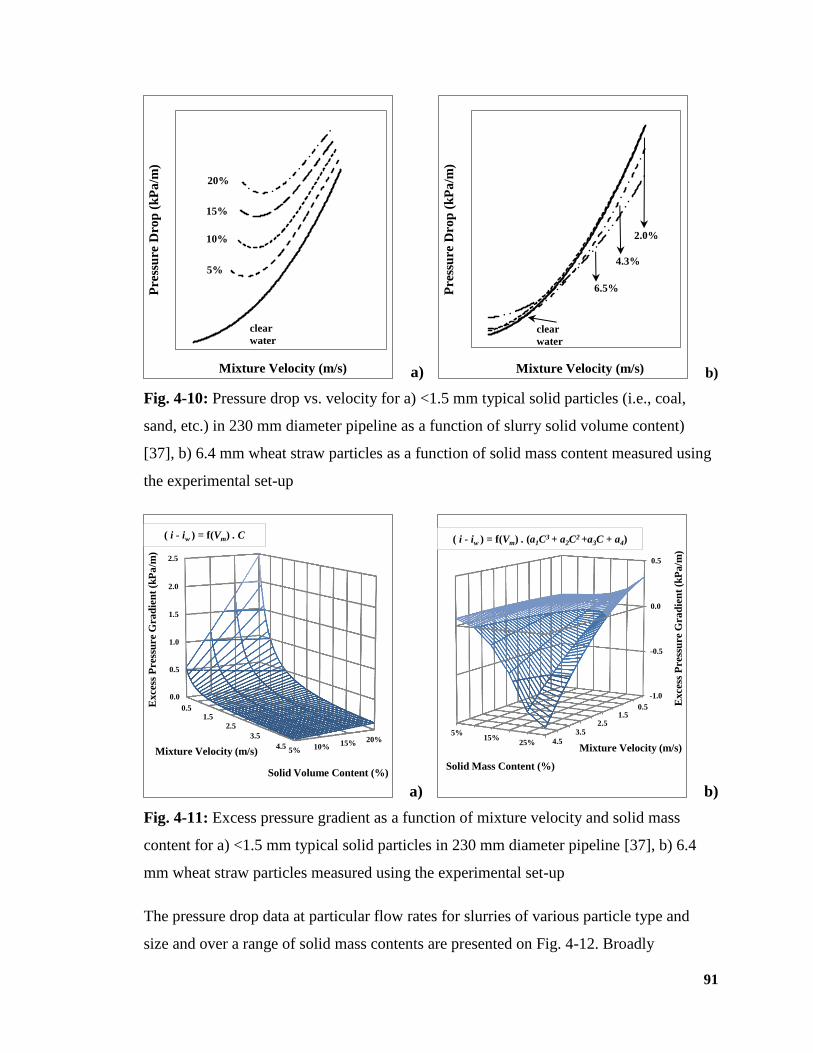
91
a) b)
Fig. 4-10: Pressure drop vs. velocity for a) <1.5 mm typical solid particles (i.e., coal,
sand, etc.) in 230 mm diameter pipeline as a function of slurry solid volume content)
[37], b) 6.4 mm wheat straw particles as a function of solid mass content measured using
the experimental set-up
a) b)
Fig. 4-11: Excess pressure gradient as a function of mixture velocity and solid mass
content for a) <1.5 mm typical solid particles in 230 mm diameter pipeline [37], b) 6.4
mm wheat straw particles measured using the experimental set-up
The pressure drop data at particular flow rates for slurries of various particle type and
size and over a range of solid mass contents are presented on Fig. 4-12. Broadly
Pre
ssu
re D
rop
(k
Pa
/m)
Mixture Velocity (m/s)
5%
10%
15%
20%
clear
water
Pre
ssu
re D
rop
(k
Pa
/m)
Mixture Velocity (m/s)
6.5%
4.3%
2.0%
clear
water
5% 10%15%
20%
0.0
0.5
1.0
1.5
2.0
2.5
0.51.5
2.5
3.5
4.5
Solid Volume Content (%)
Excess
Press
ure G
rad
ien
t (k
Pa
/m)
Mixture Velocity (m/s)
( i - iw ) = f(Vm) . C
5%15%
25%
-1.0
-0.5
0.0
0.5
0.51.5
2.53.5
4.5Mixture Velocity (m/s)
Excess
Press
ure G
rad
ien
t (k
Pa
/m)
Solid Mass Content (%)
( i - iw ) = f(Vm) . (a1C3 + a2C
2 +a3C + a4)
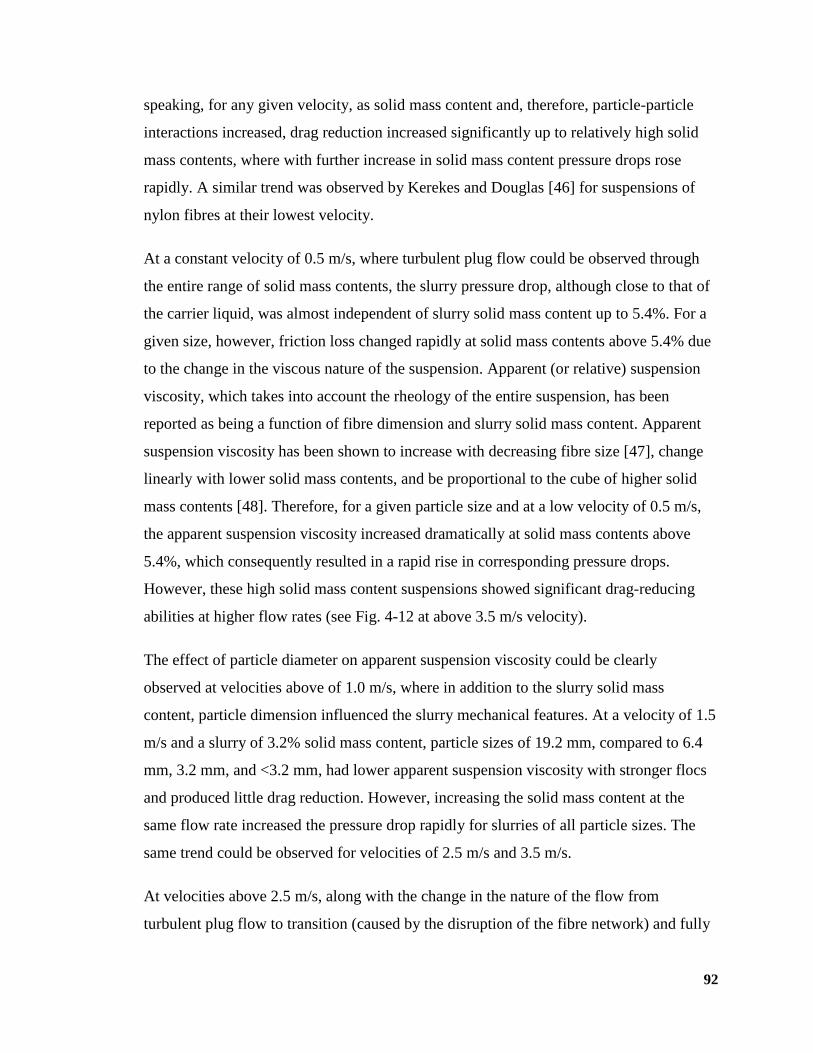
92
speaking, for any given velocity, as solid mass content and, therefore, particle-particle
interactions increased, drag reduction increased significantly up to relatively high solid
mass contents, where with further increase in solid mass content pressure drops rose
rapidly. A similar trend was observed by Kerekes and Douglas [46] for suspensions of
nylon fibres at their lowest velocity.
At a constant velocity of 0.5 m/s, where turbulent plug flow could be observed through
the entire range of solid mass contents, the slurry pressure drop, although close to that of
the carrier liquid, was almost independent of slurry solid mass content up to 5.4%. For a
given size, however, friction loss changed rapidly at solid mass contents above 5.4% due
to the change in the viscous nature of the suspension. Apparent (or relative) suspension
viscosity, which takes into account the rheology of the entire suspension, has been
reported as being a function of fibre dimension and slurry solid mass content. Apparent
suspension viscosity has been shown to increase with decreasing fibre size [47], change
linearly with lower solid mass contents, and be proportional to the cube of higher solid
mass contents [48]. Therefore, for a given particle size and at a low velocity of 0.5 m/s,
the apparent suspension viscosity increased dramatically at solid mass contents above
5.4%, which consequently resulted in a rapid rise in corresponding pressure drops.
However, these high solid mass content suspensions showed significant drag-reducing
abilities at higher flow rates (see Fig. 4-12 at above 3.5 m/s velocity).
The effect of particle diameter on apparent suspension viscosity could be clearly
observed at velocities above of 1.0 m/s, where in addition to the slurry solid mass
content, particle dimension influenced the slurry mechanical features. At a velocity of 1.5
m/s and a slurry of 3.2% solid mass content, particle sizes of 19.2 mm, compared to 6.4
mm, 3.2 mm, and <3.2 mm, had lower apparent suspension viscosity with stronger flocs
and produced little drag reduction. However, increasing the solid mass content at the
same flow rate increased the pressure drop rapidly for slurries of all particle sizes. The
same trend could be observed for velocities of 2.5 m/s and 3.5 m/s.
At velocities above 2.5 m/s, along with the change in the nature of the flow from
turbulent plug flow to transition (caused by the disruption of the fibre network) and fully
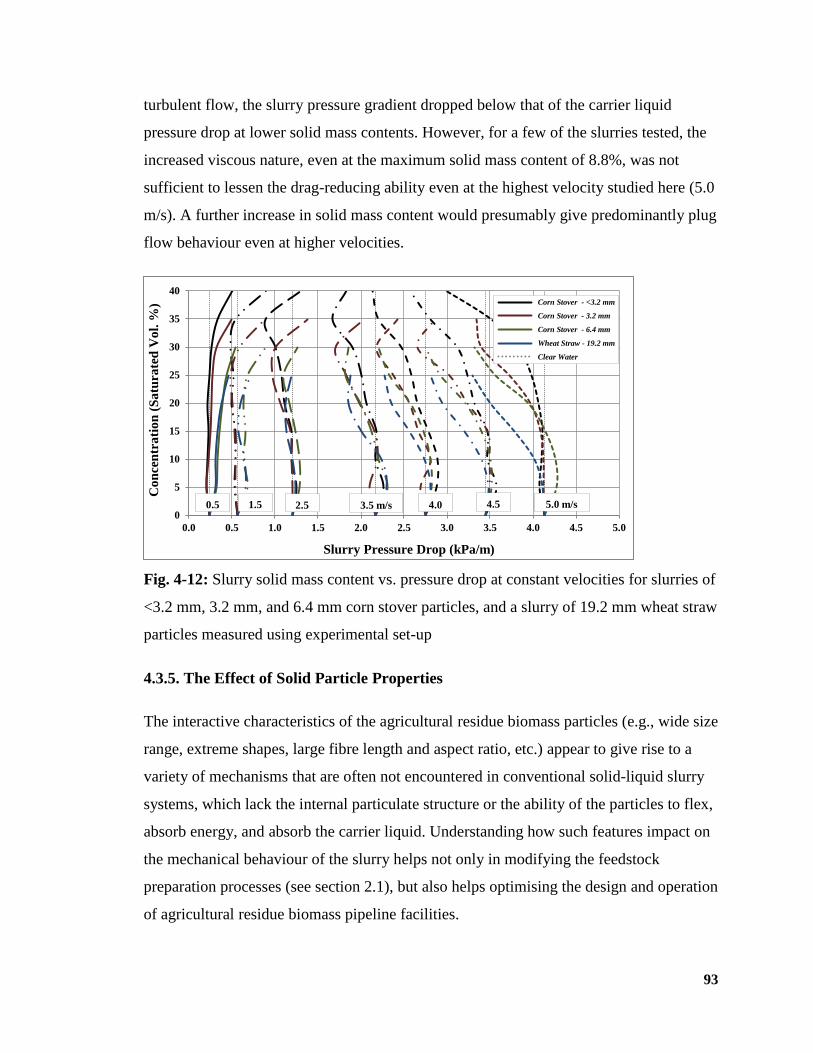
93
turbulent flow, the slurry pressure gradient dropped below that of the carrier liquid
pressure drop at lower solid mass contents. However, for a few of the slurries tested, the
increased viscous nature, even at the maximum solid mass content of 8.8%, was not
sufficient to lessen the drag-reducing ability even at the highest velocity studied here (5.0
m/s). A further increase in solid mass content would presumably give predominantly plug
flow behaviour even at higher velocities.
Fig. 4-12: Slurry solid mass content vs. pressure drop at constant velocities for slurries of
<3.2 mm, 3.2 mm, and 6.4 mm corn stover particles, and a slurry of 19.2 mm wheat straw
particles measured using experimental set-up
4.3.5. The Effect of Solid Particle Properties
The interactive characteristics of the agricultural residue biomass particles (e.g., wide size
range, extreme shapes, large fibre length and aspect ratio, etc.) appear to give rise to a
variety of mechanisms that are often not encountered in conventional solid-liquid slurry
systems, which lack the internal particulate structure or the ability of the particles to flex,
absorb energy, and absorb the carrier liquid. Understanding how such features impact on
the mechanical behaviour of the slurry helps not only in modifying the feedstock
preparation processes (see section 2.1), but also helps optimising the design and operation
of agricultural residue biomass pipeline facilities.
0
5
10
15
20
25
30
35
40
0.0 0.5 1.0 1.5 2.0 2.5 3.0 3.5 4.0 4.5 5.0
Co
nce
ntr
ati
on
(S
atu
rate
d V
ol.
%)
Slurry Pressure Drop (kPa/m)
Corn Stover - <3.2 mm
Corn Stover - 3.2 mm
Corn Stover - 6.4 mm
Wheat Straw - 19.2 mm
Clear Water
5.0 m/s 4.5 4.0 3.5 m/s 2.5 1.5 0.5
94
The impact of particle size distribution has been recognised in all types of slurry flows,
with broad size distributions producing lower friction losses at high flow rates [6, 49].
Figure 4-13(a) presents the size distributions (PSDs) of wheat straw and corn stover
particles obtained through the particle image processing course of the present research,
and Fig. 4-13(b) and 4-13(c) shows the change in pressure drop for the 5.4% slurries of
wheat straw and 6.5% slurries of corn stover particles, respectively. A similar conclusion
could be reached here, where 19.2 mm wheat straw particles, which come with a wide
size range of 18.4 mm, reduced the pressure drop more noticeably (at velocities above 2.5
m/s) compared to <3.2 mm particles with narrow size range of 5.2 mm, and also 8.59 mm
size range of the 6.4 mm corn stover particles at 5.0 m/s resulted in a pressure differential
that was 13% less than <3.2 mm fibres. However, for small differences in size ranges, the
state of the suspension (e.g., suspension viscosity) and morphological factors (e.g., fibre
shape) may dominate the effects of particle size distribution resulting in comparable
pressure drop gradients. It is noteworthy that it was not possible to transport a 3.2%
slurry of 19.2 mm corn stover particles along a 50 mm diameter pipeline, whereas
experiments at a 5.4% solid mass content could be successfully conducted with the same
size wheat straw particles. Since the PSD of 19.2 mm corn stover particles was not
noticeably narrower than for the 19.2 mm wheat straw fibres, the difference in the solid
mass content that could be transported without forming a blockage was probably due to
particle shape and the longitudinal flexibility of the corn stover particles.
As well as PSD, the effect of absolute particle dimension was investigated. While the
particles widths were of the same order of magnitude (see Table 4-1), the differences in
particle length could have influenced fluid mechanics of the fibre suspension by altering
the rheology and momentum transfer mechanisms; both of which will be discussed here
in detail. Broadly speaking, for the same flow rates and solid mass contents, the larger the
fibre length (more accurately, the greater the aspect ratio) the less the frictional pressure
drop and the more the potential to show drag-reducing behaviour (see Figs. 4-13(b) and
4-13(c)). Bobkowic and Gauvin [50] and Radin et al. [44] reported the same trend for
nylon and rayon fibres.
95
4.3.5.1. The Effects of Solid Particle Dimension on Slurry Rheology
As discussed earlier, while keeping the suspension solid volume content (
42gwglv XXnC ) and particle aspect ratio ( gwgl XX ) constant, increasing the fibre
length resulted in a decrease in suspension viscosity, which was caused not only by
hydrodynamic interactions but also by some attractive forces dependent on an average
inter-fibre distance, as follows:
2
1-
)gl
(nXav
h (4)
where hav is the average inter-fibre distance.
A low average fibre distance promotes adhesive forces and flocculation and results in an
increased suspension viscosity [47]. As can be observed on Fig. 4-13(b), at constant solid
mass content of 5.4%, the suspension of 19.2 mm wheat straw particles with Xgl = 8.42
mm and α = 6.28, compared to the suspension of <3.2 mm fibres with Xgl = 2.57 mm and
α = 3.47, had a tenfold lower fibre number fraction and consequently an approximately
double inter-fibre distance. This resulted in a decrease in the apparent suspension
viscosity and pressure drop. The same was true for corn stover particles on Fig. 4-13(c),
where 6.5% slurries of 6.4 mm corn stover fibres came with 1.5 times greater inter-fibre
distance compared to <3.2 mm particles and a reduced apparent suspension viscosity with
correspondingly reduced friction loss.
4.3.5.2. The Effect of Solid Particle Dimension on Slurry Flow Momentum Transfer
Mechanisms
According to Kerekes and Schell [51], the longer the fibre length, the larger the floc size.
However, the way that fibre length and subsequently fibre floc size influence pressure
drop behaviour depends on the suspension flow rate and corresponding momentum
transfer mechanisms. Immediately after the drag-reducing regime develops (point D on
Fig. 4-6 and 4-13(c)), fibre flocs can affect momentum transfer in two opposing ways:
lowering the small-scale momentum transfer by damping the turbulence of the
96
suspending phase and increasing the momentum transfer by providing solid links
between adjacent layers in suspension. The relative influence of these two effects on
momentum transfer depends on the average floc size. A large average floc size favours
the formation of solid links between adjacent layers. At the point of maximum drag
reduction (point E on Fig. 4-6 and 4-13(c)) in the transition flow regime, where a fibre
plug with the size approximately 20% of the pipe diameter still exists, the competing
mechanisms are at equilibrium. From this point forward, the effect of flocs in suppressing
radial turbulence dominates and the friction loss curve moves closer to the water curve
with increasing velocity [6, 15, 52, 53]. This can be seen on Fig. 4-13(c) for the curve of
<3.2 mm corn stover fibres and on Fig. 4-8(a) for below 7.6% slurries of <3.2 mm wheat
straw particles where drag ratio curves slope upward (the corresponding labels are
adopted from Fig. 4-6). For conditions corresponding to a low intensity of turbulence
(between D and E), the effect of large flocs near the pipe axis (central plug) in providing
solid links between adjacent fluid layers dominates. Under these conditions, increasing
the intensity of turbulence by increasing the flow rate decreases the average floc size in
the turbulent annulus. Consequently momentum transfer decreases, local mean velocity
gradients increase, and drag reduction continues to increase. This can be observed on Fig.
4-13(c) at velocities below ~3.5 m/s, where 6.4 mm corn stover particles present pressure
drops greater than 3.2 mm corn stover fibres at high velocities.
The momentum transfer concept introduced here could also be used to explain the
instability in velocity and pressure drop measurements in early stages of the experiment,
when it took 12 -14 h at a pumping velocity of 4.0 to 5.0 m/s before a stable mixture
condition was reached and pressure and velocity fluctuations were reduced to less than
1.0% per hour (see Fig. 4-13(d)). Radin et al. [44] observed a similar variation in pressure
and velocity with time in their experiments and allowed the suspensions of synthetic and
natural fibres to circulate for several hours to allow complete dispersion of solids. As it
was previously stated, the larger the fibre flocs, the more the formation of solid links
between adjacent layers for conditions corresponding to low intensity turbulence in the
drag-reducing regime (D to E on Fig. 4-6) and the greater the momentum transfer in the
slurry. In the present experiment, an increase in the bulk flow rate over a period of eight
hours was detected (see Fig. 4-13(d)), at the expense of an increase in local mean velocity
97
gradients and a decrease in momentum transfer, which indicates reduced formation of
solid links and decreasing floc sizes over time. Decreasing floc size could be a result of
physical breakdown or the degradation of feedstock particles caused by the mixer
impellers and centrifugal pump, as well as particle-particle interactions. Degradation
brought about the effective diameter of the particles (e.g., d50) not remaining constant
during transportation. The degradation effect was studied here with a 3.2% solid mass
content mixture of 19.2 mm wheat straw particles. It was observed that the initial particle
d50 of 8.04 mm was reduced by ~29% to 5.74 mm in 8 h. Degradation was even observed
to take place for small particles of <3.2 mm. Similarly, Kato and Mizunuma [54] reported
that asbestos fibres <1 µm diameter and a few mm long degraded by about 10% during
three hours of circulation. Elliot [55] also reported that wood chips < 12.7 mm degraded
by 39% as compared to 10% in control chips from the original batch after four hours
circulation. According to Elliot [55], most of this reduction in size is caused by the pump,
a small amount by the mixer, and none by passage through the pipe alone. A lower
reduction in size would be expected from improved equipment design at normal
commercial practice than was experienced in this laboratory-scale facility.
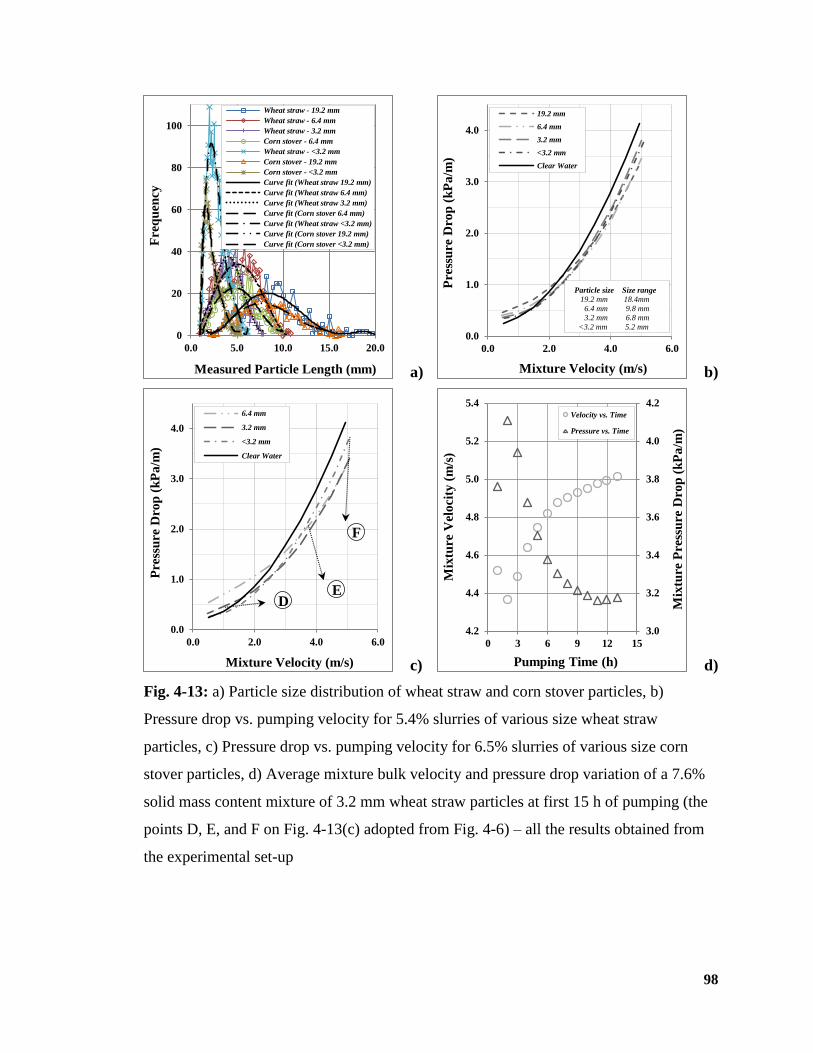
98
a) b)
c) d)
Fig. 4-13: a) Particle size distribution of wheat straw and corn stover particles, b)
Pressure drop vs. pumping velocity for 5.4% slurries of various size wheat straw
particles, c) Pressure drop vs. pumping velocity for 6.5% slurries of various size corn
stover particles, d) Average mixture bulk velocity and pressure drop variation of a 7.6%
solid mass content mixture of 3.2 mm wheat straw particles at first 15 h of pumping (the
points D, E, and F on Fig. 4-13(c) adopted from Fig. 4-6) – all the results obtained from
the experimental set-up
0
20
40
60
80
100
0.0 5.0 10.0 15.0 20.0
Fre
qu
ency
Measured Particle Length (mm)
Wheat straw - 19.2 mm
Wheat straw - 6.4 mm
Wheat straw - 3.2 mm
Corn stover - 6.4 mm
Wheat straw - <3.2 mm
Corn stover - 19.2 mm
Corn stover - <3.2 mm
Curve fit (Wheat straw 19.2 mm)
Curve fit (Wheat straw 6.4 mm)
Curve fit (Wheat straw 3.2 mm)
Curve fit (Corn stover 6.4 mm)
Curve fit (Wheat straw <3.2 mm)
Curve fit (Corn stover 19.2 mm)
Curve fit (Corn stover <3.2 mm)
0.0
1.0
2.0
3.0
4.0
0.0 2.0 4.0 6.0
Pre
ssu
re D
rop
(k
Pa
/m)
Mixture Velocity (m/s)
19.2 mm
6.4 mm
3.2 mm
<3.2 mm
Clear Water
Particle size Size range
19.2 mm 18.4mm
6.4 mm 9.8 mm
3.2 mm 6.8 mm
<3.2 mm 5.2 mm
0.0
1.0
2.0
3.0
4.0
0.0 2.0 4.0 6.0
Pre
ssu
re D
rop
(k
Pa
/m)
Mixture Velocity (m/s)
6.4 mm
3.2 mm
<3.2 mm
Clear Water
D E
F
3.0
3.2
3.4
3.6
3.8
4.0
4.2
4.2
4.4
4.6
4.8
5.0
5.2
5.4
0 3 6 9 12 15
Mix
ture
Pre
ssu
re D
rop
(k
Pa
/m)
Mix
ture
Vel
oci
ty (
m/s
)
Pumping Time (h)
Velocity vs. Time
Pressure vs. Time
99
4.3.5.3. The Effects of Solid Particle Dimension on Drag-reduction Onset Velocity
Concerning the effects of fibre length on the onset velocity of drag reduction, it can be
concluded that (see Fig. 4-13) for certain particle types and suspension solid mass
contents, increasing the particle length increases the onset velocity. This increase can be
attributed to an increase in floc size, more formation of solid links, and a subsequent
increase in momentum transfer, which results in a decrease in drag-reducing ability. Also,
it is thought that increasing fibre length not only increases floc size but also floc strength
and plug-like characteristics, which requires a higher intensity of turbulence to cause
disruption.
4.4. Conclusions
Pipeline hydro-transportation of wheat straw and corn stover agricultural residue biomass
was experimentally studied. While no similarity was observed between friction loss
behaviour of the slurries of wood chips and corn stover particles, the slurry of fibrous
agricultural residue biomass particles exhibited drag-reduction characteristics at high
flow rates. A maximum drag reduction of 33% could be achieved with an 8.8% slurry of
<3.2 mm corn stover particles at a slurry flow rate of 5.0 m/s. In addition, the dependency
of the rheological behaviour of the slurry and the longitudinal pressure gradient on
feedstock type, particle dimension, slurry solid mass content, and slurry flow rate were
experimentally investigated. Solid mass content was found to impact the slurry friction
loss behaviour differently compared to conventional solid-liquid systems, and to decrease
pressure gradient with increasing solid mass content. The impact of particle size
distribution was recognised with broad size distributions producing lower friction losses
at high flow rates where 19.2 mm wheat straw particles, which come with a wide size
range of 18.4 mm, reduced the pressure drop more noticeably at velocities above 2.5 m/s
compared to <3.2 mm particles with a narrow size range of 5.2 mm. Friction loss
variations were also well explained based on two different momentum transfer
mechanisms, where an increase in flow rate and a corresponding increase in the intensity
of turbulence, and a decrease in average floc size in the turbulent annulus with a decrease
in momentum transfer were both found to increase drag reduction in the transition flow
100
regime before reaching the maximum drag-reduction asymptote. Also, it was concluded
that for certain particle types and slurry solid mass content, increasing particle length
increases the drag-reduction onset velocity. The results presented here could be help
optimise the design and operation of agricultural residue biomass hydro-transport
pipelines.
101
Nomenclature
Exp exponential function
PSD particle size distribution
MC moisture content, % (wet basis)
S distance along the straight pipe section downstream U-bend section, m
Sx standard deviation of the measurements, corresponding unit
Px precision uncertainty (
√ ), corresponding unit
Bx bias uncertainty, corresponding unit
Ux total uncertainty ( √∑
), corresponding unit
Ni number of particles of a particular distinct dimension, dimensionless
Xn nominal length of particle, mm
Xi distinct length of particle, mm
Xgl geometric mean length, mm
Xgw geometric mean width, mm
dXX corresponding particle lengths in mm at respective XX % cumulative number fraction of particles
Vm solid-liquid mixture (slurry) velocity, m/s
Vf carrier liquid velocity, m/s
Dpipe pipe internal diameter, m
Rpipe pipe internal radius, m
RC radius of curvature of U-bend section, m
Cv slurry solid volume content, %
Cm slurry solid mass content, %
Ref carrier fluid Reynolds number (
), dimensionless
Reg generalised Reynolds number (
),dimensionless
∆P/L longitudinal pressure gradient in the pipe, kPa/m
k ratio of particle dimensions to diameter of pipe
n fibre number fraction
f friction factor
g gravitational acceleration, m/s2
x0 size of the largest particle in the particle size distribution
h pumping time, h
hav average inter-fibre distance, µm
102
Nomenclature – Cont’d
im hydraulic gradient of mixture, m[water]/m[pipe]
iw hydraulic gradient of clear water, m[water]/m[pipe]
σgl geometric length standard deviation, mm
σgw geometric width standard deviation, mm
v kinematic viscosity of carrier liquid, m2/s
μf dynamic viscosity of carrier liquid, Pa.s
ρm density of mixture, kg/m3
ρf density of carrier liquid, kg/m3
number of measurements taken
t-distribution with confidence and
103
References
[1] Kumar, A., Cameron, J.B., Flynn, P.C. Pipeline transport of biomass. Applied
Biochemistry and Biotechnology, 2004; 113: 27-39.
[2] Kumar, A., Cameron, J.B., Flynn, P.C. Large-scale ethanol fermentation through
pipeline delivery of biomass. Applied Biochemistry and Biotechnology, 2005 (a); 121:
47-58.
[3] Kumar, A., Cameron, J.B., Flynn, P.C. Pipeline transport and simultaneous
saccharification of corn stover. Bioresource Technology, 2005 (b); 96: 819-29.
[4] Hunt, W.A. Friction factors for mixtures of wood chips and water flowing in
pipelines. 4th International Conference on the Hydraulic Transport of Solids in Pipes.
Alberta, Canada; 1976, p. 1-18.
[5] Wasp, E.J., Aude, T.C., Thompson, T.L., Bailey, C.D. Economics of chip
pipelining. Tappi, 1967; 50: 313-18.
[6] Duffy, G.G., Lee, P.F.W. Drag reduction in turbulent flow of wood pulp
suspensions. Appita, 1978; 31: 280-86.
[7] Luk, J. Pipeline transport of wheat straw slurry [dissertation]. University of
Alberta; 2010.
[8] Institution, S.-T. SCAN CM 40:88. Scandinavian Pulp, Paper and Board Testing
Committee.
[9] TAPPI. Technical Association of the Pulp and Paper Industry (TAPPI),. TAPPI
usefull methods NO21; 2010.
[10] ASABE. Moisture measurement for forages. Standard S3582 American Society of
Agricultural and Biological Engineers, St. Joseph, MI, US; 2008.
[11] ASTM. Standard test method for density, relative density, and absorption of
coarse aggregate. ASTM, Designation C127; 2012.
[12] McKendry, P. Energy production from biomass (part 1): overview of biomass.
Bioresource Technology, 2002; 83: 37-46.
[13] Duffy, G.G. The optimum design of pipelines for transporting wood pulp fiber
suspensions. Appita Journal, 1989; 42: 358-61.

104
[14] Duffy, G.G., Kazi, S.N., Chen, X.D. Monitoring pulp fibre quality by frictional
pressure drop measurement. Proceeding of 56th Appita Annual Conference, 2002: 119-
26.
[15] Paul, T., Duffy, G., Chen, D. New insights into the flow of pulp suspensions.
Tappi Solutions, 2001; 1.
[16] Rasband, W.S. http://rsb.info.nih.gov/ij/index.html, U.S. National Institutes of
Health, Accessed September 2011. 2008.
[17] Vaezi, M., Pandey, V., Kumar, A., Bhattacharyya, S. Lignocellulosic biomass
particle shape and size distribution analysis using digital image processing for pipeline
hydro-transportation. Biosystems Engineering, 2013; 114: 97-112.
[18] ASABE. Method of determining and expressing particle size of chopped forage
materials by screening. Standard ANSI/ASAE S4241. St. Joseph, MI, US: American
Society of Agricultural and Biological Engineers, St. Joseph, MI, US; 2007.
[19] Anwer, M., So, R.M.C., Lai, Y.G. Perturbation by and recovery from bend
curvature of a fully-developed turbulent pipe-flow. Physics of Fluids, 1989; 1: 1387-97.
[20] Hellstrom, L.H.O., Smits, A.J. Turbulent pipe flow through a 90 degree bend.
Fluid Mechanics Meeting. 1000 Islands, Ontario, Canada; 2012.
[21] Rowe, M. Measurements and computations of flow in pipe bends. Journal of
Fluid Mechanics, 1970; 43: 771-83.
[22] Gillies, R.G., Shook, C.A. A deposition velocity correlation for water slurries.
Canadian Journal of Chemical Engineering, 1991; 69: 1225-28.
[23] Durand, R., Condolios, E. Experimental investigation of the transport of solids in
pipes France Hydrolic Society Conference. Paris; 1952, p. 29-55.
[24] Fangary, Y.S., Ghani, A.S.A., ElHaggar, S.M., Williams, R.A. The effect of fine
particles on slurry transport processes. Minerals Engineering, 1997; 10: 427-39.
[25] Weir. Slurry pump handbook. Fifth ed; 2009.
[26] Newitt, D.M., Richardson, J.F. Hydraulic Conveying of Solids. Nature, 1955;
175: 800-01.
[27] Colebrook, C.F. Turbulent flow in pipes, with particular reference to the transition
region between the smooth and rough pipe laws. Journal of the Institution of Civil
Engineers, 1939; 11: 133-56.
105
[28] Churchill, S.W. Friction factor equation spans all fluid regimes. Chemical
Engineering, 1977; 84: 91-92.
[29] Moody, L.F. An approximate formula for pipe friction factors. Transactions of the
ASME, 1947; 69: 1005-06.
[30] Wood, D.J. An explicit friction factor relationship. Civil Engineering, 1966; 36:
60-61.
[31] Kazi, S.N., Duffy, G.G., Chen, X.D. Heat transfer in the drag reducing regime of
wood pulp fibre suspensions. Chemical Engineering Journal, 1999; 73: 247-53.
[32] Elliott, D.R., Montmorency, W.H. The transportation of pulpwood chips in
pipelines,. Pulp and Paper Research Institute of Canada (PPRIC) Technical Report; 1963.
[33] Brebner, A. On pumping of wood chips through 4-Inch Aluminum pipeline.
Canadian Journal of Chemical Engineering, 1964; 42: 139-42.
[34] Faddick, R.R. Head loss studies of transport of woodchips in pielines.
[dissertation]. Queen's University; 1963.
[35] Brown, N.P., Heywood, N.I. Surry handling - Design of solid liquid systems. New
York: Elsevier; 1991.
[36] Abulnaga, B.E. Slurry systems handbook. New York: McGraw-Hill; 2002.
[37] Bain, A.G., Bonnington, S.T. The hydraulic transport of solids by pipeline. 1st ed.
Oxford ; New York: Pergamon Press; 1970.
[38] Fock, H., Claesson, J., Rasmuson, A., Wikstrom, T. Near wall effects in the plug
flow of pulp suspensions. Canadian Journal of Chemical Engineering, 2011; 89: 1207-16.
[39] Moller, K. Correlation of pipe friction data for paper pulp suspensions. Industrial
& Engineering Chemistry Process Design and Development, 1976; 15: 16-19.
[40] Meyer, H. An analytical treatment of the laminar flow of annulus forming fibrous
suspensions in vertical pipes. Tappi, 1964; 47: 78-84.
[41] Moller, K., Duffy, G.G., A., T. Laminar plug flow regime of paper pulp
suspensions in pipes. Svensk Papperstidning-Nordisk Cellulosa, 1971; 74: 829-34.
[42] Duffy, G.G., Titchener, A.L., Lee, P.F.W., Moller, K. The mechanism of flow of
pulp suspensions in pipes. Appita, 1976; 29: 363-70.
[43] Duffy, G.G., Abdullah, L. Fibre suspension flow in small diameter pipes. Appita
Journal, 2003; 56: 290-95.
106
[44] Radin, I., Zakin, J.L., Patterson, G.K. Drag reduction in solid-fluid systems. Aiche
Journal, 1975; 21: 358-71.
[45] Shook, C.A., Gillies, R.G., Sanders, R.S. Pipeline hydrotransport with
applications in the oil sand industry. Saskatoon, SK: SRC Publicatin; 2002.
[46] Kerekes, R.J.E., Douglas, W.J.M. Viscosity properties of suspensions at limiting
conditions for turbulent drag reduction. Canadian Journal of Chemical Engineering,
1972; 50: 228-31.
[47] Djalili-Moghaddam, M., Toll, S. Fibre suspension rheology: effect of
concentration, aspect ratio and fibre size. Rheologica Acta, 2006; 45: 315-20.
[48] Powell, R.L., Morrison, T.G., Milliken, W.J. Apparent viscosity of suspensions of
rods using falling ball rheometry. Physics of Fluids, 2001; 13: 588-93.
[49] Schaan, J., Sumner, R.J., Gillies, R.G., Shook, C.A. The effect of particle shape
on pipeline friction for Newtonian slurries of fine particles. Canadian Journal of
Chemical Engineering, 2000; 78: 717-25.
[50] Bobkowic, A., Gauvin, W.H. Turbulent flow characteristics of model fibre
suspensions. Canadian Journal of Chemical Engineering, 1965; 43: 87-91.
[51] Kerekes, R.J., Schell, C.J. Effects of fiber length and coarseness on pulp
flocculation. Tappi Journal, 1995; 78: 133-39.
[52] Lee, P.F.W., Duffy, G.G. Analysis of drag reducing regime of pulp suspension
flow. Tappi, 1976 (a); 59: 119-22.
[53] Lee, P.F.W., Duffy, G.G. Velocity profiles in drag reducing regime of pulp
suspension flow. Appita, 1976 (b); 30: 219-26.
[54] Kato, H., Mizunuma, H. Frictional resistance in fiber suspensions (part 1): pipe-
flow. Bulletin of the Jsme-Japan Society of Mechanical Engineers, 1983; 26: 231-38.
[55] Elliott, D.R. The transportation of pulpwood chips in pipelines,. Pulp and Paper
Magazine of Canada, 1960; 61: 170-75.
107
CHAPTER 5
The Flow of Wheat Straw Suspensions in an Open-impeller
Centrifugal Pump1
5.1. Introduction
Following a series of techno-economic analyses of pipeline hydro-transport of wood
chips and corn stover biomass materials [1], a lab-scale closed-circuit pipeline facility
was designed and fabricated. Slurries of agricultural residue biomass particles (wheat
straw and corn stover) were first prepared over a wide range of particle sizes and dry
matter solid mass contents. The slurry was then pumped through the closed-circuit
pipeline using a centrifugal slurry pump to investigate the feasibility of biomass pipeline
hydro-transport and measure the mechanical parameters of slurry flow, e.g., friction loss
and pump performance characteristics.
The performance of centrifugal slurry pumps has been the subject of several studies.
Conventional Newtonian and non-Newtonian solid-liquid mixtures have been used to
investigate the effects of solid particles’ specifications (i.e., size, specific gravity (density
of particle relative to density of water), drag coefficient), slurry specifications (i.e.,
rheological property, solid mass content), and pump features (i.e., impeller size and
operating conditions) on the power consumed, the head produced, and the efficiency
achieved by the centrifugal slurry pump [2-6]. In general, lower head and efficiency were
reported for the pumps handling slurries of medium- and coarse-size particles in
comparison to the pumps handling pure water only, which has been attributed to the
difference in the velocity of liquid and solids leaving the impeller [7], as well as to the
additional friction loss in the flow passages due to suspended solids [8]. Gandhi [2]
studied the performance characteristics of a couple of small and large centrifugal slurry
pumps handling slurries of fly ash, bed ash, and zinc tailings, where a decrease in head
and efficiency of the pump was observed with increase in solid mass content, particle
1 Vaezi, M., Kumar, A., Biomass and Bioenergy, 2014; 69: 106-123
108
size, and slurry viscosity. Using 19 various basic pump designs, Horo [5, 8]
experimentally investigated pumping of groundwood pulp (natural fibre used for pulp
and paper production) through centrifugal pump and studied the effect of fibres on
suction and pumping capacity, and the effect of air on the pump operation. They reported
that the same, or higher than, the head height produced with pure water could be achieved
with groundwood pulp at solid volume contents up to 7.0% provided a centrifugal pump
specifically designed for pumping pulp was used.
Several attempts have been made to correlate the experimental data with solid particle
properties, solid mass content, and pump specifications [9-14]. These correlations are
dependent on pump size, properties of the slurries, and solid particles specifications, and
are not universally applicable. The majority of the literature published on the
performance characteristics of centrifugal slurry pumps used conventional solid particles
with median lengths of 0.042 mm [2] for fly ash to 2.2 mm for sand [5] and density of
1480 kg/m3 for coal [13] to 6240 kg/m
3 for mild steel [15]. The agricultural residue
biomass particles studied here were noticeably larger (from 1.9 to 8.3 mm) compared to
fly ash particles and had much smaller density (saturated) of 1050 kg/m3. Such particle
specifications, together with several unusual particle characteristics (e.g., wide size
distribution; extreme shapes; fibrous, pliable, flexible, and asymmetric nature; potential
for forming networks; ability to take up the carrier liquid) [16] give rise to a variety of
mechanisms in slurry flow, e.g., drag reduction [17] which are often not encountered in
classical solid-liquid systems. Typical fibrous particles slurry flows (e.g., slurry of natural
and synthetic fibres of several micrometers to 5.0 mm in length and aspect ratios of 25 to
several hundred) with progressively increasing fibre populations (i.e., slurry solid mass
content) exhibit similar phenomena as well, i.e., drag reduction, particularly when fibres
in suspension are subject to high shear rates and there is insufficient volume for the fibres
to move freely. The details of corresponding mechanisms have been extensively
discussed in literature [18-27]. Unusual physical and morphological particle
characteristics, together with special slurry properties including unique friction loss
behavior and ability to form fibre boundles, make pumping agricultural residue biomass
difficult and impact the centrifugal slurry pump performance unconventionally. The
researchers are, therefore, limited in seeking solutions to the problems involved with
109
pumping agricultural residue biomass slurries, and using previously proposed correlations
might result in over-sizing of the pumps.
Following a previous study on the feasibility of biomass pipeline hydro-transport
concept, as well as the biomass slurry flow mechanical and rheological behavior [17, 28],
the authors attempt to experimentally establish the effect of concentrated slurries of
fibrous agricultural residue biomass particles with non-conventional properties on
performance characteristics of centrifugal slurry pumps. The main objectives were to
study the effects of particle size and slurry solid mass content on head, efficiency, and
power consumption of the centrifugal slurry pump, also develop an empirical correlation
to predict the performance of the centrifugal pump when handling the slurry of
agricultural residue biomass. The results could be used in selecting appropriate slurry
pumps and in the design and operation of hydraulic pipelines to transport wheat straw and
corn stover fibrous particles.
5.2. Experimental Measurements
5.2.1. Agricultural Residue Biomass Material Preparation and Properties
Wheat straw (Triticum sativum; dry stalks of wheat) and corn stover (Zea mays;
leaves and stalks of corn) were used to prepare the slurry in the present study. Wheat
straw and corn stover were collected from farms in Northern (54°03'57.8"N,
113°34'11.3"W) and Southern (49°47'20.9"N, 112°09'00.9"W) Alberta, Canada, in fall
2012, with heights of cut of 0.25 m for wheat straw and 0.4 m for corn stover. The square
bales of wheat straw and round bales of corn stover were stored in open shelters in the
farms for a minimum of two months before being deliverd to Large-scale Fluids Lab at
University of Alberta. The materials, as received in the lab, were first milled using a
commercially available cutting mill (SM-100; Retsch Inc., Newton, PA, USA), then
classified using a standard [29, 30] chip classifier (BM&M Inc., Surrey, BC, Canada)
with seven sieves 19.2 mm, 12.8 mm, 6.4 mm, 4.0 mm, 3.2 mm, and 1.28 mm in size,
and pan. The material retained on four bottom trays were collected and classified into
four groups with nominal sizes of 19.2 mm, 6.4 mm, 3.2 mm, and <3.2 mm. These
nominal sizes were chosen to represent the particles dimensions throughout the chapter.
110
The initial wet-basis water mass content (moisture content or MC) of wheat straw and
corn stover particles were measured according to ASABE S358.2 standard [31] to be 6 ±
0.5%. Particle density of wheat straw and corn stover were also measured according to
ASTM C127 standards [32] to be 1026 ± 10 kg/m3 and 1169 ± 10 kg/m
3, respectively.
5.2.1.1. Image Processing and Morphological Studies
Digital image processing was subsequently used to study the detailed characteristics (e.g.,
the relatively large mean particle size; wide size distribution; extreme shapes; fibrous,
pliable, flexible, and asymmetric nature; potential for forming networks) and the
morphological features of atypical agricultural residue biomass particles. ImageJ
platform, a Java-based and platform-independent software by the National Institutes of
Health (NIH, Bethesda, Maryland USA) [33], together with a user-coded plugin
developed by the authors [16], was used to process particle sample images, measure
particle dimensions, and analyze particle shapes, particle size distribution (PSD), size
distribution algorithms, and corresponding parameters of knife-milled pre-classified
wheat straw and corn stover. Dimensions of significance based on length, including
median length (d50; the particle size value in case-cumulative distribution percentage
reaches 50%) and geometric mean length (Xgl; central tendency or typical value of
particles’ sizes), together with corresponding standard deviation (σgl), are presented in
Table 5-1. Comparing nominal, median, and geometric particle lengths uncovers the 20
to 130% under- and over estimation of real dimensions of particles involved in nominal
sizes. A comparison of the agricultural residue biomass particles’ dimensions with those
of conventional solid particles (see Table 5-6) showed that biomass particles come with
diverse shapes (morphological features), surface features, and dimensions [16] that
distinguish the slurry of agricultural residue biomass from classical solid-liquid systems.
This unique feature was validated by comparing mechanical features of a water-sand
mixture with the slurry of wheat straw biomass and is described later in this chapter.
Normal PSD algorithms for <3.2 mm corn stover particles and for <3.2 mm, 3.2 mm, 6.4
mm, and 19.2 mm wheat straw fibres are shown in Fig. 5-1(a).

111
Table 5-1: Physical properties of particles and slurries of agricultural residue biomass
Particle Properties Slurry Properties
Solid
Biomass
Particle Size
Particle
Aspect
Ratio
Density Wet-basis Water
Mass Content Dry
matter
Solid
Mass
Content,
%
Density,
kg/m3 Initial,
kg/m3
Saturated,
kg/m3
Initial,
%
Saturated,
% Nominal
Length,
mm
Median
Length
(d50),
mm
Geometric
Length
(Xgl ± σgl),
mm
Shape
Factor
Wheat
Straw
19.2 8.29 8.42 ± 1.49 0.105 6.28
1026 ±
10
1050 ± 10 6.0 ±
0.5 82.0 ± 0.5
1.0 – 5.4 1000.94–
1004.7
6.4 5.00 4.79 ± 1.57 0.156 4.47 1.0 – 6.5 1000.94-
1005.7
3.2 3.29 3.96 ± 1.41 0.266 3.53 1.0 – 7.6 10009.4-
1006.6
<3.2 2.42 2.57 ± 1.43 0.777 3.47
1.0 – 8.8 1000.94-
1007.6 Corn
Stover <3.2 1.90 2.11 ± 1.44 0.529 2.89
1169 ±
10
a) b)
Figure 5-1: a) Particle size distribution (PSD) of wheat straw and corn stover particles
used during the course of present research, b) Water mass content and median length
(d50) variation of 19.2 mm wheat straw particles in a mixture of 3.2% dry matter solid
mass content pumped at 3.3 m/s and 15.0 kPa pressure measured in this study
0.0
20.0
40.0
60.0
80.0
100.0
0.0 5.0 10.0 15.0 20.0
No
rma
l F
req
uen
cy
Particle Size (mm)
Wheat straw - 19.2 mm
Wheat straw - 6.4 mm
Wheat straw - 3.2 mm
Wheat straw - <3.2 mm
Corn stover - <3.2 mm
Curve fit (Wheat straw - 19.2 mm)
Curve fit (Wheat straw - 6.4 mm)
Curve fit (Wheat straw - 3.2 mm)
Curve fit (Wheat straw - <3.2 mm)
Curve fit (Corn stover - <3.2 mm)
6.76
75.96
76.36
76.86
77.66
77.86 78.06 78.76
8.04
6.92 6.82
6.47 6.43
6.22
5.94
5.74
5.0
6.0
7.0
8.0
9.0
1.0
10.0
100.0
0.0 5.0
d50 (
mm
)
Wa
ter
Ma
ss C
on
ten
t (%
)
Pumping Time (h)
MC %[mass]
D50 (mm)
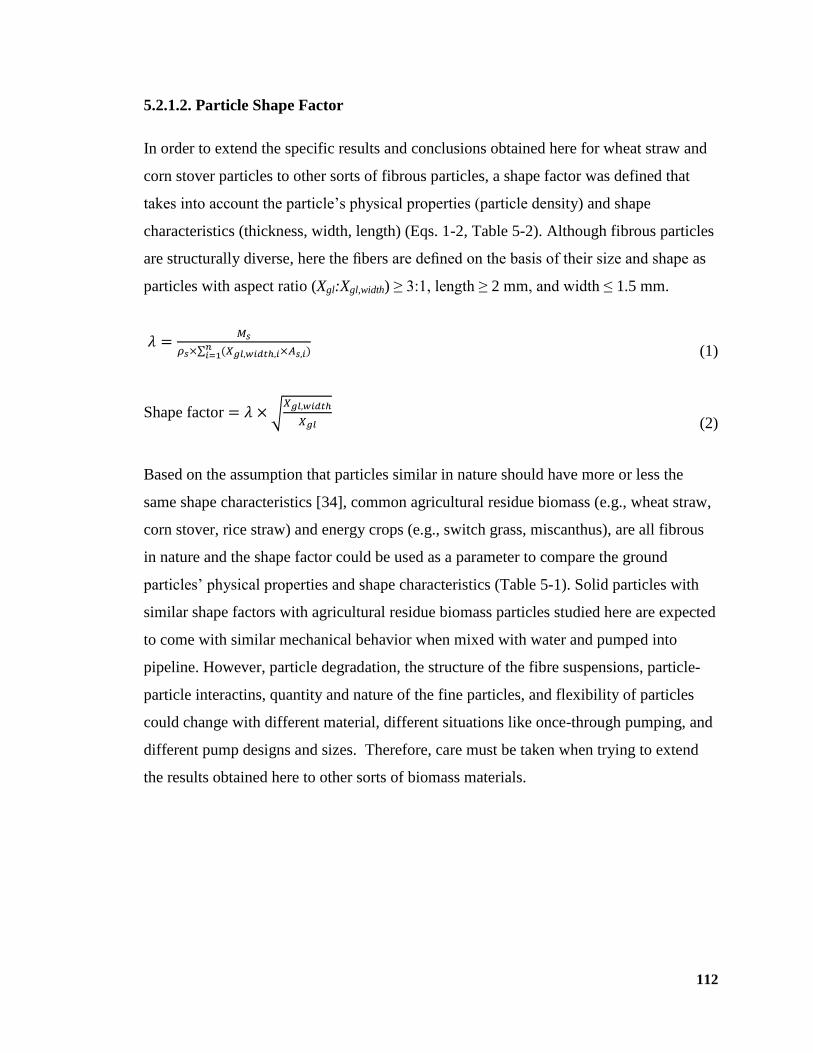
112
5.2.1.2. Particle Shape Factor
In order to extend the specific results and conclusions obtained here for wheat straw and
corn stover particles to other sorts of fibrous particles, a shape factor was defined that
takes into account the particle’s physical properties (particle density) and shape
characteristics (thickness, width, length) (Eqs. 1-2, Table 5-2). Although fibrous particles
are structurally diverse, here the fibers are defined on the basis of their size and shape as
particles with aspect ratio (Xgl:Xgl,width) ≥ 3:1, length ≥ 2 mm, and width ≤ 1.5 mm.
∑
(1)
Shape factor √
(2)
Based on the assumption that particles similar in nature should have more or less the
same shape characteristics [34], common agricultural residue biomass (e.g., wheat straw,
corn stover, rice straw) and energy crops (e.g., switch grass, miscanthus), are all fibrous
in nature and the shape factor could be used as a parameter to compare the ground
particles’ physical properties and shape characteristics (Table 5-1). Solid particles with
similar shape factors with agricultural residue biomass particles studied here are expected
to come with similar mechanical behavior when mixed with water and pumped into
pipeline. However, particle degradation, the structure of the fibre suspensions, particle-
particle interactins, quantity and nature of the fine particles, and flexibility of particles
could change with different material, different situations like once-through pumping, and
different pump designs and sizes. Therefore, care must be taken when trying to extend
the results obtained here to other sorts of biomass materials.
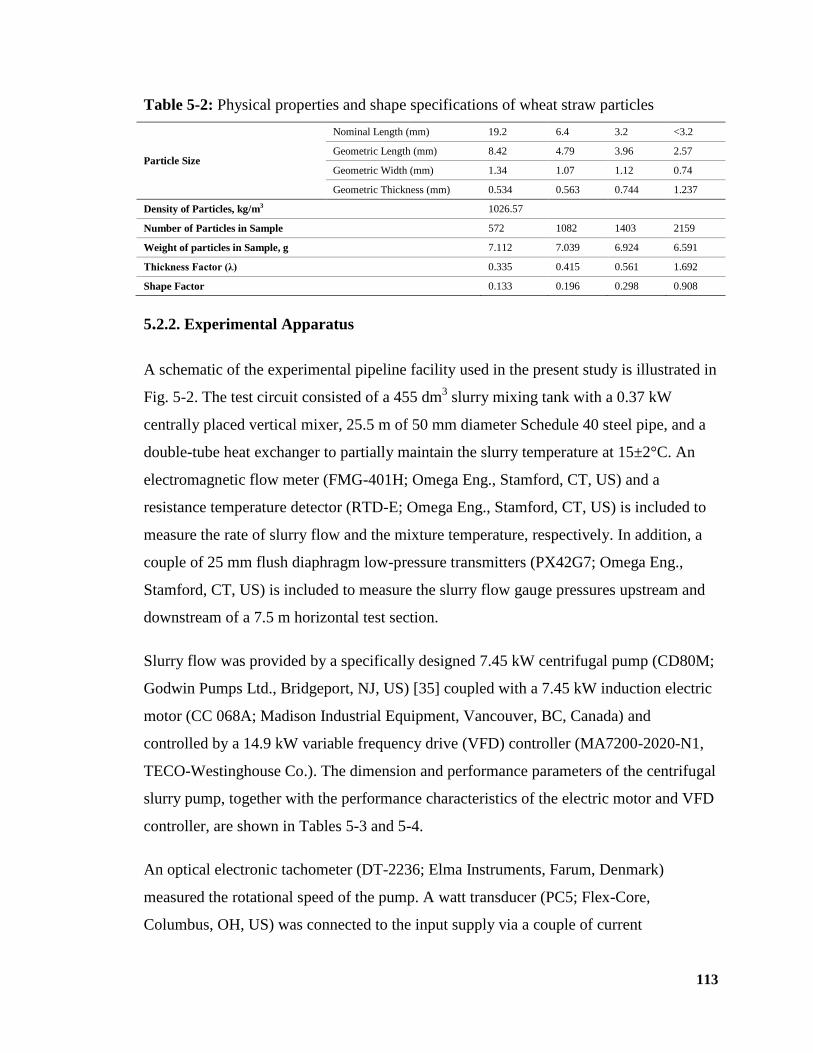
113
Table 5-2: Physical properties and shape specifications of wheat straw particles
Particle Size
Nominal Length (mm) 19.2 6.4 3.2 <3.2
Geometric Length (mm) 8.42 4.79 3.96 2.57
Geometric Width (mm) 1.34 1.07 1.12 0.74
Geometric Thickness (mm) 0.534 0.563 0.744 1.237
Density of Particles, kg/m3 1026.57
Number of Particles in Sample 572 1082 1403 2159
Weight of particles in Sample, g 7.112 7.039 6.924 6.591
Thickness Factor (λ) 0.335 0.415 0.561 1.692
Shape Factor 0.133 0.196 0.298 0.908
5.2.2. Experimental Apparatus
A schematic of the experimental pipeline facility used in the present study is illustrated in
Fig. 5-2. The test circuit consisted of a 455 dm3 slurry mixing tank with a 0.37 kW
centrally placed vertical mixer, 25.5 m of 50 mm diameter Schedule 40 steel pipe, and a
double-tube heat exchanger to partially maintain the slurry temperature at 15±2°C. An
electromagnetic flow meter (FMG-401H; Omega Eng., Stamford, CT, US) and a
resistance temperature detector (RTD-E; Omega Eng., Stamford, CT, US) is included to
measure the rate of slurry flow and the mixture temperature, respectively. In addition, a
couple of 25 mm flush diaphragm low-pressure transmitters (PX42G7; Omega Eng.,
Stamford, CT, US) is included to measure the slurry flow gauge pressures upstream and
downstream of a 7.5 m horizontal test section.
Slurry flow was provided by a specifically designed 7.45 kW centrifugal pump (CD80M;
Godwin Pumps Ltd., Bridgeport, NJ, US) [35] coupled with a 7.45 kW induction electric
motor (CC 068A; Madison Industrial Equipment, Vancouver, BC, Canada) and
controlled by a 14.9 kW variable frequency drive (VFD) controller (MA7200-2020-N1,
TECO-Westinghouse Co.). The dimension and performance parameters of the centrifugal
slurry pump, together with the performance characteristics of the electric motor and VFD
controller, are shown in Tables 5-3 and 5-4.
An optical electronic tachometer (DT-2236; Elma Instruments, Farum, Denmark)
measured the rotational speed of the pump. A watt transducer (PC5; Flex-Core,
Columbus, OH, US) was connected to the input supply via a couple of current
114
transformers (189-060; Flex-Core, Columbus, OH, US) and was calibrated using a power
quality analyzer (43B; Fluke Corp., Mississauga, ON, Canada). The watt transducer
measured the pump input power indirectly by the measurement of the input power to the
electric motor with an accuracy of ±5.5%, using the electric motor’s known efficiency.
The suction and discharge pressures were measured using 100 kPa and 200 kPa Bourdon
tube pressure gauges (21X.53, WIKA Instruments Ltd., Edmonton, AB, Canada),
respectively, which came with an uncertainty of ±1.5%, and were calibrated using a
portable pressure calibrator (DPI 610/615, GE Druck, Leicester, United Kingdom) once
every six months during experimentation. The pressure gauges, pipe layout, and
measurements were set up, configured, and operated in accordance with the acceptance
tests and standard test procedures for centrifugal pumps [36, 37].
The 4-20 mA output signals from the watt transducer, temperature probe, magnetic flow
meter, and pressure transmitters were recorded with a sampling rate of 100 Hz. on a data
acquisition system comprised of a 4-channel current excitation module (NI 9219;
National Instrument Corp., Austin, TX, US) and a data acquisition program (LabView
V.9.0.1f2; National Instrument Corp., Austin, TX, US).
5.2.3. Experimental Procedure
5.2.3.1. Agricultural Residue Biomass Slurry Preparation
The performance characteristics of the centrifugal pump were evaluated using pure water
before and periodically during the solid-water experiments. The measured amount of
feedstock was afterwards mixed with water and pumped through the closed-circuit
pipeline. It took 12 to 14 hours at a pumping velocity of 4.0 to 5.0 m/s before a stable
mixture condition was reached and pressure and velocity fluctuations, caused by particle
degradation and decrease in momentum transfer, damped down to less than 1.0% per
hour. Meanwhile, biomass solid particles absorbed 96% of their saturated water mass
content in one hour and became fully saturated after six hours, as observed in Fig. 5-1(b).
The friction loss of the slurry through a 7.5 m horizontal test section, together with the
performance of the centrifugal pump, i.e., head, efficiency, and input power, was
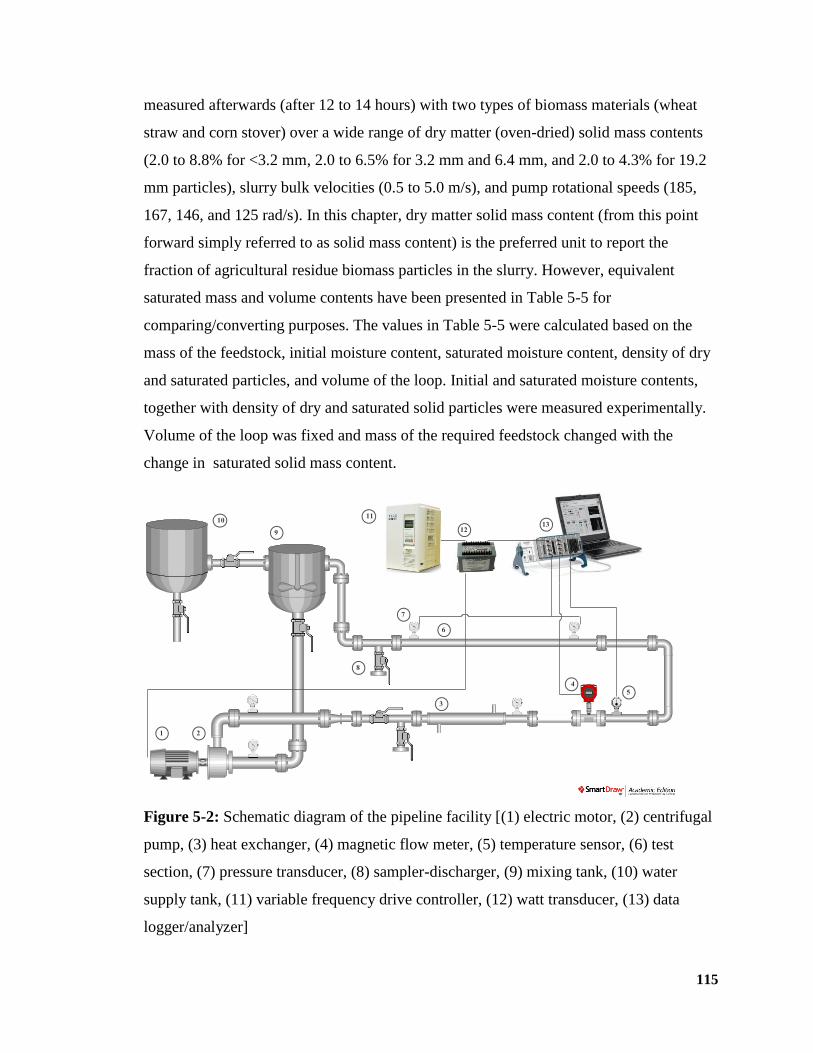
115
measured afterwards (after 12 to 14 hours) with two types of biomass materials (wheat
straw and corn stover) over a wide range of dry matter (oven-dried) solid mass contents
(2.0 to 8.8% for <3.2 mm, 2.0 to 6.5% for 3.2 mm and 6.4 mm, and 2.0 to 4.3% for 19.2
mm particles), slurry bulk velocities (0.5 to 5.0 m/s), and pump rotational speeds (185,
167, 146, and 125 rad/s). In this chapter, dry matter solid mass content (from this point
forward simply referred to as solid mass content) is the preferred unit to report the
fraction of agricultural residue biomass particles in the slurry. However, equivalent
saturated mass and volume contents have been presented in Table 5-5 for
comparing/converting purposes. The values in Table 5-5 were calculated based on the
mass of the feedstock, initial moisture content, saturated moisture content, density of dry
and saturated particles, and volume of the loop. Initial and saturated moisture contents,
together with density of dry and saturated solid particles were measured experimentally.
Volume of the loop was fixed and mass of the required feedstock changed with the
change in saturated solid mass content.
Figure 5-2: Schematic diagram of the pipeline facility [(1) electric motor, (2) centrifugal
pump, (3) heat exchanger, (4) magnetic flow meter, (5) temperature sensor, (6) test
section, (7) pressure transducer, (8) sampler-discharger, (9) mixing tank, (10) water
supply tank, (11) variable frequency drive controller, (12) watt transducer, (13) data
logger/analyzer]
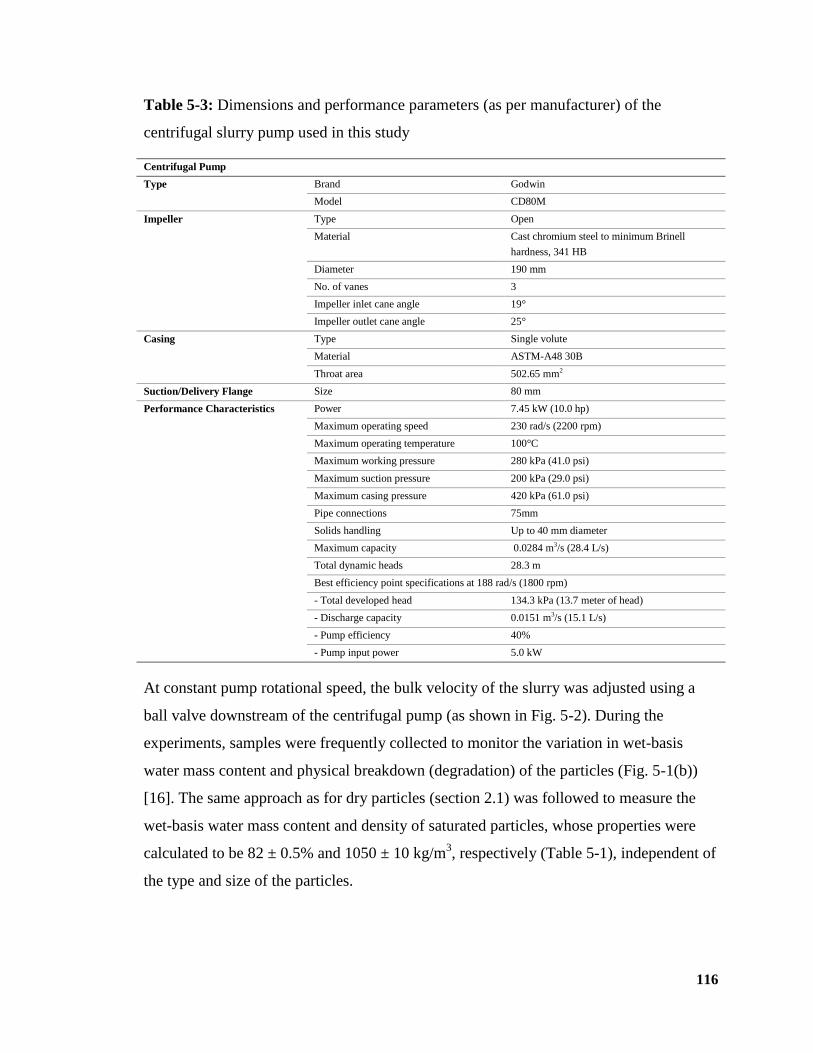
116
Table 5-3: Dimensions and performance parameters (as per manufacturer) of the
centrifugal slurry pump used in this study
Centrifugal Pump
Type Brand Godwin
Model CD80M
Impeller Type Open
Material Cast chromium steel to minimum Brinell
hardness, 341 HB
Diameter 190 mm
No. of vanes 3
Impeller inlet cane angle 19°
Impeller outlet cane angle 25°
Casing Type Single volute
Material ASTM-A48 30B
Throat area 502.65 mm2
Suction/Delivery Flange Size 80 mm
Performance Characteristics Power 7.45 kW (10.0 hp)
Maximum operating speed 230 rad/s (2200 rpm)
Maximum operating temperature 100°C
Maximum working pressure 280 kPa (41.0 psi)
Maximum suction pressure 200 kPa (29.0 psi)
Maximum casing pressure 420 kPa (61.0 psi)
Pipe connections 75mm
Solids handling Up to 40 mm diameter
Maximum capacity 0.0284 m3/s (28.4 L/s)
Total dynamic heads 28.3 m
Best efficiency point specifications at 188 rad/s (1800 rpm)
- Total developed head 134.3 kPa (13.7 meter of head)
- Discharge capacity 0.0151 m3/s (15.1 L/s)
- Pump efficiency 40%
- Pump input power 5.0 kW
At constant pump rotational speed, the bulk velocity of the slurry was adjusted using a
ball valve downstream of the centrifugal pump (as shown in Fig. 5-2). During the
experiments, samples were frequently collected to monitor the variation in wet-basis
water mass content and physical breakdown (degradation) of the particles (Fig. 5-1(b))
[16]. The same approach as for dry particles (section 2.1) was followed to measure the
wet-basis water mass content and density of saturated particles, whose properties were
calculated to be 82 ± 0.5% and 1050 ± 10 kg/m3, respectively (Table 5-1), independent of
the type and size of the particles.
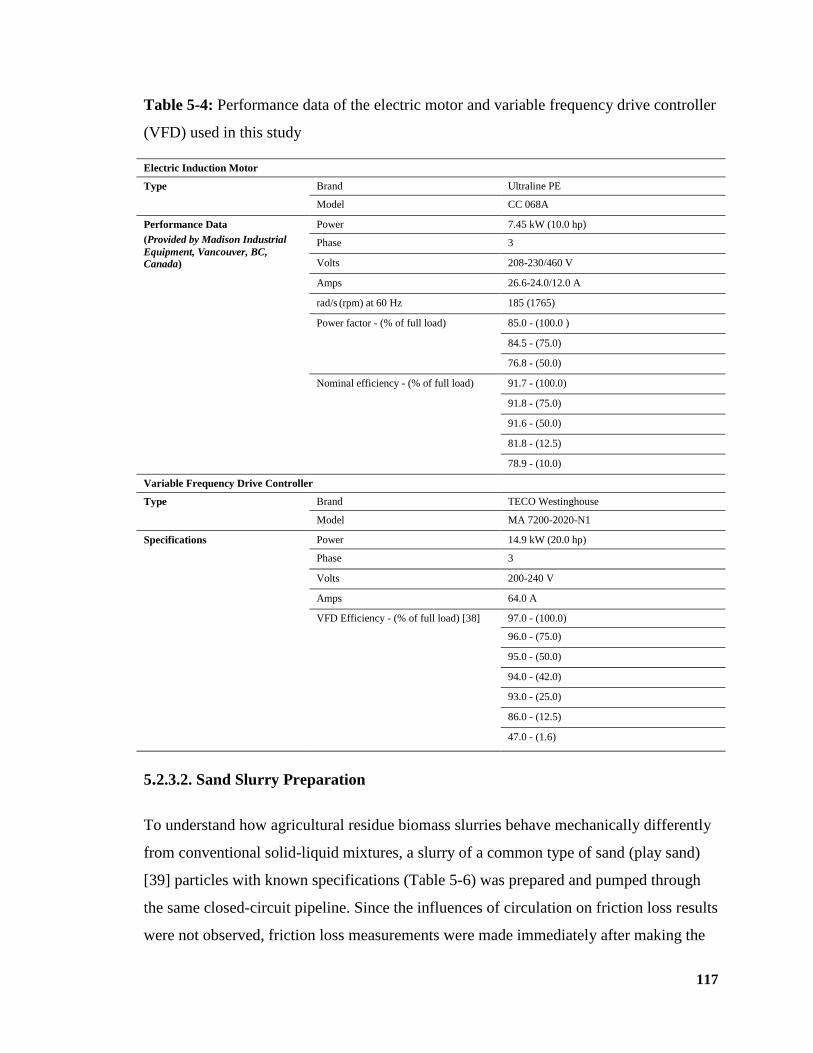
117
Table 5-4: Performance data of the electric motor and variable frequency drive controller
(VFD) used in this study
Electric Induction Motor
Type Brand Ultraline PE
Model CC 068A
Performance Data
(Provided by Madison Industrial
Equipment, Vancouver, BC,
Canada)
Power 7.45 kW (10.0 hp)
Phase 3
Volts 208-230/460 V
Amps 26.6-24.0/12.0 A
rad/s (rpm) at 60 Hz 185 (1765)
Power factor - (% of full load) 85.0 - (100.0 )
84.5 - (75.0)
76.8 - (50.0)
Nominal efficiency - (% of full load) 91.7 - (100.0)
91.8 - (75.0)
91.6 - (50.0)
81.8 - (12.5)
78.9 - (10.0)
Variable Frequency Drive Controller
Type Brand TECO Westinghouse
Model MA 7200-2020-N1
Specifications Power 14.9 kW (20.0 hp)
Phase 3
Volts 200-240 V
Amps 64.0 A
VFD Efficiency - (% of full load) [38] 97.0 - (100.0)
96.0 - (75.0)
95.0 - (50.0)
94.0 - (42.0)
93.0 - (25.0)
86.0 - (12.5)
47.0 - (1.6)
5.2.3.2. Sand Slurry Preparation
To understand how agricultural residue biomass slurries behave mechanically differently
from conventional solid-liquid mixtures, a slurry of a common type of sand (play sand)
[39] particles with known specifications (Table 5-6) was prepared and pumped through
the same closed-circuit pipeline. Since the influences of circulation on friction loss results
were not observed, friction loss measurements were made immediately after making the
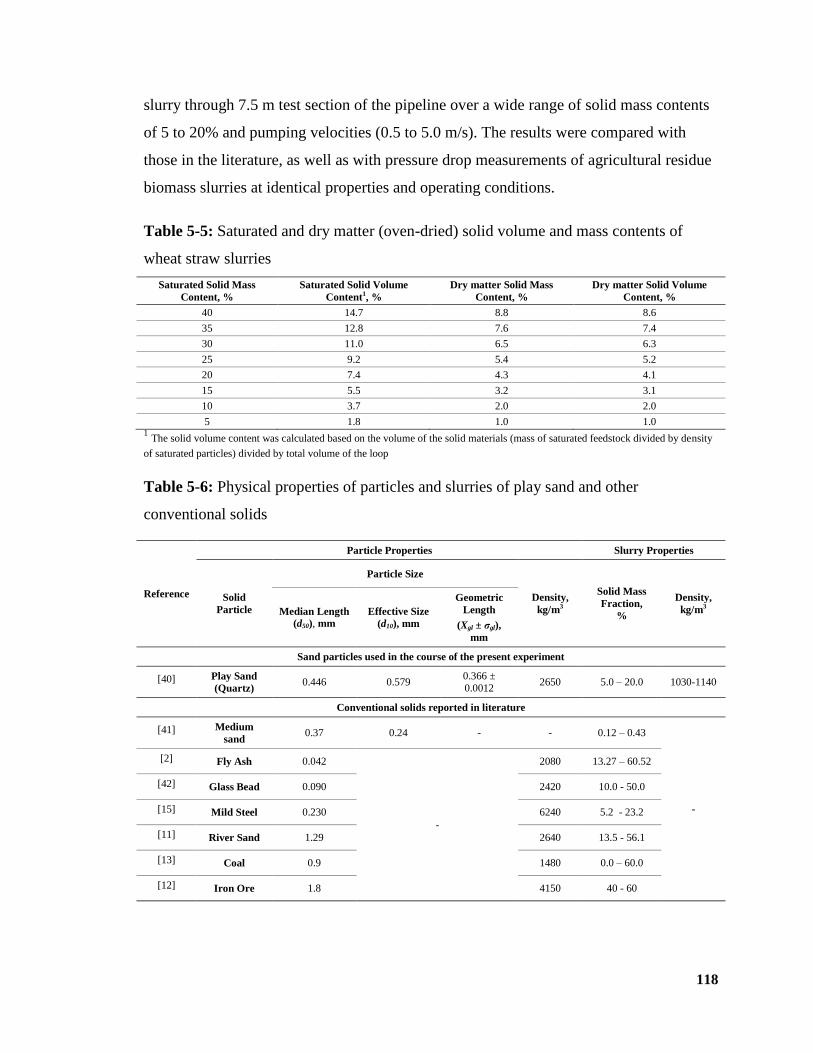
118
slurry through 7.5 m test section of the pipeline over a wide range of solid mass contents
of 5 to 20% and pumping velocities (0.5 to 5.0 m/s). The results were compared with
those in the literature, as well as with pressure drop measurements of agricultural residue
biomass slurries at identical properties and operating conditions.
Table 5-5: Saturated and dry matter (oven-dried) solid volume and mass contents of
wheat straw slurries
Saturated Solid Mass
Content, %
Saturated Solid Volume
Content1, %
Dry matter Solid Mass
Content, %
Dry matter Solid Volume
Content, %
40 14.7 8.8 8.6
35 12.8 7.6 7.4
30 11.0 6.5 6.3
25 9.2 5.4 5.2
20 7.4 4.3 4.1
15 5.5 3.2 3.1
10 3.7 2.0 2.0
5 1.8 1.0 1.0 1 The solid volume content was calculated based on the volume of the solid materials (mass of saturated feedstock divided by density
of saturated particles) divided by total volume of the loop
Table 5-6: Physical properties of particles and slurries of play sand and other
conventional solids
Reference
Particle Properties Slurry Properties
Solid
Particle
Particle Size
Density,
kg/m3
Solid Mass
Fraction,
%
Density,
kg/m3 Median Length
(d50), mm
Effective Size
(d10), mm
Geometric
Length
(Xgl ± σgl),
mm
Sand particles used in the course of the present experiment
[40] Play Sand
(Quartz) 0.446 0.579
0.366 ± 0.0012
2650 5.0 – 20.0 1030-1140
Conventional solids reported in literature
[41] Medium
sand 0.37 0.24 - - 0.12 – 0.43
-
[2] Fly Ash 0.042
-
2080 13.27 – 60.52
[42] Glass Bead 0.090 2420 10.0 - 50.0
[15] Mild Steel 0.230 6240 5.2 - 23.2
[11] River Sand 1.29 2640 13.5 - 56.1
[13] Coal 0.9 1480 0.0 – 60.0
[12] Iron Ore 1.8 4150 40 - 60
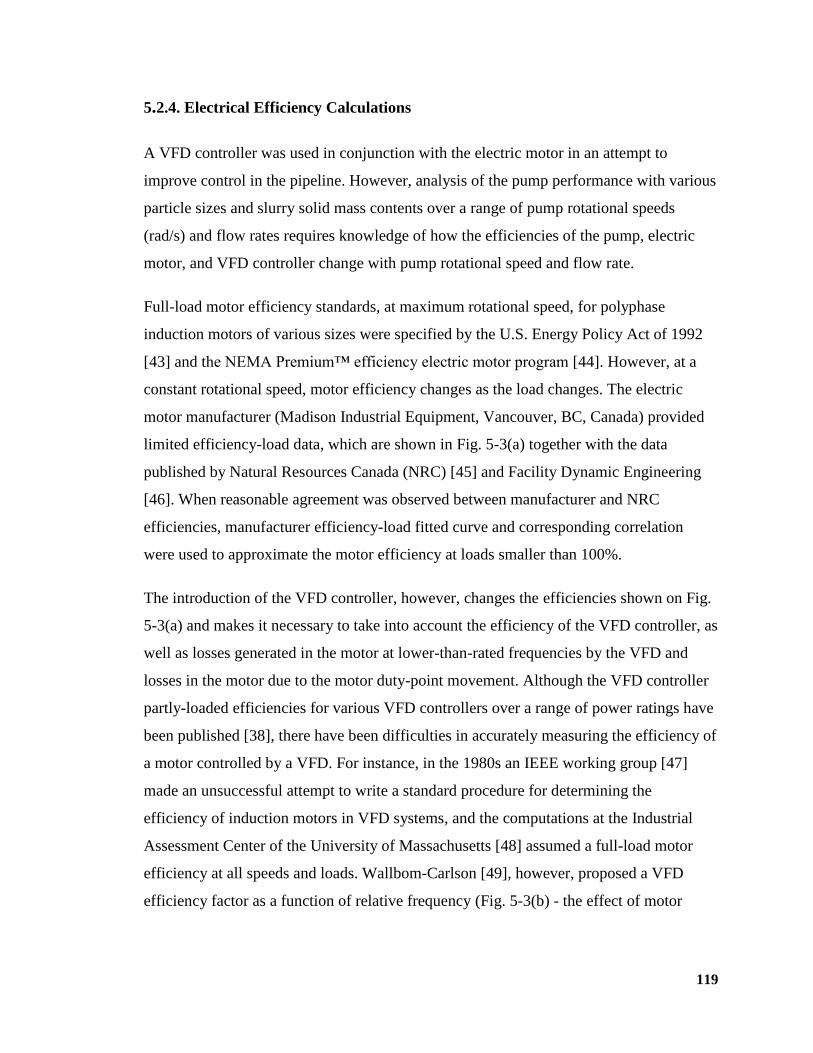
119
5.2.4. Electrical Efficiency Calculations
A VFD controller was used in conjunction with the electric motor in an attempt to
improve control in the pipeline. However, analysis of the pump performance with various
particle sizes and slurry solid mass contents over a range of pump rotational speeds
(rad/s) and flow rates requires knowledge of how the efficiencies of the pump, electric
motor, and VFD controller change with pump rotational speed and flow rate.
Full-load motor efficiency standards, at maximum rotational speed, for polyphase
induction motors of various sizes were specified by the U.S. Energy Policy Act of 1992
[43] and the NEMA Premium™ efficiency electric motor program [44]. However, at a
constant rotational speed, motor efficiency changes as the load changes. The electric
motor manufacturer (Madison Industrial Equipment, Vancouver, BC, Canada) provided
limited efficiency-load data, which are shown in Fig. 5-3(a) together with the data
published by Natural Resources Canada (NRC) [45] and Facility Dynamic Engineering
[46]. When reasonable agreement was observed between manufacturer and NRC
efficiencies, manufacturer efficiency-load fitted curve and corresponding correlation
were used to approximate the motor efficiency at loads smaller than 100%.
The introduction of the VFD controller, however, changes the efficiencies shown on Fig.
5-3(a) and makes it necessary to take into account the efficiency of the VFD controller, as
well as losses generated in the motor at lower-than-rated frequencies by the VFD and
losses in the motor due to the motor duty-point movement. Although the VFD controller
partly-loaded efficiencies for various VFD controllers over a range of power ratings have
been published [38], there have been difficulties in accurately measuring the efficiency of
a motor controlled by a VFD. For instance, in the 1980s an IEEE working group [47]
made an unsuccessful attempt to write a standard procedure for determining the
efficiency of induction motors in VFD systems, and the computations at the Industrial
Assessment Center of the University of Massachusetts [48] assumed a full-load motor
efficiency at all speeds and loads. Wallbom-Carlson [49], however, proposed a VFD
efficiency factor as a function of relative frequency (Fig. 5-3(b) - the effect of motor
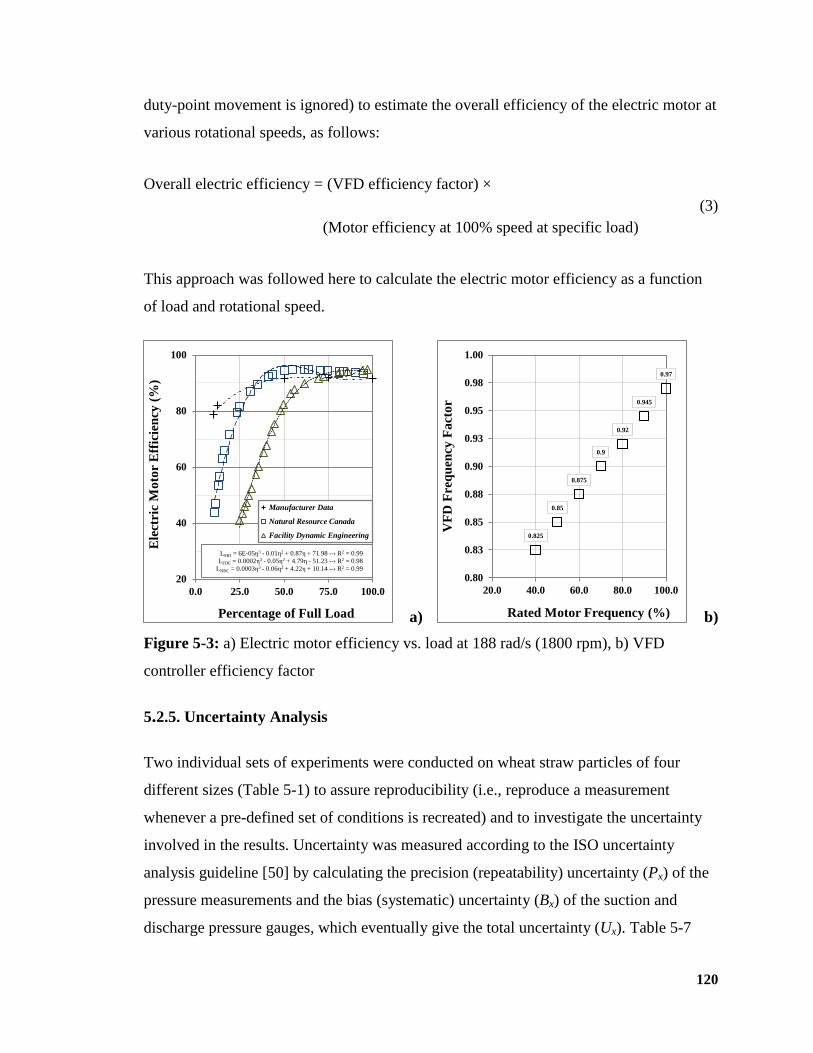
120
duty-point movement is ignored) to estimate the overall efficiency of the electric motor at
various rotational speeds, as follows:
Overall electric efficiency = (VFD efficiency factor) ×
(Motor efficiency at 100% speed at specific load)
(3)
This approach was followed here to calculate the electric motor efficiency as a function
of load and rotational speed.
a) b)
Figure 5-3: a) Electric motor efficiency vs. load at 188 rad/s (1800 rpm), b) VFD
controller efficiency factor
5.2.5. Uncertainty Analysis
Two individual sets of experiments were conducted on wheat straw particles of four
different sizes (Table 5-1) to assure reproducibility (i.e., reproduce a measurement
whenever a pre-defined set of conditions is recreated) and to investigate the uncertainty
involved in the results. Uncertainty was measured according to the ISO uncertainty
analysis guideline [50] by calculating the precision (repeatability) uncertainty (Px) of the
pressure measurements and the bias (systematic) uncertainty (Bx) of the suction and
discharge pressure gauges, which eventually give the total uncertainty (Ux). Table 5-7
20
40
60
80
100
0.0 25.0 50.0 75.0 100.0
Ele
ctri
c M
oto
r E
ffic
ien
cy (
%)
Percentage of Full Load
Manufacturer Data
Natural Resource Canada
Facility Dynamic Engineering
LMD = 6E-05η3 - 0.01η2 + 0.87η + 71.98 --› R2 = 0.99
LFDE = 0.0002η3 - 0.05η2 + 4.79η - 51.23 --› R2 = 0.98
LNRC = 0.0003η3 - 0.06η2 + 4.22η + 10.14 --› R2 = 0.99
0.97
0.945
0.92
0.9
0.875
0.85
0.825
0.80
0.83
0.85
0.88
0.90
0.93
0.95
0.98
1.00
20.0 40.0 60.0 80.0 100.0
VF
D F
req
uen
cy F
act
or
Rated Motor Frequency (%)
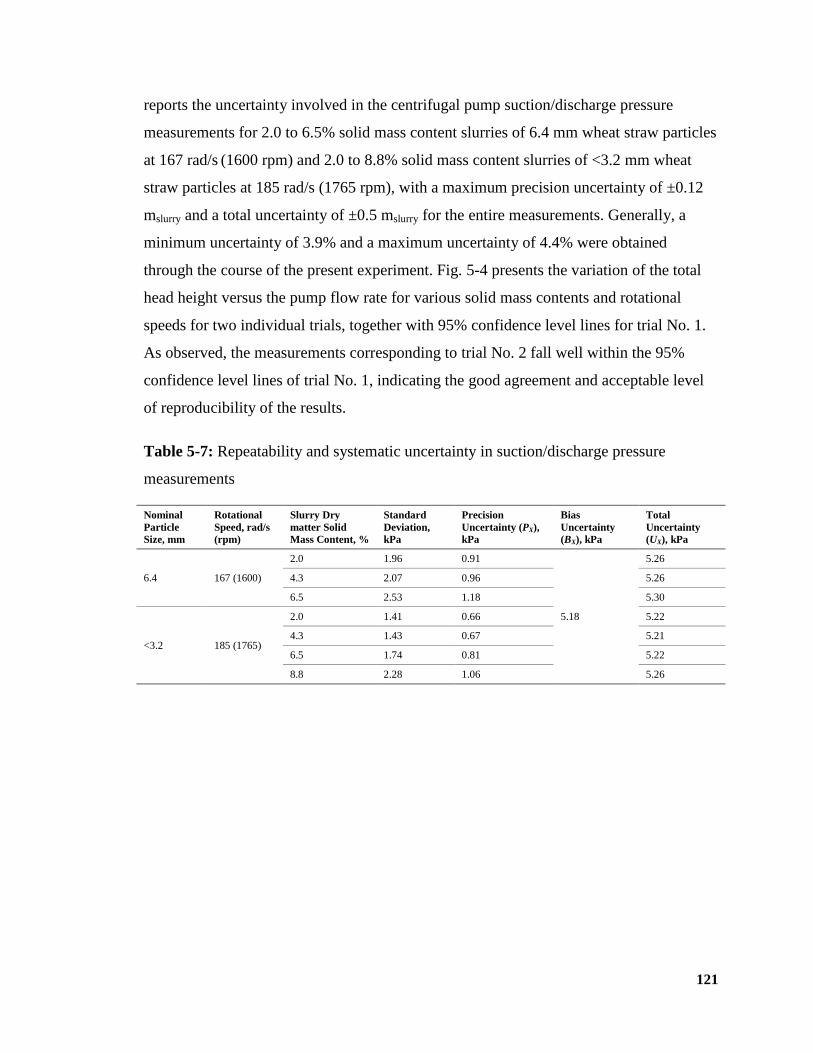
121
reports the uncertainty involved in the centrifugal pump suction/discharge pressure
measurements for 2.0 to 6.5% solid mass content slurries of 6.4 mm wheat straw particles
at 167 rad/s (1600 rpm) and 2.0 to 8.8% solid mass content slurries of <3.2 mm wheat
straw particles at 185 rad/s (1765 rpm), with a maximum precision uncertainty of ±0.12
mslurry and a total uncertainty of ±0.5 mslurry for the entire measurements. Generally, a
minimum uncertainty of 3.9% and a maximum uncertainty of 4.4% were obtained
through the course of the present experiment. Fig. 5-4 presents the variation of the total
head height versus the pump flow rate for various solid mass contents and rotational
speeds for two individual trials, together with 95% confidence level lines for trial No. 1.
As observed, the measurements corresponding to trial No. 2 fall well within the 95%
confidence level lines of trial No. 1, indicating the good agreement and acceptable level
of reproducibility of the results.
Table 5-7: Repeatability and systematic uncertainty in suction/discharge pressure
measurements
Nominal
Particle
Size, mm
Rotational
Speed, rad/s
(rpm)
Slurry Dry
matter Solid
Mass Content, %
Standard
Deviation,
kPa
Precision
Uncertainty (PX),
kPa
Bias
Uncertainty
(BX), kPa
Total
Uncertainty
(UX), kPa
6.4 167 (1600)
2.0 1.96 0.91
5.18
5.26
4.3 2.07 0.96 5.26
6.5 2.53 1.18 5.30
<3.2 185 (1765)
2.0 1.41 0.66 5.22
4.3 1.43 0.67 5.21
6.5 1.74 0.81 5.22
8.8 2.28 1.06 5.26
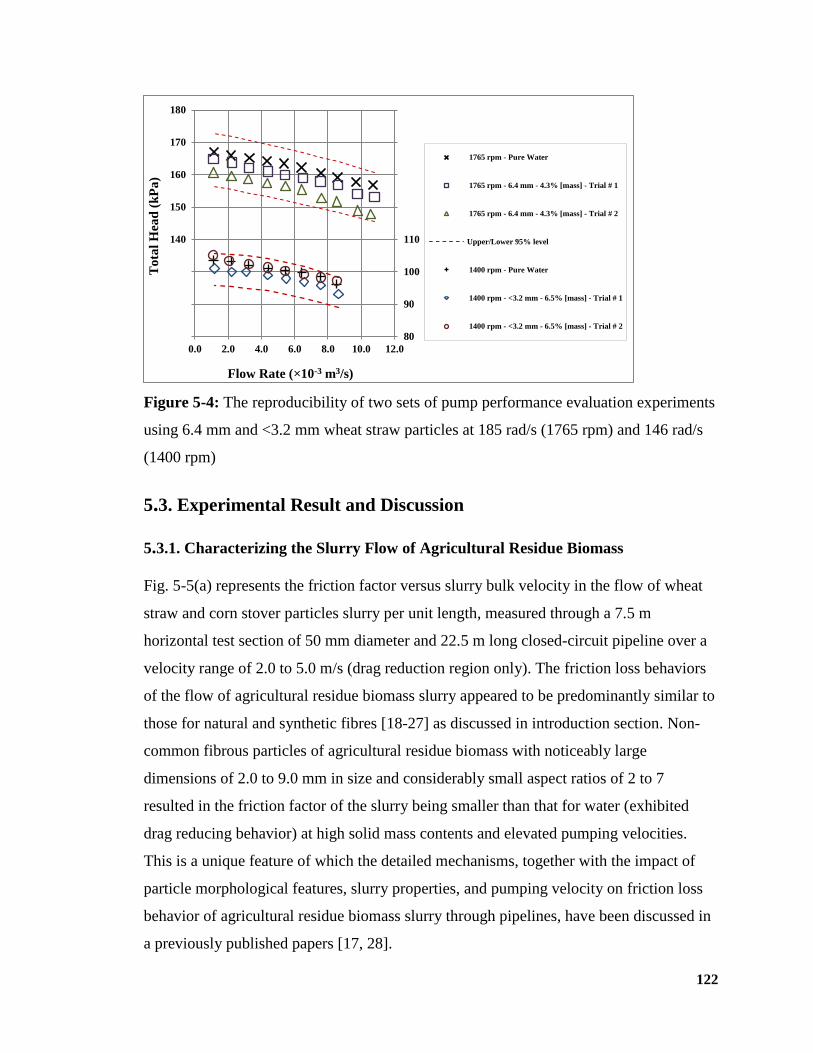
122
Figure 5-4: The reproducibility of two sets of pump performance evaluation experiments
using 6.4 mm and <3.2 mm wheat straw particles at 185 rad/s (1765 rpm) and 146 rad/s
(1400 rpm)
5.3. Experimental Result and Discussion
5.3.1. Characterizing the Slurry Flow of Agricultural Residue Biomass
Fig. 5-5(a) represents the friction factor versus slurry bulk velocity in the flow of wheat
straw and corn stover particles slurry per unit length, measured through a 7.5 m
horizontal test section of 50 mm diameter and 22.5 m long closed-circuit pipeline over a
velocity range of 2.0 to 5.0 m/s (drag reduction region only). The friction loss behaviors
of the flow of agricultural residue biomass slurry appeared to be predominantly similar to
those for natural and synthetic fibres [18-27] as discussed in introduction section. Non-
common fibrous particles of agricultural residue biomass with noticeably large
dimensions of 2.0 to 9.0 mm in size and considerably small aspect ratios of 2 to 7
resulted in the friction factor of the slurry being smaller than that for water (exhibited
drag reducing behavior) at high solid mass contents and elevated pumping velocities.
This is a unique feature of which the detailed mechanisms, together with the impact of
particle morphological features, slurry properties, and pumping velocity on friction loss
behavior of agricultural residue biomass slurry through pipelines, have been discussed in
a previously published papers [17, 28].
80
90
100
110140
150
160
170
180
0.0 2.0 4.0 6.0 8.0 10.0 12.0
To
tal
Hea
d (
kP
a)
Flow Rate (×10-3 m3/s)
1765 rpm - Pure Water
1765 rpm - 6.4 mm - 4.3% [mass] - Trial # 1
1765 rpm - 6.4 mm - 4.3% [mass] - Trial # 2
Upper/Lower 95% level
1400 rpm - Pure Water
1400 rpm - <3.2 mm - 6.5% [mass] - Trial # 1
1400 rpm - <3.2 mm - 6.5% [mass] - Trial # 2
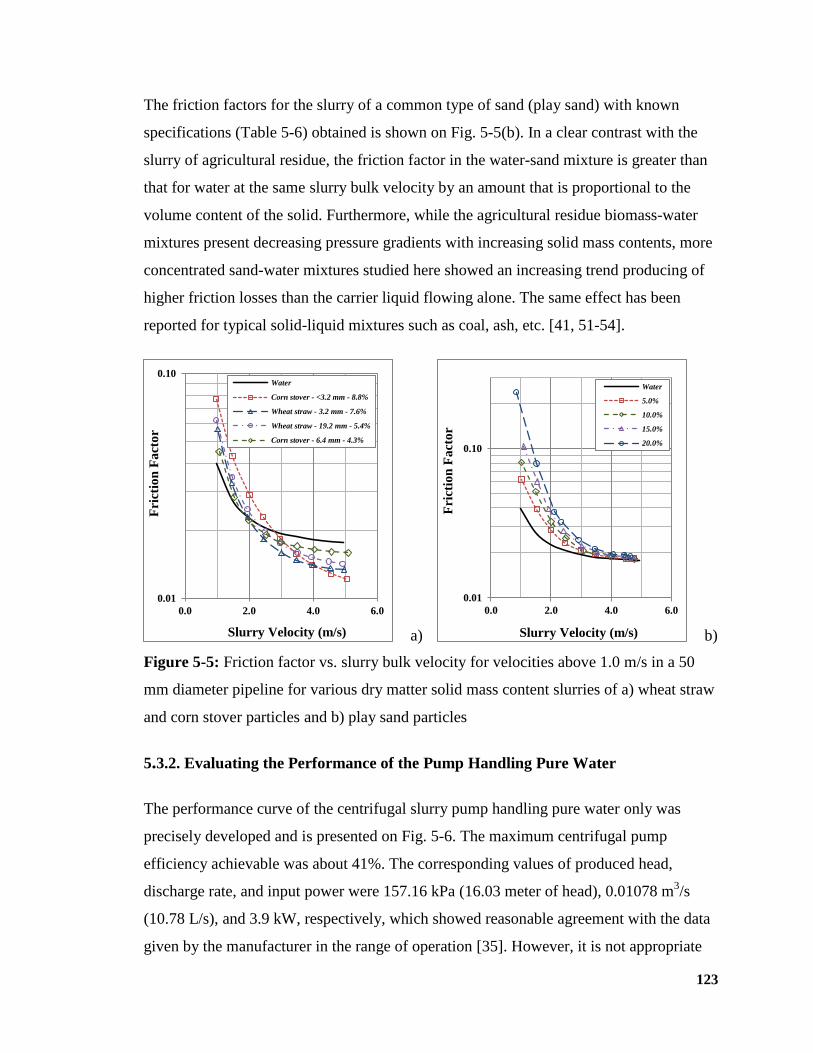
123
The friction factors for the slurry of a common type of sand (play sand) with known
specifications (Table 5-6) obtained is shown on Fig. 5-5(b). In a clear contrast with the
slurry of agricultural residue, the friction factor in the water-sand mixture is greater than
that for water at the same slurry bulk velocity by an amount that is proportional to the
volume content of the solid. Furthermore, while the agricultural residue biomass-water
mixtures present decreasing pressure gradients with increasing solid mass contents, more
concentrated sand-water mixtures studied here showed an increasing trend producing of
higher friction losses than the carrier liquid flowing alone. The same effect has been
reported for typical solid-liquid mixtures such as coal, ash, etc. [41, 51-54].
a) b)
Figure 5-5: Friction factor vs. slurry bulk velocity for velocities above 1.0 m/s in a 50
mm diameter pipeline for various dry matter solid mass content slurries of a) wheat straw
and corn stover particles and b) play sand particles
5.3.2. Evaluating the Performance of the Pump Handling Pure Water
The performance curve of the centrifugal slurry pump handling pure water only was
precisely developed and is presented on Fig. 5-6. The maximum centrifugal pump
efficiency achievable was about 41%. The corresponding values of produced head,
discharge rate, and input power were 157.16 kPa (16.03 meter of head), 0.01078 m3/s
(10.78 L/s), and 3.9 kW, respectively, which showed reasonable agreement with the data
given by the manufacturer in the range of operation [35]. However, it is not appropriate
0.01
0.10
0.0 2.0 4.0 6.0
Fri
ctio
n F
act
or
Slurry Velocity (m/s)
Water
Corn stover - <3.2 mm - 8.8%
Wheat straw - 3.2 mm - 7.6%
Wheat straw - 19.2 mm - 5.4%
Corn stover - 6.4 mm - 4.3%
0.01
0.10
0.0 2.0 4.0 6.0
Fri
ctio
n F
act
or
Slurry Velocity (m/s)
Water
5.0%
10.0%
15.0%
20.0%
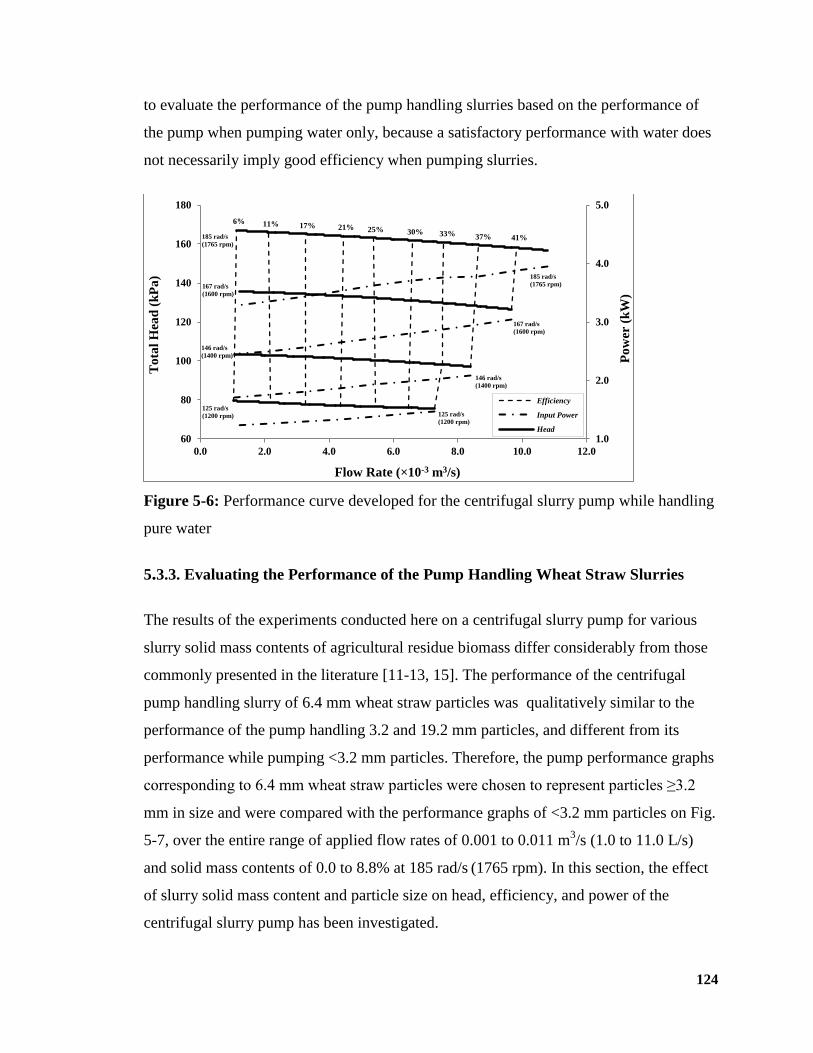
124
to evaluate the performance of the pump handling slurries based on the performance of
the pump when pumping water only, because a satisfactory performance with water does
not necessarily imply good efficiency when pumping slurries.
Figure 5-6: Performance curve developed for the centrifugal slurry pump while handling
pure water
5.3.3. Evaluating the Performance of the Pump Handling Wheat Straw Slurries
The results of the experiments conducted here on a centrifugal slurry pump for various
slurry solid mass contents of agricultural residue biomass differ considerably from those
commonly presented in the literature [11-13, 15]. The performance of the centrifugal
pump handling slurry of 6.4 mm wheat straw particles was qualitatively similar to the
performance of the pump handling 3.2 and 19.2 mm particles, and different from its
performance while pumping <3.2 mm particles. Therefore, the pump performance graphs
corresponding to 6.4 mm wheat straw particles were chosen to represent particles ≥3.2
mm in size and were compared with the performance graphs of <3.2 mm particles on Fig.
5-7, over the entire range of applied flow rates of 0.001 to 0.011 m3/s (1.0 to 11.0 L/s)
and solid mass contents of 0.0 to 8.8% at 185 rad/s (1765 rpm). In this section, the effect
of slurry solid mass content and particle size on head, efficiency, and power of the
centrifugal slurry pump has been investigated.
1.0
2.0
3.0
4.0
5.0
60
80
100
120
140
160
180
0.0 2.0 4.0 6.0 8.0 10.0 12.0
Po
wer
(k
W)
To
tal
Hea
d (
kP
a)
Flow Rate (×10-3 m3/s)
Efficiency
Input Power
Head
6% 11% 17% 21% 25% 30% 33% 37% 41% 185 rad/s
(1765 rpm)
167 rad/s
(1600 rpm)
146 rad/s
(1400 rpm)
125 rad/s
(1200 rpm)
185 rad/s
(1765 rpm)
167 rad/s
(1600 rpm)
146 rad/s
(1400 rpm)
125 rad/s
(1200 rpm)
125
5.3.3.1. Analyzing the Head Height of the Centrifugal Slurry Pump
The curves corresponding to the total head height, shown in Figs. 5-7(a) and 5-7(b),
illustrate (1) expected behavour (i.e., decreasing head with increase in flow rate) similar
to pure water, (2) decreasing head with increase in particle size, and (3) the total head
always less than, or equal to, pure water.
The centrifugal pump handling slurry of 4.3% solid mass content of 6.4 mm wheat straw
particles produced 152.9 kPa (15.6 meter of head) head at 0.0108 m3/s
(10.8 L/s) and 185
rad/s (1765 rpm), and the pump handling slurry of 4.3% solid mass content of 19.2 mm
wheat straw particles produced 150 kPa (15.3 meter of head) head at similar operating
conditions. This small difference can be explained according to the difference in particle
motion mechanisms, as the head loss is higher for larger particles due to the extra energy
required to keep the particles in motion.
However, in a clear contrast to the centrifugal pump performance curves of conventional
solid-liquid systems [2, 5, 51], the head height increases with an increase in solid mass
content, as for <3.2 mm particles slurry at a flow rate of 0.0085 m3/s (8.5 L/s) (Fig. 5-
7(a)), the head height is 154.9 kPa (15.8 meter of head) at 2.0% solid mass content,
compared to 158.8 kPa (16.2 meter of head) with pure water, and 157.8 kPa (16.1 meter
of head) at 8.8% solid mass content, all at 185 rad/s (1765 rpm). This phenomenon could
be attributed to the drag reducing feature of the slurry of fibrous wheat straw particles
(section 3.1 and [17]) in the pump [52] similar to what was observed throughout the
pipeline (Fig. 5-9 - where at sufficiently high velocities the friction loss of the slurries of
<3.2 mm and 6.4 mm particles are less than, or equal to, the pressure drop of pure water
at the same flow rate, caused by the drag reducing effect of the fibrous wheat straw
particles), change in slippage, or damping of turbulence. Furthermore, increased slurry
solid mass content results in decreased friction loss due to the change in physical
structure of the fibre suspension [17]. This could potentially be the reason the head height
increases with an increase in slurry solid mass content in the centrifugal pump.
Understanding the true reason behind such behavior requires further study of the behavior
of the flow at the pump.
126
Horo [6] reported similar results while pumping 4.8% solid volume content slurry of
paper stock (groundwood fibre-water mixture) using a specifically designed centrifugal
pump (discharge opening diameter = 150 mm, outlet diameter of impeller = 450 mm) at
155 rad/s (1480 rpm). Horo reported an even higher head height (666.6 kPa or 68 meter
of head) than the pumping water (637.2 kPa or 65 meter of head), where efficiency
remained almost unchanged at 25%. Lowering the pump solid content effect (i.e., effect
of solid particles on the pump performance) due to addition/presence of fine particles has
also been reported for conventional solid-liquid pumping systems [2, 5, 53] as early as
1974 when Vocadlo [53] reported a slurry head higher than the water head when
centrifugally pumping a polythene bead-water mixture.
5.3.3.2. Analyzing the Power Consumption of the Centrifugal Slurry Pump
Figs. 5-7(c) and 5-7(d) show the variation of the pump input power with flow rate. The
input power of 6.4 mm-particle slurry (as shown on Fig. 5-7(d)), as well as 3.2 mm- and
19.2 mm-particle mixtures, (a) is behaviorally compatible with typical pump input power
of conventional solid-liquid systems, (b) is noticeably greater than corresponding values
for pure water, and (c) increases with an increase in solid mass content. In contrast, the
input power for <3.2 mm-particle slurry is 83% to 96% smaller than that of water
throughout the entire range of flow rates and solid mass contents. For instance, the
centrifugal pump studied here requires a minimum of 4.5 kW to pump a 2.0% solid mass
content slurry of 6.4 mm wheat straw particles at 185 rad/s (1765 rpm) and 0.0011 m3/s
(1.1 L/s). Keeping the operating conditions constant, the power consumption value
reduces to 3.2 kW for pure water and to 2.7 kW for 2.0% solid mass content slurry of
<3.2 mm wheat straw particles (a 40% reduction). The power consumed in centrifugally
pumping the slurry of <3.2 mm particles of corn stover was measured to compare with
that of <3.2 mm wheat straw particles, where the input power values were all smaller
than corresponding values for pure water too.
While the pump input power is generally proportional to the density of the slurry (Table
5-1), the difference observed for small and large particles is attributed to the various
particle sizes, PSDs, and the rheological behavior of the carrier liquid and the slurry. As
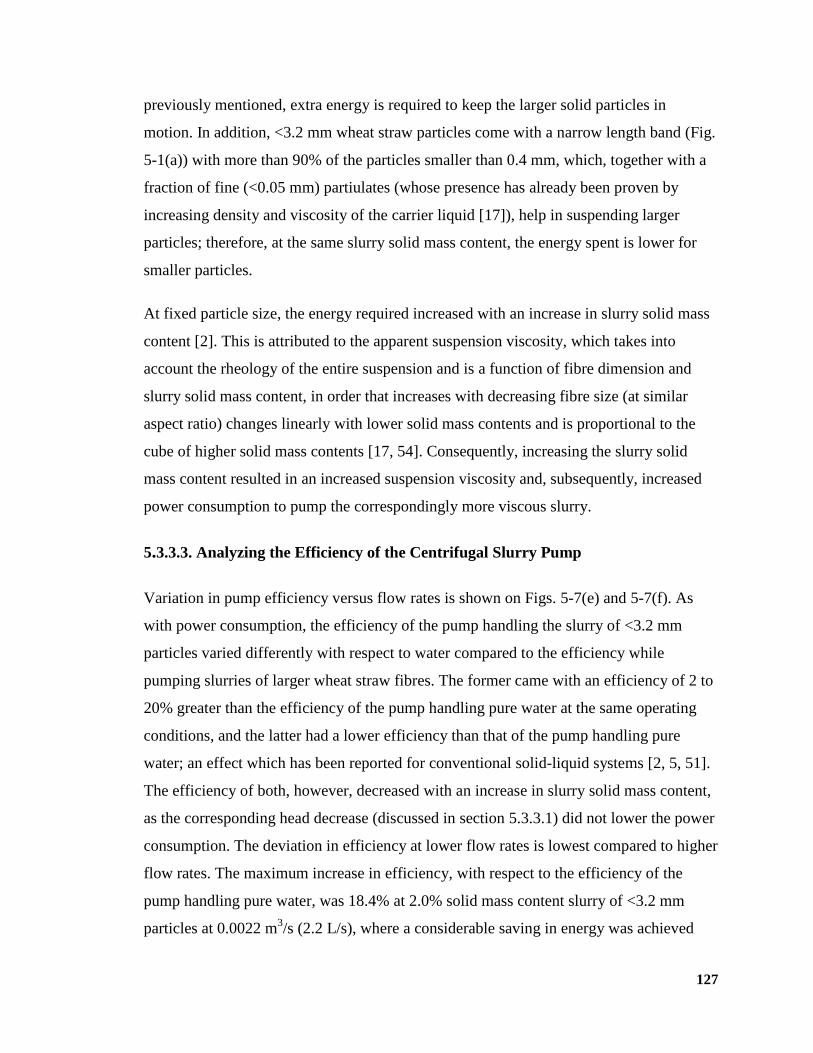
127
previously mentioned, extra energy is required to keep the larger solid particles in
motion. In addition, <3.2 mm wheat straw particles come with a narrow length band (Fig.
5-1(a)) with more than 90% of the particles smaller than 0.4 mm, which, together with a
fraction of fine (<0.05 mm) partiulates (whose presence has already been proven by
increasing density and viscosity of the carrier liquid [17]), help in suspending larger
particles; therefore, at the same slurry solid mass content, the energy spent is lower for
smaller particles.
At fixed particle size, the energy required increased with an increase in slurry solid mass
content [2]. This is attributed to the apparent suspension viscosity, which takes into
account the rheology of the entire suspension and is a function of fibre dimension and
slurry solid mass content, in order that increases with decreasing fibre size (at similar
aspect ratio) changes linearly with lower solid mass contents and is proportional to the
cube of higher solid mass contents [17, 54]. Consequently, increasing the slurry solid
mass content resulted in an increased suspension viscosity and, subsequently, increased
power consumption to pump the correspondingly more viscous slurry.
5.3.3.3. Analyzing the Efficiency of the Centrifugal Slurry Pump
Variation in pump efficiency versus flow rates is shown on Figs. 5-7(e) and 5-7(f). As
with power consumption, the efficiency of the pump handling the slurry of <3.2 mm
particles varied differently with respect to water compared to the efficiency while
pumping slurries of larger wheat straw fibres. The former came with an efficiency of 2 to
20% greater than the efficiency of the pump handling pure water at the same operating
conditions, and the latter had a lower efficiency than that of the pump handling pure
water; an effect which has been reported for conventional solid-liquid systems [2, 5, 51].
The efficiency of both, however, decreased with an increase in slurry solid mass content,
as the corresponding head decrease (discussed in section 5.3.3.1) did not lower the power
consumption. The deviation in efficiency at lower flow rates is lowest compared to higher
flow rates. The maximum increase in efficiency, with respect to the efficiency of the
pump handling pure water, was 18.4% at 2.0% solid mass content slurry of <3.2 mm
particles at 0.0022 m3/s (2.2 L/s), where a considerable saving in energy was achieved
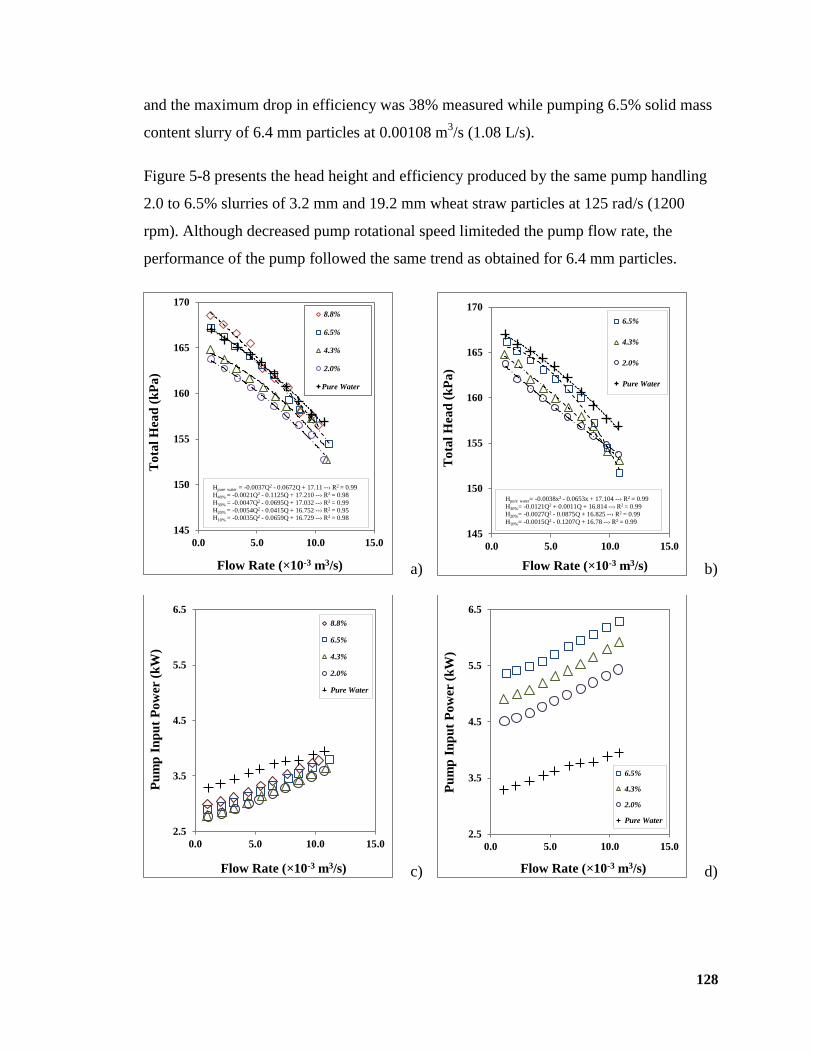
128
and the maximum drop in efficiency was 38% measured while pumping 6.5% solid mass
content slurry of 6.4 mm particles at 0.00108 m3/s (1.08 L/s).
Figure 5-8 presents the head height and efficiency produced by the same pump handling
2.0 to 6.5% slurries of 3.2 mm and 19.2 mm wheat straw particles at 125 rad/s (1200
rpm). Although decreased pump rotational speed limiteded the pump flow rate, the
performance of the pump followed the same trend as obtained for 6.4 mm particles.
a) b)
c) d)
145
150
155
160
165
170
0.0 5.0 10.0 15.0
To
tal
Hea
d (
kP
a)
Flow Rate (×10-3 m3/s)
8.8%
6.5%
4.3%
2.0%
Pure Water
Hpure water = -0.0037Q2 - 0.0672Q + 17.11 --› R2 = 0.99
H40% = -0.0021Q2 - 0.1125Q + 17.210 --› R2 = 0.98
H30% = -0.0047Q2 - 0.0695Q + 17.032 --› R2 = 0.99
H20% = -0.0054Q2 - 0.0415Q + 16.752 --› R2 = 0.95 H10% = -0.0035Q2 - 0.0659Q + 16.729 --› R2 = 0.98
145
150
155
160
165
170
0.0 5.0 10.0 15.0
To
tal
Hea
d (
kP
a)
Flow Rate (×10-3 m3/s)
6.5%
4.3%
2.0%
Pure Water
Hpure water= -0.0038x2 - 0.0653x + 17.104 --› R2 = 0.99
H30%= -0.0121Q2 + 0.0011Q + 16.814 --› R2 = 0.99
H20%= -0.0027Q2 - 0.0875Q + 16.825 --› R2 = 0.99
H10%= -0.0015Q2 - 0.1207Q + 16.78 --› R2 = 0.99
2.5
3.5
4.5
5.5
6.5
0.0 5.0 10.0 15.0
Pu
mp
In
pu
t P
ow
er (
kW
)
Flow Rate (×10-3 m3/s)
8.8%
6.5%
4.3%
2.0%
Pure Water
2.5
3.5
4.5
5.5
6.5
0.0 5.0 10.0 15.0
Pu
mp
In
pu
t P
ow
er (
kW
)
Flow Rate (×10-3 m3/s)
6.5%
4.3%
2.0%
Pure Water
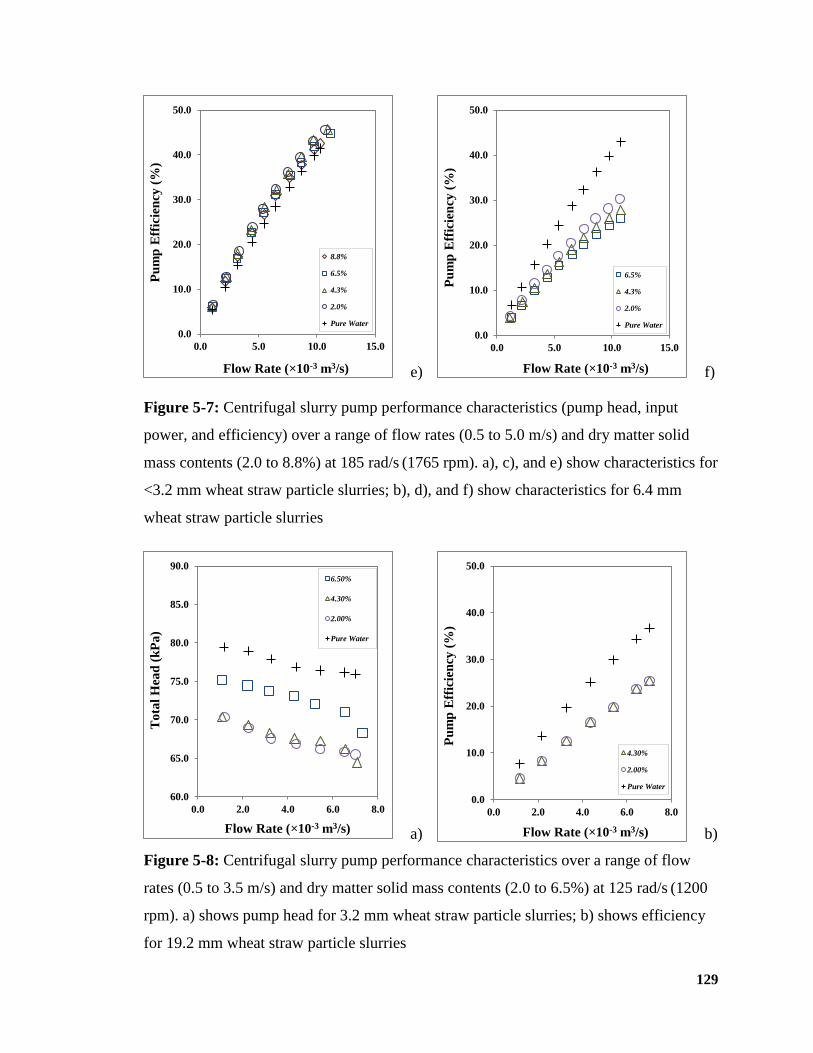
129
e) f)
Figure 5-7: Centrifugal slurry pump performance characteristics (pump head, input
power, and efficiency) over a range of flow rates (0.5 to 5.0 m/s) and dry matter solid
mass contents (2.0 to 8.8%) at 185 rad/s (1765 rpm). a), c), and e) show characteristics for
<3.2 mm wheat straw particle slurries; b), d), and f) show characteristics for 6.4 mm
wheat straw particle slurries
a) b)
Figure 5-8: Centrifugal slurry pump performance characteristics over a range of flow
rates (0.5 to 3.5 m/s) and dry matter solid mass contents (2.0 to 6.5%) at 125 rad/s (1200
rpm). a) shows pump head for 3.2 mm wheat straw particle slurries; b) shows efficiency
for 19.2 mm wheat straw particle slurries
0.0
10.0
20.0
30.0
40.0
50.0
0.0 5.0 10.0 15.0
Pu
mp
Eff
icie
ncy
(%
)
Flow Rate (×10-3 m3/s)
8.8%
6.5%
4.3%
2.0%
Pure Water
0.0
10.0
20.0
30.0
40.0
50.0
0.0 5.0 10.0 15.0
Pu
mp
Eff
icie
ncy
(%
)
Flow Rate (×10-3 m3/s)
6.5%
4.3%
2.0%
Pure Water
60.0
65.0
70.0
75.0
80.0
85.0
90.0
0.0 2.0 4.0 6.0 8.0
To
tal
Hea
d (
kP
a)
Flow Rate (×10-3 m3/s)
6.50%
4.30%
2.00%
Pure Water
0.0
10.0
20.0
30.0
40.0
50.0
0.0 2.0 4.0 6.0 8.0
Pu
mp
Eff
icie
ncy
(%
)
Flow Rate (×10-3 m3/s)
4.30%
2.00%
Pure Water
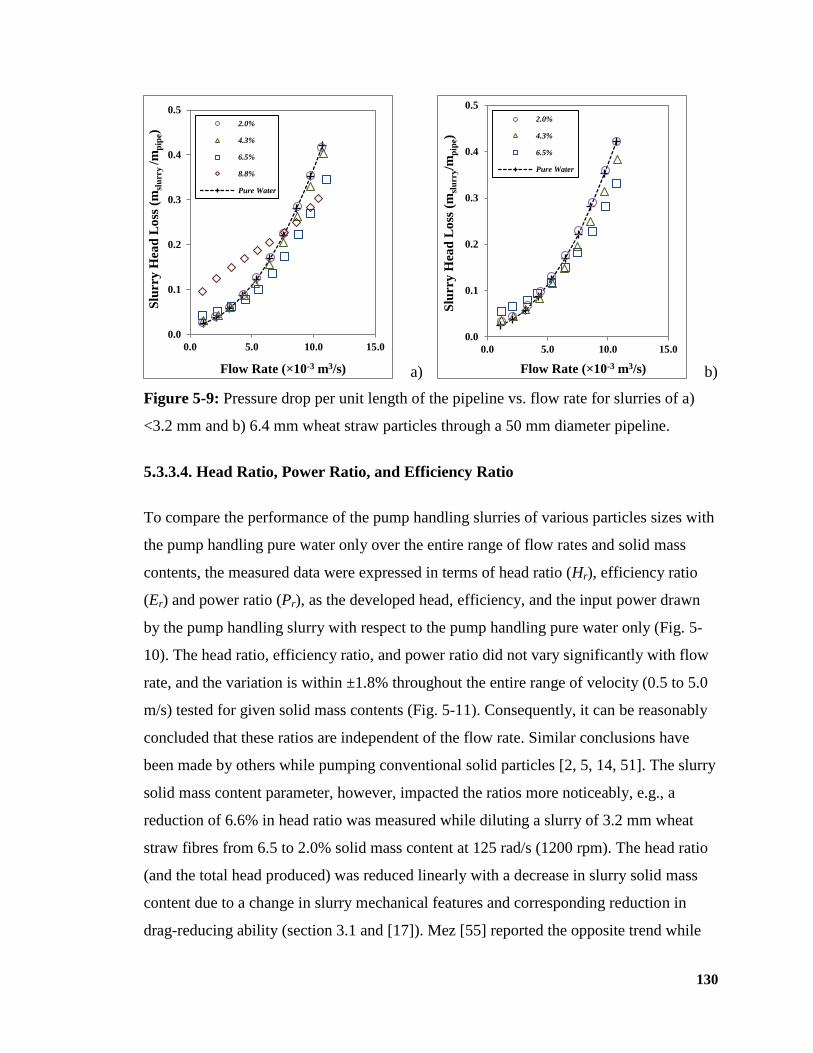
130
a) b)
Figure 5-9: Pressure drop per unit length of the pipeline vs. flow rate for slurries of a)
<3.2 mm and b) 6.4 mm wheat straw particles through a 50 mm diameter pipeline.
5.3.3.4. Head Ratio, Power Ratio, and Efficiency Ratio
To compare the performance of the pump handling slurries of various particles sizes with
the pump handling pure water only over the entire range of flow rates and solid mass
contents, the measured data were expressed in terms of head ratio (Hr), efficiency ratio
(Er) and power ratio (Pr), as the developed head, efficiency, and the input power drawn
by the pump handling slurry with respect to the pump handling pure water only (Fig. 5-
10). The head ratio, efficiency ratio, and power ratio did not vary significantly with flow
rate, and the variation is within ±1.8% throughout the entire range of velocity (0.5 to 5.0
m/s) tested for given solid mass contents (Fig. 5-11). Consequently, it can be reasonably
concluded that these ratios are independent of the flow rate. Similar conclusions have
been made by others while pumping conventional solid particles [2, 5, 14, 51]. The slurry
solid mass content parameter, however, impacted the ratios more noticeably, e.g., a
reduction of 6.6% in head ratio was measured while diluting a slurry of 3.2 mm wheat
straw fibres from 6.5 to 2.0% solid mass content at 125 rad/s (1200 rpm). The head ratio
(and the total head produced) was reduced linearly with a decrease in slurry solid mass
content due to a change in slurry mechanical features and corresponding reduction in
drag-reducing ability (section 3.1 and [17]). Mez [55] reported the opposite trend while
0.0
0.1
0.2
0.3
0.4
0.5
0.0 5.0 10.0 15.0
Slu
rry
Hea
d L
oss
(m
slu
rry /m
pip
e)
Flow Rate (×10-3 m3/s)
2.0%
4.3%
6.5%
8.8%
Pure Water
0.0
0.1
0.2
0.3
0.4
0.5
0.0 5.0 10.0 15.0
Slu
rry
Hea
d L
oss
(m
slu
rry/m
pip
e)
Flow Rate (×10-3 m3/s)
2.0%
4.3%
6.5%
Pure Water
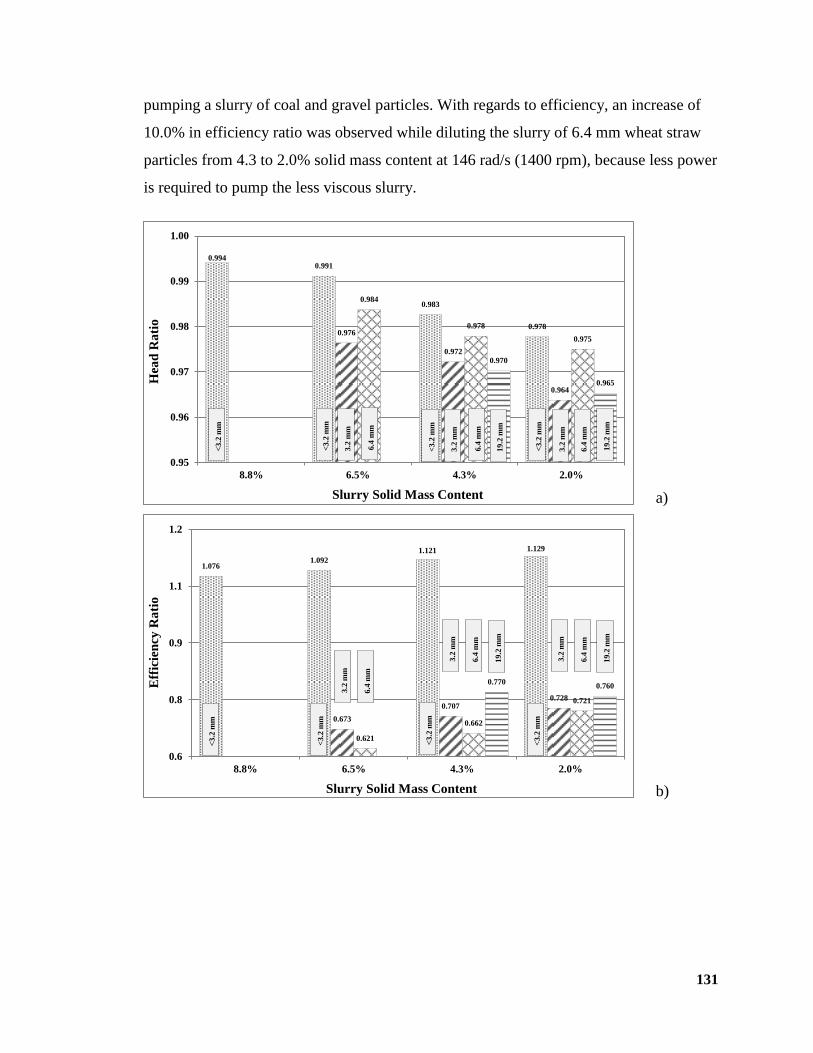
131
pumping a slurry of coal and gravel particles. With regards to efficiency, an increase of
10.0% in efficiency ratio was observed while diluting the slurry of 6.4 mm wheat straw
particles from 4.3 to 2.0% solid mass content at 146 rad/s (1400 rpm), because less power
is required to pump the less viscous slurry.
a)
b)
0.994 0.991
0.983
0.978 0.976
0.972
0.964
0.984
0.978
0.975
0.970
0.965
0.95
0.96
0.97
0.98
0.99
1.00
8.8% 6.5% 4.3% 2.0%
Hea
d R
ati
o
Slurry Solid Mass Content
<3.2
mm
<3.2
mm
3.2
mm
6.4
mm
<3.2
mm
3.2
mm
6.4
mm
19.2
mm
<3.2
mm
3.2
mm
6.4
mm
19.2
mm
1.076 1.092
1.121 1.129
0.673
0.707 0.728
0.621
0.662
0.721
0.770 0.760
0.6
0.8
0.9
1.1
1.2
8.8% 6.5% 4.3% 2.0%
Eff
icie
ncy
Ra
tio
Slurry Solid Mass Content
<3.2
mm
<3.2
mm
<3.2
mm
<3.2
mm
3.2
mm
6.4
mm
3.2
mm
6.4
mm
19.2
mm
3.2
mm
6.4
mm
19.2
mm
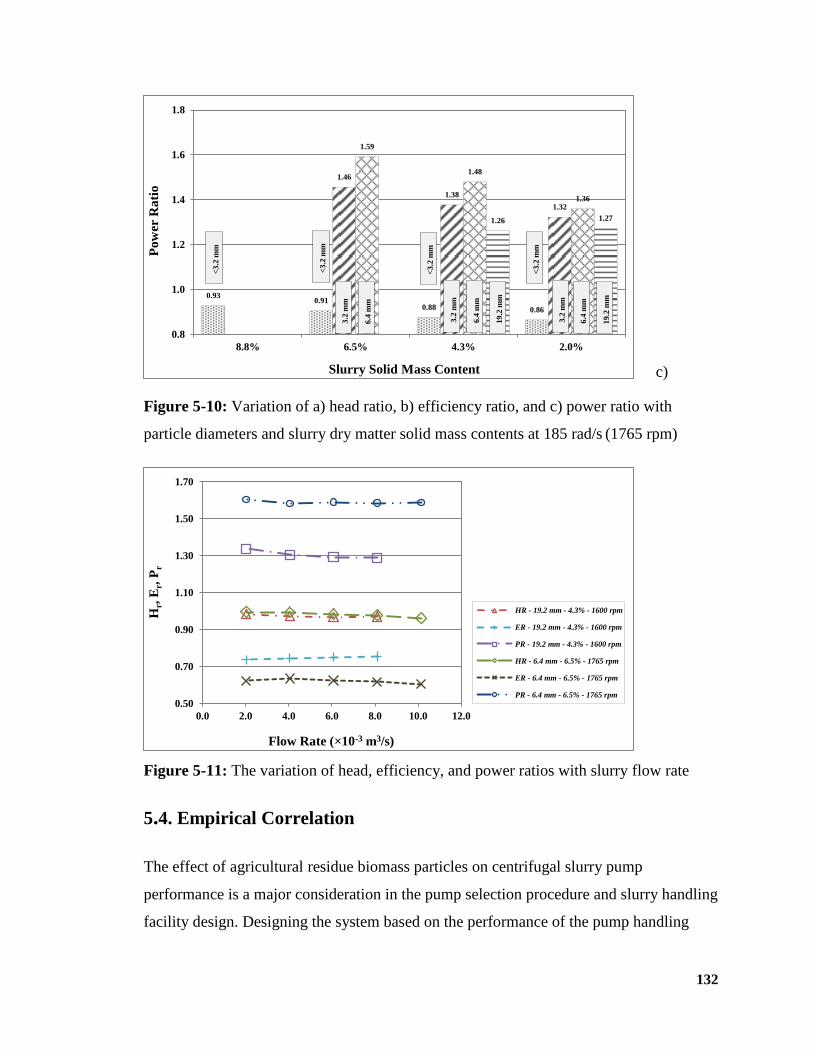
132
c)
Figure 5-10: Variation of a) head ratio, b) efficiency ratio, and c) power ratio with
particle diameters and slurry dry matter solid mass contents at 185 rad/s (1765 rpm)
Figure 5-11: The variation of head, efficiency, and power ratios with slurry flow rate
5.4. Empirical Correlation
The effect of agricultural residue biomass particles on centrifugal slurry pump
performance is a major consideration in the pump selection procedure and slurry handling
facility design. Designing the system based on the performance of the pump handling
0.93 0.91
0.88 0.86
1.46
1.38
1.32
1.59
1.48
1.36
1.26 1.27
0.8
1.0
1.2
1.4
1.6
1.8
8.8% 6.5% 4.3% 2.0%
Po
wer
Ra
tio
Slurry Solid Mass Content
3.2
mm
6.4
mm
19.2
mm
3.2
mm
6.4
mm
19.2
mm
3.2
mm
6.4
mm
<3.2
mm
<3.2
mm
<3.2
mm
<3.2
mm
0.50
0.70
0.90
1.10
1.30
1.50
1.70
0.0 2.0 4.0 6.0 8.0 10.0 12.0
Hr,
Er,
Pr
Flow Rate (×10-3 m3/s)
HR - 19.2 mm - 4.3% - 1600 rpm
ER - 19.2 mm - 4.3% - 1600 rpm
PR - 19.2 mm - 4.3% - 1600 rpm
HR - 6.4 mm - 6.5% - 1765 rpm
ER - 6.4 mm - 6.5% - 1765 rpm
PR - 6.4 mm - 6.5% - 1765 rpm
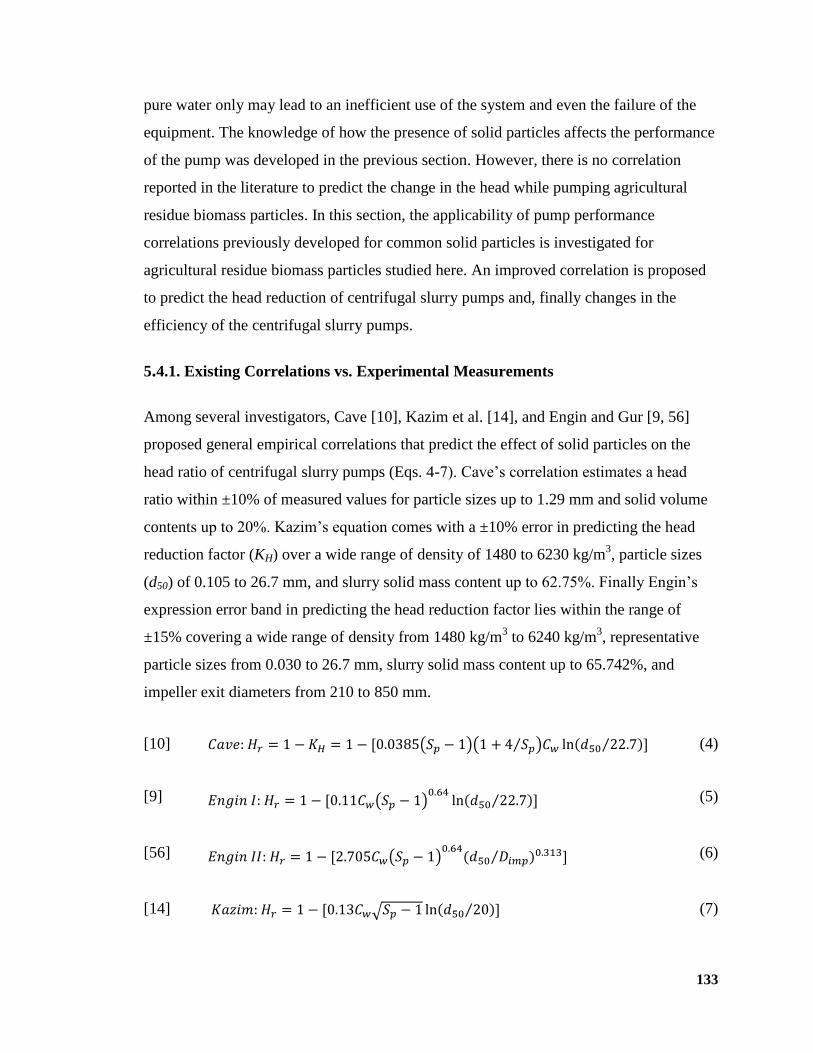
133
pure water only may lead to an inefficient use of the system and even the failure of the
equipment. The knowledge of how the presence of solid particles affects the performance
of the pump was developed in the previous section. However, there is no correlation
reported in the literature to predict the change in the head while pumping agricultural
residue biomass particles. In this section, the applicability of pump performance
correlations previously developed for common solid particles is investigated for
agricultural residue biomass particles studied here. An improved correlation is proposed
to predict the head reduction of centrifugal slurry pumps and, finally changes in the
efficiency of the centrifugal slurry pumps.
5.4.1. Existing Correlations vs. Experimental Measurements
Among several investigators, Cave [10], Kazim et al. [14], and Engin and Gur [9, 56]
proposed general empirical correlations that predict the effect of solid particles on the
head ratio of centrifugal slurry pumps (Eqs. 4-7). Cave’s correlation estimates a head
ratio within ±10% of measured values for particle sizes up to 1.29 mm and solid volume
contents up to 20%. Kazim’s equation comes with a ±10% error in predicting the head
reduction factor (KH) over a wide range of density of 1480 to 6230 kg/m3, particle sizes
(d50) of 0.105 to 26.7 mm, and slurry solid mass content up to 62.75%. Finally Engin’s
expression error band in predicting the head reduction factor lies within the range of
±15% covering a wide range of density from 1480 kg/m3 to 6240 kg/m
3, representative
particle sizes from 0.030 to 26.7 mm, slurry solid mass content up to 65.742%, and
impeller exit diameters from 210 to 850 mm.
[10] ( )( ⁄ ) ⁄ (4)
[9] ( )
⁄ (5)
[56] ( )
⁄ (6)
[14] √ ⁄ (7)

134
In order to examine the applicability of the proposed correlations for slurries of
agricultural residue biomass particles, physical properties of <3.2 mm wheat straw
particles and solid mass contents of corresponding solid-water mixtures (2.0 to 8.8%
solid mass content) were substituted in correlations (4) to (7) and the head ratios
predicted were compared with the head ratios experimentally measured. As observed on
Fig. 5-12, while mathematically predicted and experimentally measured head ratios are
all of the same order of magnitude, the trends are opposite; the head ratio increases with
increasing solid mass contents of agricultural residue biomass slurries, in contrast with
common conventional solid-liquid mixtures. This shows that the head ratio correlations
proposed for conventional solid-liquid mixtures are not applicable to agricultural biomass
slurries.
Figure 5-12: Accuracy of proposed correlations in the literature for prediction of head
ratio of slurries of <3.2 mm wheat straw particles
5.4.2. A modified Empirical Correlation
Centrifugal slurry pump performance data were collected from the literature [9, 10, 13,
15] for a wide variety of conventional solid particles (e.g., sand, coal, iron ore, fly ash)
over a wide range of physical properties of solids, e.g., density (1480 to 6240 kg/m3),
particle size (0.030 to 26.7 mm), and solid mass content (up to 65% solid mass content).
Pump flow rate was not taken into account because, as it was previously concluded, the
0.94
0.96
0.98
1.00
8.8%6.5%4.3%2.0%
Hea
d R
ati
o
Slurry Solid Mass Content
Kazim
Engin I
Cave
Engin II
Experiment
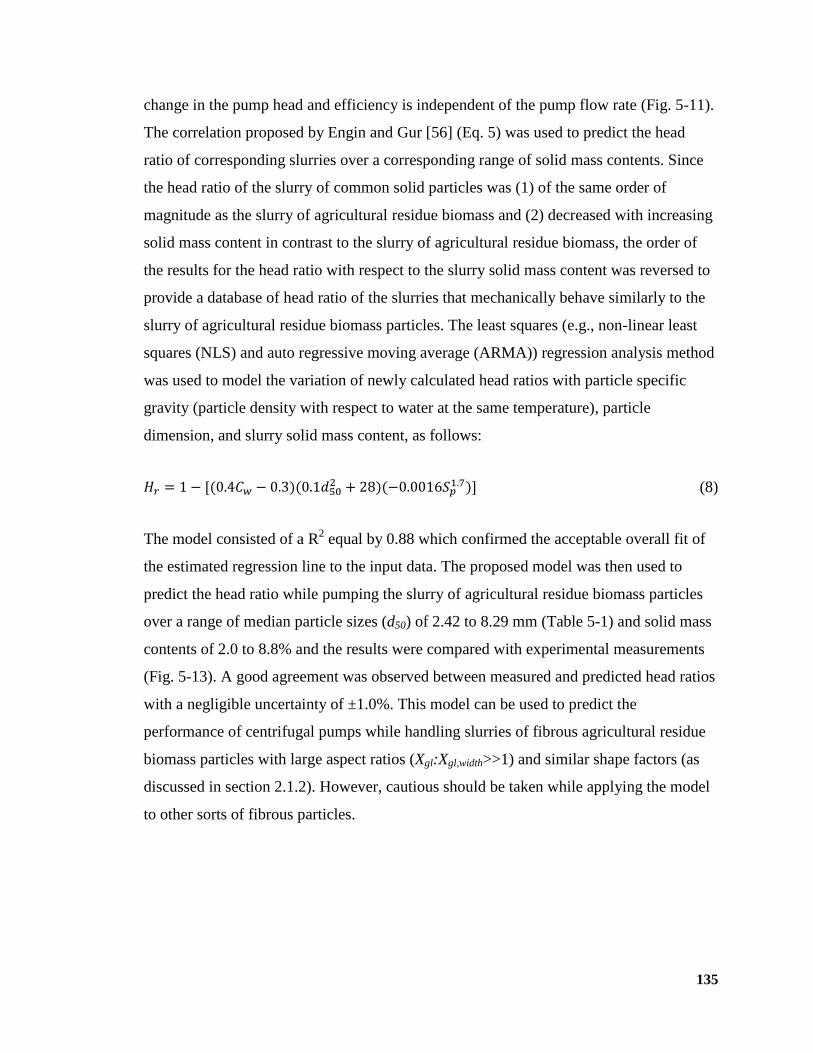
135
change in the pump head and efficiency is independent of the pump flow rate (Fig. 5-11).
The correlation proposed by Engin and Gur [56] (Eq. 5) was used to predict the head
ratio of corresponding slurries over a corresponding range of solid mass contents. Since
the head ratio of the slurry of common solid particles was (1) of the same order of
magnitude as the slurry of agricultural residue biomass and (2) decreased with increasing
solid mass content in contrast to the slurry of agricultural residue biomass, the order of
the results for the head ratio with respect to the slurry solid mass content was reversed to
provide a database of head ratio of the slurries that mechanically behave similarly to the
slurry of agricultural residue biomass particles. The least squares (e.g., non-linear least
squares (NLS) and auto regressive moving average (ARMA)) regression analysis method
was used to model the variation of newly calculated head ratios with particle specific
gravity (particle density with respect to water at the same temperature), particle
dimension, and slurry solid mass content, as follows:
(8)
The model consisted of a R2 equal by 0.88 which confirmed the acceptable overall fit of
the estimated regression line to the input data. The proposed model was then used to
predict the head ratio while pumping the slurry of agricultural residue biomass particles
over a range of median particle sizes (d50) of 2.42 to 8.29 mm (Table 5-1) and solid mass
contents of 2.0 to 8.8% and the results were compared with experimental measurements
(Fig. 5-13). A good agreement was observed between measured and predicted head ratios
with a negligible uncertainty of ±1.0%. This model can be used to predict the
performance of centrifugal pumps while handling slurries of fibrous agricultural residue
biomass particles with large aspect ratios (Xgl:Xgl,width>>1) and similar shape factors (as
discussed in section 2.1.2). However, cautious should be taken while applying the model
to other sorts of fibrous particles.
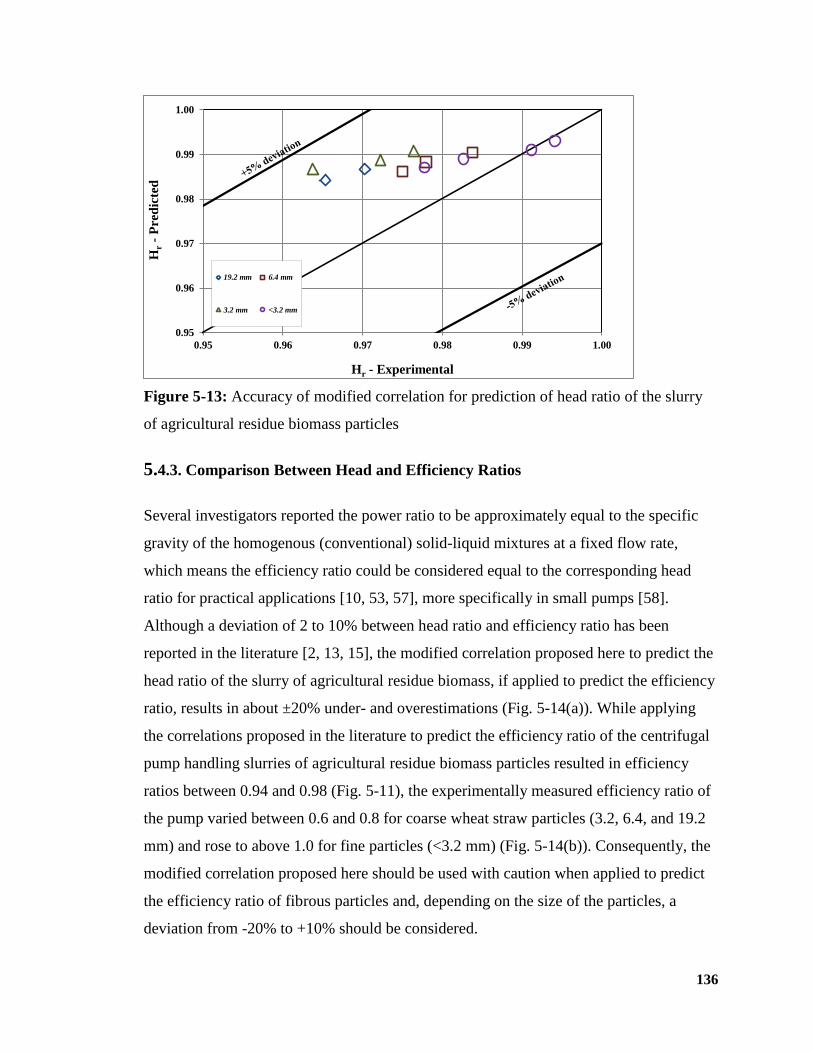
136
Figure 5-13: Accuracy of modified correlation for prediction of head ratio of the slurry
of agricultural residue biomass particles
5.4.3. Comparison Between Head and Efficiency Ratios
Several investigators reported the power ratio to be approximately equal to the specific
gravity of the homogenous (conventional) solid-liquid mixtures at a fixed flow rate,
which means the efficiency ratio could be considered equal to the corresponding head
ratio for practical applications [10, 53, 57], more specifically in small pumps [58].
Although a deviation of 2 to 10% between head ratio and efficiency ratio has been
reported in the literature [2, 13, 15], the modified correlation proposed here to predict the
head ratio of the slurry of agricultural residue biomass, if applied to predict the efficiency
ratio, results in about ±20% under- and overestimations (Fig. 5-14(a)). While applying
the correlations proposed in the literature to predict the efficiency ratio of the centrifugal
pump handling slurries of agricultural residue biomass particles resulted in efficiency
ratios between 0.94 and 0.98 (Fig. 5-11), the experimentally measured efficiency ratio of
the pump varied between 0.6 and 0.8 for coarse wheat straw particles (3.2, 6.4, and 19.2
mm) and rose to above 1.0 for fine particles (<3.2 mm) (Fig. 5-14(b)). Consequently, the
modified correlation proposed here should be used with caution when applied to predict
the efficiency ratio of fibrous particles and, depending on the size of the particles, a
deviation from -20% to +10% should be considered.
0.95
0.96
0.97
0.98
0.99
1.00
0.95 0.96 0.97 0.98 0.99 1.00
Hr
- P
red
icte
d
Hr - Experimental
19.2 mm 6.4 mm
3.2 mm <3.2 mm
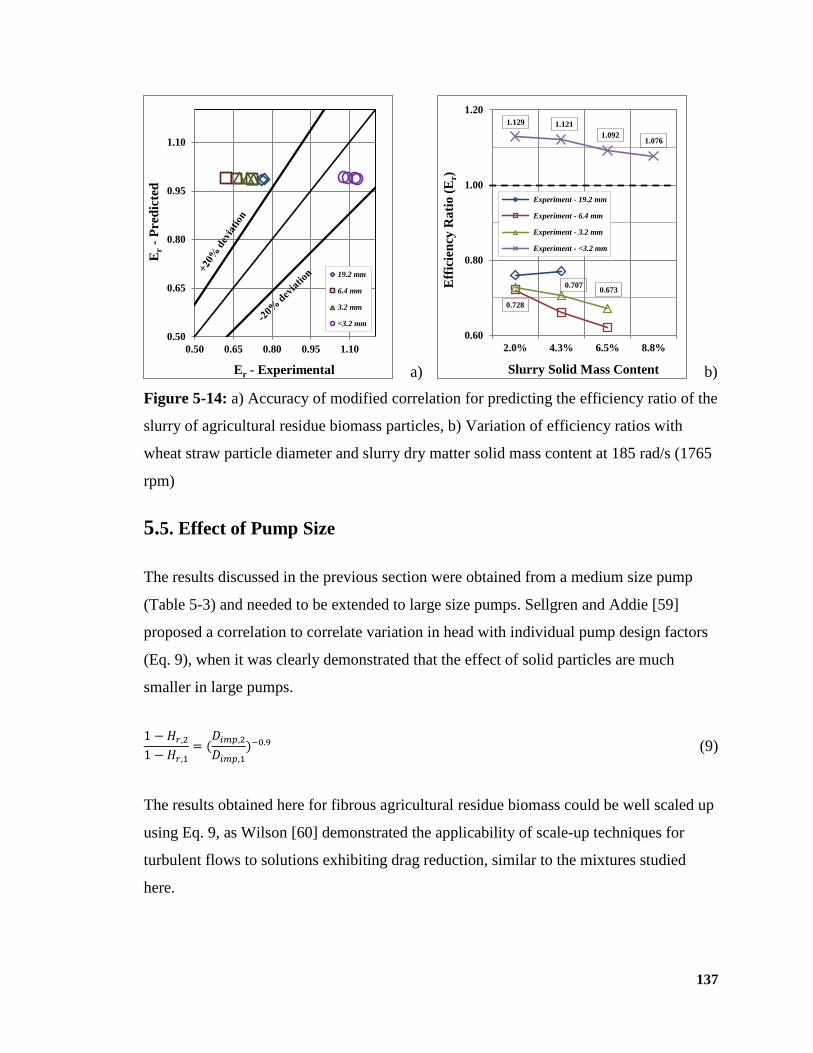
137
a) b)
Figure 5-14: a) Accuracy of modified correlation for predicting the efficiency ratio of the
slurry of agricultural residue biomass particles, b) Variation of efficiency ratios with
wheat straw particle diameter and slurry dry matter solid mass content at 185 rad/s (1765
rpm)
5.5. Effect of Pump Size
The results discussed in the previous section were obtained from a medium size pump
(Table 5-3) and needed to be extended to large size pumps. Sellgren and Addie [59]
proposed a correlation to correlate variation in head with individual pump design factors
(Eq. 9), when it was clearly demonstrated that the effect of solid particles are much
smaller in large pumps.
(9)
The results obtained here for fibrous agricultural residue biomass could be well scaled up
using Eq. 9, as Wilson [60] demonstrated the applicability of scale-up techniques for
turbulent flows to solutions exhibiting drag reduction, similar to the mixtures studied
here.
0.50
0.65
0.80
0.95
1.10
0.50 0.65 0.80 0.95 1.10
Er
- P
red
icte
d
Er - Experimental
19.2 mm
6.4 mm
3.2 mm
<3.2 mm
0.673 0.707
0.728
1.076 1.092
1.121 1.129
0.60
0.80
1.00
1.20
8.8%6.5%4.3%2.0%
Eff
icie
ncy
Ra
tio
(E
r)
Slurry Solid Mass Content
Experiment - 19.2 mm
Experiment - 6.4 mm
Experiment - 3.2 mm
Experiment - <3.2 mm
138
5.6. Conclusion
The effect of wheat straw fibrous agricultural residue biomass slurry on the performance
characteristics of centrifugal slurry pumps was experimentally investigated using a lab-
scale pipeline facility. Pumping a play sand-water mixture through the same closed-
circuit pipeline under similar operating conditions and comparing corresponding friction
loss behavior with that of agricultural residue biomass slurry demonstrated the unique
mechanical behavior of wheat straw-water mixtures. In contrast to all conventional solid-
liquid mixtures, the head increased with an increase in slurry solid mass content for
agricultural biomass slurry. It was observed that by using small size wheat straw fibrous
particles (< 3.2 mm) under known slurry solid mass contents and pump operating
conditions, it is possible to keep the total head and efficiency at the same level as the
pump handling pure water and to reduce the power consumption to below that required
for pumping pure water alone. Finally, a correlation was developed to predict the
reduction in head of the centrifugal slurry pumps while handling agricultural residue
biomass slurries, with respect to the head produced while handling pure water. The
results obtained here could be used in the design and handling of pumps and pipelines in
the hydro-transport of fibrous agricultural residue biomass and similar solid particles.
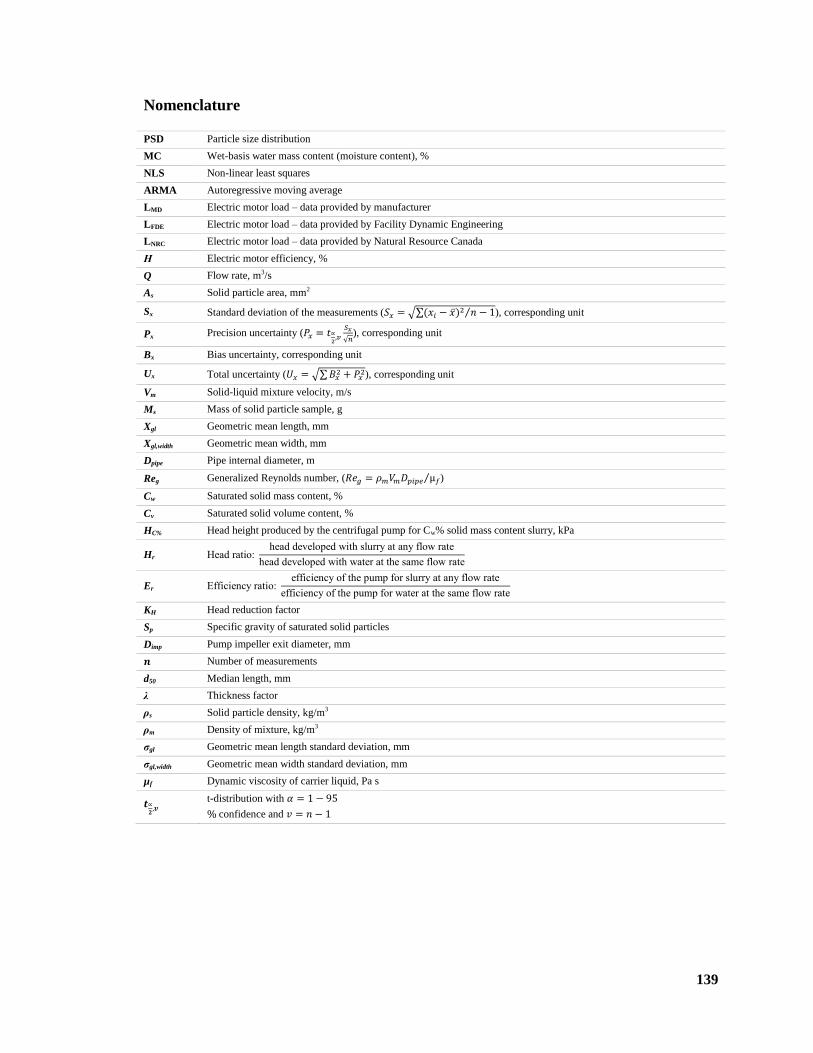
139
Nomenclature
PSD Particle size distribution
MC Wet-basis water mass content (moisture content), %
NLS Non-linear least squares
ARMA Autoregressive moving average
LMD Electric motor load – data provided by manufacturer
LFDE Electric motor load – data provided by Facility Dynamic Engineering
LNRC Electric motor load – data provided by Natural Resource Canada
Η Electric motor efficiency, %
Q Flow rate, m3/s
As Solid particle area, mm2
Sx Standard deviation of the measurements ( √∑ ⁄ ), corresponding unit
Px Precision uncertainty (
√ ), corresponding unit
Bx Bias uncertainty, corresponding unit
Ux Total uncertainty ( √∑
), corresponding unit
Vm Solid-liquid mixture velocity, m/s
Ms Mass of solid particle sample, g
Xgl Geometric mean length, mm
Xgl,width Geometric mean width, mm
Dpipe Pipe internal diameter, m
Reg Generalized Reynolds number, ( ⁄ )
Cw Saturated solid mass content, %
Cv Saturated solid volume content, %
HC% Head height produced by the centrifugal pump for Cw% solid mass content slurry, kPa
Hr ead ratio: head developed with slurry at any flow rate
head developed with water at the same flow rate
Er Efficiency ratio: efficiency of the pump for slurry at any flow rate
efficiency of the pump for water at the same flow rate
KH Head reduction factor
Sp Specific gravity of saturated solid particles
Dimp Pump impeller exit diameter, mm
Number of measurements
d50 Median length, mm
λ Thickness factor
ρs Solid particle density, kg/m3
ρm Density of mixture, kg/m3
σgl Geometric mean length standard deviation, mm
σgl,width Geometric mean width standard deviation, mm
µf Dynamic viscosity of carrier liquid, Pa s
t-distribution with
confidence and
140
References
[1] Kumar, A., Cameron, J.B., Flynn, P.C. Large-scale ethanol fermentation through
pipeline delivery of biomass. Applied Biochemistry and Biotechnology, 2005; 121: 47-
58.
[2] Gandhi, B.K., Singh, S.N., Seshadri, V. Performance characteristics of centrifugal
slurry pumps. Journal of Fluids Engineering-Transactions of the Asme, 2001; 123: 271-
80.
[3] Horo, K., Niskanen, T. Centrifugal Pumps - Research on Pumping Paper Stock.
Tappi, 1978; 61: 67-70.
[4] Kazim, K.A., Maiti, B., Chand, P. Effect of drag reducing polymers on the
performance characteristics of centrifugal pumps handling slurries. Journal of Polymer
Materials, 1997; 14: 245-50.
[5] Sellgren, A., Addie, G., Scott, S. The effect of sand-clay slurries on the
performance of centrifugal pumps. Canadian Journal of Chemical Engineering, 2000; 78:
764-69.
[6] Horo, K., Niskanen, T. Pumping paper stock efficiently. Pumps-Pompes-Pumpen,
1979; 156: 427-29.
[7] Fairbank, L.C. Effect on the characteristics of centrifugal pumps. Solids in
Suspension Symposium; 1942.
[8] Wiedenroth, W. The influence of sand and gravel on the characteristics of
centrifugal pumps, some aspects of wear in hydraulic transportation installations. 1st
International Conference on the Hydraulic Transport of Solids in Pipes; 1970.
[9] Engin, T., Gur, M. Comparative evaluation of some existing correlations to
predict head degradation of centrifugal slurry pumps. Journal of Fluids Engineering-
Transactions of the Asme, 2003; 125: 149-57.
[10] Cave, I. Effects of suspended solids on the performance of centrifugal pumps.
Hydrotransport 4: BHRA Fluid Engineering 1976, p. 35-52.
[11] Burgess, K.E., Reizes, J.A. Effect of sizing, specific gravity, and concentration on
the performance of the centrifugal slurry pump. Institution of Mechanical Engineers
(London), 1976; 190: 391-99.
141
[12] Sellgren, A. Performance of a centrifugal pump when pumping ores and industrial
minerals Hydrotransport, 1979; 1: 291-304.
[13] Gahlot, V.K., Seshadri, V., Malhotra, R.C. Effect of Density, Size Distribution,
and Concentration of Solid on the Characteristics of Centrifugal Pumps. Journal of Fluids
Engineering-Transactions of the Asme, 1992; 114: 386-89.
[14] Kazim, K.A., Maiti, B., Chand, P. A correlation to predict the performance
characteristics of centrifugal pumps handling slurries. Proceedings of the Institution of
Mechanical Engineers Part a-Journal of Power and Energy, 1997; 211: 147-57.
[15] Kazim, K.A., Maiti, B., Chand, P. Effect of particle size, particle size distribution,
specific gravity and solids concentration on centrifugal pump performance. Powder
Handling and Processing, 1997; 9: 27-32.
[16] Vaezi, M., Pandey, V., Kumar, A., Bhattacharyya, S. Lignocellulosic biomass
particle shape and size distribution analysis using digital image processing for pipeline
hydro-transportation. Biosystems Engineering, 2013; 114: 97-112.
[17] Vaezi, M., Katta, A.K., Kumar, A. Investigation into the mechanisms of pipeline
transport of slurries of wheat straw and corn stover to supply a bio-refinery. Biosystems
Engineering, 2014; 118: 52-67.
[18] Duffy, G.G. measurement, mechanisms, and models: some important insights into
the mechanisms of flow of fibre suspensions. Annula Transaction of Nordic Rheology
Society, 2006; 14: 19-31.
[19] Duffy, G.G., Titchener, A.L., Lee, P.F.W., Moller, K. The mechanism of flow of
pulp suspensions in pipes. Appita, 1976; 29: 363-70.
[20] Paul, T., Duffy, G., Chen, D. New insights into the flow of pulp suspensions.
Tappi Solutions, 2001; 1.
[21] Duffy, G.G., Lee, P.F.W. Drag reduction in turbulent flow of wood pulp
suspensions. Appita, 1978; 31: 280-86.
[22] Lee, P.F.W., Duffy, G.G. Analysis of drag reducing regime of pulp suspension
flow. Tappi, 1976 (a); 59: 119-22.
[23] Bobkowic, A., Gauvin, W.H. Turbulent flow characteristics of model fibre
suspensions. Canadian Journal of Chemical Engineering, 1965; 43: 87-91.
142
[24] Duffy, G.G., Moller, K., Titchene.Al. Determination of Pipe Friction Loss.
Appita, 1972; 26: 191-95.
[25] Fock, H., Claesson, J., Rasmuson, A., Wikstrom, T. Near wall effects in the plug
flow of pulp suspensions. Canadian Journal of Chemical Engineering, 2011; 89: 1207-16.
[26] Lee, P.F.W., Duffy, G.G. Velocity profiles in drag reducing regime of pulp
suspension flow. Appita, 1976 (b); 30: 219-26.
[27] Moller, K., Duffy, G.G., A., T. Laminar plug flow regime of paper pulp
suspensions in pipes. Svensk Papperstidning-Nordisk Cellulosa, 1971; 74: 829-34.
[28] Luk, J., Mohammadabadi, H.S., Kumar, A. Pipeline transport of biomass:
Experimental development of wheat straw slurry pressure loss gradients Biomass and
Bioenergy, 2014.
[29] Scandinavian Pulp, Paper and Board Testing Committee. SCAN CM 40:88.
Stockholm, Sweden.
[30] Technical Association of the Pulp and Paper Industry (TAPPI). Usefull methods
No. 21. 2010.
[31] American Society of Agricultural and Biological Engineers (ASABE). Moisture
measurement for forages. Standard S3582 St. Joseph, MI, US; 2008.
[32] American Society for Testing and Materials (ASTM). Standard test method for
density, relative density, and absorption of coarse aggregate. ASTM, Designation C127;
2012.
[33] Rasband, W.S. http://rsb.info.nih.gov/ij/index.html, U.S. National Institutes of
Health, Accessed September 2011. 2008.
[34] Kwan, A.K.H., Mora, C.F., Chan, H.C. Particle shape analysis of coarse
aggregate using digital image processing. Cement and Concrete Research, 1999; 29:
1403-10.
[35] Godwin Pumps, http://www.godwinpumps.com/en/index.php/godwin-
products/cd-range/cd80m/, Accessed Feb. 2014.
[36] Sulzer Pumps - Chapter three - Acceptance tests with centrifugal pumps.
Centrifugal Pump Handbook (Third Edition). Oxford: Butterworth-Heinemann; 2010, p.
69-88.
143
[37] Bureau of Indian Standards (BIS). Technical requirements for rotodynamic
special purpose pumps, IS: 5120. Government of India; 1977.
[38] U.S. Department of Energy, Advanced Manufacturing Office. Adjustable speed
drive part-load efficiency Motor systems tip sheet#11. Washington, DC; 2012.
[39] SIL Industrial Minerals Inc.,
http://www.sil.ab.ca/images/stories/pdf/Products/playsand.pdf, Accessed: Jan, 2014.
[40] Lee, P.F.W., Duffy, G.G. Relationships between Velocity Profiles and Drag
Reduction in Turbulent Fiber Suspension Flow. Aiche Journal, 1976; 22: 750-53.
[41] Matousek, V. Pressure drops and flow patterns in sand-mixture pipes.
Experimental Thermal and Fluid Science, 2002; 26: 693-702.
[42] Sheth, K.K., Morrison, G.L., Peng, W.W. Slip factors of centrifugal slurry pumps.
Journal of Fluids Engineering-Transactions of the Asme, 1987; 109: 313-18.
[43] United States Department of Energy. Energy Policy Act of 1992,
https://www1.eere.energy.gov/femp/regulations/epact1992.html, Accessed: May, 2013.
1992.
[44] National Electrical Manufacturer Association (NEMA). The NEMA Premium™
efficiency electric motor program. The NEMA Premium™ efficiency levels MG 1-
2003, Tables 12-12 and 12-13: NEMA Standards Publication; 2003.
[45] Natural Resources Canada (NRC). Technical fact sheet, Premium efficiency
motors, Catalog No. M144-21/2003E. Office of Energy Efficiency, NRC; 2004.
[46] Sellers, D. Variable Frequency Drive System Efficiency – Part 1, Facility
Dynamic Engineering, http://av8rdas.wordpress.com/2010/12/18/variable-frequence-
drive-system-efficiency, Accessed: May, 2013. 2013.
[47] Nailen, R.L. Just how important is drive motor efficiency? Chicago: Barker
Publications, Inc.; 2002.
[48] Center for Energy Efficiency and Renewable Energy (CEERE). Electric Motor
Systems. Industrial Assessment Center (IAC): University of Massachusetts, Amherst;
2006.
[49] Wallbom-Carlson, A. Energy comparison. VFD vs. on-off controlled pumping
stations. Scientific impeller, ITT Flygt AB, 1998: 29-32.
144
[50] Internatinal Standards Organization (ISO), Guidance for the use of repeatability,
reproducibility and trueness estimates in measurement uncertainty estimation, ISO
21748:2010(E). 2010.
[51] Wilson, K.C., Addie, G.R., Sellgren, A., Clift, R. Slurry transport using
centrifugal pumps Third ed. New York, NY, USA: Springer; 2006.
[52] Yadeta, R., Durst, R.E. The behavior of gas-water-fiber systems in centrifugal
pumps. Hydrotransport 1. Coventry, UK; 1970.
[53] Vocadlo, J.J., Koo, J.K., Prang, A.J. Performance of centrifugal pumps in slurry
service. Hydrotransport 3: BHRA Fluid Engineering 1974, p. MAY 15-7, 1974.
[54] Djalili-Moghaddam, M., Toll, S. Fibre suspension rheology: effect of
concentration, aspect ratio and fibre size. Rheologica Acta, 2006; 45: 315-20.
[55] Mez, W. The influence of solids concentration, solids density and grain size
distribution on the working behaviour of centrifugal pumps. Hydrotransport 9: BHRA
Fluid Engineering; 1984, p. 345-58.
[56] Engin, T., Gur, M. Performance characteristics of a centrifugal pump impeller
with running tip clearance pumping solid-liquid mixtures. Journal of Fluids Engineering-
Transactions of the Asme, 2001; 123: 532-38.
[57] Wilson, G. Effect of slurries on centrifugal pump performance Fourth
International Pump Symposium. Houston, TX, USA; 1987, p. 19-25.
[58] Sellgren, A., Addie, G.R. Solid effects on characteristics of centrifugal slurry
pumps Hydrotransport 12. Belgium; 1993, p. 3-18.
[59] Sellgren, A., Addie, G. Effect of solids on large centrifugal pump head and
efficiency. CEDA Dredging Day. Netherlands; 1989.
[60] Wilson, K.C. Two mechanisms for drag reduction. Drag reduction in fluid flows :
techniques for friction control. Ed. Sellin H.R.J. and Moses, R.T.,. New York, NY, USA:
Chichester 1989.
145
CHAPTER 6
Development of Correlations for the Flow of Agricultural
Residue Biomass Slurries in Pipes1
6.1. Introduction
There have been few studies conducted on techno-economic analysis of pipelining
lignocellulosic biomass which have compared the cost of pipeline hydro-transport with
truck delivery [1-3]. However, these studies were based on the assumption that the
pressure drop in the pipeline transport of agricultural residues slurries (i.e., chopped
agricultural residue biomass-water mixture) was same as the pipeline transport of wood
chip-water mixtures. At that time there was no information available, either in terms of
experimental results or empirical correlations, on the pipeline hydro-transport of
agricultural residue biomass. Recently Luk et al. [4] and Vaezi et al. [5-7] experimentally
investigated pipeline hydro-transport of wheat straw and corn stover in a 25 m long and
50 mm diameter closed-circuit lab-scale pipeline facility. They studied wheat straw and
corn stover morphology and its impact on mechanical behavior and frictional pressure
gradients of corresponding solid-water mixtures (slurries) in pipeline [5], studied the
mechanical feasibility of agricultural residue biomass pipeline hydro-transport,
investigated friction loss behavior of wheat straw and corn stover slurries through
pipelines [6], and evaluated the performance of centrifugal slurry pumps while handling
agricultural residue biomass slurries [7].
To design an industrial scale pipeline for hydro-transport of agricultural residue biomass,
it is necessary to understand how the slurry pressure gradient changes with slurry
specifications (i.e., biomass type, particle size, slurry solid mass content (concentration),
and slurry temperature) and operating conditions (i.e., pumping velocity, pipe diameter,
and pipe roughness). This knowledge is essential to size the slurry pumps, determine the
number of booster stations, and estimate the capital and operational costs of the slurry
1 Paper submitted to the Journal of Biosystems Engineering, 2014
146
pipeline and hence the overall cost of pipeline hydro-transport of agricultural residue
biomass. Therefore, the experimental measurements and governing rules obtained in the
lab-scale pipeline facility need to be modeled and corresponding correlations accordingly
developed before these can be applied to a large-scale pipeline. Since the mechanisms of
the flow of agricultural residue biomass slurries in pipes were found to be unique,
different from wood chips slurries, and predominantly similar to those of the synthetic
and natural fibres, e.g., wood pulp fibre suspensions2 [6, 7], the empirical models,
theoretical correlations, and scale-up methods proposed for the flow of synthetic and
natural fibres in pipes (mainly wood pulp suspensions) were considered here to help
develop correlations for the flow of agricultural residue biomass slurry in pipes.
Unlike agricultural residue biomass slurry flows, the flow of wood chips and wood pulp
fibre suspensions have been extensively studied, and several empirical and theoretical
models have been developed to predict the corresponding pressure gradients through
pipelines. Following an experimental study on pipeline hydro-transport of spruce and
balsam fir wood chips over a 160 m long and 200 mm diameter aluminum pipeline,
Elliott and de Montmorency [8, 9] modified the Durand universal equation (a general
correlation presented to estimate the friction loss in solid-liquid pipelines) [10] and
presented an empirical correlation for estimating friction loss in wood chip-water
mixtures in pipes. Hunt [11] experimentally studied hydro-transport of plate shape wood
chips of lodgepole pine in 200 and 300 mm diameters and 91 m and 183 m long steel
pipes and proposed a correlation to predict the mixture friction loss as a function of four
dimensionless parameters including mixture solid volume content and particle-to-pipe
size ratio. Moller et al. [12] proposed a design correlation to predict the friction loss of
chemically prepared wood pulp suspensions as a function of suspension velocity,
suspension solid mass content, and pipe diameter for several kraft pulps in 50, 75, and
100 mm diameter pipes. Duffy et al. [13] obtained pressure gradient correlations for
groundwood, semi-chemical, and refiner pulps as a function of suspension solid mass
content, suspension velocity, and pipe diameter. They also investigated the effect of
suspension temperature, fibre aspect ratio, and pipe roughness on suspension pressure
2 The terms slurry, mixture, and suspension are used interchangeably
147
gradient, where the pressure gradient was found to decrease by an average of 1.0% for
each degree Celsius increase in temperature. Moller [14] proposed a new dimensionless
representation of pipe friction data to correlate accurately the flow data for a given
chemical pulp on a single diagram with respect to pipe roughness and irrespective of
variables such as suspension velocity, solid mass content, and pipe diameter. Duffy [15]
presented two design methods for determining the pipe pressure gradient components for
the pulp suspension flows together with the basic design correlations. Correlations were
derived to obtain optimum fibre mass content for an existing piping system and the
optimum pipe diameter for a new pipeline system. Finally, the Technical Association of
the Pulp and Paper Industry (TAPPI) issued a Technical Information Paper (TIP) in 1981,
which was revised in 2007 [16], to provide friction loss correlations for pulp suspension
flows obtained based upon laboratory experiments, pulp mill piping systems, and the
research work done by Duffy et al. [12, 13, 17, 18].
Several researchers specifically studied the techniques to scale up slurry pressure
gradients obtained in small pipe diameters to larger pipe diameters. Among those, Bowen
[19] presented a complete design procedure for scaling up the results of a solid-liquid
mixture flow at a particular solid mass content in small diameter pipes to large diameter
pipes in both laminar and turbulent regimes, Sauermann and Webster [20] at the National
Mechanical Engineering Research Institute in Pretoria proposed a method that requires
only experimental results for one pipe diameter to predict the pressure gradient in pipes
with smaller or larger diameters, Thomas [21, 22] discussed a scale-up technique that
requires the experimental results in more than one pipe diameter to predict the pressure
gradient in pipes with larger diameters only, and Lokon et al. [23] modified Bowen’s
correlation by including the effect of a change in slurry solid mass content on pressure
gradients in iron ore slurry pipe flows.
The present research attempts to achieve two objectives: (1) to develop an empirical
correlation (based on experimental measurements taken in the laboratory scale pipeline)
to predict longitudinal pressure gradients of the flow of the slurry of agricultural residue
biomass (of any fibrous agricultural residue biomass type, biomass particle diameter, and
slurry solid mass content over commercial slurry velocity ranges) in a 50 mm diameter
148
pipeline and (2) to scale up the pressure gradient correlation to account for pipe diameters
larger than 50 mm. Finally, a comprehensive model will be developed that is capable of
predicting longitudinal pressure gradients of various agricultural residue biomass slurries
at a variety of slurry specifications, operating conditions, and pipe diameters.
6.2. Experimental Methodology
6.2.1. Feedstock Properties and Preparation
Through the course of experimental investigation, agricultural residue biomass of wheat
straw (Triticum sativum; dry stalks of wheat) and corn stover (Zea mays;
leaves and stalks of corn) were collected, knife-milled, and classified into four size
groups with nominal diameters of 19.2 mm (0.75″), 6.4 mm (0.25″), 3.2 mm (0.125″),
and <3.2 mm (<0.125″). The initial wet-basis water mass content (moisture content or
MC) and specific gravity of wheat straw and corn stover particles were measured
according to ASABE S358.2 [24] and ASTM C127 [25] standards to be 6 ± 0.5% and 0.9
± 0.01, respectively.
6.2.2. Image Processing and Morphological Studies
Unusual characteristics (e.g., relatively large mean particle size; wide size distribution;
fibrous, pliable, flexible, and asymmetric nature; potential for forming networks) make
agricultural residue biomass particles atypical [26] and distinguish their corresponding
slurry from classical solid-liquid systems [6]. The ImageJ digital image processing
platform [27], together with a user-coded plugin developed by the authors [5], was used
to study unusual characteristics and morphological features (particle shapes, particle
dimensions, particle size distribution (PSD), size distribution algorithms, particle surface
features, etc.) of knife-milled pre-classified wheat straw and corn stover particles [5].
Figure 6-1 compares normal size distribution of wheat straw and corn stover particles.
Standard dimensions of significance [28] – median length (d50); geometric mean length
(Xgl), width (Xgw), and thickness (Xgth); and corresponding standard deviations (σgl, σgw,
σgth) – are presented in Table 6-1, together with a few characteristics of common classical
solid particles for comparison.
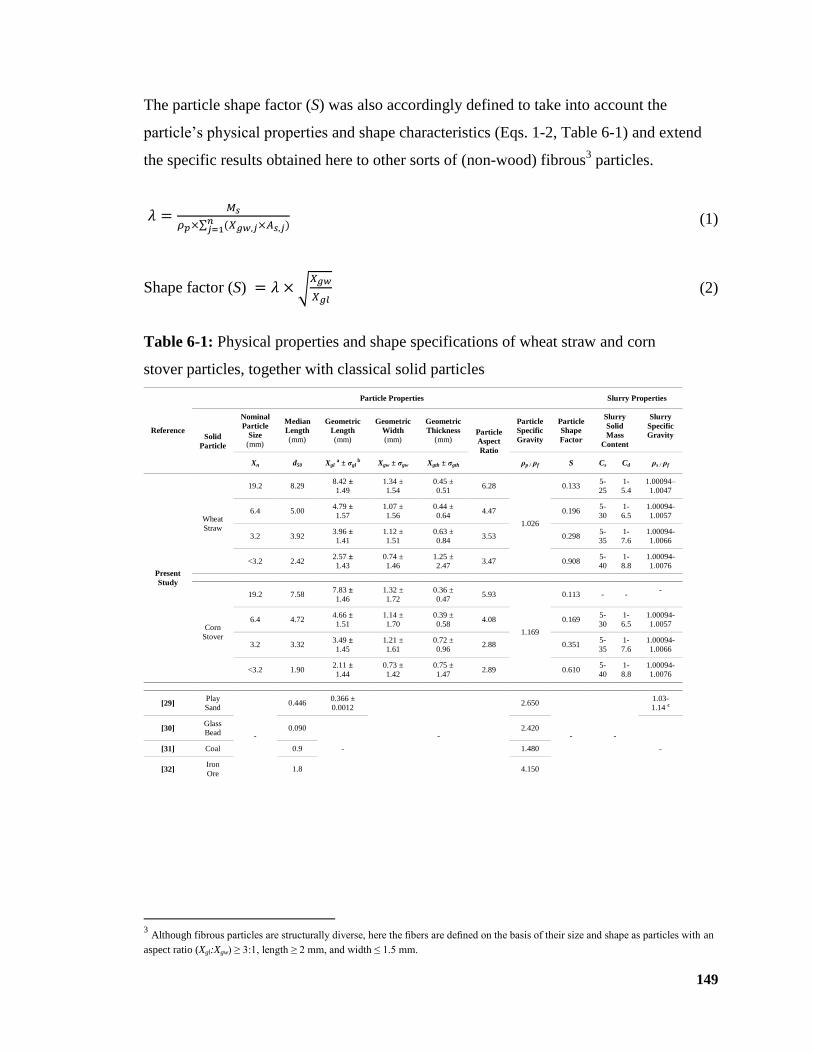
149
The particle shape factor (S) was also accordingly defined to take into account the
particle’s physical properties and shape characteristics (Eqs. 1-2, Table 6-1) and extend
the specific results obtained here to other sorts of (non-wood) fibrous3 particles.
∑
(1)
Shape factor (S) √
(2)
Table 6-1: Physical properties and shape specifications of wheat straw and corn
stover particles, together with classical solid particles
Reference
Particle Properties Slurry Properties
Solid
Particle
Nominal
Particle
Size
(mm)
Median
Length
(mm)
Geometric
Length
(mm)
Geometric
Width
(mm)
Geometric
Thickness
(mm) Particle
Aspect
Ratio
Particle
Specific
Gravity
Particle
Shape
Factor
Slurry
Solid
Mass
Content
Slurry
Specific
Gravity
Xn d50 Xgl a ± σgl
b Xgw ± σgw Xgth ± σgth ρp / ρf S Cs Cd ρs / ρf
Present
Study
Wheat
Straw
19.2 8.29 8.42 ±
1.49
1.34 ±
1.54
0.45 ±
0.51 6.28
1.026
0.133 5-
25
1-
5.4
1.00094–
1.0047
6.4 5.00 4.79 ±
1.57
1.07 ±
1.56
0.44 ±
0.64 4.47 0.196
5-
30
1-
6.5
1.00094-
1.0057
3.2 3.92 3.96 ±
1.41
1.12 ±
1.51
0.63 ±
0.84 3.53 0.298
5-
35
1-
7.6
1.00094-
1.0066
<3.2 2.42 2.57 ±
1.43
0.74 ±
1.46
1.25 ±
2.47 3.47 0.908
5-
40
1-
8.8
1.00094-
1.0076
Corn
Stover
19.2 7.58 7.83 ±
1.46
1.32 ±
1.72
0.36 ±
0.47 5.93
1.169
0.113 - - -
6.4 4.72 4.66 ±
1.51
1.14 ±
1.70
0.39 ±
0.58 4.08 0.169
5-
30
1-
6.5
1.00094-
1.0057
3.2 3.32 3.49 ±
1.45
1.21 ±
1.61
0.72 ±
0.96 2.88 0.351
5-
35
1-
7.6
1.00094-
1.0066
<3.2 1.90 2.11 ±
1.44
0.73 ±
1.42
0.75 ±
1.47 2.89 0.610
5-
40
1-
8.8
1.00094-
1.0076
[29] Play
Sand
-
0.446 0.366 ±
0.0012
-
2.650
- -
1.03-
1.14 c
[30] Glass
Bead 0.090
-
2.420
- [31] Coal 0.9 1.480
[32] Iron
Ore 1.8 4.150
3 Although fibrous particles are structurally diverse, here the fibers are defined on the basis of their size and shape as particles with an
aspect ratio (Xgl:Xgw) ≥ 3:1, length ≥ 2 mm, and width ≤ 1.5 mm.
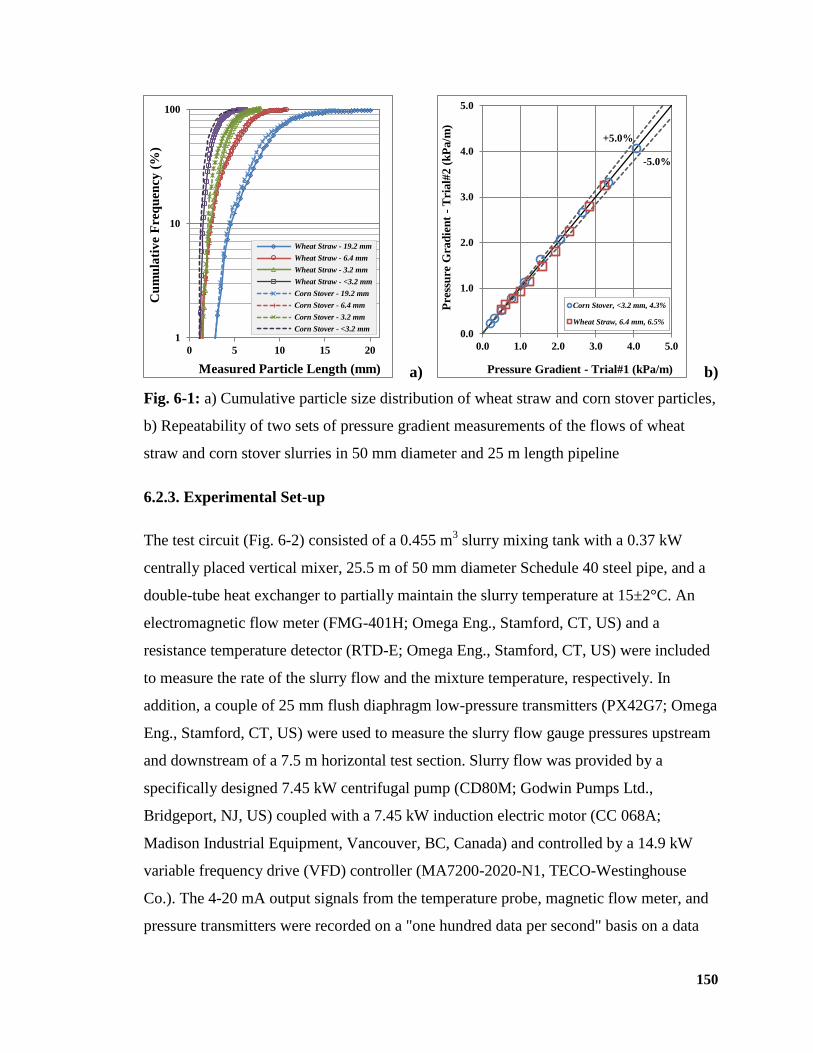
150
a) b)
Fig. 6-1: a) Cumulative particle size distribution of wheat straw and corn stover particles,
b) Repeatability of two sets of pressure gradient measurements of the flows of wheat
straw and corn stover slurries in 50 mm diameter and 25 m length pipeline
6.2.3. Experimental Set-up
The test circuit (Fig. 6-2) consisted of a 0.455 m3 slurry mixing tank with a 0.37 kW
centrally placed vertical mixer, 25.5 m of 50 mm diameter Schedule 40 steel pipe, and a
double-tube heat exchanger to partially maintain the slurry temperature at 15±2°C. An
electromagnetic flow meter (FMG-401H; Omega Eng., Stamford, CT, US) and a
resistance temperature detector (RTD-E; Omega Eng., Stamford, CT, US) were included
to measure the rate of the slurry flow and the mixture temperature, respectively. In
addition, a couple of 25 mm flush diaphragm low-pressure transmitters (PX42G7; Omega
Eng., Stamford, CT, US) were used to measure the slurry flow gauge pressures upstream
and downstream of a 7.5 m horizontal test section. Slurry flow was provided by a
specifically designed 7.45 kW centrifugal pump (CD80M; Godwin Pumps Ltd.,
Bridgeport, NJ, US) coupled with a 7.45 kW induction electric motor (CC 068A;
Madison Industrial Equipment, Vancouver, BC, Canada) and controlled by a 14.9 kW
variable frequency drive (VFD) controller (MA7200-2020-N1, TECO-Westinghouse
Co.). The 4-20 mA output signals from the temperature probe, magnetic flow meter, and
pressure transmitters were recorded on a "one hundred data per second" basis on a data
1
10
100
0 5 10 15 20
Cu
mu
lati
ve
Fre
qu
ency
(%
)
Measured Particle Length (mm)
Wheat Straw - 19.2 mm
Wheat Straw - 6.4 mm
Wheat Straw - 3.2 mm
Wheat Straw - <3.2 mm
Corn Stover - 19.2 mm
Corn Stover - 6.4 mm
Corn Stover - 3.2 mm
Corn Stover - <3.2 mm0.0
1.0
2.0
3.0
4.0
5.0
0.0 1.0 2.0 3.0 4.0 5.0
Pre
ssu
re G
rad
ien
t -
Tri
al#
2 (
kP
a/m
)
Pressure Gradient - Trial#1 (kPa/m)
Corn Stover, <3.2 mm, 4.3%
Wheat Straw, 6.4 mm, 6.5%
+5.0%
-5.0%
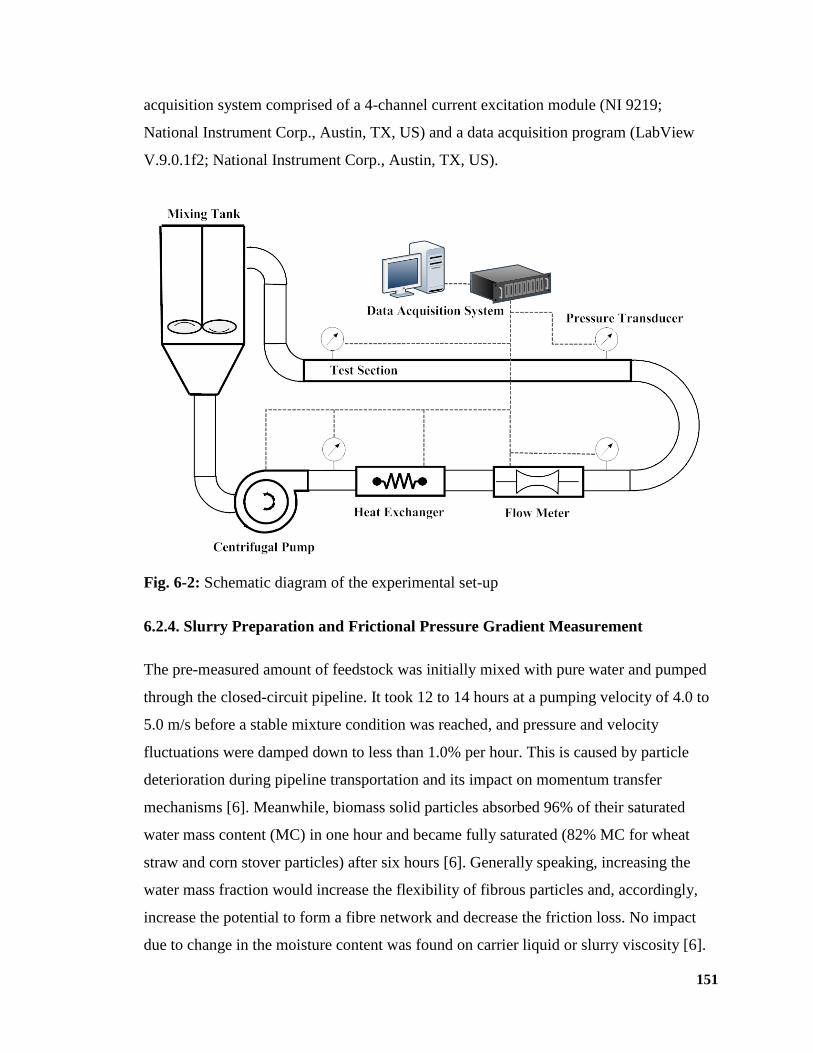
151
acquisition system comprised of a 4-channel current excitation module (NI 9219;
National Instrument Corp., Austin, TX, US) and a data acquisition program (LabView
V.9.0.1f2; National Instrument Corp., Austin, TX, US).
Fig. 6-2: Schematic diagram of the experimental set-up
6.2.4. Slurry Preparation and Frictional Pressure Gradient Measurement
The pre-measured amount of feedstock was initially mixed with pure water and pumped
through the closed-circuit pipeline. It took 12 to 14 hours at a pumping velocity of 4.0 to
5.0 m/s before a stable mixture condition was reached, and pressure and velocity
fluctuations were damped down to less than 1.0% per hour. This is caused by particle
deterioration during pipeline transportation and its impact on momentum transfer
mechanisms [6]. Meanwhile, biomass solid particles absorbed 96% of their saturated
water mass content (MC) in one hour and became fully saturated (82% MC for wheat
straw and corn stover particles) after six hours [6]. Generally speaking, increasing the
water mass fraction would increase the flexibility of fibrous particles and, accordingly,
increase the potential to form a fibre network and decrease the friction loss. No impact
due to change in the moisture content was found on carrier liquid or slurry viscosity [6].
152
The friction loss of the slurry through a 7.5 m horizontal test section was measured
afterwards with two types of biomass materials (wheat straw and corn stover) and four
sizes of biomass particles (19.2 mm, 6.4 mm, 3.2 mm, and <3.2 mm) over a wide range
of saturated (pumped for a minimum of six hours) solid mass contents (Cs=5 to 40% for
<3.2 mm, Cs=5 to 35% for 3.2 mm, Cs=5 to 30% for 6.4 mm, and Cs=5 to 25% for 19.2
mm particles) and slurry bulk velocities (0.5 to 5.0 m/s). In this paper, the equivalent dry
matter (oven-dried) solid mass content (Cd=1 to 8.8% for <3.2 mm, Cd=1 to 7.6% for 3.2
mm, Cd=1 to 6.5% for 6.4 mm, and Cd=1 to 5.4% for 19.2 mm particles) is chosen for
simplicity and comparability purposes.
6.2.5. Uncertainty Analysis
Two sets of experiments were conducted on every particle type and size to assure the
repeatability and investigate the uncertainty of the results. For instance, a good agreement
was found, as observed on Fig. 6-1(b), between successive trials of a 4.3% solid mass
content slurry of <3.2 mm corn stover and a 6.5% solid mass content slurry of 6.4 mm
wheat straw particles with uncertainties of ±0.015 kPa/m and ±0.068 kPa/m, respectively.
Uncertainties in experimental measurements, carrier liquid viscosity measurement,
calibration of the experimental set-up, and evaluating the performance of the centrifugal
pumps handling agricultural residue biomass slurries have been extensively discussed by
the authors elsewhere [6, 7].
6.3. Experimental Results
Although the pipeline hydro-transport of woodchip biomass has been previously
experimentally investigated and numerically modeled [33-36], the authors of this paper
demonstrated that the pressure drop correlations proposed for woodchip-water mixtures
are not appropriate choices to apply to agricultural residue biomass slurries [6].
Furthermore, the authors of this paper compared the similarity in the mechanical behavior
of agricultural residue biomass slurries and classical solid-liquid mixtures (play sand-
water mixture – see the sand specifications in Table 6-1) and found that in a clear contrast
with agricultural residue biomass slurry, the friction factor in a water-sand mixture is
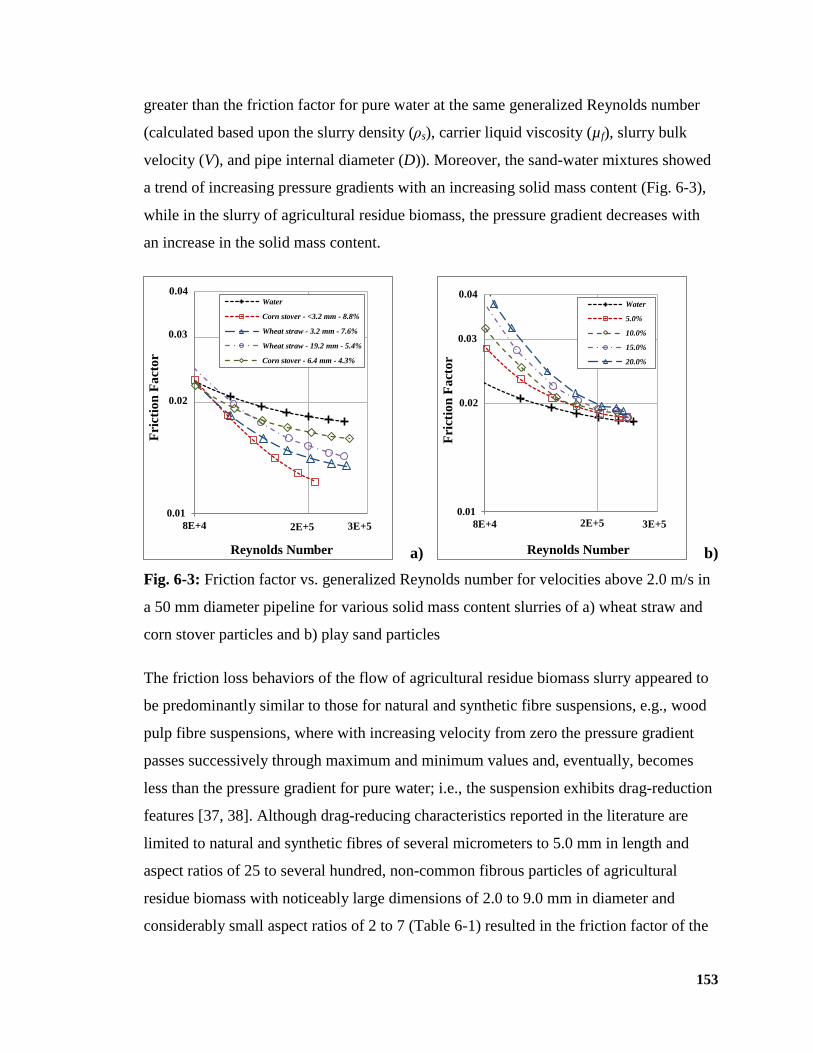
153
greater than the friction factor for pure water at the same generalized Reynolds number
(calculated based upon the slurry density (ρs), carrier liquid viscosity (µf), slurry bulk
velocity (V), and pipe internal diameter (D)). Moreover, the sand-water mixtures showed
a trend of increasing pressure gradients with an increasing solid mass content (Fig. 6-3),
while in the slurry of agricultural residue biomass, the pressure gradient decreases with
an increase in the solid mass content.
a) b)
Fig. 6-3: Friction factor vs. generalized Reynolds number for velocities above 2.0 m/s in
a 50 mm diameter pipeline for various solid mass content slurries of a) wheat straw and
corn stover particles and b) play sand particles
The friction loss behaviors of the flow of agricultural residue biomass slurry appeared to
be predominantly similar to those for natural and synthetic fibre suspensions, e.g., wood
pulp fibre suspensions, where with increasing velocity from zero the pressure gradient
passes successively through maximum and minimum values and, eventually, becomes
less than the pressure gradient for pure water; i.e., the suspension exhibits drag-reduction
features [37, 38]. Although drag-reducing characteristics reported in the literature are
limited to natural and synthetic fibres of several micrometers to 5.0 mm in length and
aspect ratios of 25 to several hundred, non-common fibrous particles of agricultural
residue biomass with noticeably large dimensions of 2.0 to 9.0 mm in diameter and
considerably small aspect ratios of 2 to 7 (Table 6-1) resulted in the friction factor of the
0.01
8E+4
Fri
ctio
n F
act
or
Reynolds Number
Water
Corn stover - <3.2 mm - 8.8%
Wheat straw - 3.2 mm - 7.6%
Wheat straw - 19.2 mm - 5.4%
Corn stover - 6.4 mm - 4.3%
0.02
0.03
2E+5 3E+5
0.04
0.01
8E+4
Fri
ctio
n F
act
or
Reynolds Number
Water
5.0%
10.0%
15.0%
20.0%
0.02
0.03
2E+5 3E+5
0.04
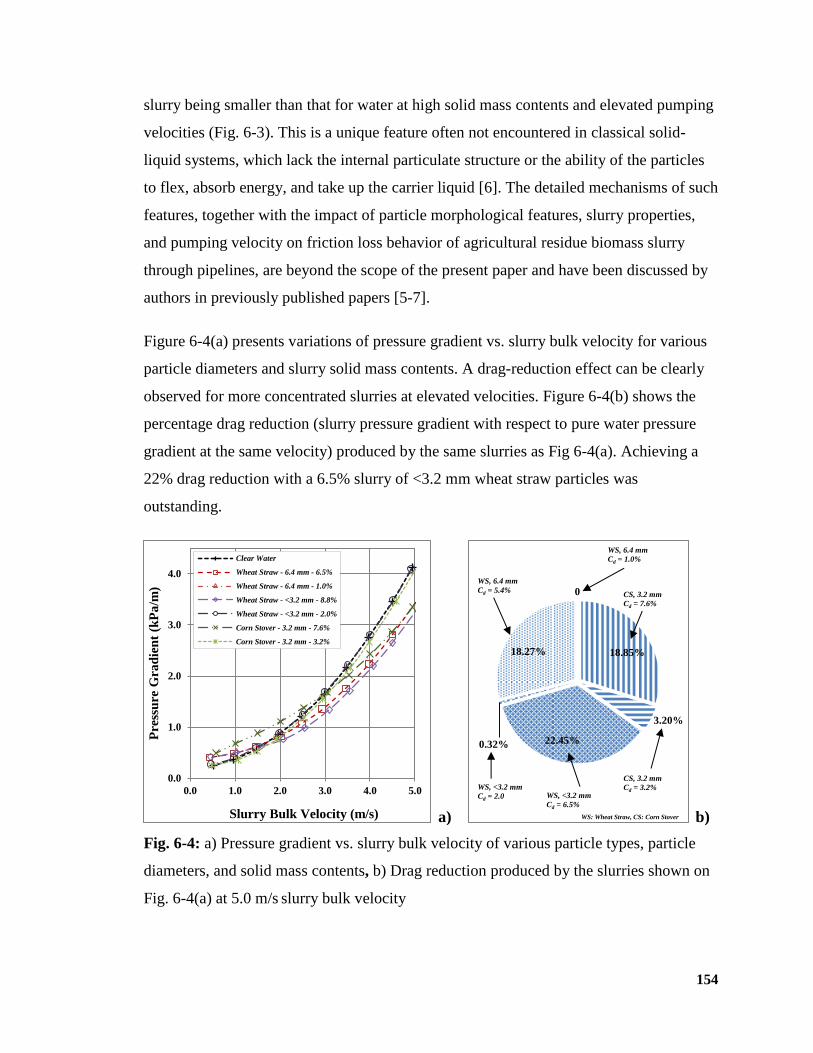
154
slurry being smaller than that for water at high solid mass contents and elevated pumping
velocities (Fig. 6-3). This is a unique feature often not encountered in classical solid-
liquid systems, which lack the internal particulate structure or the ability of the particles
to flex, absorb energy, and take up the carrier liquid [6]. The detailed mechanisms of such
features, together with the impact of particle morphological features, slurry properties,
and pumping velocity on friction loss behavior of agricultural residue biomass slurry
through pipelines, are beyond the scope of the present paper and have been discussed by
authors in previously published papers [5-7].
Figure 6-4(a) presents variations of pressure gradient vs. slurry bulk velocity for various
particle diameters and slurry solid mass contents. A drag-reduction effect can be clearly
observed for more concentrated slurries at elevated velocities. Figure 6-4(b) shows the
percentage drag reduction (slurry pressure gradient with respect to pure water pressure
gradient at the same velocity) produced by the same slurries as Fig 6-4(a). Achieving a
22% drag reduction with a 6.5% slurry of <3.2 mm wheat straw particles was
outstanding.
a) b)
Fig. 6-4: a) Pressure gradient vs. slurry bulk velocity of various particle types, particle
diameters, and solid mass contents, b) Drag reduction produced by the slurries shown on
Fig. 6-4(a) at 5.0 m/s slurry bulk velocity
0.0
1.0
2.0
3.0
4.0
0.0 1.0 2.0 3.0 4.0 5.0
Pre
ssu
re G
rad
ien
t (k
Pa
/m)
Slurry Bulk Velocity (m/s)
Clear Water
Wheat Straw - 6.4 mm - 6.5%
Wheat Straw - 6.4 mm - 1.0%
Wheat Straw - <3.2 mm - 8.8%
Wheat Straw - <3.2 mm - 2.0%
Corn Stover - 3.2 mm - 7.6%
Corn Stover - 3.2 mm - 3.2%
18.85%
3.20%
22.45% 0.32%
18.27%
0 CS, 3.2 mm
Cd = 7.6%
CS, 3.2 mm
Cd = 3.2% WS, <3.2 mm
Cd = 6.5%
WS, <3.2 mm
Cd = 2.0
WS, 6.4 mm
Cd = 5.4%
WS, 6.4 mm
Cd = 1.0%
WS: Wheat Straw, CS: Corn Stover
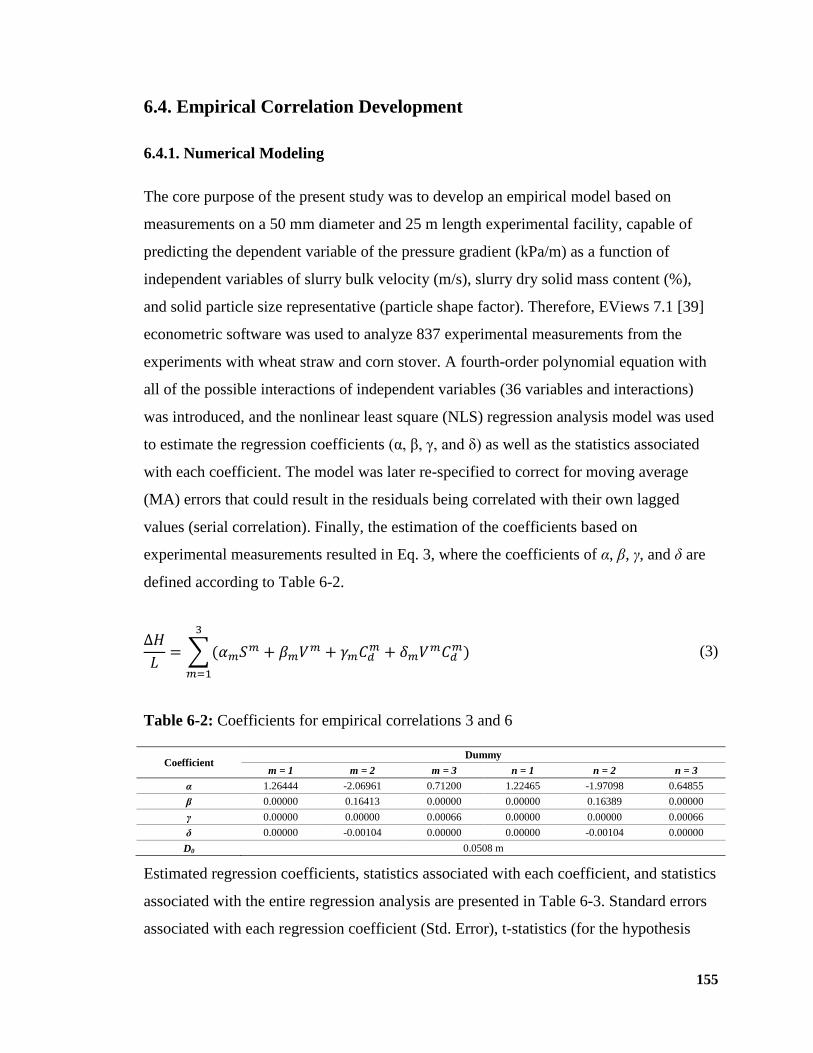
155
6.4. Empirical Correlation Development
6.4.1. Numerical Modeling
The core purpose of the present study was to develop an empirical model based on
measurements on a 50 mm diameter and 25 m length experimental facility, capable of
predicting the dependent variable of the pressure gradient (kPa/m) as a function of
independent variables of slurry bulk velocity (m/s), slurry dry solid mass content (%),
and solid particle size representative (particle shape factor). Therefore, EViews 7.1 [39]
econometric software was used to analyze 837 experimental measurements from the
experiments with wheat straw and corn stover. A fourth-order polynomial equation with
all of the possible interactions of independent variables (36 variables and interactions)
was introduced, and the nonlinear least square (NLS) regression analysis model was used
to estimate the regression coefficients (α, β, γ, and δ) as well as the statistics associated
with each coefficient. The model was later re-specified to correct for moving average
(MA) errors that could result in the residuals being correlated with their own lagged
values (serial correlation). Finally, the estimation of the coefficients based on
experimental measurements resulted in Eq. 3, where the coefficients of α, β, γ, and δ are
defined according to Table 6-2.
∑
(3)
Table 6-2: Coefficients for empirical correlations 3 and 6
Coefficient Dummy
m = 1 m = 2 m = 3 n = 1 n = 2 n = 3
α 1.26444 -2.06961 0.71200 1.22465 -1.97098 0.64855
β 0.00000 0.16413 0.00000 0.00000 0.16389 0.00000
γ 0.00000 0.00000 0.00066 0.00000 0.00000 0.00066
δ 0.00000 -0.00104 0.00000 0.00000 -0.00104 0.00000
D0 0.0508 m
Estimated regression coefficients, statistics associated with each coefficient, and statistics
associated with the entire regression analysis are presented in Table 6-3. Standard errors
associated with each regression coefficient (Std. Error), t-statistics (for the hypothesis
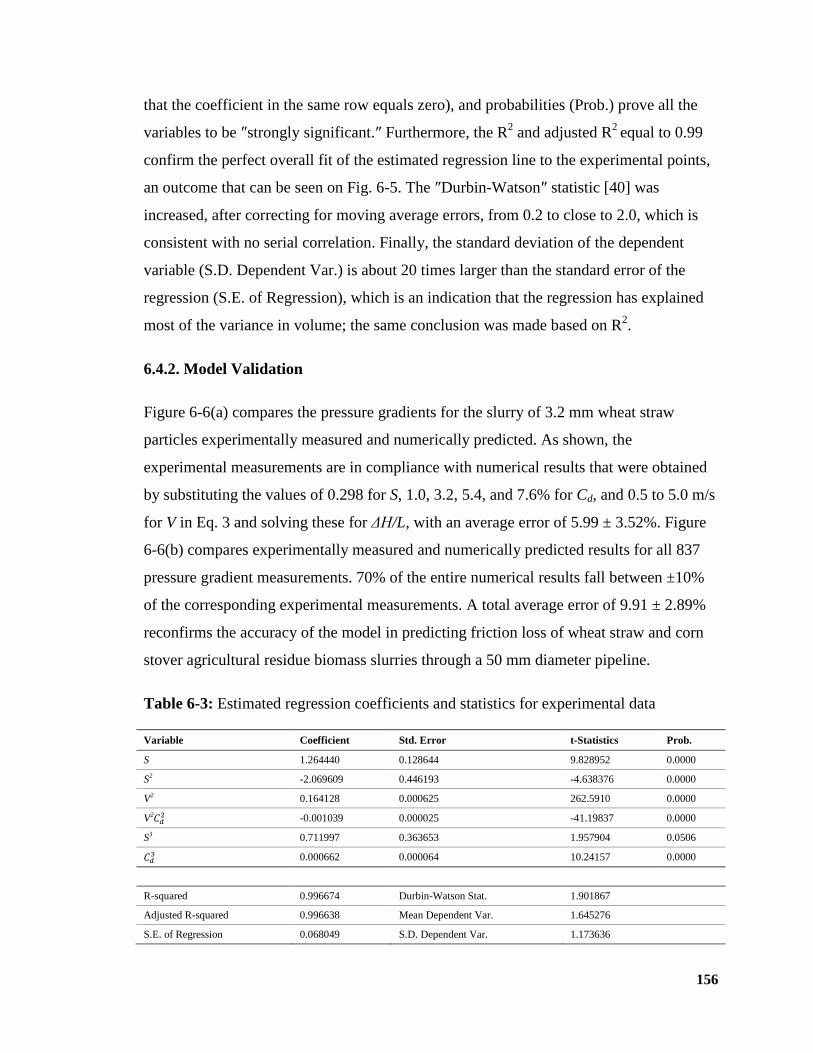
156
that the coefficient in the same row equals zero), and probabilities (Prob.) prove all the
variables to be ″strongly significant.″ Furthermore, the R2 and adjusted R
2 equal to 0.99
confirm the perfect overall fit of the estimated regression line to the experimental points,
an outcome that can be seen on Fig. 6-5. The ″Durbin-Watson″ statistic [40] was
increased, after correcting for moving average errors, from 0.2 to close to 2.0, which is
consistent with no serial correlation. Finally, the standard deviation of the dependent
variable (S.D. Dependent Var.) is about 20 times larger than the standard error of the
regression (S.E. of Regression), which is an indication that the regression has explained
most of the variance in volume; the same conclusion was made based on R2.
6.4.2. Model Validation
Figure 6-6(a) compares the pressure gradients for the slurry of 3.2 mm wheat straw
particles experimentally measured and numerically predicted. As shown, the
experimental measurements are in compliance with numerical results that were obtained
by substituting the values of 0.298 for S, 1.0, 3.2, 5.4, and 7.6% for Cd, and 0.5 to 5.0 m/s
for V in Eq. 3 and solving these for ΔH/L, with an average error of 5.99 ± 3.52%. Figure
6-6(b) compares experimentally measured and numerically predicted results for all 837
pressure gradient measurements. 70% of the entire numerical results fall between ±10%
of the corresponding experimental measurements. A total average error of 9.91 ± 2.89%
reconfirms the accuracy of the model in predicting friction loss of wheat straw and corn
stover agricultural residue biomass slurries through a 50 mm diameter pipeline.
Table 6-3: Estimated regression coefficients and statistics for experimental data
Variable Coefficient Std. Error t-Statistics Prob.
S 1.264440 0.128644 9.828952 0.0000
S2 -2.069609 0.446193 -4.638376 0.0000
V2 0.164128 0.000625 262.5910 0.0000
V2 -0.001039 0.000025 -41.19837 0.0000
S3 0.711997 0.363653 1.957904 0.0506
0.000662 0.000064 10.24157 0.0000
R-squared 0.996674 Durbin-Watson Stat. 1.901867
Adjusted R-squared 0.996638 Mean Dependent Var. 1.645276
S.E. of Regression 0.068049 S.D. Dependent Var. 1.173636
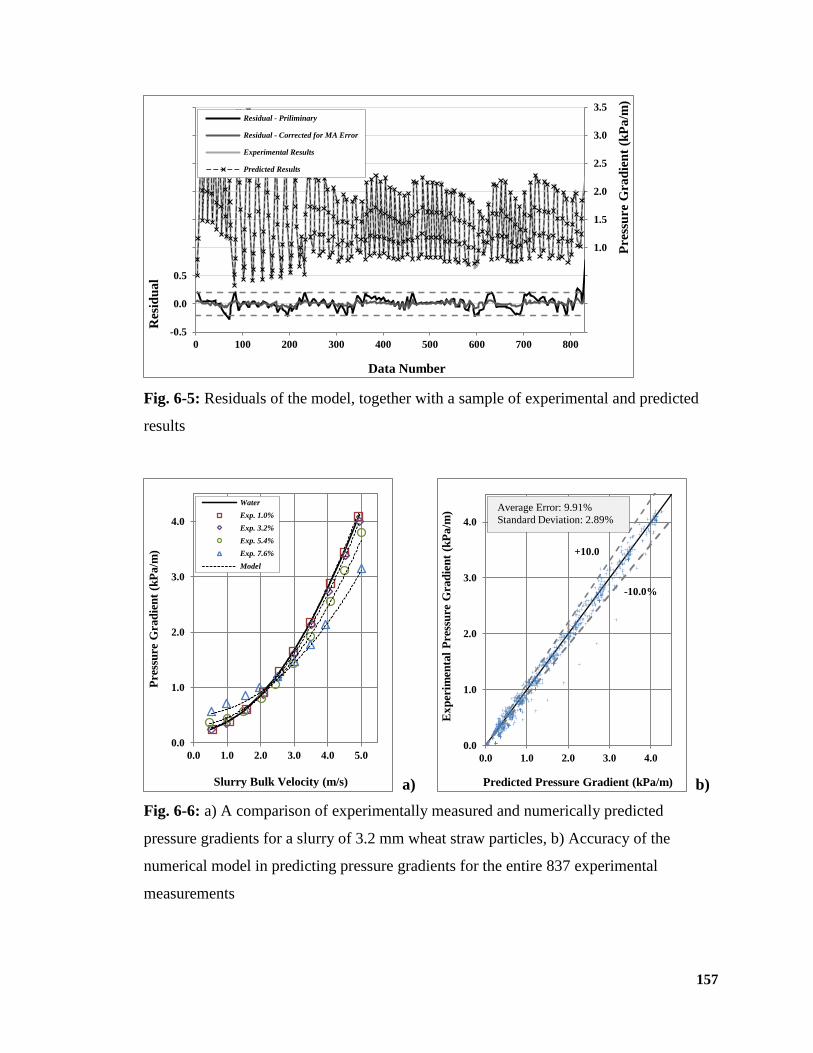
157
Fig. 6-5: Residuals of the model, together with a sample of experimental and predicted
results
a) b)
Fig. 6-6: a) A comparison of experimentally measured and numerically predicted
pressure gradients for a slurry of 3.2 mm wheat straw particles, b) Accuracy of the
numerical model in predicting pressure gradients for the entire 837 experimental
measurements
1.0
1.5
2.0
2.5
3.0
3.5
-0.5
0.0
0.5
0 100 200 300 400 500 600 700 800
Pre
ssu
re G
rad
ien
t (k
Pa
/m)
Res
idu
al
Data Number
Residual - Priliminary
Residual - Corrected for MA Error
Experimental Results
Predicted Results
0.0
1.0
2.0
3.0
4.0
0.0 1.0 2.0 3.0 4.0 5.0
Pre
ssu
re G
rad
ien
t (k
Pa/m
)
Slurry Bulk Velocity (m/s)
Water
Exp. 1.0%
Exp. 3.2%
Exp. 5.4%
Exp. 7.6%
Model
0.0
1.0
2.0
3.0
4.0
0.0 1.0 2.0 3.0 4.0
Ex
per
imen
tal
Pre
ssu
re G
rad
ien
t (k
Pa/m
)
Predicted Pressure Gradient (kPa/m)
+10.0
-10.0%
Average Error: 9.91%
Standard Deviation: 2.89%
158
6.4.3. Model Applications
As previously discussed, the model is not limited to the agricultural residue biomass
studied here. Based on the assumption that particles similar in nature should have more or
less the same shape characteristics [41], common agricultural residue biomass or,
generally, non-wood fibres (e.g., wheat straw, corn stover, rice straw, bagasse) and
energy crops (e.g., switch grass, miscanthus), if ground, would be fibrous in nature (see
section 6.2.2) [42-44] and are expected to show similar mechanical behavior when mixed
with water and pumped into the pipeline. Therefore, the corresponding shape factors, if
accordingly substituted in Eq. 3, together with the appropriate solid mass content and
slurry bulk velocity, will result in the pressure gradient of corresponding slurry through a
50 mm pipeline.
Although the range of slurry velocity (0.5 to 5.0 m/s) and slurry solid mass content (1.0
to 8.8%) of experimental measurements are pretty wide and easily cover the industrial
and commercial range of operations, the authors are not able to confirm the accuracy of
the proposed correlation at operating conditions outside the above ranges.
6.5. Scale-up Approach
A large-scale long-distance pipeline, in order to be economically viable, uses large
diameter pipes, e.g., the 440 km long 457 mm diameter Black Mesa coal pipeline, the 150
km long 250 mm diameter Chevron phosphate slurry pipeline, and the 35 km long 324
mm diameter MacKay River bitumen pipeline [45]. Therefore, before planning a large-
scale long-distance agricultural residue biomass slurry pipeline, it is necessary to
understand how the slurry mechanical behavior changes with pipeline specifications, i.e.,
pipeline diameter; or, more specifically, is the pressure gradient correlation developed for
a 50 mm diameter pipeline valid for larger diameters?
According to Duffy and Lee [37] and Radin et al. [46], who studied flow and drag-
reduction features of various fibre suspensions (e.g., wood pulp, nylon, and rayon), there
is an increase in drag reduction (and corresponding onset velocity4) with increasing pipe
4 The velocity at which the slurry pressure gradient becomes less than the pressure gradient for pure water, Vw.
159
diameter. Since a larger pipe has an appreciable percentage of its flow in a non-shear
condition, and it has been shown that drag reduction is caused by modification of the
turbulence structure in the core and not in the boundary layer (i.e., it is not a wall effect)
[38, 47], it might be expected that a pipe with a larger diameter will bring about more
drag reduction than a pipe with a smaller diameter. Rao [48] also confirms that the
friction loss is higher for smaller pipe diameters under similar conditions of fibre
suspension (pulp) flows. Consequently, the pressure gradient predicted for a slurry of
agricultural residue biomass in a 50 mm diameter pipe would be conservatively valid for
a larger diameter pipe as well. However, it will obviously result in overestimating the
slurry friction loss and oversizing the pump facilities, which will accordingly increase
capital investment and operating costs. Therefore, it is necessary to modify the
correlation to account for the pipe diameter as well.
6.5.1. Scale-up Approaches for the Pulp Fibre Suspension Flows in Pipes
The mechanisms of flow of fibre suspensions have been previously described in the
literature [6, 18, 48-54]. The models reviewed here specifically discuss the approaches
that have been taken to account for the effect of increasing pipe diameter on
corresponding friction loss in pulp fibre suspension flows. Since the similarity between
flow of agricultural residue biomass slurry and natural and synthetic fibre suspensions,
e.g., wood pulp fibre suspensions, have been previously demonstrated [6], the results
obtained here would be used for scaling up the agricultural residue biomass slurry
pipelines.
The earliest data used for the purpose of designing a fibre suspension flow pipeline were
obtained by Trimbey in 1907 for groundwood pulp in spiral riveted steel pipes and were
later published as the Cameron Hydraulic Data [55]. Forrest and Grierson in 1931 [56]
published data for sulphite and groundwood pulps over a wide range of velocities, stock
solid mass contents, and pipe diameters. Brecht and Heller [57] also reported extensive
data for unbleached sulphite pulp for stock solid mass contents up to 5.0% over various
copper pipe diameters. Later, Durst et al. [58] analyzed the experimental data in the
Cameron Hydraulic Data Book as reported by Forrest and Grierson and Brecht and Heller
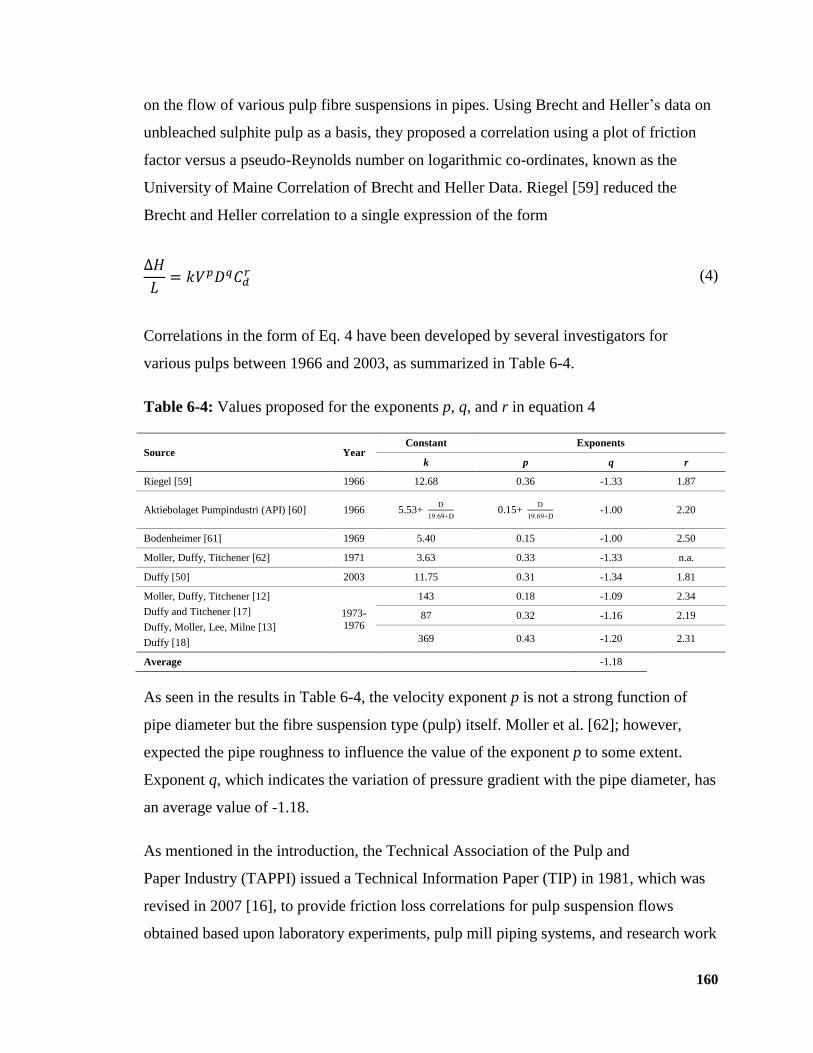
160
on the flow of various pulp fibre suspensions in pipes. Using Brecht and Heller’s data on
unbleached sulphite pulp as a basis, they proposed a correlation using a plot of friction
factor versus a pseudo-Reynolds number on logarithmic co-ordinates, known as the
University of Maine Correlation of Brecht and Heller Data. Riegel [59] reduced the
Brecht and Heller correlation to a single expression of the form
(4)
Correlations in the form of Eq. 4 have been developed by several investigators for
various pulps between 1966 and 2003, as summarized in Table 6-4.
Table 6-4: Values proposed for the exponents p, q, and r in equation 4
Source Year Constant Exponents
k p q r
Riegel [59] 1966 12.68 0.36 -1.33 1.87
Aktiebolaget Pumpindustri (API) [60] 1966 5.53+
1 . 0.15+
1 . -1.00 2.20
Bodenheimer [61] 1969 5.40 0.15 -1.00 2.50
Moller, Duffy, Titchener [62] 1971 3.63 0.33 -1.33 n.a.
Duffy [50] 2003 11.75 0.31 -1.34 1.81
Moller, Duffy, Titchener [12]
Duffy and Titchener [17]
Duffy, Moller, Lee, Milne [13]
Duffy [18]
1973-
1976
143 0.18 -1.09 2.34
87 0.32 -1.16 2.19
369 0.43 -1.20 2.31
Average -1.18
As seen in the results in Table 6-4, the velocity exponent p is not a strong function of
pipe diameter but the fibre suspension type (pulp) itself. Moller et al. [62]; however,
expected the pipe roughness to influence the value of the exponent p to some extent.
Exponent q, which indicates the variation of pressure gradient with the pipe diameter, has
an average value of -1.18.
As mentioned in the introduction, the Technical Association of the Pulp and
Paper Industry (TAPPI) issued a Technical Information Paper (TIP) in 1981, which was
revised in 2007 [16], to provide friction loss correlations for pulp suspension flows
obtained based upon laboratory experiments, pulp mill piping systems, and research work
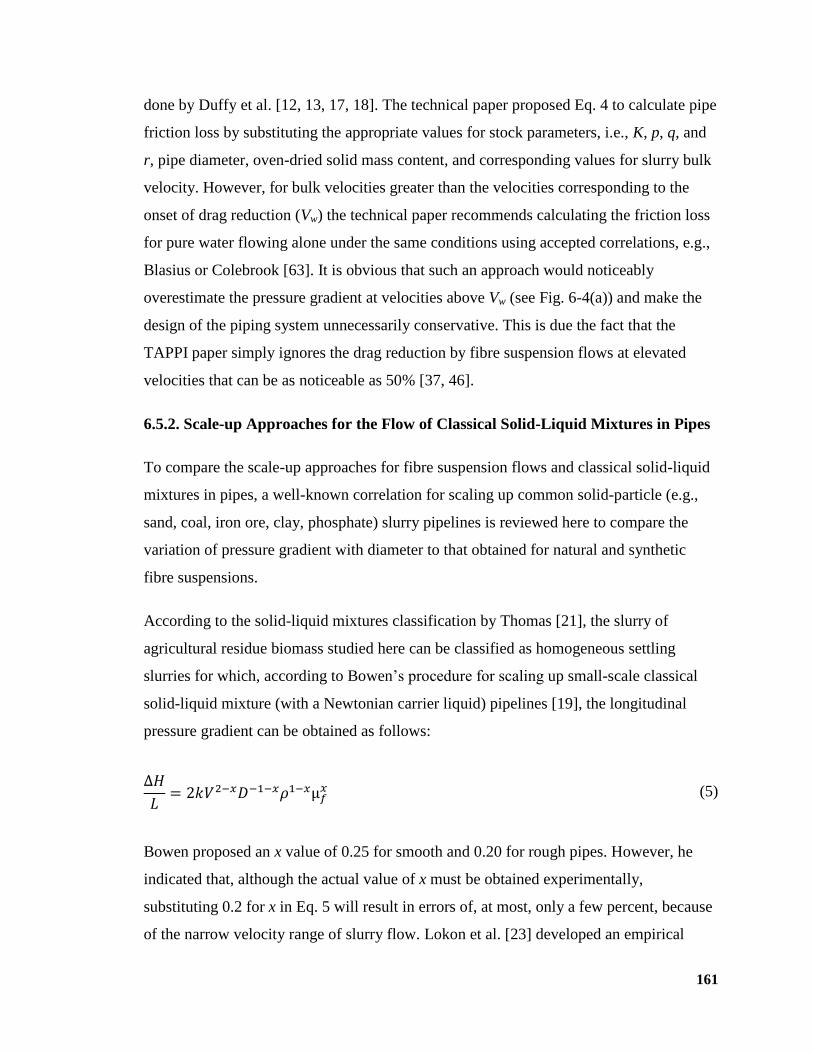
161
done by Duffy et al. [12, 13, 17, 18]. The technical paper proposed Eq. 4 to calculate pipe
friction loss by substituting the appropriate values for stock parameters, i.e., K, p, q, and
r, pipe diameter, oven-dried solid mass content, and corresponding values for slurry bulk
velocity. However, for bulk velocities greater than the velocities corresponding to the
onset of drag reduction (Vw) the technical paper recommends calculating the friction loss
for pure water flowing alone under the same conditions using accepted correlations, e.g.,
Blasius or Colebrook [63]. It is obvious that such an approach would noticeably
overestimate the pressure gradient at velocities above Vw (see Fig. 6-4(a)) and make the
design of the piping system unnecessarily conservative. This is due the fact that the
TAPPI paper simply ignores the drag reduction by fibre suspension flows at elevated
velocities that can be as noticeable as 50% [37, 46].
6.5.2. Scale-up Approaches for the Flow of Classical Solid-Liquid Mixtures in Pipes
To compare the scale-up approaches for fibre suspension flows and classical solid-liquid
mixtures in pipes, a well-known correlation for scaling up common solid-particle (e.g.,
sand, coal, iron ore, clay, phosphate) slurry pipelines is reviewed here to compare the
variation of pressure gradient with diameter to that obtained for natural and synthetic
fibre suspensions.
According to the solid-liquid mixtures classification by Thomas [21], the slurry of
agricultural residue biomass studied here can be classified as homogeneous settling
slurries for which, according to Bowen’s procedure for scaling up small-scale classical
solid-liquid mixture (with a Newtonian carrier liquid) pipelines [19], the longitudinal
pressure gradient can be obtained as follows:
(5)
Bowen proposed an x value of 0.25 for smooth and 0.20 for rough pipes. However, he
indicated that, although the actual value of x must be obtained experimentally,
substituting 0.2 for x in Eq. 5 will result in errors of, at most, only a few percent, because
of the narrow velocity range of slurry flow. Lokon et al. [23] developed an empirical
162
model to predict the longitudinal pressure gradients in iron ore slurry pipe flows that was
based on the model by Bowen [19]. Consequently, the proposed exponent for D in Eq. 5
would be -1.2, which fits the value averaged from Table 6-4.
6.5.3. Scale-up Approaches for the Flow of Agricultural Residue Biomass Slurries in
Pipes
Webster et al. [22] discussed two various pressure gradient scale-up approaches for slurry
pipelines. First, the CSIR (the Council for Scientific and Industrial Research, Pretoria,
South Africa) approach [20], also referred to as the is method, which requires the results
for one pipe diameter only. Second, the Thomas method [21], which needs the results in
more than one pipe diameter to predict the pressure gradient in larger pipe diameters.
Based upon the CSIR approach, by plotting on a log-log graph of pressure gradients (i)
versus pipe diameter (D), plotting the value for the slurry pressure gradient (iexp)
experimentally obtained in a fixed-diameter experimental pipe (D0) at the design velocity
of a commercial pipe, and drawing a straight line through this point parallel to the straight
line for the pure water pressure gradient (iw), pressure gradients predicted by the CSIR
method (is) for any D can be obtained.
In Fig. 6-7 the results for iexp versus D0 = 50 mm are plotted on a log-log scale, together
with iw and is versus D lines for the pipes with diameters from 75 to 250 mm, all at 1.5,
3.0, and 4.5 m/s slurry bulk velocity. is lines of the CSIR approach demonstrate a power
relationship between the pressure gradient and the pipe diameter with an average power
of -1.201±0.005. This is identical to the average value obtained from the literature
reviewed in Table 6-4 for pulp fibre suspension flows and section 6.5.2 for classical
solid-liquid systems. Consequently, a value of -1.2 is selected as the exponent for the
pipe diameter in the agricultural residue biomass slurry pressure gradient correlation,
which indicates that in the scale-up procedure, the pressure gradient changes with the
diameter proportional to the pipe diameter to the power of -1.2.
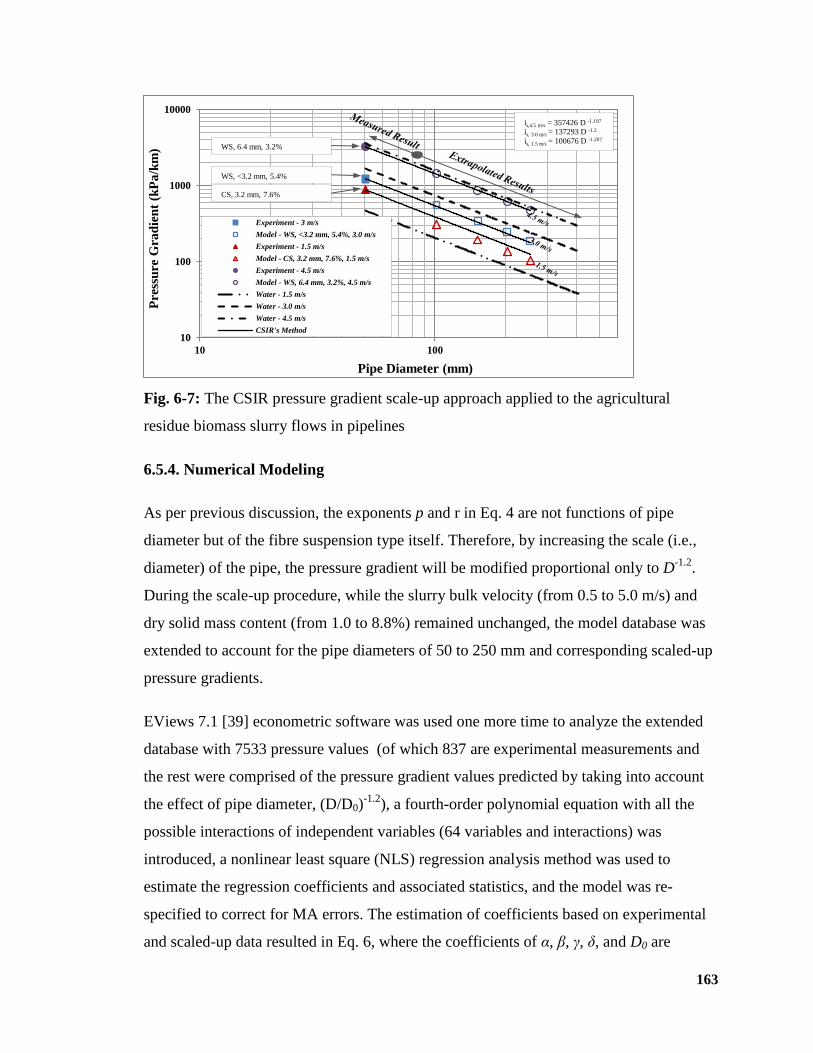
163
Fig. 6-7: The CSIR pressure gradient scale-up approach applied to the agricultural
residue biomass slurry flows in pipelines
6.5.4. Numerical Modeling
As per previous discussion, the exponents p and r in Eq. 4 are not functions of pipe
diameter but of the fibre suspension type itself. Therefore, by increasing the scale (i.e.,
diameter) of the pipe, the pressure gradient will be modified proportional only to D-1.2
.
During the scale-up procedure, while the slurry bulk velocity (from 0.5 to 5.0 m/s) and
dry solid mass content (from 1.0 to 8.8%) remained unchanged, the model database was
extended to account for the pipe diameters of 50 to 250 mm and corresponding scaled-up
pressure gradients.
EViews 7.1 [39] econometric software was used one more time to analyze the extended
database with 7533 pressure values (of which 837 are experimental measurements and
the rest were comprised of the pressure gradient values predicted by taking into account
the effect of pipe diameter, (D/D0)-1.2
), a fourth-order polynomial equation with all the
possible interactions of independent variables (64 variables and interactions) was
introduced, a nonlinear least square (NLS) regression analysis method was used to
estimate the regression coefficients and associated statistics, and the model was re-
specified to correct for MA errors. The estimation of coefficients based on experimental
and scaled-up data resulted in Eq. 6, where the coefficients of α, β, γ, δ, and D0 are
10
100
1000
10000
10 100
Pre
ssu
re G
rad
ien
t (k
Pa
/km
)
Pipe Diameter (mm)
Experiment - 3 m/s
Model - WS, <3.2 mm, 5.4%, 3.0 m/s
Experiment - 1.5 m/s
Model - CS, 3.2 mm, 7.6%, 1.5 m/s
Experiment - 4.5 m/s
Model - WS, 6.4 mm, 3.2%, 4.5 m/s
Water - 1.5 m/s
Water - 3.0 m/s
Water - 4.5 m/s
CSIR's Method
WS, 6.4 mm, 3.2%
WS, <3.2 mm, 5.4%
CS, 3.2 mm, 7.6%
is,4.5 m/s = 357426 D -1.197
is, 3.0 m/s = 137293 D -1.2
is, 1.5 m/s = 100676 D -1.207
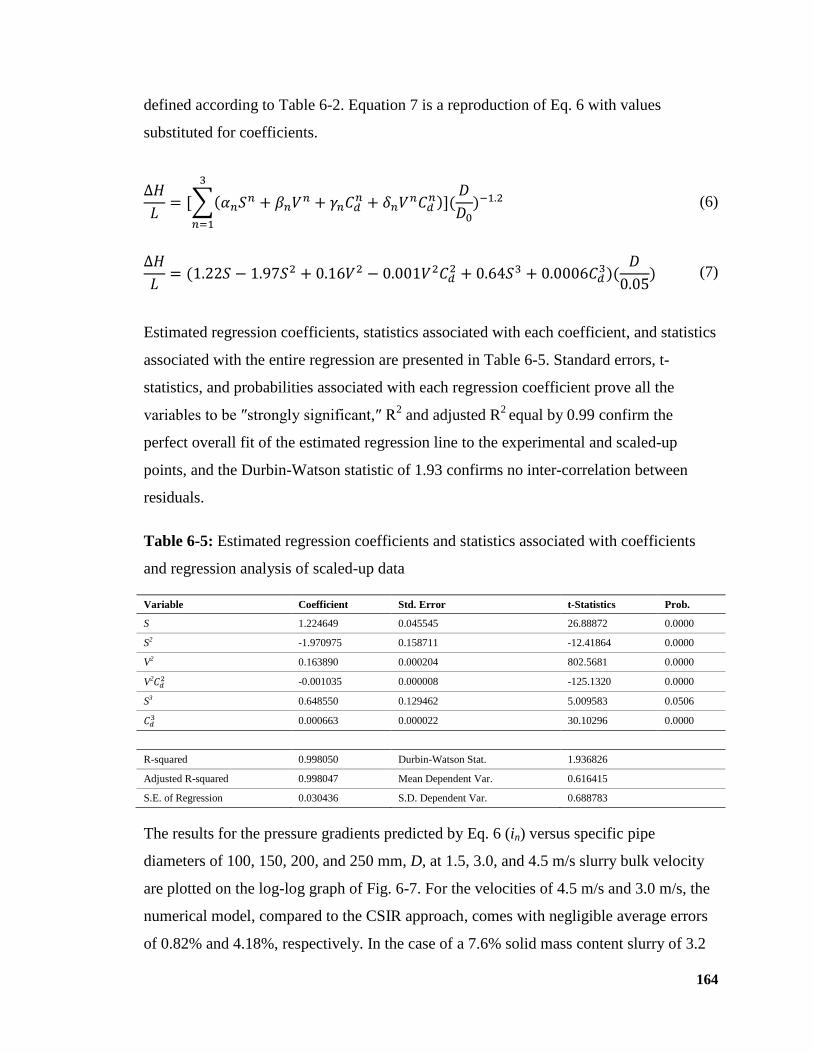
164
defined according to Table 6-2. Equation 7 is a reproduction of Eq. 6 with values
substituted for coefficients.
∑
(6)
(7)
Estimated regression coefficients, statistics associated with each coefficient, and statistics
associated with the entire regression are presented in Table 6-5. Standard errors, t-
statistics, and probabilities associated with each regression coefficient prove all the
variables to be ″strongly significant,″ R2 and adjusted R
2 equal by 0.99 confirm the
perfect overall fit of the estimated regression line to the experimental and scaled-up
points, and the Durbin-Watson statistic of 1.93 confirms no inter-correlation between
residuals.
Table 6-5: Estimated regression coefficients and statistics associated with coefficients
and regression analysis of scaled-up data
Variable Coefficient Std. Error t-Statistics Prob.
S 1.224649 0.045545 26.88872 0.0000
S2 -1.970975 0.158711 -12.41864 0.0000
V2 0.163890 0.000204 802.5681 0.0000
V2 -0.001035 0.000008 -125.1320 0.0000
S3 0.648550 0.129462 5.009583 0.0506
0.000663 0.000022 30.10296 0.0000
R-squared 0.998050 Durbin-Watson Stat. 1.936826
Adjusted R-squared 0.998047 Mean Dependent Var. 0.616415
S.E. of Regression 0.030436 S.D. Dependent Var. 0.688783
The results for the pressure gradients predicted by Eq. 6 (in) versus specific pipe
diameters of 100, 150, 200, and 250 mm, D, at 1.5, 3.0, and 4.5 m/s slurry bulk velocity
are plotted on the log-log graph of Fig. 6-7. For the velocities of 4.5 m/s and 3.0 m/s, the
numerical model, compared to the CSIR approach, comes with negligible average errors
of 0.82% and 4.18%, respectively. In the case of a 7.6% solid mass content slurry of 3.2
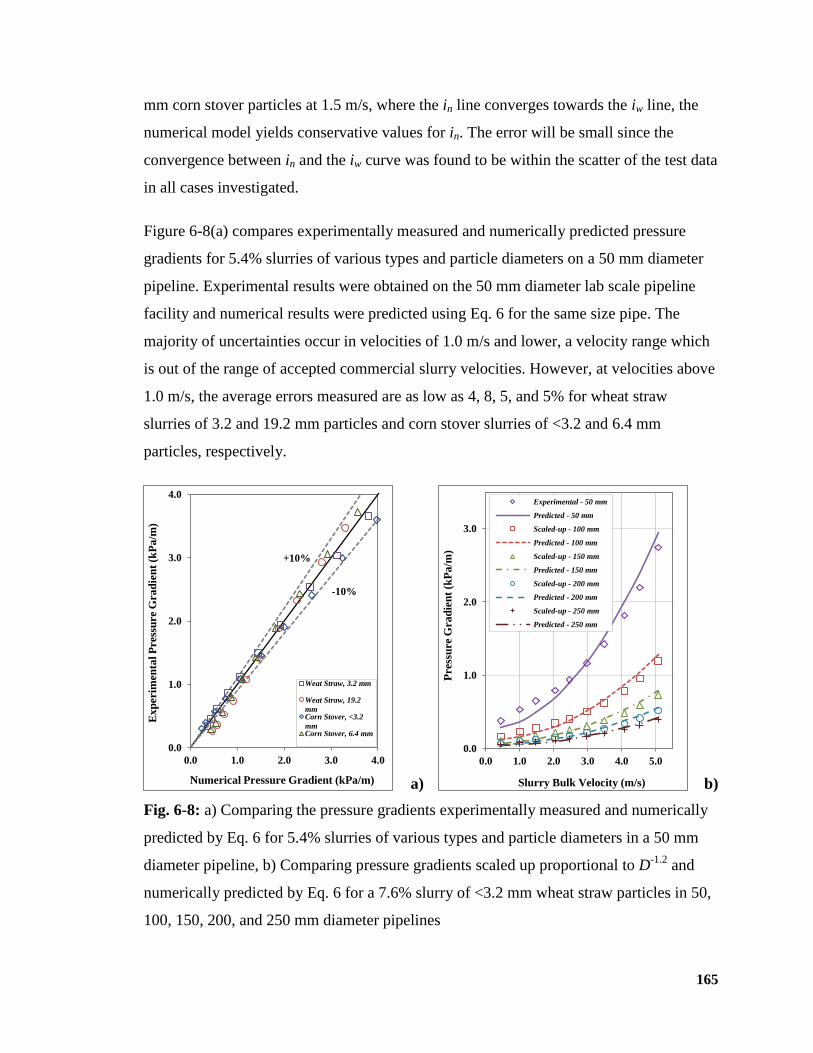
165
mm corn stover particles at 1.5 m/s, where the in line converges towards the iw line, the
numerical model yields conservative values for in. The error will be small since the
convergence between in and the iw curve was found to be within the scatter of the test data
in all cases investigated.
Figure 6-8(a) compares experimentally measured and numerically predicted pressure
gradients for 5.4% slurries of various types and particle diameters on a 50 mm diameter
pipeline. Experimental results were obtained on the 50 mm diameter lab scale pipeline
facility and numerical results were predicted using Eq. 6 for the same size pipe. The
majority of uncertainties occur in velocities of 1.0 m/s and lower, a velocity range which
is out of the range of accepted commercial slurry velocities. However, at velocities above
1.0 m/s, the average errors measured are as low as 4, 8, 5, and 5% for wheat straw
slurries of 3.2 and 19.2 mm particles and corn stover slurries of <3.2 and 6.4 mm
particles, respectively.
a) b)
Fig. 6-8: a) Comparing the pressure gradients experimentally measured and numerically
predicted by Eq. 6 for 5.4% slurries of various types and particle diameters in a 50 mm
diameter pipeline, b) Comparing pressure gradients scaled up proportional to D-1.2
and
numerically predicted by Eq. 6 for a 7.6% slurry of <3.2 mm wheat straw particles in 50,
100, 150, 200, and 250 mm diameter pipelines
0.0
1.0
2.0
3.0
4.0
0.0 1.0 2.0 3.0 4.0
Ex
perim
en
tal P
ress
ure G
ra
die
nt
(kP
a/m
)
Numerical Pressure Gradient (kPa/m)
Weat Straw, 3.2 mm
Weat Straw, 19.2
mmCorn Stover, <3.2
mmCorn Stover, 6.4 mm
+10%
-10%
0.0
1.0
2.0
3.0
0.0 1.0 2.0 3.0 4.0 5.0
Press
ure G
ra
die
nt
(kP
a/m
)
Slurry Bulk Velocity (m/s)
Experimental - 50 mm
Predicted - 50 mm
Scaled-up - 100 mm
Predicted - 100 mm
Scaled-up - 150 mm
Predicted - 150 mm
Scaled-up - 200 mm
Predicted - 200 mm
Scaled-up - 250 mm
Predicted - 250 mm
166
6.5. Conclusion
Slurries of wheat straw and corn stover agricultural residue biomass were prepared in a
wide range of solid particle dimensions and slurry solid mass contents and were then
pumped over a broad range of slurry velocities (0.5 to 5.0 m/s) through a 50 mm diameter
25 m length closed-circuit pipeline facility to measure the longitudinal pressure gradient
of corresponding slurries. With EViews 7.1 econometric software and the nonlinear least
square regression analysis method, the experimentally measured pressure gradients were
analyzed and an empirical correlation was consequently proposed to predict the slurry
pressure gradient as a function of agricultural residue biomass particle type and
dimension, slurry solid mass content, and slurry velocity. Considering the similarity
between friction loss behavior of the flow of wood pulp fibre suspensions and the flow of
agricultural residue biomass slurries and using the CSIR (is) scale-up method, the
proposed correlation was then modified to take into account the effect of pipe diameter as
well. The pressure gradient was found to be proportional to the pipe diameter to the
power of -1.2. The final empirical correlation can, with less than 10% uncertainty, predict
the longitudinal pressure gradient of the flows of slurries of agricultural residue (non-
wood fibrous) biomass in pipes within wide ranges of slurry specifications, operating
conditions, and pipe diameters. The majority of uncertainties occur in velocities of 1.0
m.s-1
and lower, a velocity range which is out of the range of accepted commercial slurry
velocities. However, at velocities above 1.0 m.s-1
, the average errors measured are as low
as 4, 8, 5, and 5% for wheat straw slurries of 3.2 and 19.2 mm particles and corn stover
slurries of <3.2 and 6.4 mm particles, respectively. The proposed correlation can be
applied to estimate the pressure gradient of the flow of agricultural residue biomass slurry
through large-scale pipelines; this knowledge is necessary to estimate the capital and
operational costs of commercial pipelines.
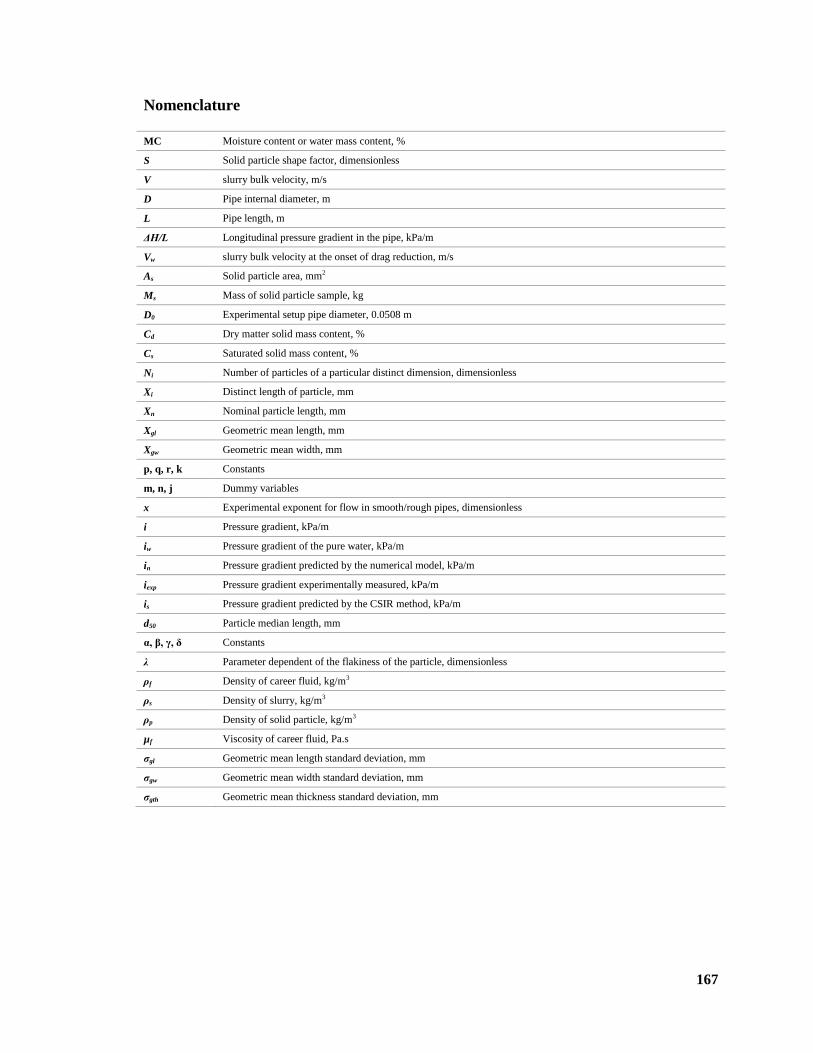
167
Nomenclature
MC Moisture content or water mass content, %
S Solid particle shape factor, dimensionless
V slurry bulk velocity, m/s
D Pipe internal diameter, m
L Pipe length, m
ΔH/L Longitudinal pressure gradient in the pipe, kPa/m
Vw slurry bulk velocity at the onset of drag reduction, m/s
As Solid particle area, mm2
Ms Mass of solid particle sample, kg
D0 Experimental setup pipe diameter, 0.0508 m
Cd Dry matter solid mass content, %
Cs Saturated solid mass content, %
Ni Number of particles of a particular distinct dimension, dimensionless
Xi Distinct length of particle, mm
Xn Nominal particle length, mm
Xgl Geometric mean length, mm
Xgw Geometric mean width, mm
p, q, r, k Constants
m, n, j Dummy variables
x Experimental exponent for flow in smooth/rough pipes, dimensionless
i Pressure gradient, kPa/m
iw Pressure gradient of the pure water, kPa/m
in Pressure gradient predicted by the numerical model, kPa/m
iexp Pressure gradient experimentally measured, kPa/m
is Pressure gradient predicted by the CSIR method, kPa/m
d50 Particle median length, mm
α, β, γ, δ Constants
λ Parameter dependent of the flakiness of the particle, dimensionless
ρf Density of career fluid, kg/m3
ρs Density of slurry, kg/m3
ρp Density of solid particle, kg/m3
µf Viscosity of career fluid, Pa.s
σgl Geometric mean length standard deviation, mm
σgw Geometric mean width standard deviation, mm
σgth Geometric mean thickness standard deviation, mm
168
References
[1] Kumar, A., Cameron, J.B., Flynn, P.C. Pipeline transport of biomass. Applied
Biochemistry and Biotechnology, 2004; 113: 27-39.
[2] Kumar, A., Cameron, J.B., Flynn, P.C. Large-scale ethanol fermentation through
pipeline delivery of biomass. Applied Biochemistry and Biotechnology, 2005 (a); 121:
47-58.
[3] Kumar, A., Cameron, J.B., Flynn, P.C. Pipeline transport and simultaneous
saccharification of corn stover. Bioresource Technology, 2005 (b); 96: 819-29.
[4] Luk, J., Mohammadabadi, H.S., Kumar, A. Pipeline transport of biomass:
Experimental development of wheat straw slurry pressure loss gradients Biomass and
Bioenergy, 2014; 64: 329-36.
[5] Vaezi, M., Pandey, V., Kumar, A., Bhattacharyya, S. Lignocellulosic biomass
particle shape and size distribution analysis using digital image processing for pipeline
hydro-transportation. Biosystems Engineering, 2013; 114: 97-112.
[6] Vaezi, M., Katta, A.K., Kumar, A. Investigation into the mechanisms of pipeline
transport of slurries of wheat straw and corn stover to supply a bio-refinery. Biosystems
Engineering, 2014; 118: 52-67.
[7] Vaezi, M., Kumar, A. The Effect of Agricultural Waste Biomass Slurries on
Performance Characteristics of Centrifugal Pumps. Biomass and Bioenergy, 2014; XX:
XX.
[8] Elliott, D.R., de Montmorency, W.H. The transportation of pulpwood chips in
pipelines. Report of an exploratory study. Montreal: Pulp and Paper Institute of Canada;
1963.
[9] Elliott, D.R. The transportation of pulpwood chips in pipelines. Pulp and Paper
Magazine of Canada, 1960; 61: 170-75.
[10] Durand, R., Condolios, G. The hydraulic trasnport of coal and solids in pipes.
Hydraulic Transport of Coal Conference London; 1952.
[11] Hunt, W.A. Friction factors for mixtures of wood chips and water flowing in
pipelines. 4th Hydrotransport Internatinoal Conference. Banff, AB, Canada; 1976.
[12] Moller, K., Duffy, G.G., A.L., T. Design Correlation for Flow of Pulp
Suspensions in Pipes. Appita, 1973; 26: 278-82.
169
[13] Duffy, G.G., Moller, K., Lee, P.F.W., Milne, S.W.A. Design Correlations for
Groundwood Pulps and Effects of Minor Variables on Pulp Suspension Flow. Appita,
1974; 27: 327-33.
[14] Moller, K. General correlations of pipe friction data for pulp suspensions. Tappi,
1976; 59: 111-14.
[15] Duffy, G.G. The optimum design of pipelines for transporting wood pulp fiber
suspensions. Appita Journal, 1989; 42: 358-61.
[16] TAPPI. The Technical Association of the Pulp and Paper Industry (TAPPI).
Generalized method for determining the pipe friction loss of flowing pulp suspensions.
TIP 0410-14. Atlanta, GA, USA; 2007.
[17] Duffy, G.G., Titchene.Al. Design Procedures for Obtaining Pipe Friction Loss for
Chemical Pulps. Tappi, 1974; 57: 162-66.
[18] Duffy, G.G. Review and Evaluation of Design Methods for Calculating Friction
Loss in Stock Piping Systems. Tappi, 1976; 59: 124-27.
[19] Bowen, R.L. Series of articles. Chemical Engineering, 1961.
[20] Sauermann, H.B., Webster, I.W. Scaling-up slurry pressure gradients from test
loop data. CSIR Report No ME 1415. Pretoria, Australia 1975.
[21] Thomas, A.D. Scale-up methods for pipeline transport of slurries. International
Journal of Mineral Processing, 1976; 3: 51-69.
[22] Webster, I.W., Sauermann, H.B. Pressure gradient scale-up methods for slurry
pipelines. The South African Mechanical Engineer, 1978; 28: 312-17.
[23] Lokon, H.B., Johnson, P.W., Horsley, R.R. A scale-up model for predicting head
loss gradients in iron ore slurry pipelines Hydrotransport 8. Johannesburg, South Africa;
1982.
[24] American Society of Agricultural and Biological Engineers (ASABE). Moisture
measurement for forages. Standard S3582 St. Joseph, MI, US; 2008.
[25] American Society for Testing and Materials (ASTM). Standard test method for
density, relative density, and absorption of coarse aggregate. ASTM, Designation C127;
2012.
[26] McKendry, P. Energy production from biomass (part 1): overview of biomass.
Bioresource Technology, 2002; 83: 37-46.
170
[27] Rasband, W.S. http://rsb.info.nih.gov/ij/index.html, U.S. National Institutes of
Health, Accessed September 2011. 2008.
[28] ASABE. Method of determining and expressing particle size of chopped forage
materials by screening. Standard ANSI/ASAE S4241. St. Joseph, MI, US: American
Society of Agricultural and Biological Engineers, St. Joseph, MI, US; 2007.
[29] SIL Industrial Minerals Inc.,
http://www.sil.ab.ca/images/stories/pdf/Products/playsand.pdf, Accessed: Jan, 2014.
[30] Sheth, K.K., Morrison, G.L., Peng, W.W. Slip factors of centrifugal slurry pumps.
Journal of Fluids Engineering-Transactions of the Asme, 1987; 109: 313-18.
[31] Gahlot, V.K., Seshadri, V., Malhotra, R.C. Effect of Density, Size Distribution,
and Concentration of Solid on the Characteristics of Centrifugal Pumps. Journal of Fluids
Engineering-Transactions of the Asme, 1992; 114: 386-89.
[32] Sellgren, A. Performance of a centrifugal pump when pumping ores and industrial
minerals Hydrotransport, 1979; 1: 291-304.
[33] Elliott, D.R. The transportation of pulpwood chips in pipelines,. Pulp and Paper
Magazine of Canada, 1960; 61: 170-75.
[34] Faddick, R.R. Hydraulic transportation of solids in pipelines [dissertation].
Montana State University; 1970.
[35] Hunt, W.A. Friction factors for mixtures of wood chips and water flowing in
pipelines. 4th International Conference on the Hydraulic Transport of Solids in Pipes.
Alberta, Canada; 1976, p. 1-18.
[36] Brebner, A. On pumping of wood chips through 4-Inch Aluminum pipeline.
Canadian Journal of Chemical Engineering, 1964; 42: 139-42.
[37] Duffy, G.G., Lee, P.F.W. Drag reduction in turbulent flow of wood pulp
suspensions. Appita, 1978; 31: 280-86.
[38] Lee, P.F.W., Duffy, G.G. Analysis of drag reducing regime of pulp suspension
flow. Tappi, 1976 (a); 59: 119-22.
[39] Quantitative Micro Software (QMS), EViews 7.1. IHS Global Inc., Irvine, CA,
USA; 2010.
[40] Chatterjee, S., Simonoff, J.S. Handbook of Regression Analysis. Hoboken, New
Jersey: Wiley; 2013.
171
[41] Kwan, A.K.H., Mora, C.F., Chan, H.C. Particle shape analysis of coarse
aggregate using digital image processing. Cement and Concrete Research, 1999; 29:
1403-10.
[42] Adapa, P., Tabil, L., Schoenau, G. Grinding performance and physical properties
of non-treated and steam exploded barley, canola, oat and wheat straw. Biomass &
Bioenergy, 2011; 35: 549-61.
[43] Bitra, V.S.P., Womac, A.R., Yang, Y.C.T., Miu, P.I., Igathinathane, C.,
Chevanan, N., et al. Characterization of wheat straw particle size distributions as affected
by knife mill operating factors. Biomass & Bioenergy, 2011; 35: 3674-86.
[44] Chevanan, N., Womac, A.R., Bitra, V.S.P., Igathinathane, C., Yang, Y.T., Miu,
P.I., et al. Bulk density and compaction behavior of knife mill chopped switchgrass,
wheat straw, and corn stover. Bioresource Technology, 2010; 101: 207-14.
[45] Vaezi, M., Kumar, A. Pipeline hydraulic transport of biomass materials: A
review. Biomass & Bioenergy, 2014; XX.
[46] Radin, I., Zakin, J.L., Patterson, G.K. Drag reduction in solid-fluid systems. Aiche
Journal, 1975; 21: 358-71.
[47] Lee, P.F.W., Duffy, G.G. Velocity profiles in drag reducing regime of pulp
suspension flow. Appita, 1976 (b); 30: 219-26.
[48] Rao, N.J. Process piping design for pulp suspensions IPPTA, 1985; 22: 27-35.
[49] Duffy, G.G., Titchener, A.L., Lee, P.F.W., Moller, K. Mechanisms of Flow of
Pulp Suspensions in Pipes. Appita, 1976; 29: 363-70.
[50] Duffy, G.G. The significance of mechanistic-based models in fibre suspension
flow. Nordic Pulp & Paper Research Journal, 2003; 18: 74-80.
[51] Lee, P.F.W., Duffy, G.G. Velocity Profiles in Drag Reducing Regime of Pulp
Suspension Flow. Appita, 1976; 30: 219-26.
[52] Lee, P.F.W., Duffy, G.G. Analysis of Drag Reducing Regime of Pulp Suspension
Flow. Tappi, 1976; 59: 119-22.
[53] Luthi, O. The flow of MC fibre suspensions TAPPI Engineering Conference.
Atlanta; 1987, p. 347.
[54] Pande, H., Rao, N.J., Kapoor, S.K., Roy, D.N. Hydrodynamic behavior of
nonwood fiber suspensions. Tappi, 1999; 82: 140-45.
172
[55] Ingersoll-Rand Co. Cameron Hydraulic Data. 11 ed. New York, NY.
[56] Forrest, F., Grierson, G.H.A. Friction losses in cast iron pipe carrying paper stock
Paper Trade, 1931; 92: 39-41.
[57] Brecht, W., Heller, H. A Study of the Friction Losses of Paper Stock.
Suspensions. Tappi, 1950; 33.
[58] Durst, R.E., Chase, A.J., Jenness, L.C. An analysis of data on material flow in
pipes. Tappi, 1952; 35: 529.
[59] Riegel, P.S. XXX. Tappi, 1966; 49: 32A.
[60] Aktiebolaget Pumpindustri. (1966). Friction losses in piping systems for paper
stock suspensions. Goteborg, Sweden.
[61] Bodenheimer, V.B. Channeling in bleach towers and friction losses in pulp stock
lines. Southern Pulp and Paper Manufacture, 1969; 32: 42.
[62] Moller, K., Duffy, G.G., A.L., T. Laminar Plug Flow Regime of Paper Pulp
Suspensions in Pipes. Svensk Papperstidning-Nordisk Cellulosa, 1971; 74: 829-&.
[63] Genić, S., Arandjelović, I., Kolendić, P., Jarić, M., Budimir, N., Genić, V. A
review of explicit approximations of Colebrook's equation. FME Transactions, 2011; 39:
67-71.
173
CHAPTER 7
Is the Pipeline Hydro-transport of Wheat Straw and Corn
Stover to a Biorefinery Realistic?1
7.1. Introduction
The United Nations [1] reports biomass as the most significant type of fuel in terms of the
quantities used worldwide. Globally people depend on biomass more than any other fuel
for energy production. While the residential sector is the largest consumer of biomass for
small-scale applications, the industrial sector uses relatively small amount of biomass for
electricity generation and fuel/chemical production globally. Trucks are used as the main
mode of transporting biomass, and biomass materials come with low bulk density (kg/m3)
and low energy density (GJ/m3) compared to fossil fuels. These factors result in high
delivered cost of biomass, increasing frequency of delivery with increasing scale, and
subsequent traffic congestion concerns. Consequently, the desire for short distance truck
delivery with fewer congestion issues has favored small-scale biomass-based (bio-based)
energy facilities. The challenge with small-scale development is that the capital cost per
unit output of conversion facilities are high, resulting in high cost of product (i.e., heat,
electricity or liquid fuels) [2, 3]. Earlier work has suggested that biomass conversion
facilities have an economic optimum size at which the cost of production is minimum [4].
Such economic optimum size is a trade-off between the transportation cost of biomass (a
function of yield of biomass, dry t/ha) and the capital cost per unit output of the plant.
The studies have estimated the optimum sizes for a number of biomass-based products as
well [5]. At economic optimum sizes the requirement of biomass is large but even these
sizes of biomass-based facilities are very small compared to a fossil fuel based plants. For
example, the production of ethanol from corn stover exemplifies the issues around large-
scale industrial applications of biomass: a plant requires approximately 15 standard
highway trucks per hour to receive 2 M dry t/yr of corn stover and produces only 960
1 Paper submitted to the Journal of Biofuels, Bioproducts, and Biorefining, 2014
174
ML/yr of ethanol [6, 7];a very small production capacity compared to the 25 GL/yr
capacity of a typical oil refinery [8, 9].
Traffic congestion is not the only issue raised with increased scale. The transport and
logistics arrangements of biomass from its point of availability, i.e., farm or forest, to its
point of use, e.g., bio-based energy facility, contribute significantly to the total delivered
cost of biomass. This cost is directly proportional to the number and frequency of trucks
required and the distance over which the fuel has to be moved. These factors increase
with increasing scale, i.e., economies of scale do not apply to truck delivery [5, 10, 11].
Allen and Browne [12] reported the cost of transporting biomass to be 29%, 22%, 17%,
and 12% of the total delivered cost of straw, forest biomass, coppice, and miscanthus,
respectively. Epplin [13] estimated the cost to transport switchgrass to a conversion
facility to be 8.8 $/dry t or 24% of the total delivered cost. Morey et al. [14] found the
truck transport of round bales of corn stover to contribute 24.9% to the total cost. Aden et
al. [15] showed the contribution of corn stover delivery to the total delivered cost to be
24%. Kumar and Sokhansanj [16] also reported the cost of truck transport to contribute
between 40 to 80% of total cost of transportation, including loading, unloading, stacking,
and processing (size reduction) before or after transportation of biomass. Here there is an
obvious need to develop an alternative biomass delivery system which is cost effective
and can significantly reduce the delivered cost to a large-scale biomass-based facility,
also reduce the traffic congestion issue.
Pipeline hydro-transport of biomass (i.e., transporting biomass solid particle-water
mixtures in pipes) is an alternative mode of transport which can potentially reduce the
cost of biomass transportation compared to trucks, benefit from economy of scale, and
minimize the traffic congestion issues of overland transportation. Although such an
approach comes with limitations for applications involving combustion [17], there is no
penalty in pipeline hydro-transport of biomass in the form of a solid-liquid mixture
(slurry) for conversion processes such as ethanol production via fermentation [8],
hydrothermal hydrolysis [18], and hydrothermal liquefaction [19] since such conversion
processes are all aqueous. In this case, most of the equipment at the pipeline inlet facility
replaces those at the bio-refinery that would otherwise be required if biomass were
175
directly delivered to the plant, e.g., washing, shredding, sizing, and slurrying machines
[8]. Biomass slurry would contain almost the required amount of process water, and the
slurry would enter the facility directly with or without adjustments in the biomass-water
ratio, depending on the concentration at which the slurry is pipelined [20].
Kumar et al. [8, 17, 21] conducted a series of techno-economic analyses on pipeline
hydro-transport of wood chips and corn stover. They investigated one-way and two-way
pipeline scenarios wherein a one-way pipe would discharge/use the carrier liquid at the
receiving facility and a two-way pipe would return all or a portion of the carrier liquid to
the inlet facility. They found the cost of transport of wood chips by pipeline at a solid
volume content of 30% to be less than the cost of truck delivery at capacities above 0.5 M
dry t/yr for one-way pipeline and 1.25 M dry t/yr for two-way pipeline. They also studied
the cost of pipeline hydro-transport of corn stover at a 20% solids volume content,
compared it with the cost of truck delivery, and found that pipeline hydro-transport costs
less than truck delivery at capacities above 1.4 M dry t/yr for one-way pipeline and 4.4 M
dry t/yr for two-way pipeline. However, the pressure drop correlation used to obtain corn
stover pipeline cost estimates had been originally proposed for transporting wood chips-
water mixtures through a pipeline [22, 23]. Luk et al. [24] experimentally studied the
technical feasibility of pipelining wheat straw slurries in order to understand the pressure
drop behavior of corn stover and other agricultural residue (lignocellulosic) biomass
slurries, and Vaezi et al. [20, 25] investigated the friction loss behavior of the slurries of
knife-milled and size-classified wheat straw and corn stover particles in pipes as a
function of biomass particle type and size, slurry solid mass content, and slurry velocity.
They also proposed an empirical correlation to predict the pressure drop of the flow of
agricultural residue biomass slurries in pipes which were significantly different than the
correlations presented for wood chip-water mixtures.
In this work, the technical parameters and constraints as well as the empirical correlations
obtained through the course of experimental study by Vaezi et al. [20, 25-27], together
with the pipeline economic structure proposed by Kumar et al. [8, 17, 21], were used to
develop a data-intensive techno-economic model to estimate the cost of pipeline hydro-
176
transport of wheat straw and corn stover agricultural residue biomass to biorefinery. The
specific objectives of the present study are:
- Estimating the cost of pipeline hydro-transport of agricultural feedstocks using the
pressure drop correlations specifically proposed for agricultural residue biomass [25];
- Comparing the total cost of delivery with the total cost obtained using wood chip
pressure drop correlations;
- Estimation of the optimum slurry solid mass content and velocity to obtain the
highest throughput at the lowest transport cost;
- Investigating the effect of pipeline capacity and transport distance on the total cost of
delivery.
7.2. Techno-economic Modeling
Techno-economic models are powerful tools that combine the technical and financial
parameters of a system and help in decision making. In this study, a data-intensive
techno-economic model for the transport of wheat straw and corn stover agricultural
residue biomass via pipeline was developed. All the costs reported here, even those cited
from literature, are based on the 2014 U.S. dollar.
7.2.1. Truck Delivery
The truck transportation cost of biomass consists of two components: distance variable
cost (DVC) and distance fixed cost (DFC). The DVC includes equipment, labor, and fuel
associated with delivery of biomass and DFC is comprised of equipment and labor
associated with loading and unloading of biomass. Further details on this can be found in
literature elsewhere [15, 28-32]. The techno-economic model developed in this study
includes both DVC and DFC for truck delivery of biomass (Table 7-1). There is a
significant variation in the DVC reported earlier, as it is dependent on the type of biomass
feedstocks and the methodologies applied in estimation [8]. Figure 7-4 shows the total
truck delivery costs (DVC plus DFC for known distance). This figure indicates the
independency of truck delivery costs from capacity of transportation where no saving
occurs with larger throughputs.
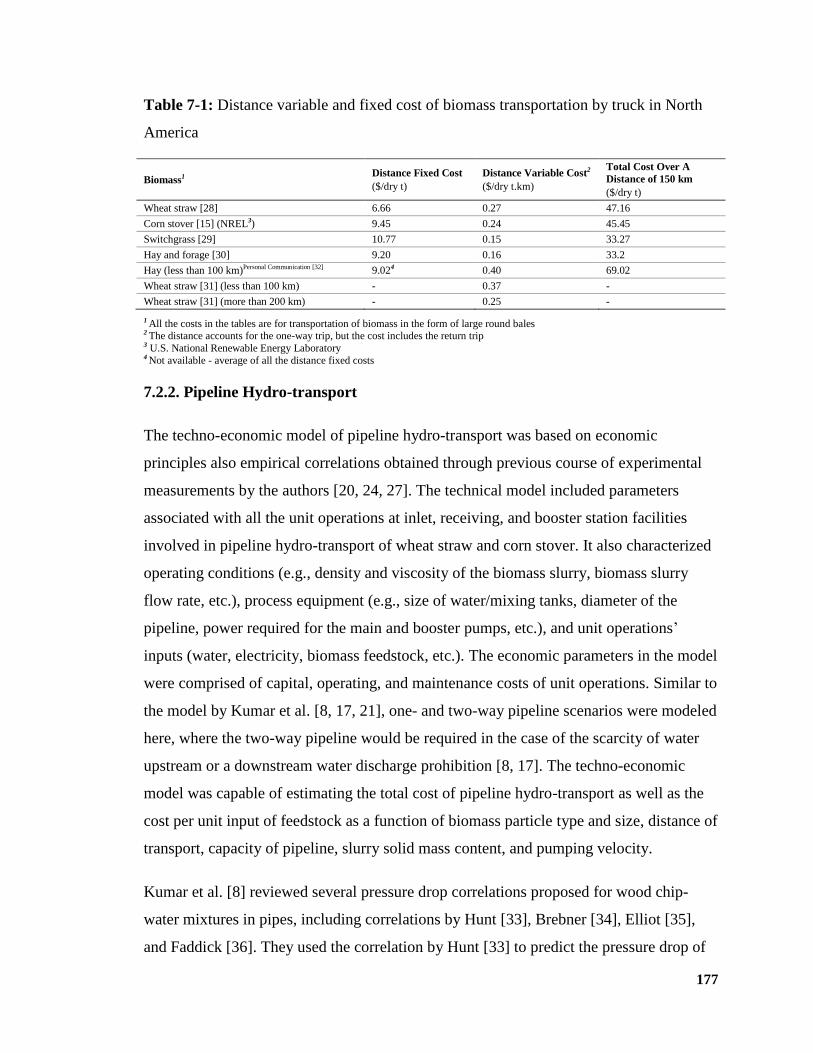
177
Table 7-1: Distance variable and fixed cost of biomass transportation by truck in North
America
Biomass1 Distance Fixed Cost
($/dry t)
Distance Variable Cost2
($/dry t.km)
Total Cost Over A
Distance of 150 km
($/dry t)
Wheat straw [28] 6.66 0.27 47.16
Corn stover [15] (NREL3) 9.45 0.24 45.45
Switchgrass [29] 10.77 0.15 33.27
Hay and forage [30] 9.20 0.16 33.2
Hay (less than 100 km)Personal Communication [32] 9.024 0.40 69.02
Wheat straw [31] (less than 100 km) - 0.37 -
Wheat straw [31] (more than 200 km) - 0.25 -
1 All the costs in the tables are for transportation of biomass in the form of large round bales 2 The distance accounts for the one-way trip, but the cost includes the return trip 3 U.S. National Renewable Energy Laboratory 4 Not available - average of all the distance fixed costs
7.2.2. Pipeline Hydro-transport
The techno-economic model of pipeline hydro-transport was based on economic
principles also empirical correlations obtained through previous course of experimental
measurements by the authors [20, 24, 27]. The technical model included parameters
associated with all the unit operations at inlet, receiving, and booster station facilities
involved in pipeline hydro-transport of wheat straw and corn stover. It also characterized
operating conditions (e.g., density and viscosity of the biomass slurry, biomass slurry
flow rate, etc.), process equipment (e.g., size of water/mixing tanks, diameter of the
pipeline, power required for the main and booster pumps, etc.), and unit operations’
inputs (water, electricity, biomass feedstock, etc.). The economic parameters in the model
were comprised of capital, operating, and maintenance costs of unit operations. Similar to
the model by Kumar et al. [8, 17, 21], one- and two-way pipeline scenarios were modeled
here, where the two-way pipeline would be required in the case of the scarcity of water
upstream or a downstream water discharge prohibition [8, 17]. The techno-economic
model was capable of estimating the total cost of pipeline hydro-transport as well as the
cost per unit input of feedstock as a function of biomass particle type and size, distance of
transport, capacity of pipeline, slurry solid mass content, and pumping velocity.
Kumar et al. [8] reviewed several pressure drop correlations proposed for wood chip-
water mixtures in pipes, including correlations by Hunt [33], Brebner [34], Elliot [35],
and Faddick [36]. They used the correlation by Hunt [33] to predict the pressure drop of
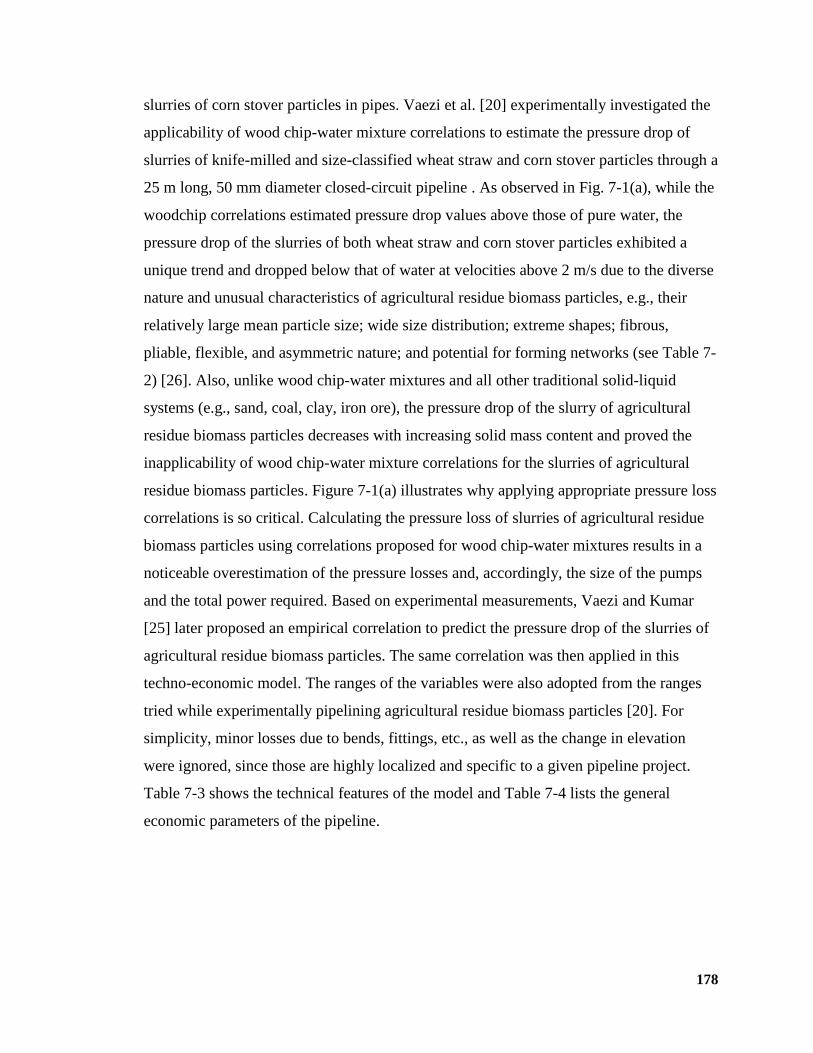
178
slurries of corn stover particles in pipes. Vaezi et al. [20] experimentally investigated the
applicability of wood chip-water mixture correlations to estimate the pressure drop of
slurries of knife-milled and size-classified wheat straw and corn stover particles through a
25 m long, 50 mm diameter closed-circuit pipeline . As observed in Fig. 7-1(a), while the
woodchip correlations estimated pressure drop values above those of pure water, the
pressure drop of the slurries of both wheat straw and corn stover particles exhibited a
unique trend and dropped below that of water at velocities above 2 m/s due to the diverse
nature and unusual characteristics of agricultural residue biomass particles, e.g., their
relatively large mean particle size; wide size distribution; extreme shapes; fibrous,
pliable, flexible, and asymmetric nature; and potential for forming networks (see Table 7-
2) [26]. Also, unlike wood chip-water mixtures and all other traditional solid-liquid
systems (e.g., sand, coal, clay, iron ore), the pressure drop of the slurry of agricultural
residue biomass particles decreases with increasing solid mass content and proved the
inapplicability of wood chip-water mixture correlations for the slurries of agricultural
residue biomass particles. Figure 7-1(a) illustrates why applying appropriate pressure loss
correlations is so critical. Calculating the pressure loss of slurries of agricultural residue
biomass particles using correlations proposed for wood chip-water mixtures results in a
noticeable overestimation of the pressure losses and, accordingly, the size of the pumps
and the total power required. Based on experimental measurements, Vaezi and Kumar
[25] later proposed an empirical correlation to predict the pressure drop of the slurries of
agricultural residue biomass particles. The same correlation was then applied in this
techno-economic model. The ranges of the variables were also adopted from the ranges
tried while experimentally pipelining agricultural residue biomass particles [20]. For
simplicity, minor losses due to bends, fittings, etc., as well as the change in elevation
were ignored, since those are highly localized and specific to a given pipeline project.
Table 7-3 shows the technical features of the model and Table 7-4 lists the general
economic parameters of the pipeline.

179
a) b)
Fig. 7-1: a) Friction factor of the wood chip-water mixtures and slurries of wheat straw
and corn stover particles vs. slurry flow Reynolds number, b) Input power to the
centrifugal slurry pump handling slurries of 3.2 mm wheat straw particles at 1800 rpm
Table 7-2: Physical properties and shape specifications of wheat straw and corn stover
knife-milled and size-classified particles
Solid
Particle
Nominal Particle
Size (mm)
Median
Length (mm) Particle
Aspect Ratio
Particle
Specific
Gravity
Particle Shape
Factor
Slurry Solid
Mass Content
Xn d50 ρp / ρf S Cd
Wheat
Straw
19.2 8.29 6.28
1.026
0.133 1-5.4
6.4 5.00 4.47 0.196 1-6.5
3.2 3.92 3.53 0.298 1-7.6
<3.2 2.42 3.47 0.908 1-8.8
Corn
Stover
19.2 7.58 5.93
1.169
0.113 -
6.4 4.72 4.08 0.169 1-6.5
3.2 3.32 2.88 0.351 1-7.6
<3.2 1.90 2.89 0.610 1-8.8
0.01
8.0E+04
Fri
ctio
n F
act
or
Reynolds Number
Water
Hunt's
Brebner's
Elliot's
Faddick's
Corn stover -
<3.2 mm - 8.8%0.0
0.03
2.0E+05 3.0E+05
2.5
3.5
4.5
5.5
6.5
0.0 5.0 10.0 15.0
Pu
mp
In
pu
t P
ow
er, k
W
Slurry Flow Rate, ×10-3 m3/s
Water
6.50%
4.30%
2.00%
180
Table 7-3: Input parameters for techno-economic model
Item Description/Value
Pipeline capacity* 250,000 to 4,000,000 M dry t/yr
Average transportation distance* 50 to 300 km
Slurry and water pipe material commercial steel pipe
Slurry and water pipe roughness [37] 0.06096 mm
Biomass particle type* wheat straw and corn stover
Biomass particle size [26]* Nominal: <3.2, 3.2, 6.4, and 19.2 mm
d50: 1.9 to 8.29 mm
Particle shape factor correlation [25, 27]
∑ ( )
√
Item Description
λ Parameter dependent of the flakiness of the
particle; dimensionless
Ms Mass of solid particle sample, kg
ρp Density of solid particle, kg/m3
Xgw Geometric mean width, mm
Xgl Geometric mean length, mm
As Solid particle area, mm2
Particle saturated moisture content [20] 82%
Saturated biomass particle density [20] 1050 kg/m3
Dry matter solid mass content* 2 to 8.8%
Slurry velocity* 1.5 to 4.5 m/s
Velocity of water in water return pipeline 2 m/s
Slurry pressure drop correlation [25]
Note: The model is not limited to the agricultural residue biomass studied here.
Common agricultural residue biomass or,
generally, non-wood fibers and energy crops, if ground, would be fibrous in nature
[38-40] and are expected to come with
similar mechanical behavior when mixed with water and pumped into pipeline.
∑(
)
(
)
Item Description
ΔH/L Longitudinal pressure gradient in the
pipe, kPa/m
S Solid particle shape factor;
dimensionless
V slurry bulk velocity, m/s
Cd Dry solid mass content, %
D Pipe internal diameter, m
α, β, γ, δ Constants
n = 1 n = 2 n = 3
α 1.2246 -1.9709 0.6485
β 0.0000 0.16389 0.0000
γ 0.0000 0.00000 0.0006
δ 0.0000 -0.0010 0.0000
D0 0.0508 m
Slurry and water pump efficiency [41] 80%
Maximum pressure of the pump 3100 kPa
* Model initial and operating variables
Table 7-4: General economic parameters of the techno-economic model
Item Values
Inflation rate 2.1%
Discount rate 10%
Life of pipeline 30 yr
Life of pump 20 yr
Capacity factor of pipeline 0.85
Maintenance cost of
- equipment 3% of capital cost
- pipeline 0.5% of capital cost
Power cost 50 $/MWh
Engineering cost 10% of total capital cost
Contingency cost 5% of total cost
Scale factor 0.75
181
A contingency cost equal by 5% of the total capital and engineering cost of pipeline was
calculated in the model, versus 20% contingency applied by Kumar et al. [17]. A
sensitivity analysis on contingency cost revealed increasing the contingency from 5% to
20% will increase the cost of pipeline hydro-transport of biomass ($/dry t/km) between 7
to 11%.
Table 7-5 summarizes the major unit operations at inlet, booster stations, and receiving
facilities together with the capital and operating/maintenance costs of the units. The unit
operations’ capital cost estimates were made according to correlations proposed in earlier
studies [17, 41-43]. The capital, operating, and maintenance costs were calculated here in
Table 7-5 for a sample case of pipeline hydro-transport of biomass: a 1.16 m diameter
one-way pipeline transporting 2,000,000 dry t/yr slurry of <3.2 mm (d50 = 2.42 mm)
wheat straw particles at 8.8% dry matter solid mass content and 2.5 m/s velocity over a
distance of 200 km. All the initial and operating variables were chosen from
corresponding ranges presented on Tables 7-2 and 7-3. The pipeline diameter was
calculated based on the pipeline transport capacity and slurry velocity, and the number of
booster stations was obtained by dividing the total pressure drop throughout the pipeline
by the total head produced by the main and booster pumps.
Pipeline hydro-transport has a cost structure similar to that of truck delivery with costs
either fixed or variable with distance. The fixed (distance-independent) cost is associated
with the equipment at inlet and receiving facilities, and variable (distance-dependent)
costs come from operating and maintenance costs, recovery of the capital investment in
the pipeline and booster stations, and associated infrastructures such as road access. Fixed
capital costs at inlet and receiving facilities are typically lower than the total capital costs
of the pipeline system. It can be observed on the same example as of Table 7-5 that, in a
pipeline with a capacity of 2 M dry t/yr that hydraulically transports an 8.8% slurry of
<3.2 mm wheat straw particles at a velocity of 2.5 m/s over a distance of 200 km, the
investment in inlet and receiving facilities comprises only 5.6% of the pipeline costs
(material, construction, etc.) and 5.2% of the total capital cost of the one-way pipeline
system.
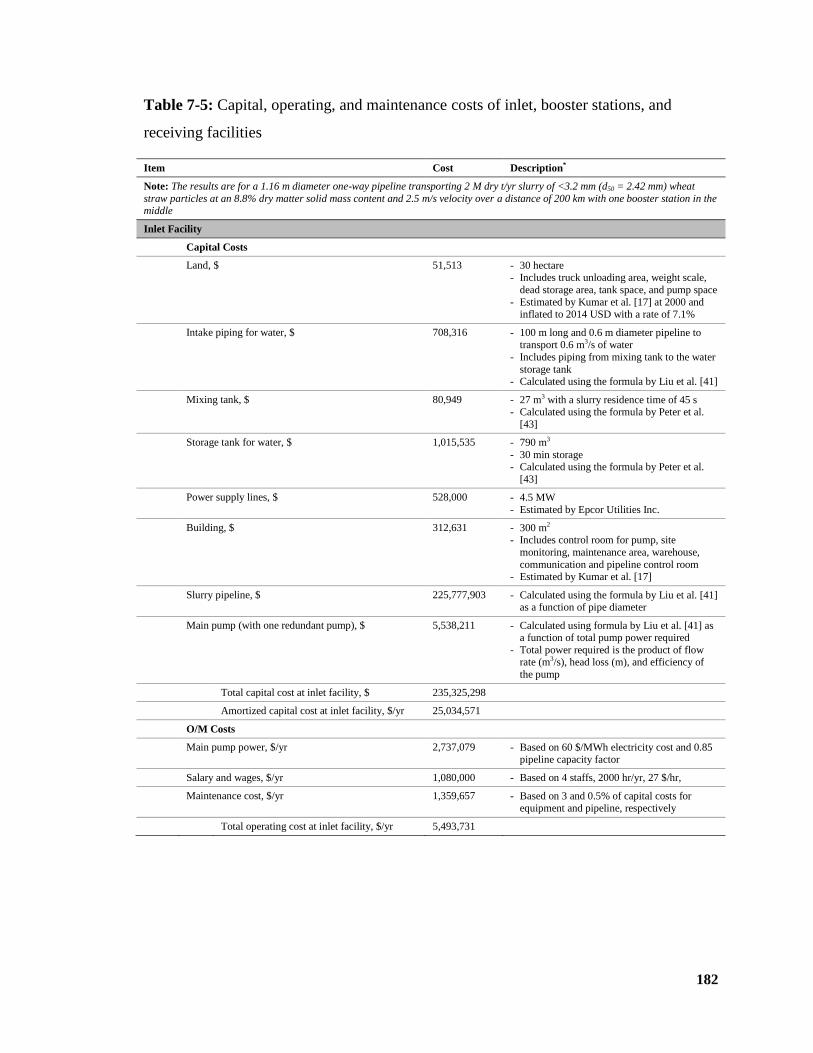
182
Table 7-5: Capital, operating, and maintenance costs of inlet, booster stations, and
receiving facilities
Item Cost Description*
Note: The results are for a 1.16 m diameter one-way pipeline transporting 2 M dry t/yr slurry of <3.2 mm (d50 = 2.42 mm) wheat
straw particles at an 8.8% dry matter solid mass content and 2.5 m/s velocity over a distance of 200 km with one booster station in the middle
Inlet Facility
Capital Costs
Land, $ 51,513 - 30 hectare - Includes truck unloading area, weight scale,
dead storage area, tank space, and pump space
- Estimated by Kumar et al. [17] at 2000 and inflated to 2014 USD with a rate of 7.1%
Intake piping for water, $ 708,316 - 100 m long and 0.6 m diameter pipeline to
transport 0.6 m3/s of water
- Includes piping from mixing tank to the water
storage tank - Calculated using the formula by Liu et al. [41]
Mixing tank, $ 80,949 - 27 m3 with a slurry residence time of 45 s - Calculated using the formula by Peter et al.
[43]
Storage tank for water, $ 1,015,535 - 790 m3
- 30 min storage - Calculated using the formula by Peter et al.
[43]
Power supply lines, $ 528,000 - 4.5 MW
- Estimated by Epcor Utilities Inc.
Building, $ 312,631 - 300 m2 - Includes control room for pump, site
monitoring, maintenance area, warehouse,
communication and pipeline control room
- Estimated by Kumar et al. [17]
Slurry pipeline, $ 225,777,903 - Calculated using the formula by Liu et al. [41] as a function of pipe diameter
Main pump (with one redundant pump), $ 5,538,211 - Calculated using formula by Liu et al. [41] as a function of total pump power required
- Total power required is the product of flow rate (m3/s), head loss (m), and efficiency of
the pump
Total capital cost at inlet facility, $ 235,325,298
Amortized capital cost at inlet facility, $/yr 25,034,571
O/M Costs
Main pump power, $/yr 2,737,079 - Based on 60 $/MWh electricity cost and 0.85 pipeline capacity factor
Salary and wages, $/yr 1,080,000 - Based on 4 staffs, 2000 hr/yr, 27 $/hr,
Maintenance cost, $/yr 1,359,657 - Based on 3 and 0.5% of capital costs for
equipment and pipeline, respectively
Total operating cost at inlet facility, $/yr 5,493,731
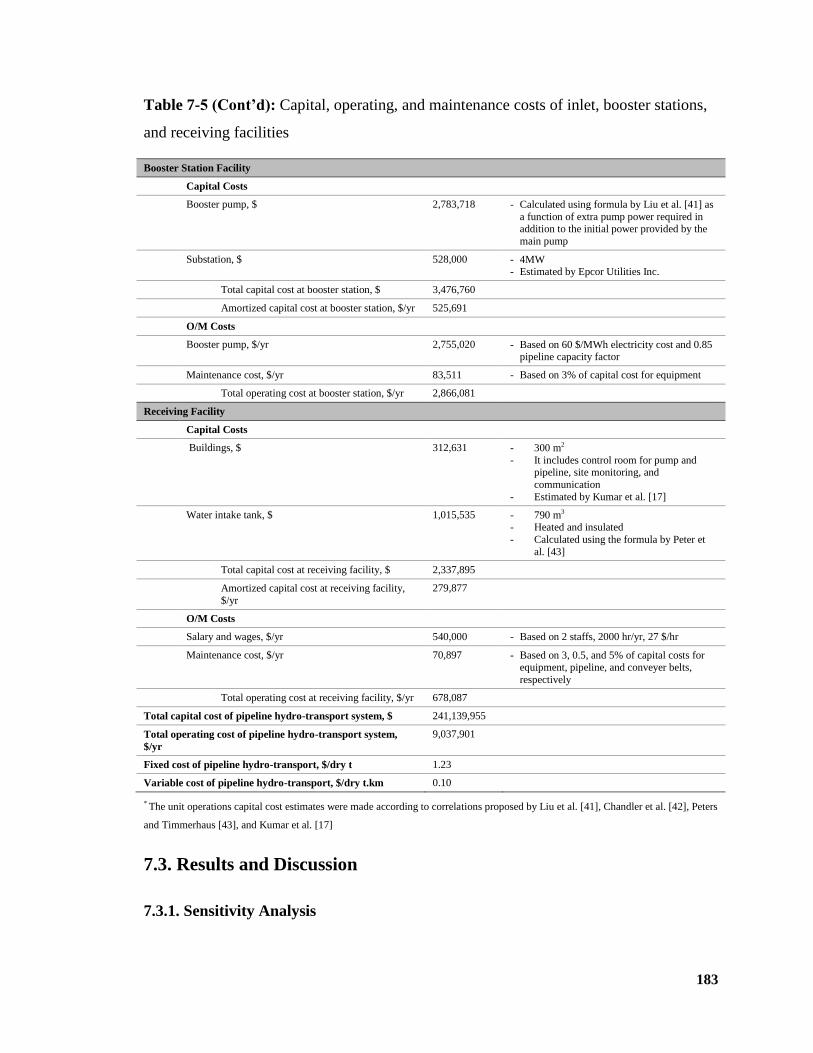
183
Table 7-5 (Cont’d): Capital, operating, and maintenance costs of inlet, booster stations,
and receiving facilities
Booster Station Facility
Capital Costs
Booster pump, $ 2,783,718 - Calculated using formula by Liu et al. [41] as
a function of extra pump power required in addition to the initial power provided by the
main pump
Substation, $ 528,000 - 4MW - Estimated by Epcor Utilities Inc.
Total capital cost at booster station, $ 3,476,760
Amortized capital cost at booster station, $/yr 525,691
O/M Costs
Booster pump, $/yr 2,755,020 - Based on 60 $/MWh electricity cost and 0.85 pipeline capacity factor
Maintenance cost, $/yr 83,511 - Based on 3% of capital cost for equipment
Total operating cost at booster station, $/yr 2,866,081
Receiving Facility
Capital Costs
Buildings, $ 312,631 - 300 m2
- It includes control room for pump and pipeline, site monitoring, and
communication
- Estimated by Kumar et al. [17]
Water intake tank, $ 1,015,535 - 790 m3 - Heated and insulated
- Calculated using the formula by Peter et
al. [43]
Total capital cost at receiving facility, $ 2,337,895
Amortized capital cost at receiving facility,
$/yr
279,877
O/M Costs
Salary and wages, $/yr 540,000 - Based on 2 staffs, 2000 hr/yr, 27 $/hr
Maintenance cost, $/yr 70,897 - Based on 3, 0.5, and 5% of capital costs for equipment, pipeline, and conveyer belts,
respectively
Total operating cost at receiving facility, $/yr 678,087
Total capital cost of pipeline hydro-transport system, $ 241,139,955
Total operating cost of pipeline hydro-transport system,
$/yr
9,037,901
Fixed cost of pipeline hydro-transport, $/dry t 1.23
Variable cost of pipeline hydro-transport, $/dry t.km 0.10
* The unit operations capital cost estimates were made according to correlations proposed by Liu et al. [41], Chandler et al. [42], Peters
and Timmerhaus [43], and Kumar et al. [17]
7.3. Results and Discussion
7.3.1. Sensitivity Analysis
184
Every single parameter studied here, if changed, could change the total cost of pipeline
hydro-transport independently of the other parameters. Of all the variables (biomass
particle type and size, pipeline capacity, pipeline length, and slurry solid mass content
and velocity), the slurry solid mass content and slurry velocity were optimized first, as
the former defines the material/water ratio at the inlet facility and the latter determines
the diameter of the pipe. In addition, the two variables impact the pressure drop
throughout the pipeline and contribute to the total power required. Therefore, the effect of
these parameters on the cost of pipeline hydro-transport was investigated first to obtain
the optimum (with respect to the cost) velocity and solid mass content.
Vaezi et al. [20] found that the slurry pressure drop decreased with increasing velocity
and solid mass content (Fig. 7-1(a)). In another study [27], it was observed that the pump
input power increased with an increase in slurry velocity and solid mass content (Fig. 7-
1(b)). Therefore, although increasing the slurry velocity and solid mass content decreased
the pressure drop, it increased the power required to run the centrifugal pumps. The
authors first tried to find an optimum slurry velocity and solid mass content where the
cost of pipeline hydro-transport was the lowest. Figure 7-2 presents the cost of hydro-
transport of <3.2 mm wheat straw particles using a commercial scale pipeline with a
capacity of 2 M dry t/yr over a long distance of 200 km as a function of slurry velocity
and solid mass content. Considering the variation of the cost of pipeline hydro-transport
with respect to the slurry solid mass content only, it was noted that the cost continuously
decreased with increasing solid mass content. This was because an increase in slurry solid
mass content decreased the slurry volumetric flow rate, which subsequently, at fixed
slurry velocity, decreased the pipe diameter and hence the corresponding capital costs.
However, at fixed slurry solid mass content, fluctuations in the cost were observed with
continuous increase in slurry velocity. The total cost first decreased with an increasing
velocity from 1.5 to 2.5 m/s and then increased with increasing velocity from 2.5 to 4.5
m/s. The reason is that although the diameter of the pipe and the total capital cost
continuously decreased with increasing velocity, the pressure drop and, consequently, the
number of booster stations and total operating cost increased with increasing velocity
more noticeably at elevated velocities.
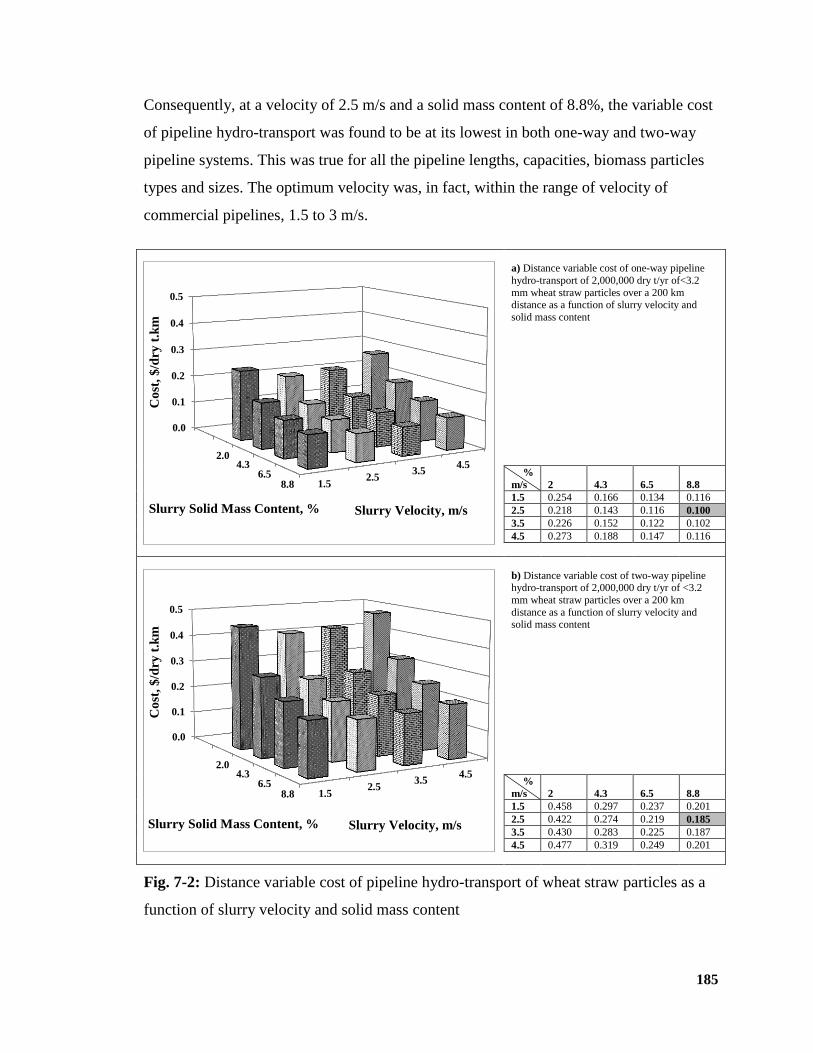
185
Consequently, at a velocity of 2.5 m/s and a solid mass content of 8.8%, the variable cost
of pipeline hydro-transport was found to be at its lowest in both one-way and two-way
pipeline systems. This was true for all the pipeline lengths, capacities, biomass particles
types and sizes. The optimum velocity was, in fact, within the range of velocity of
commercial pipelines, 1.5 to 3 m/s.
a) Distance variable cost of one-way pipeline
hydro-transport of 2,000,000 dry t/yr of<3.2
mm wheat straw particles over a 200 km distance as a function of slurry velocity and
solid mass content
%
m/s 2 4.3 6.5 8.8
1.5 0.254 0.166 0.134 0.116
2.5 0.218 0.143 0.116 0.100
3.5 0.226 0.152 0.122 0.102
4.5 0.273 0.188 0.147 0.116
b) Distance variable cost of two-way pipeline hydro-transport of 2,000,000 dry t/yr of <3.2
mm wheat straw particles over a 200 km
distance as a function of slurry velocity and solid mass content
%
m/s 2 4.3 6.5 8.8
1.5 0.458 0.297 0.237 0.201
2.5 0.422 0.274 0.219 0.185
3.5 0.430 0.283 0.225 0.187
4.5 0.477 0.319 0.249 0.201
Fig. 7-2: Distance variable cost of pipeline hydro-transport of wheat straw particles as a
function of slurry velocity and solid mass content
1.52.5
3.54.5
0.0
0.1
0.2
0.3
0.4
0.5
2.04.3
6.58.8
Slurry Velocity, m/s
Co
st,
$/d
ry t
.km
Slurry Solid Mass Content, %
1.52.5
3.54.5
0.0
0.1
0.2
0.3
0.4
0.5
2.04.3
6.58.8
Slurry Velocity, m/s
Co
st,
$/d
ry t
.km
Slurry Solid Mass Content, %
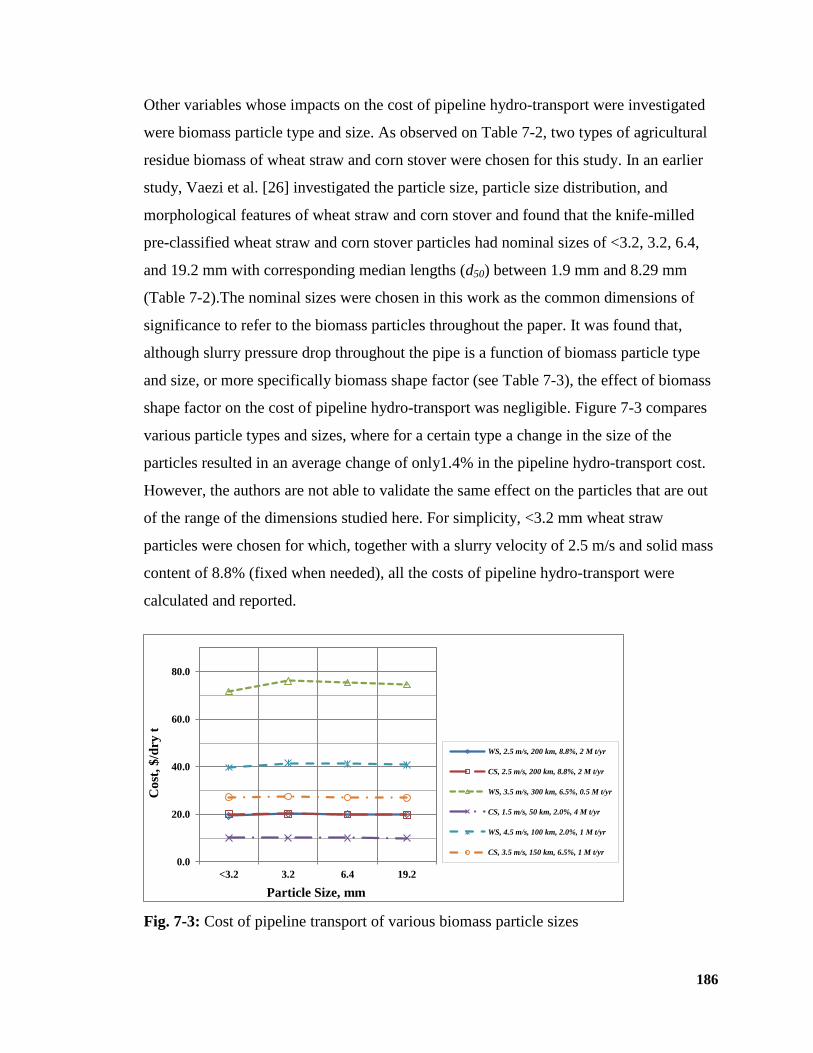
186
Other variables whose impacts on the cost of pipeline hydro-transport were investigated
were biomass particle type and size. As observed on Table 7-2, two types of agricultural
residue biomass of wheat straw and corn stover were chosen for this study. In an earlier
study, Vaezi et al. [26] investigated the particle size, particle size distribution, and
morphological features of wheat straw and corn stover and found that the knife-milled
pre-classified wheat straw and corn stover particles had nominal sizes of <3.2, 3.2, 6.4,
and 19.2 mm with corresponding median lengths (d50) between 1.9 mm and 8.29 mm
(Table 7-2).The nominal sizes were chosen in this work as the common dimensions of
significance to refer to the biomass particles throughout the paper. It was found that,
although slurry pressure drop throughout the pipe is a function of biomass particle type
and size, or more specifically biomass shape factor (see Table 7-3), the effect of biomass
shape factor on the cost of pipeline hydro-transport was negligible. Figure 7-3 compares
various particle types and sizes, where for a certain type a change in the size of the
particles resulted in an average change of only1.4% in the pipeline hydro-transport cost.
However, the authors are not able to validate the same effect on the particles that are out
of the range of the dimensions studied here. For simplicity, <3.2 mm wheat straw
particles were chosen for which, together with a slurry velocity of 2.5 m/s and solid mass
content of 8.8% (fixed when needed), all the costs of pipeline hydro-transport were
calculated and reported.
Fig. 7-3: Cost of pipeline transport of various biomass particle sizes
0.0
20.0
40.0
60.0
80.0
<3.2 3.2 6.4 19.2
Co
st,
$/d
ry t
Particle Size, mm
WS, 2.5 m/s, 200 km, 8.8%, 2 M t/yr
CS, 2.5 m/s, 200 km, 8.8%, 2 M t/yr
WS, 3.5 m/s, 300 km, 6.5%, 0.5 M t/yr
CS, 1.5 m/s, 50 km, 2.0%, 4 M t/yr
WS, 4.5 m/s, 100 km, 2.0%, 1 M t/yr
CS, 3.5 m/s, 150 km, 6.5%, 1 M t/yr
187
7.3.2. Truck Delivery vs. Pipeline Hydro-transport of Biomass
In light of the sensitivity analyses conducted on biomass particle type and size, as well as
slurry velocity and solid mass content, results were calculated for slurries of <3.2 mm
wheat straw particles at a velocity of 2.5 m/s. When needed, the solid mass content was
fixed at the optimum value of 8.8% dry matter, and the cost of pipeline hydro-transport
was compared with the total cost of truck delivery from four sources (Kumar et al. [28],
Aden et al. [15], and Duffy [29], and personal communication with a local transport
company [32]) and is shown in Table 7-1.
Figure 7-4 shows the cost of one-way and two-way pipeline hydro-transport of <3.2 mm
wheat straw particles at 2.5 m/s over 150 km as a function of pipeline capacity and slurry
solid mass content. As observed, unlike with truck delivery, there are strong economies
of scale in pipeline hydro-transport of agricultural residue biomass. The economies of
scale benefits are associated with the cost of pipeline and its construction, also the cost of
equipment at inlet and receiving facilities. Increasing the pipe diameter also decreases the
slurry pressure drop [17] which cause saving in the total pumping power required. For
instance, on a 200 km one-way pipeline transporting 8.8% solid mass content slurry of
<3.2 mm wheat straw particles at 2.5 m/s, doubling the pipeline capacity from 2 M dry
t/yr to 4 M dry t/yr, increased the capital cost, operating cost, and total cost by 49%, 27%,
and 44%, respectively. This resulted in a decrease in the total cost per unit mass delivered
($/dry t) by 28%. Liu et al. [41] suggested a capital cost scale factor of 0.59-0.62 for a
pipeline systems. However, a more conservative scale factor of 0.75 was applied here to
inlet, receiving, and booster station facilities, excluding pumps and pipes. Figure 7-4 also
reveals the significant cost of a two-way pipeline with the return of the carrier liquid, as
compared with a one-way pipeline.
For a given distance, pipeline hydro-transport costs decreased with increasing solid mass
content (as discussed in section 3.1) and pipeline capacity. The point at which pipeline
hydro-transport costs drop below truck delivery costs depends strongly on the total truck
delivery cost for a given distance. Based on an 8.8% slurry solid mass content, 2.5 m/s
slurry velocity, and the lowest estimate of the total truck delivery costs reported [29] (i.e.,
188
0.22 $/dry t.km), pipeline hydro-transport becomes economically more viable than truck
delivery at capacities of 0.45 M dry t/yr or more for a one-way pipeline and 1.4 M dry
t/yr or more for a two-way pipeline. However, the highest estimate of truck delivery costs
(i.e., 0.46 $/dry t) [32] would always cost more than pipeline hydro-transport for one-way
pipelines. It would also cost more for two-way pipelines with capacities above 0.35 M
dry t/yr.
For this specific case of study (<3.2 mm wheat straw particles at 2.5 m/s over 150 km), at
a typical pipeline capacity of 2 M dry t/yr and slurry solid mass content of 8.8%, 76% of
the total costs of a one-way pipeline system is due to its capital cost (22.6 M $/yr) and
24% are operating costs (7.3 M $/yr). Among the operating costs, the largest component,
56%, is electrical power for pumping (4.1 M $/yr). Corresponding numbers for two-way
pipelines are 80%, 20%, and 64%, respectively.
Figure 7-5 compares the DFC and DVC of pipeline hydro-transport and truck delivery of
biomass. The costs for pipeline hydro-transport of biomass are calculated for a slurry of
<3.2 mm wheat straw particles at the optimum slurry and operating conditions of 8.8%
solid mass content and 2.5 m/s velocity (section 3.1). The distance fixed and variable
costs for truck delivery are taken from Table 7-1. As observed in Fig. 7-4(a), all one-way
pipelines with transport capacities of 1 M dry t/yr and higher, always have DFC and DVC
lower than those for hauling by truck. For a one-way pipeline with a capacity of 0.5 M
dry t/yr, pipeline hydro-transport of biomass can compete with truck delivery only up to a
distance of 228 km, based on the lowest estimate of reported truck delivery costs [29].
For a one-way pipeline with a capacity of 0.25 M dry t/yr, the viability of the pipeline
hydro-transport of biomass depends strongly on DVC and DFC of truck delivery, as
considering the reported lowest estimate of the cost of truck delivery [29] makes the
pipeline competitive only up to a distance of 30 km, and choosing the highest cost
estimate of truck delivery [32] makes the pipeline hydro-transport cost always less than
truck delivery.
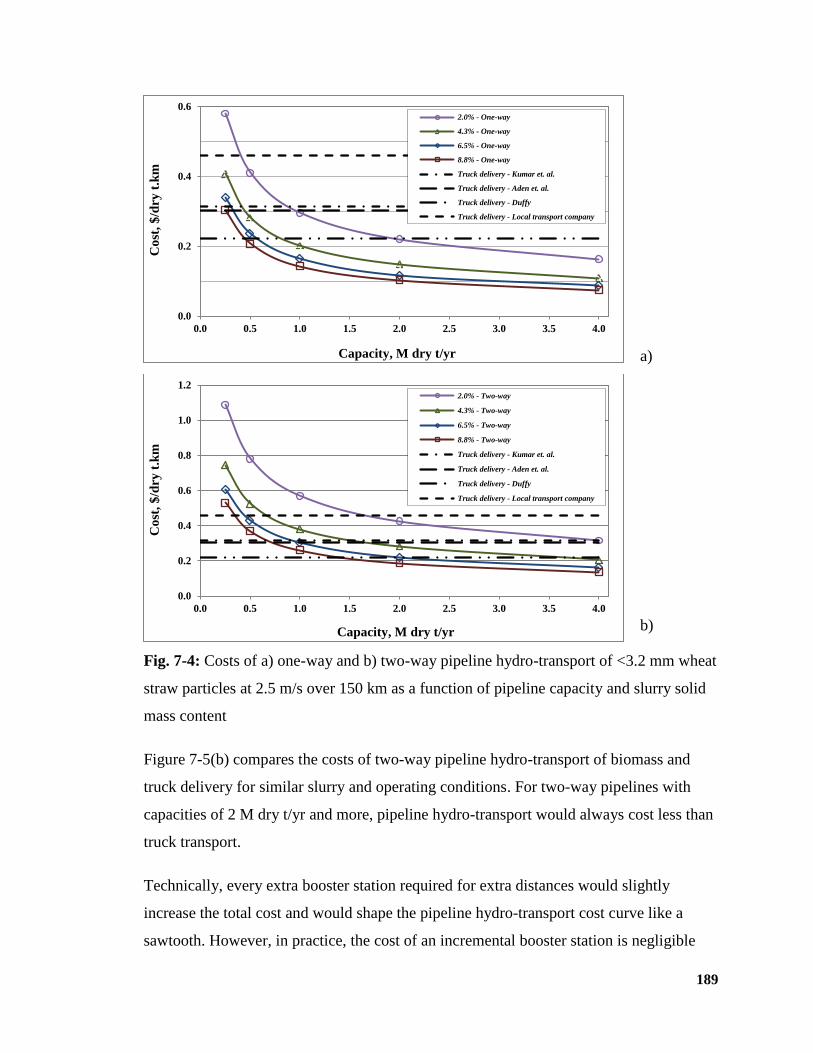
189
a)
b)
Fig. 7-4: Costs of a) one-way and b) two-way pipeline hydro-transport of <3.2 mm wheat
straw particles at 2.5 m/s over 150 km as a function of pipeline capacity and slurry solid
mass content
Figure 7-5(b) compares the costs of two-way pipeline hydro-transport of biomass and
truck delivery for similar slurry and operating conditions. For two-way pipelines with
capacities of 2 M dry t/yr and more, pipeline hydro-transport would always cost less than
truck transport.
Technically, every extra booster station required for extra distances would slightly
increase the total cost and would shape the pipeline hydro-transport cost curve like a
sawtooth. However, in practice, the cost of an incremental booster station is negligible
0.0
0.2
0.4
0.6
0.0 0.5 1.0 1.5 2.0 2.5 3.0 3.5 4.0
Co
st,
$/d
ry t
.km
Capacity, M dry t/yr
2.0% - One-way
4.3% - One-way
6.5% - One-way
8.8% - One-way
Truck delivery - Kumar et. al.
Truck delivery - Aden et. al.
Truck delivery - Duffy
Truck delivery - Local transport company
0.0
0.2
0.4
0.6
0.8
1.0
1.2
0.0 0.5 1.0 1.5 2.0 2.5 3.0 3.5 4.0
Co
st,
$/d
ry t
.km
Capacity, M dry t/yr
2.0% - Two-way
4.3% - Two-way
6.5% - Two-way
8.8% - Two-way
Truck delivery - Kumar et. al.
Truck delivery - Aden et. al.
Truck delivery - Duffy
Truck delivery - Local transport company
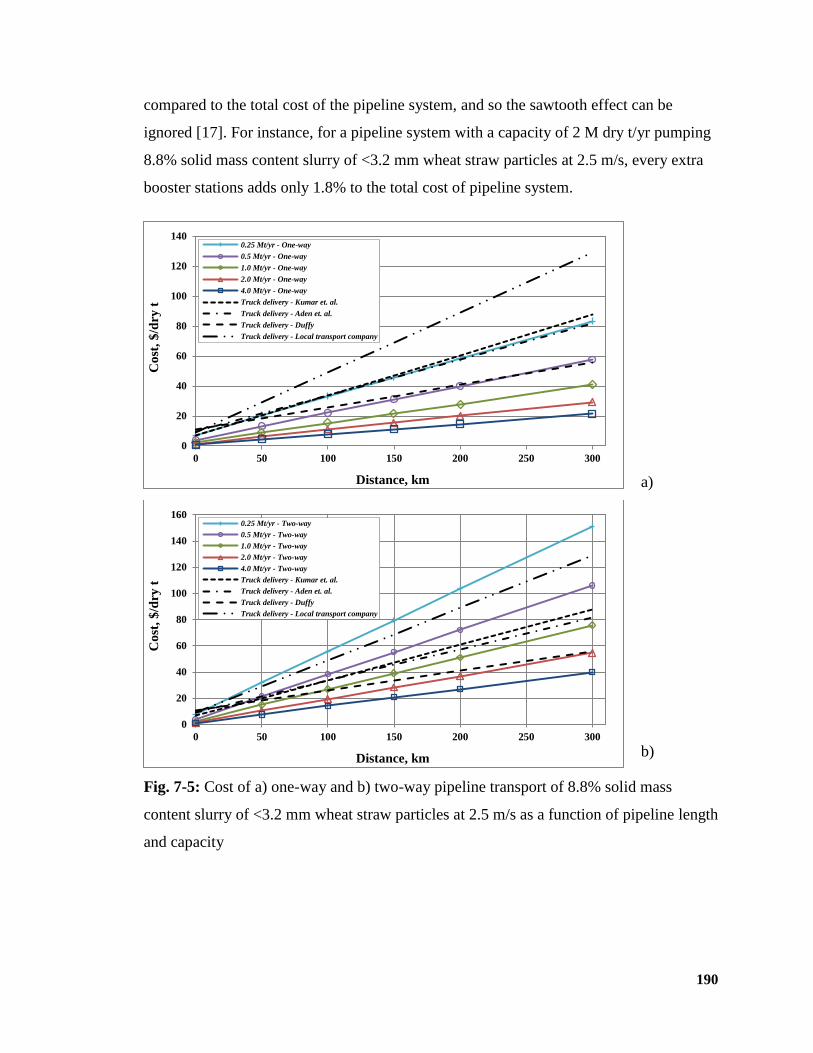
190
compared to the total cost of the pipeline system, and so the sawtooth effect can be
ignored [17]. For instance, for a pipeline system with a capacity of 2 M dry t/yr pumping
8.8% solid mass content slurry of <3.2 mm wheat straw particles at 2.5 m/s, every extra
booster stations adds only 1.8% to the total cost of pipeline system.
a)
b)
Fig. 7-5: Cost of a) one-way and b) two-way pipeline transport of 8.8% solid mass
content slurry of <3.2 mm wheat straw particles at 2.5 m/s as a function of pipeline length
and capacity
0
20
40
60
80
100
120
140
0 50 100 150 200 250 300
Co
st,
$/d
ry t
Distance, km
0.25 Mt/yr - One-way
0.5 Mt/yr - One-way
1.0 Mt/yr - One-way
2.0 Mt/yr - One-way
4.0 Mt/yr - One-way
Truck delivery - Kumar et. al.
Truck delivery - Aden et. al.
Truck delivery - Duffy
Truck delivery - Local transport company
0
20
40
60
80
100
120
140
160
0 50 100 150 200 250 300
Co
st,
$/d
ry t
Distance, km
0.25 Mt/yr - Two-way
0.5 Mt/yr - Two-way
1.0 Mt/yr - Two-way
2.0 Mt/yr - Two-way
4.0 Mt/yr - Two-way
Truck delivery - Kumar et. al.
Truck delivery - Aden et. al.
Truck delivery - Duffy
Truck delivery - Local transport company
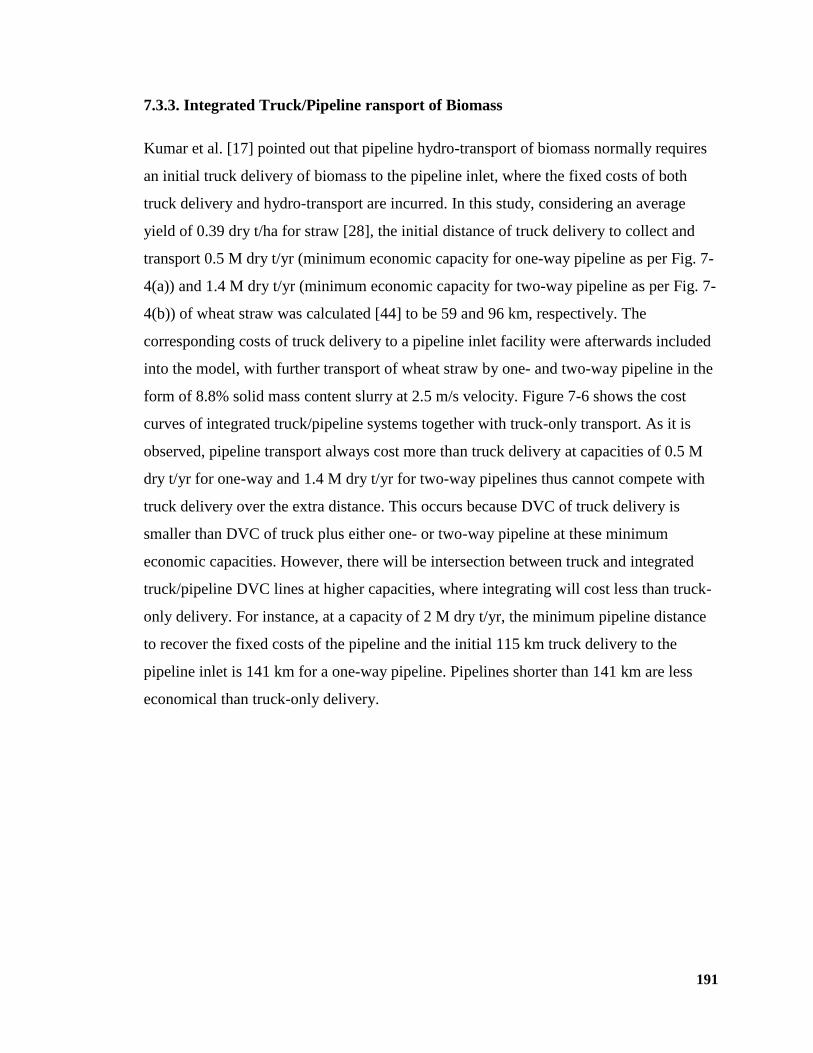
191
7.3.3. Integrated Truck/Pipeline ransport of Biomass
Kumar et al. [17] pointed out that pipeline hydro-transport of biomass normally requires
an initial truck delivery of biomass to the pipeline inlet, where the fixed costs of both
truck delivery and hydro-transport are incurred. In this study, considering an average
yield of 0.39 dry t/ha for straw [28], the initial distance of truck delivery to collect and
transport 0.5 M dry t/yr (minimum economic capacity for one-way pipeline as per Fig. 7-
4(a)) and 1.4 M dry t/yr (minimum economic capacity for two-way pipeline as per Fig. 7-
4(b)) of wheat straw was calculated [44] to be 59 and 96 km, respectively. The
corresponding costs of truck delivery to a pipeline inlet facility were afterwards included
into the model, with further transport of wheat straw by one- and two-way pipeline in the
form of 8.8% solid mass content slurry at 2.5 m/s velocity. Figure 7-6 shows the cost
curves of integrated truck/pipeline systems together with truck-only transport. As it is
observed, pipeline transport always cost more than truck delivery at capacities of 0.5 M
dry t/yr for one-way and 1.4 M dry t/yr for two-way pipelines thus cannot compete with
truck delivery over the extra distance. This occurs because DVC of truck delivery is
smaller than DVC of truck plus either one- or two-way pipeline at these minimum
economic capacities. However, there will be intersection between truck and integrated
truck/pipeline DVC lines at higher capacities, where integrating will cost less than truck-
only delivery. For instance, at a capacity of 2 M dry t/yr, the minimum pipeline distance
to recover the fixed costs of the pipeline and the initial 115 km truck delivery to the
pipeline inlet is 141 km for a one-way pipeline. Pipelines shorter than 141 km are less
economical than truck-only delivery.
192
Fig. 7-6: Comparison of integrated truck/pipeline transport with truck-only delivery of
<3.2 mm wheat straw particles at one-way pipeline capacities of 0.5 and 2 M dry t/yr and
two-way pipeline capacity of 1.4 M dry t/yr, slurry solid mass content of 8.8%, and
pipeline slurry velocity of 2.5 m/s
7.4. Conclusions
Pipeline hydro-transport can economically compete with truck delivery of agricultural
residue biomass at medium to large capacities over long distances. Based on 8.8% slurry
solid mass content, 2.5 m/s slurry velocity, 150 km medium-range distance, and the
lowest estimate of the total cost of truck delivery reported (0.22 $/dry t.km), pipeline
hydro-transport is economically more viable than truck delivery at capacities of 0.5 M
dry t/yr or more for one-way pipelines and 1.4 M dry t/yr or more for two-way pipelines.
Considering the highest estimate of the total cost of truck delivery reported ($0.46/dry t),
pipeline hydro-transport of the same slurry would always cost less than truck delivery for
one-way pipeline, also it would cost less than truck delivery at capacities above 0.35 M
dry t/yr for two-way pipelines. Integrated truck/pipeline transport of agricultural residue
biomass at minimum economic capacities of 0.5 and 1.4 M dry t/yr for one- and two-way
pipeline with initial truck delivery of 59 and 96 km was also studied. For these scenarios,
pipeline transport was found economically not capable of competing with truck delivery
over the extra distance. However, benefits were found at higher capacities to integrate
truck and pipeline, where truck plus pipeline transport of biomass would cost less than
0
10
20
30
40
50
0 40 80 120 160 200
Co
st,
$/d
ry t
Distance, km
Truck plus two-way pipeline transport
at a capacity of 1.4 M dry t/yr
Truck plus one-way pipeline transport
at a capacity of 0.5 M dry t/yr
Truck plus one-way pipeline transport
at a capacity of 2 M dry t/yr
Truck delivery - Duffy
59 96 115 141

193
truck-only delivery. Understanding the structure of the cost of the pipelines transporting
agricultural residue biomass helps to identify and optimize critical variables to reduce the
total cost of delivery and enable bio-based energy facilities to achieve higher capacities.
194
References
[1] UN. Green energy: biomass fuels and the evironment. Geneva, Switzerland
United Nations; 1991.
[2] Miller, P., Kumar, A. Techno-economic assessment of hydrogenation-derived
renewable diesel production from canola and camelina. Sustainable Energy Technologies
and Assessments, 2014; 6: 105-15.
[3] Sarkar, S., Kumar, A., Sultana, A. Biofuels and biochemicals production from
forest biomass in Western Canada. Energy, 2011; 36: 6251-62.
[4] Ruth, M. Large scale ethanol facilities and short cut for changing facility size.
Internal Report, National Renewable Energy Laboratory (NREL); 1999.
[5] Sultana, A., Kumar, A. Optimal configuration and combination of multiple
lignocellulosic biomass feedstocks delivery to a biorefinery. Bioresource Technology,
2011; 102: 9947-56.
[6] Kadam, K.L., McMillan, J.D. Availability of corn stover as a sustainable
feedstock for bioethanol production. Bioresource Technology, 2003; 88: 17-25.
[7] Sokhansanj, S., Turhollow, A., Cushman, J., Cundiff, J. Engineering aspects of
collecting corn stover for bioenergy. Biomass & Bioenergy, 2002; 23: 347-55.
[8] Kumar, A., Cameron, J.B., Flynn, P.C. Pipeline transport and simultaneous
saccharification of corn stover. Bioresource Technology, 2005 (b); 96: 819-29.
[9] Wallace, B., Yancey, M., Easterly, J. Bioethanol co-location with a coal-fired
power plant. 25th Symposium on Biotechnology for Fuels and Chemicals Breckenridge,
CO; 2003.
[10] Sarkar, S., Kumar, A. Biohydrogen production from forest and agricultural
residues for upgrading of bitumen from oil sands. Energy, 2010; 35: 582-91.
[11] Sultana, A., Kumar, A., Harfield, D. Development of agri-pellet production cost
and optimum size. Bioresource Technology, 2010; 101: 5609-21.
[12] Allen, J., Browne, M. Logistics management and costs of biomass fuel supply.
International Journal of Physical Distribution & Logistics Management, 1998; 28: 463-
77.
195
[13] Epplin, F.M. Cost to produce and deliver switchgrass biomass to an ethanol-
conversion facility in the Southern Plains of the United States. Biomass & Bioenergy,
1996; 11: 459-67.
[14] Morey, R.V., Kaliyan, N., Tiffany, D.G., Schmidt, D.R. A biomass supply
logistics system. 2009, p. 4802-14.
[15] Aden, A., Ruth, M., Ibsen, K., Jechura, J., Neeves, K., Sheehan, J., et al.
Lignocellulosic biomass to ethanol process design and economics utilizing co-current
dilute acid prehydrolysis and enzymatic hydrolysis for corn stover (Report No TP-510-
32438). National Renewable Energy Laboratory (NREL); 2002.
[16] Kumar, A., Sokhansanj, S. Switchgrass (Panicum vigratum, L.) delivery to a
biorefinery using integrated biomass supply analysis and logistics (IBSAL) model.
Bioresource Technology, 2007; 98: 1033-44.
[17] Kumar, A., Cameron, J.B., Flynn, P.C. Pipeline transport of biomass. Applied
Biochemistry and Biotechnology, 2004; 113: 27-39.
[18] Thangavelu, S.K., Ahmed, A.S., Ani, F.N. Bioethanol production from sago pith
waste using microwave hydrothermal hydrolysis accelerated by carbon dioxide. Applied
Energy, 2014; 128: 277-83.
[19] Zhu, Y., Biddy, M.J., Jones, S.B., Elliott, D.C., Schmidt, A.J. Techno-economic
analysis of liquid fuel production from woody biomass via hydrothermal liquefaction
(HTL) and upgrading. Applied Energy, 2014; 129: 384-94.
[20] Vaezi, M., Katta, A.K., Kumar, A. Investigation into the mechanisms of pipeline
transport of slurries of wheat straw and corn stover to supply a bio-refinery. Biosystems
Engineering, 2014; 118: 52-67.
[21] Kumar, A., Cameron, J.B., Flynn, P.C. Large-scale ethanol fermentation through
pipeline delivery of biomass. Applied Biochemistry and Biotechnology, 2005 (a); 121:
47-58.
[22] Hunt, W.A. Friction factors for mixtures of wood chips and water flowing in
pipelines,. 4th International Conference on the Hydraulic Transport of Solids in Pipes.
Alberta, Canada; 1976., p. 1-18.
[23] Wasp, E.J., Aude, T.C., Thompson, T.L., Bailey, C.D. Economics of chip
pipelining. Tappi, 1967; 50: 313-18.
196
[24] Luk, J., Mohammadabadi, H.S., Kumar, A. Pipeline transport of biomass:
Experimental development of wheat straw slurry pressure loss gradients Biomass and
Bioenergy, 2014; 64: 329-36.
[25] Vaezi, M., Kumar, A. A design correlation for the flow of agricultural waste
biomass slurries in pipes Biosystems Engineering, 2014; XX.
[26] Vaezi, M., Pandey, V., Kumar, A., Bhattacharyya, S. Lignocellulosic biomass
particle shape and size distribution analysis using digital image processing for pipeline
hydro-transportation. Biosystems Engineering, 2013; 114: 97-112.
[27] Vaezi, M., Kumar, A. The flow of wheat straw suspensions in an open impeller
centrifugal pump. Biomass and Bioenergy, 2014; XX: XX.
[28] Kumar, A., Cameron, J.B., Flynn, P.C. Biomass power cost and optimum plant
size in western Canada. Biomass & Bioenergy, 2003; 24: 445-64.
[29] Duffy, M. Estimated costs for production, storage and transportation of
switchgrass. Ag Decision Maker: An agricultural economics and business; 2008.
[30] Dhuyvetter, K.C. 2014 projected custom rates for Kansas. Kansas State
University, Department of Agricultural Economics 2014.
[31] DeSmet, O. Bales R Us Co.; 2014.
[32] Personal communication with local truck transport company In: Schmuecker, B.,
editor. Sherwood Park, Alberta, +1 403 795 7997; May 7th, 2014.
[33] Hunt, W.A. Friction factors for mixtures of wood chips and water flowing in
pipelines. 4th International Conference on the Hydraulic Transport of Solids in Pipes.
Alberta, Canada; 1976, p. 1-18.
[34] Brebner, A. On pumping of wood chips through 4-Inch Aluminum pipeline.
Canadian Journal of Chemical Engineering, 1964; 42: 139-42.
[35] Elliott, D.R. The transportation of pulpwood chips in pipelines,. Pulp and Paper
Magazine of Canada, 1960; 61: 170-75.
[36] Faddick, R.R. Head loss studies of transport of woodchips in pielines.
[dissertation]. Queen's University; 1963.
[37] White, F.M. Fluid mechanics 7th ed. New York, N.Y. : McGraw Hill; 2011.
197
[38] Adapa, P., Tabil, L., Schoenau, G. Grinding performance and physical properties
of non-treated and steam exploded barley, canola, oat and wheat straw. Biomass &
Bioenergy, 2011; 35: 549-61.
[39] Bitra, V.S.P., Womac, A.R., Yang, Y.C.T., Miu, P.I., Igathinathane, C.,
Chevanan, N., et al. Characterization of wheat straw particle size distributions as affected
by knife mill operating factors. Biomass & Bioenergy, 2011; 35: 3674-86.
[40] Chevanan, N., Womac, A.R., Bitra, V.S.P., Igathinathane, C., Yang, Y.T., Miu,
P.I., et al. Bulk density and compaction behavior of knife mill chopped switchgrass,
wheat straw, and corn stover. Bioresource Technology, 2010; 101: 207-14.
[41] Liu, H., Noble, J., Zuniga, R., Wu, J. Economic analysis of coal log pipeline
transportation of coal. Report No 95-1. Capsule Pipeline Research Center (CPRC),
University of Missouri, Columbia, USA; 1995.
[42] Chandler, H.M. RS Means Company - Heavy construction data, 14th annual
edition Kingston, USA; 2000.
[43] Peter, M.S., Timmerhaus, K.D. Plant design and economics for chemical
engineers 4th ed. New York, NY, USA: McGraw-Hill; 1991.
[44] Overend, R.P. The average haul distance and transportation work factors for
biomass delivered to a central plant. Biomass, 1982; 2: 75-79.
198
CHAPTER 8
Conclusion and Recommendations for Future Research
8.1. Conclusion
Pipeline hydro-transport of agricultural residue biomass (wheat straw and corn stover)
was experimentally studied in a 50 mm diameter and 25.5 m long closed-circuit pipeline
facility. Several technical, modeling, and economic issues were investigated to
understand the feasibility of pipeline hydro-transport of agricultural residue, as well as
the technical limitations, equipment performance, governing formulas, and economic
viability of such a pipeline system.
A review was first performed on the literature published on pipeline hydro-transport of
biomass materials. A series of experiments was conducted on pipeline transport of wood
chip-water mixtures over a wide range of pipeline materials, pipeline lengths, pipeline
diameters, wood chips moisture contents, wood chip diameters, and wood chip-water
mixture concentrations and velocities. It was found that mounting the pipeline
horizontally, increasing the pipe diameter, and decreasing mixture solid volume content
give the optimum pipeline conditions and reduce the probability of wood chips blockade
throughout the pipe. Several investigators also proposed correlations to predict the
friction loss of laminar and turbulent wood chip-water mixture flows of various regimes
in pipes. A deviation of 30% between estimated values of the friction loss of the same
mixture using various correlations and a deviation of 300% between estimated values and
experimental measurements were reported in literature, which pointed out the need for
additional experimental work. Finally, based on experimental measurements and
empirical correlation reported in literature, a few researchers studied the economic
feasibility of pipelining wood chip-water mixtures to processing plants. The concept of
economy of scale was found to be highly applicable to these biomass pipeline systems. It
was shown that the power required and, accordingly, the operating costs of the pipeline
system would decrease and the capital costs of the pipeline system would increase with
199
an increase in solid volume content, decrease in mixture velocity, and increase in pipeline
length. Furthermore, capital charges were reported to account for more than 70% of the
total transportation cost. Some investigators used friction loss correlations originally
proposed for wood chip-water mixtures to estimate pressure drop and associated costs of
water mixtures of other sorts of biomass (e.g, corn stover) in pipes. It was found that
more research needed to be conducted in this field to develop specific empirical friction
loss correlations for specific biomass particles and to understand how the mechanical and
economic features would change with the change of biomass type and size.
Apart from several factors affecting initial and operating parameters, biomass particle
size/size distribution (PSD) and morphological features are critical in biomass slurry
pipeline transport. Therefore, using ImageJ image processing platform, a user-coded
plugin was developed in this research to process biomass sample images, measure
biomass particle dimensions, and analyse the PSD of knife-milled wheat straw and corn
stover, which were pre-classified into four nominal size groups. The particles aspect
ratios ranged between 4.51 to 10.08, and 3.71 to 6.71 for wheat straw and corn stover,
respectively. Of the three distribution functions tested, the Rosin-Rammler equation best
fitted the size distribution of the samples, with least some-of-square error in all scenarios.
The particle size reduction (degradation) effect, mainly due to passing through boosting
stations’ centrifugal pumps impellers, was also studied. The d50 of 8.04 mm of 19.2 mm
wheat straw particles were reduced by ~29% to 5.74 mm, with 15% within the first hour
after pumping. Finally, the micro-scale surface features of wheat straw and corn stover
particles were investigated and the corn stover particles were found to be more irregular
and to come with many bumps, peaks, and valleys, compared to ribbed wheat straw
fibres.
To understand the mechanical specifications of the flow of slurry of agricultural residue
biomass, pipeline hydro-transport of wheat straw and corn stover was experimentally
investigated in a 50 mm diameter and 25.5 long closed-circuit pipeline facility. While no
similarity was observed between friction loss behaviour of the slurries of wood chips and
corn stover particles, the slurry of fibrous agricultural residue biomass particles exhibited
drag-reducing feature at high flow rates. A maximum drag reduction of 33% could be
200
achieved with an 8.8% slurry of <3.2 mm corn stover particles at a slurry flow rate of 5.0
m/s. In addition, the dependency of the rheological behaviour of the slurry and the
longitudinal pressure gradient on feedstock type, particle dimension, slurry solid mass
content, and slurry flow rate were investigated. The solid mass content affected the slurry
friction loss behaviour differently than the conventional solid-liquid systems did, and the
pressure gradient decreased with increasing solid mass content. The impact of particle
size distribution was recognised with broad size distributions producing lower friction
losses at high flow rates where 19.2 mm wheat straw particles (which come with a wide
size range of 18.4 mm) reduced the pressure drop more noticeably at velocities above 2.5
m/s compared to <3.2 mm particles with a narrow size range of 5.2 mm. Friction loss
variations were also well explained based on two different momentum transfer
mechanisms, where an increase in flow rate and a corresponding increase in the intensity
of turbulence and a decrease in average floc size in the turbulent annulus with a decrease
in momentum transfer were both found to increase drag reduction in the transition flow
regime before reaching the maximum drag-reduction asymptote. Also, it was concluded
that for given particle types and slurry solid mass content, increasing the particle length
increases the drag reduction onset velocity.
In the next step, efforts were made to understand how the agricultural residue biomass
slurry properties impact the performance of the mechanical equipment throughout the
pipeline. The effect of wheat straw fibrous agricultural residue biomass slurry on the
performance characteristics of centrifugal slurry pumps was, therefore, experimentally
investigated. Pumping a play sand-water mixture through the same closed-circuit pipeline
under similar operating conditions and comparing corresponding friction loss behavior
with that of agricultural residue biomass slurry demonstrated the unique mechanical
behavior of wheat straw-water mixtures. In contrast to all conventional solid-liquid
mixtures, the pump head increased with an increase in slurry solid mass content for
agricultural residue biomass slurry. It was observed that by using small, fibrous wheat
straw particles (< 3.2 mm) under known slurry solid mass contents and pump operating
conditions, it is possible to keep the total head and efficiency at the same level as the
pump handling pure water and to reduce the power consumption to below that required
for pumping pure water alone. Finally, a correlation was developed to predict the
201
reduction in head of the centrifugal slurry pumps while handling agricultural residue
biomass slurries, with respect to the head produced while handling pure water.
With EViews 7.1 econometric software and the nonlinear least square regression analysis
method, the experimentally measured pressure gradients were analyzed and an empirical
correlation was proposed to predict the slurry pressure gradient as a function of
agricultural residue biomass particle type and dimension, slurry solid mass content, and
pumping velocity. Considering the similarity between friction loss behavior of the flow
of wood pulp fibre suspensions and the flow of agricultural residue biomass slurries and
using the CSIR (is) scale-up method, the proposed correlation was then modified to take
into account the effect of pipe diameter as well.
Finally, the technical parameters and constraints, also the empirical correlations obtained
through this course of experimental study, together with the pipeline economic structure
proposed by Kumar et al. [1-3], were used to develop a data-intensive techno-economic
model to estimate the cost of pipeline hydro-transport of wheat straw and corn stover
agricultural residue biomass to a bio-ethanol refinery. This study calculated the delivered
costs of feedstock using the pressure drop correlation proposed here specifically for
agricultural residue biomass, compared the total cost of delivery with the total cost
obtained using wood chip pressure drop correlations, identified the relative advantages of
pipeline transport over truck delivery, proposed optimum slurry solid mass content and
velocity to obtain the highest throughput at the lowest transport cost, and investigated the
effect of pipeline capacity and transport distance on the total cost of delivery. Based on
an 8.8% slurry solid mass content, 2.5 m/s slurry velocity, 150 km medium-range
distance, and the lowest estimate of the total cost of truck delivery reported (0.22 $/dry
t.km), pipeline hydro-transport was found to be economically more viable than truck
delivery at capacities of 0.45 M dry t/yr or more for one-way pipelines (without the return
of the carrier liquid) and 1.4 M dry t/yr or more for two-way pipelines (with the return of
the carrier liquid). Considering the highest estimate of the total cost of truck delivery
reported (0.46 $/dry t), pipeline hydro-transport of the same slurry would always cost less
than truck delivery for one-way pipelines and would cost less than truck delivery at
capacities above 0.35 M dry t/yr for two-way pipelines. All one-way pipelines with
202
transport capacities of 1.0 M dry t/yr and greater always had fixed and distance variable
costs lower than those for hauling by truck. The corresponding capacity for two-way
pipelines was 2.0 M dry t/yr.
Investigating the morphological features of agricultural residue biomass revealed their
atypical characteristic, specifically their fibrous nature, which helped to understand the
unique features of agricultural residue-water mixture flows in pipes, e.g., drag reducing
feature, and pumps. The developed empirical correlation also helped to conduct a techno-
economic analysis on the pipeline hydro-transport of agricultural residue biomass. By the
end of the study, a comprehensive understanding of agricultural residue biomass
pipelines was obtained which included the feasibility of the concept, equipment
performance, technical limitations, undergoing phenomena, governing rules, and
economic parameters. This study was the first major step towards large-scale long-
distance agricultural residue biomass pipelines, and results obtained here could be used to
design and operate the pipeline and associated equipment.
8.2. Recommendations for Future Research
To understand the mechanical behavior of the slurry of agricultural residue biomass, the
effects of operating parameters (e.g., biomass particle type and size, slurry solid mass
content, pumping velocity) on slurry friction loss were investigated. All the
measurements were made on a 7.5 m long and 50 mm diameter horizontal test section
after pumping the slurry for a minimum of 12 hours until the pressure and velocity
fluctuations and changes in particle and slurry specifications were damped down to below
1% per hour. However, such design and operating conditions is difficult to maintain in a
large-scale long-distance commercial pipes. Although efforts were made to scale up the
results obtained here, they were limited to large-scale horizontal pipelines and to slurries
pumped for a minimum of 12 hours. To understand how changes in the diameter and
orientation of the pipe and the duration of pumping change the slurry mechanical
behavior, further research is required, as proposed below:
203
8.2.1. Investigating the Effect of Pipe Diameter on Slurry Mechanical Behavior
A study should experimentally examine the effect of large pipe diameters on slurry
mechanical behavior, specifically slurry pressure drop. Pipes with large diameters (e.g.,
100 mm, 200 mm) should be installed parallel to the current 50 mm diameter pipe to
investigate:
- the effect of increasing pipe diameter on slurry friction loss
- the effect of pipe diameter on centrifugal pump performance
8.2.2. Studying the Slurry Flow Mechanical Behavior over Vertical, Inclined, and
Bent Sections throughout the Pipeline
The purpose of this proposed research is to measure the slurry pressure drop over
vertical, inclined, and bent sections throughout the pipeline to understand:
- how the slurry behaves mechanically differently through a vertical test section
- how the slurry behaves mechanically differently through an inclined test section
- how the angle of inclination impacts the slurry mechanical behavior
- how the pressure drop correlations developed for the horizontal section could be
adjusted to predict the mechanical behavior over vertical and inclined sections
- how the change in pipe diameter changes the slurry mechanical behavior over the
inclined and vertical sections
- how a bent section changes the solid mass content distribution across the cross
section
- how much distance the slurry should travel downstream in a bent section before the
extra turbulent energy caused by the curvature of the bend is destroyed and the flow
field is fully recovered
- how a bent section increases the probability of pipeline blockage
8.2.3. Investigating the Transient Biomass Slurry Behavior
The proposed research is aimed at investigating the slurry mechanical behavior within the
first hours the slurry is pumped into the pipeline. The proposed study should:
204
- model the particle degradation throughout the first few hours
- model the particle moisture content and density variations during the first few hours
- model the carrier liquid and slurry viscosity variations during the first few hours
- understand how the boosting stations and pipeline specifications should be adjusted
accordingly in first few kilometers of the pipe
- develop a new model to predict the slurry pressure drop during the first few hours as a
function of particle properties and slurry conditions
8.2.4. Measuring Slurry Deposition Velocity
The minimum velocity at which the slurry was successfully pumped for the present study
was 0.5 m/s. However, this was the minimum velocity technically achievable and was
obtained for a steady slurry flow after 12 hours of pumping. The proposed research
should measure the minimum velocity below which the particles will deposit and form a
stationary bed. Measurements should be made during the transition period and on the
steady slurry flow. More precise pressure transducers should replace the current ones to
accurately measure the velocities below 0.5 m/s. To capture the deposition at the early
stage, image capturing or tomography techniques should replace visual observations. The
proposed research should measure the minimum pumping velocity as a function of
material type, particle size, slurry solid mass/volume content, and pumping time.
8.2.5. Using Flow Imaging Techniques to Study Slurry Flow Patterns
Currently, research is being conducted in a laboratory using the Electric Resistance
Tomography (ERT) technique. ERT is based on the difference in conductivity of liquid
and solid phases. The variation in conductivity across the cross section of the pipe is
recorded and analyzed in order to reconstruct the image of the solid-liquid flow passing
through the ERT device. Besides the ERT approach, other flow imaging techniques such
as MRI and PIV can be also applied to obtain a better understanding of the slurry flow
pattern throughout the straight, vertical, and bent sections of the pipeline as a function of
particle size, slurry solid mass/volume content, and pumping velocity.
205
References
[1] Kumar, A., Cameron, J.B., Flynn, P.C. Pipeline transport of biomass. Applied
Biochemistry and Biotechnology, 2004; 113: 27-39.
[2] Kumar, A., Flynn, P.C., Cameron, J.B. Large-scale ethanol fermentation through
pipeline delivery of biomass. Applied Biochemistry and Biotechnology, 2005; 121: 47-
58.
[3] Kumar, A., Flynn, P.C., Cameron, J.B. Pipeline transport and simultaneous
saccharification of corn stover. Bioresource Technology, 2005; 96: 819-29.
206
References
Abulnaga, B.E. (2002). Slurry systems handbook. New York, McGraw-Hill.
Adapa, P., Tabil, L. and Schoenau, G. (2011). "Grinding performance and physical
properties of non-treated and steam exploded barley, canola, oat and wheat straw."
Biomass and Bioenergy, 35 (1): 549-561.
Aden, A., Ruth, M., Ibsen, K., Jechura, J., Neeves, K., Sheehan, J., Wallace, B.,
Montague, L., Slayton, A. and Lukas, J. (2002). Lignocellulosic biomass to ethanol
process design and economics utilizing co-current dilute acid prehydrolysis and
enzymatic hydrolysis for corn stover, Report no. NREL/TP-510-32438, National
Renewable Energy Laboratory.
Aktiebolaget Pumpindustri. (1966). Friction losses in piping systems for paper stock
suspensions. Goteborg, Sweden.
Al-Kindi, G.A. and Shirinzadeh, B. (2007). "An evaluation of surface roughness
parameters measurement using vision-based data." International Journal of Machine
Tools and Manufacture, 47 (3-4): 697-708.
Allaire, S.E. and Parent, L.E. (2003). "Size guide number and Rosin-Rammler
approaches to describe particle size distribution of granular organic-based fertilisers."
Biosystems Engineering, 86 (4): 503-509.
Allen, J. and Browne, M. (1998). "Logistics management and costs of biomass fuel
supply." International Journal of Physical Distribution and Logistics Management, 28 (6):
463-477.
Anwer, M., So, R.M.C. and Lai, Y.G. (1989). "Perturbation by and recovery from bend
curvature of a fully-developed turbulent pipe-flow." Physics of Fluids, 1 (8): 1387-1397.
ASABE (2007). Method of determining and expressing particle size of chopped forage
materials by screening. Standard ANSI/ASAE S424.1. American Society of Agricultural
and Biological Engineers, St. Joseph, MI, US.
207
ASABE (2008). Moisture measurement for forages. Standard S358.2 American Society
of Agricultural and Biological Engineers, St. Joseph, MI, US.
ASTM (2012). Standard test method for density, relative density, and absorption of
coarse aggregate. ASTM, Designation C127. American Society for Testing and
Materials, West Conshohocken, PA, US.
Bain, A.J. and Bonnington, S.T. (1970). The hydraulic transport of solids by pipeline.
Pergamon Press, New York, NY, US.
Bates, S. and Edwards, K. (2014). "Pipeline transportation rates."
http://www.enbridge.com/~/media/www/Site%20Documents/Delivering%20Energy/Ship
pers/US/Toledo/Toledo-FERC-No-37-3-0.pdf. Accessed: May 2014.
Bitra, V.S.P., Womac, A.R., Yang, Y.C.T., Miu, P.I., Igathinathane, C., Chevanan, N.
and Sokhansanj, S. (2011). "Characterization of wheat straw particle size distributions
as affected by knife mill operating factors." Biomass and Bioenergy, 35 (8): 3674-3686.
Bitra, V.S.P., Womaca, A.R., Yang, Y.T., Miu, P.I., Igathinathane, C., Chevanan, N. and
Sokhansanj, S. (2011). "Characterization of wheat straw particle size distributions as
affected by knife mill operating factors." Biomass and Bioenergy, 35: 3674-3687.
Blott, S.J. and Pye, K. (2001). "GRADISTAT: A grain size distribution and statistics
package for the analysis of unconsolidated sediments." Earth Surface Processes and
Landforms, 26 (11): 1237-1248.
Bobkowic, A. and Gauvin, W.H. (1965). "Turbulent flow characteristics of model fibre
suspensions." Canadian Journal of Chemical Engineering, 43 (2): 87-91.
Bodenheimer, V.B. (1969). "Channeling in bleach towers and friction losses in pulp
stock lines." Southern Pulp and Paper Manufacture, 32 (9): 42.
Bowen, R.L. (1961). "Series of articles." Journal of Chemical Engineering.
Brebner, A. (1964). "On Pumping of Wood Chips through 4-Inch Aluminum Pipe-
Line." Canadian Journal of Chemical Engineering, 42 (3): 139-142.
208
Brecht, W. and Heller, H. (1950). "A study of the friction losses of paper stock
suspensions." Tappi, 33 (9).
British Standards Institution (1985). Testing aggregates part 103: Methods for
determination of particle size distribution, Sec. 103.1: Sieve tests.
Brown, N.P. and Heywood, N.I. (1991). Surry handling - Design of solid liquid systems.
New York, Elsevier.
Burgess, K.E. and Reizes, J.A. (1976). "Effect of sizing, specific gravity, and
concentration on the performance of the centrifugal slurry pump." Institution of
Mechanical Engineers (London), 190 (36): 391-399.
Bureau of Indian Standards (BIS). (1977). Technical requirements for rotodynamic
special purpose pumps, IS: 5120.
Cave, I. (1976). Effects of suspended solids on the performance of centrifugal pumps.
Hydrotransport 4, BHRA Fluid Engineering.
Center for Energy Efficiency and Renewable Energy (CEERE). (2006). Electric Motor
Systems. Industrial Assessment Center (IAC), University of Massachusetts, Amherst.
Chandler, H.M. (2000). RS Means Company - Heavy construction data, 14th
annual
edition, Kingston, USA.
Chevanan, N., Womac, A.R., Bitra, V.S.P., Igathinathane, C., Yang, Y.T., Miu, P.I. and
Sokhansanj, S. (2010). "Bulk density and compaction behavior of knife mill chopped
switchgrass, wheat straw, and corn stover." Bioresource Technology, 101 (1): 207-214.
Churchill, S.W. (1977). "Friction factor equation spans all fluid regimes." Chemical
Engineering, 84 (24): 91-92.
Colebrook, C.F. (1939). "Turbulent flow in pipes, with particular reference to the
transition region between the smooth and rough pipe laws." Journal of the Institution of
Civil Engineers, 11 (4): 133-156.
DeSmet, O. (2014). "Bales R Us Co.". http://balesrus.com/. Accessed: May 2014.
209
Dhuyvetter, K.C. (2014). 2014 projected custom rates for Kansas. Kansas State
University, Department of Agricultural Economics.
Djalili-Moghaddam, M. and Toll, S. (2006). "Fibre suspension rheology: effect of
concentration, aspect ratio and fibre size." Rheologica Acta, 45 (3): 315-320.
Dodge, D.W. and Metzner, A.B. (1959). "Turbulent flow of non-Newtonian systems."
Aiche Journal, 5 (2): 189-204.
Duffy, G.G. (2006). "Measurement, mechanisms, and models: some important insights
into the mechanisms of flow of fibre suspensions." Annula Transaction of Nordic
Rheology Society, 14: 19-31.
Duffy, G.G. (1989). "The optimum design of pipelines for transporting wood pulp fiber
suspensions." Appita Journal, 42 (5): 358-361.
Duffy, G.G. (1976). "Review and evaluation of design methods for calculating friction
loss in stock piping systems." Tappi, 59 (8): 124-127.
Duffy, G.G. (2003). "The significance of mechanistic-based models in fibre suspension
flow." Nordic Pulp and Paper Research Journal, 18 (1): 74-80.
Duffy, G.G. and Abdullah, L. (2003). "Fibre suspension flow in small diameter pipes."
Appita Journal, 56 (4): 290-295.
Duffy, G.G., Kazi, S.N. and Chen, X.D. (2002). "Monitoring pulp fibre quality by
frictional pressure drop measurement." Proceeding of 56th
Appita Annual Conference:
119-126.
Duffy, G.G. and Lee, P.F.W. (1978). "Drag reduction in turbulent flow of wood pulp
suspensions." Appita, 31 (4): 280-286.
Duffy, G.G., Moller, K., Lee, P.F.W. and Milne, S.W.A. (1974). "Design correlations
for groundwood pulps and effects of minor variables on pulp suspension flow." Appita,
27 (5): 327-333.
Duffy, G.G., Moller, K. and Titchene.Al (1972). "Determination of pipe friction loss."
Appita, 26 (3): 191-195.
210
Duffy, G.G. and Titchene.Al (1974). "Design procedures for obtaining pipe friction loss
for chemical pulps." Tappi, 57 (5): 162-166.
Duffy, G.G., Titchener, A.L., Lee, P.F.W. and Moller, K. (1976). "The mechanism of
flow of pulp suspensions in pipes." Appita, 29 (5): 363-370.
Duffy, M. (2008). "Estimated costs for production, storage and transportation of
switchgrass." Ag Decision Maker: An agricultural economics and business. from
https://www.extension.iastate.edu/agdm/crops/pdf/a1-22.pdf. Accessed: May 2014.
Durand, R. and Condolios, G. (1952). The hydraulic trasnport of coal and solids in
pipes. Colloquium on Hydraulic Transport Conference London.
Durst, R.E., Chase, A.J. and Jenness, L.C. (1952). "An analysis of data on material flow
in pipes." Tappi, 35 (12): 529.
Elliott, D.R. (1960). "The transportation of pulpwood chips in pipelines." Pulp and
Paper Magazine of Canada, 61 (5): 170-175.
Elliott, D.R. and de Montmorency, W.H. (1963). The transportation of pulpwood chips
in pipelines. Report of an exploratory study. Montreal, Pulp and Paper Institute of
Canada.
Ellis, H.S., Redberger, P.J. and Bolt, L.H. (1963). "Slurries: basic principles and power
requirements." Industrial and Engineering Chemistry, 55 (8): 18-26.
Engin, T. and Gur, M. (2003). "Comparative evaluation of some existing correlations to
predict head degradation of centrifugal slurry pumps." Journal of Fluids Engineering-
Transactions of the Asme, 125 (1): 149-157.
Engin, T. and Gur, M. (2001). "Performance characteristics of a centrifugal pump
impeller with running tip clearance pumping solid-liquid mixtures." Journal of Fluids
Engineering-Transactions of the Asme, 123 (3): 532-538.
Epplin, F.M. (1996). "Cost to produce and deliver switchgrass biomass to an ethanol-
conversion facility in the Southern Plains of the United States." Biomass and
Bioenergy, 11 (6): 459-467.
211
Epstein, B. (1948). "Logarithmico-normal distribution in breakage of solids." Industrial
and Engineering Chemistry, 40 (12): 2289-2291.
European Blenders Association (EBA) (1997). Handbook of solid fertilizer blending,
code of good practices for quality. Le Pontoury, Montviron, France.
Faddick, R.R. (1963). The aqueous transport of pulpwood chips in a four inch
aluminum pipe. Kingston, Ontario, Queen's University. M.Sc.
Faddick, R.R. (1970). Hydraulic transportation of solids in pipelines. Bozeman,
Montana State University. Ph.D. .
Fairbank, L.C. (1942). Effect on the characteristics of centrifugal pumps. Solids in
Suspension Symposium.
Fangary, Y.S., Ghani, A.S.A., ElHaggar, S.M. and Williams, R.A. (1997). "The effect of
fine particles on slurry transport processes." Minerals Engineering, 10 (4): 427-439.
Flügel, E. (2004). Microfacies of carbonate rocks: analysis, interpretation and
application. Springer.
Fock, H., Claesson, J., Rasmuson, A. and Wikstrom, T. (2011). "Near wall effects in the
plug flow of pulp suspensions." Canadian Journal of Chemical Engineering, 89 (5):
1207-1216.
Folk, R.L. (1974). Petrology of sedimentary rocks. Austin, Texas, Hemphill Publishing
Co.
Folk, R.L. and Ward, W.C. (1957). "Brazos river bar: a study in the significance of
grain size parameters.", Journal of sedimentary petrology, 27: 3-26.
Forrest, F. and Grierson, G.H.A. (1931). "Friction losses in cast iron pipe carrying
paper stock", Paper Trade, 92: 39-41.
Gahlot, V.K., Seshadri, V. and Malhotra, R.C. (1992). "Effect of density, size
distribution, and concentration of solid on the characteristics of centrifugal pumps."
Journal of Fluids Engineering-Transactions of the Asme, 114 (3): 386-389.
212
Gandhi, B.K., Singh, S.N. and Seshadri, V. (2001). "Performance characteristics of
centrifugal slurry pumps." Journal of Fluids Engineering-Transactions of the Asme, 123
(2): 271-280.
Gaudin, A.M. and Meloy, T.P. (1962). "Model and a comminution distribution equation
for single fracture." Transactions of the Society of Mining Engineers of Aime, 223 (1):
40-43.
Genić, S., Arandjelović, I., Kolendić, P., Jarić, M., Budimir, N. and Genić, V. (2011). "A
review of explicit approximations of Colebrook's equation." FME Transactions, 39 (2):
67-71.
Gibert, R. (1960). Hydraulic transport and discharge of mixtures in pipes, Report by
Annals of Roads and Bridges.
Gillies, R.G. and Shook, C.A. (1991). "A deposition velocity correlation for water
slurries." Canadian Journal of Chemical Engineering, 69 (5): 1225-1228.
Glassner, D., Hettenhaus, J. and Schechinger, T. (1998). Corn stover collection project.
Bioenergy 1998 - Expanding Bioenergy Partnerships.
Gow, J.L. (1971). Hydraulic transport of woodchips in pipelines. Bozeman, Montana
State University.
Godwin Pumps. http://www.godwinpumps.com/en/index.php/godwin-products/cd-
range/cd80m/, Accessed: Feb. 2014.
Gubba, S.R., Ingham, D.B., Larsen, K.J., Ma, L., Pourkashanian, M., Qian, X., Williams,
A. and Yan, Y. (2012). "Investigations of the transportation characteristics of biomass
fuel particles in a horizontal pipeline through CFD modelling and experimental
measurement." Biomass and Bioenergy, 46: 492-510.
Gupta, A. and Yan, D. (2006). Mineral processing design and operation: An
introduction. Amsterdam, Netherlans, Elsevier.
Harada, T. (2002). "Energy consumption in utilization of woody biomass." Wood
Industry, 57 (11): 480-483.
213
Hellstrom, L.H.O. and Smits, A.J. (2012). Turbulent pipe flow through a 90 degree
bend. Fluid Mechanics Meeting, 1000 Islands, Ontario, Canada.
Horo, K. and Niskanen, T. (1978). "Centrifugal pumps - research on pumping paper
stock." Tappi, 61 (1): 67-70.
Horo, K. and Niskanen, T. (1979). "Pumping paper stock efficiently." Pumps-Pompes-
Pumpen, 156: 427-429.
Hunt, W.A. (1962). Continuous flow transport of low value forst products by hydraulic
pipeline [Unpublished report to Intermountain Forest and Range Experiment Station].
Bozman, Montana.
Hunt, W.A. (1967). "Economic analysis of wood chip pipeline." Forest Products, 17 (9):
68-74.
Hunt, W.A. (1976). Friction factors for mixtures of wood chips and water flowing in
pipelines. 4th
International Conference on the Hydraulic Transport of Solids in Pipes,
Alberta, Canada.
Hwang, S.H., Lee, K.P., Lee, D.S. and Powers, S.E. (2002). "Models for estimating soil
particle-size distribution." Soil Science Society of America, 66: 1143-1150.
Igathinathane, C., Melin, S., Sokhansanj, S., Bi, X., Lim, C.J., Pordesimo, L.O. and
Columbus, E.P. (2009). "Machine vision based particle size and size distribution
determination of airborne dust particles of wood and bark pellets." Powder Technology,
196 (2): 202-212.
Igathinathane, C., Pordesimo, L.O. and Batchelor, W.D. (2008). Ground biomass sieve
analysis simulation by image processing and experimental verification of particle size
distribution. ASABE Annual International Meeting. Rhode Island Convention Center,
ASABE.
Igathinathane, C., Pordesimo, L.O., Columbus, E.P., Batchelor, W.D. and Methuku, S.R.
(2008). "Shape identification and particles size distribution from basic shape
parameters using ImageJ." Computers and Electronics in Agriculture, 63 (2): 168-182.
214
Igathinathane, C., Pordesimo, L.O., Columbus, E.P., Batchelor, W.D. and Sokhansanj, S.
(2009). "Sieveless particle size distribution analysis of particulate materials through
computer vision." Computers and Electronics in Agriculture, 66 (2): 147-158.
Igathinathane, C., Prakash, V.S.S., Padma, U., Babu, G.R. and Womac, A.R. (2006).
"Interactive computer software development for leaf area measurement." Computers
and Electronics in Agriculture, 51 (1-2): 1-16.
Ingersoll-Rand Co. Cameron Hydraulic Data. New York, NY.
Internatinal Standards Organization (ISO). (2010). Guidance for the use of repeatability,
reproducibility and trueness estimates in measurement uncertainty estimation, ISO
21748: 2010(E).
Scandinavian Pulp, Paper and Board Testing Committee. Standard SCAN CM 40:88.
Jenkins, B.M., Dhaliwal, R.B., Summers, M.D., Bernheim, L.G., Lee, H., Huisman, W.
and Yan, L. (2000). Equipment performance, costs, and constraints in the commercial
harvesting of rice straw for industrial applications. American Society of Agricultural
Engineers (ASAE) Conference.
Kato, H. and Mizunuma, H. (1983). "Frictional resistance in fiber suspensions (part 1):
pipe-flow." Bulletin of the Jsme-Japan Society of Mechanical Engineers, 26 (212): 231-
238.
Kazi, S.N., Duffy, G.G. and Chen, X.D. (1999). "Heat transfer in the drag reducing
regime of wood pulp fibre suspensions." Chemical Engineering Journal, 73 (3): 247-253.
Kazim, K.A., Maiti, B. and Chand, P. (1997). "A correlation to predict the performance
characteristics of centrifugal pumps handling slurries." Proceedings of the Institution of
Mechanical Engineers Part a-Journal of Power and Energy, 211 (2): 147-157.
Kazim, K.A., Maiti, B. and Chand, P. (1997). "Effect of drag reducing polymers on the
performance characteristics of centrifugal pumps handling slurries." Journal of
Polymer Materials, 14 (3): 245-250.
215
Kazim, K.A., Maiti, B. and Chand, P. (1997). "Effect of particle size, particle size
distribution, specific gravity and solids concentration on centrifugal pump
performance." Powder Handling and Processing, 9 (1): 27-32.
Kerekes, R.J. and Schell, C.J. (1995). "Effects of fiber length and coarseness on pulp
flocculation." Tappi Journal, 78 (2): 133-139.
Kerekes, R.J.E. and Douglas, W.J.M. (1972). "Viscosity properties of suspensions at
limiting conditions for turbulent drag reduction." Canadian Journal of Chemical
Engineering, 50 (2): 228-231.
Kim, S. and Dale, B.E. (2004). "Global potential bioethanol production from wasted
crops and crop residues." Biomass and Bioenergy, 26 (4): 361-375.
Kumar, A., Cameron, J.B. and Flynn, P.C. (2003). "Biomass power cost and optimum
plant size in western Canada." Biomass and Bioenergy, 24 (6): 445-464.
Kumar, A., Cameron, J.B. and Flynn, P.C. (2005). "Large-scale ethanol fermentation
through pipeline delivery of biomass." Applied Biochemistry and Biotechnology, 121:
47-58.
Kumar, A., Cameron, J.B. and Flynn, P.C. (2005 (b)). "Pipeline transport and
simultaneous saccharification of corn stover." Bioresource Technology, 96 (7): 819-
829.
Kumar, A., Cameron, J.B. and Flynn, P.C. (2004). "Pipeline transport of biomass."
Applied Biochemistry and Biotechnology, 113: 27-39.
Kwan, A.K.H., Mora, C.F. and Chan, H.C. (1999). "Particle shape analysis of coarse
aggregate using digital image processing." Cement and Concrete Research, 29 (9):
1403-1410.
Kwan, A.K.H., Mora, C.F. and Chan, H.C. (1998). "Particle size distribution analysis of
coarse aggregate using digital image processing." Cement and Concrete Research, 28
(6): 921-932.
Lee, P.F.W. and Duffy, G.G. (1976 (a)). "Analysis of drag reducing regime of pulp
suspension flow." Tappi, 59 (8): 119-122.
216
Lee, P.F.W. and Duffy, G.G. (1976). "Relationships between velocity profiles and drag
reduction in turbulent fiber suspension flow." Aiche Journal, 22 (4): 750-753.
Lee, P.F.W. and Duffy, G.G. (1976 (b)). "Velocity profiles in drag reducing regime of
pulp suspension flow." Appita, 30 (3): 219-226.
Li, Z., Hong, T.S., Wu, W.B. and Liu, M.J. (2007). "A novel method of object
identification and leaf area calculation in multi-leaf image." ASABE Paper No:
073047.
Liu, H., Noble, J., Zuniga, R. and Wu, J. (1995). Economic analysis of coal log pipeline
transportation of coal. Report No. 95-1. Capsule Pipeline Research Center (CPRC),
University of Missouri, Columbia, USA.
Lokon, H.B., Johnson, P.W. and Horsley, R.R. (1982). A scale-up model for predicting
head loss gradients in iron ore slurry pipelines. Hydrotransport 8. Johannesburg, South
Africa.
Luk, J. (2010). Pipeline transport of wheat straw slurry. University of Alberta.
Luk, J., Mohammadabadi, H.S. and Kumar, A. (2014). "Pipeline transport of biomass:
Experimental development of wheat straw slurry pressure loss gradients ", Biomass and
Bioenergy.
Luthi, O. (1987). The flow of MC fibre suspensions. TAPPI Engineering Conference,
Atlanta.
Marrison, C.I. and Larson, E.D. (1995). Cost versus scale for advanced plantation-based
biomass energy systems in the US and Brazil. Proceeding of Second Biomass
Conference of the Americas: Energy, Environment, Agriculture, and Industry.
Matousek, V. (2002). "Pressure drops and flow patterns in sand-mixture pipes."
Experimental Thermal and Fluid Science, 26 (6-7): 693-702.
McKendry, P. (2002). "Energy production from biomass (part 1): overview of biomass."
Bioresource Technology, 83 (1): 37-46.
217
Metzner, A.B. and Reed, J.C. (1955). "Flow of non-Newtonian fluids - correlation of
the laminar, transition, and turbulent flow regions." Aiche Journal, 1 (4): 434-440.
Meyer, H. (1964). "An analytical treatment of the laminar flow of annulus forming
fibrous suspensions in vertical pipes." Tappi, 47: 78-84.
Mez, W. (1984). The influence of solids concentration, solids density and grain size
distribution on the working behaviour of centrifugal pumps. Hydrotransport 9, BHRA
Fluid Engineering.
Mohamadabadi, H.S. (2009). Characterization and pipelining of biomass slurries.
University of Alberta. M.Sc.
Moller, K. (1976). "Correlation of pipe friction data for paper pulp suspensions."
Industrial and Engineering Chemistry Process Design and Development, 15 (1): 16-19.
Moller, K. (1976). "General correlations of pipe friction data for pulp suspensions."
Tappi, 59 (8): 111-114.
Moller, K., Duffy, G.G. and A., T. (1971). "Laminar plug flow regime of paper pulp
suspensions in pipes." Svensk Papperstidning-Nordisk Cellulosa, 74 (24): 829-834.
Moller, K., Duffy, G.G. and A.L., T. (1973). "Design correlation for flow of pulp
suspensions in pipes." Appita, 26 (4): 278-282.
Moody, L.F. (1947). "An approximate formula for pipe friction factors." Transactions
of the ASME, 69: 1005-1006.
Nailen, R.L. (2002). Just how important is drive motor efficiency? Chicago, Barker
Publications, Inc.
Nardi, J. (1959). "Pumping solids through a pipeline." Pipeline News: 26-33.
National Electrical Manufacturer Association (NEMA). (2003). The NEMA Premium™
efficiency electric motor program. The NEMA Premium™ efficiency levels. MG 1-
2003, Tables 12-12 and 12-13, NEMA Standards Publication.
Natural Resources Canada (NRC). (2004).Technical fact sheet, Premium efficiency
motors, Catalog No. M144-21/2003E.
218
Newitt, D.M. and Richardson, J.F. (1955). "Hydraulic Conveying of Solids." Nature, 175
(4462): 800-801.
O'donnell, J.P. (1964). "Diversification of owners is common in products pipeline.", Oil
and Gas Journal, 62 (27): 88-100.
Pande, H., Rao, N.J., Kapoor, S.K. and Roy, D.N. (1999). "Hydrodynamic behavior of
nonwood fiber suspensions." Tappi, 82 (6): 140-145.
Paul, T., Duffy, G. and Chen, D. (2001). "New insights into the flow of pulp
suspensions." Tappi Solutions, 1 (1).
Pearson, T.C. and Brabec, D.L. (2006). "Camera attachment for automatic
measurement of single-wheat kernel size on a perten SKCS 4100." Applied Engineering
in Agriculture, 22 (6): 927-933.
Perfect, E., Xu, Q. and Terry, D.L. (1998). "Improved parameterization of fertilizer
particle size distribution." Journal of Aoac International, 81 (5): 935-942.
Perlack, R.D. and Turhollow, A.F. (2002). Assessment of options for the collection,
handling, and transport of corn stover. http://bioenergy.ornl.gov/pdfs/ornltm-
200244.pdf. Report no. ORNL/TM-2002/44. Accessed: 2002.
Peter, M.S. and Timmerhaus, K.D. (1991). Plant design and economics for chemical
engineers. New York, NY, USA, McGraw-Hill.
Powell, R.L., Morrison, T.G. and Milliken, W.J. (2001). "Apparent viscosity of
suspensions of rods using falling ball rheometry." Physics of Fluids, 13 (3): 588-593.
Quantitative Micro Software (QMS). (2010). EViews 7.1. IHS Global Inc., Irvine, CA,
USA.
Radin, I., Zakin, J.L. and Patterson, G.K. (1975). "Drag reduction in solid-fluid
systems." Aiche Journal, 21 (2): 358-371.
Rao, N.J. (1985). "Process piping design for pulp suspensions ", IPPTA, 22 (4): 27-35.
Rasband, W.S. (2008). "http://rsb.info.nih.gov/ij/index.html, U.S. National Institutes of
Health, Accessed September 2011."
219
Rasband, W.S. (2008). "ImageJ." http://rsb.info.nih.gov/ij/index.html. Accessed
September 2011.
Riegel, P.S. (1966). Tappi, 49 (3): 32A.
Rodieck, B. (2007). Ellipsefitter class of ImageJ,
http://rsb.info.nih.gov/ij/developer/source/ij/process/EllipseFitter.java.html, Accessed:
September 2011.
Rosin, P. and Rammler, E. (1933). "The laws governing the fineness of powdered coal."
Journal of the Institute of Fuel, 7: 26-39.
Rowe, M. (1970). "Measurements and computations of flow in pipe bends." Journal of
Fluid Mechanics, 43: 771-783.
Ruth, M. (1999). Large scale ethanol facilities and short cut for changing facility size.
Internal Report, National Renewable Energy Laboratory Technical Memo.
Sauermann, H.B. and Webster, I.W. (1975). Scaling-up slurry pressure gradients from
test loop data. CSIR Report No. ME 1415. Pretoria, Australia
Sawai, T., Kajimoto, T., Ohmasa, M., Shibue, T. and Nishi, K. (2011). Hydraulic
transportation system of chips by Hilly Terrain Pipelines. 22nd International
Symposium on Transport Phenomena. Delft, The Netherlands
Schaan, J., Sumner, R.J., Gillies, R.G. and Shook, C.A. (2000). "The effect of particle
shape on pipeline friction for Newtonian slurries of fine particles." Canadian Journal of
Chemical Engineering, 78 (4): 717-725.
Scheer, A.C. (1962). Survey on wood chips transportation charges [Unpublished report
to Intermountain Forest and Range Experiment Station]. Bozman, Montana.
Schmidt, R.E. (1965). An investigation of the effects of pressure and time on the
specific gravity, moisture content and volume of wood chips in a water slurry
[dissertation]. Civil Engineering, Montana State University. M.Sc.
220
Sellers, D. (2013). "Variable frequency drive system efficiency – part 1, facility dynamic
engineering, http://av8rdas.wordpress.com/2010/12/18/variable-frequence-drive-system-
efficiency, Accessed: May, 2013."
Sellgren, A. (1979). "Performance of a centrifugal pump when pumping ores and
industrial minerals.", Hydrotransport, 1: 291-304.
Sellgren, A. and Addie, G. (1989). Effect of solids on large centrifugal pump head and
efficiency. CEDA Dredging Day. Netherlands.
Sellgren, A., Addie, G. and Scott, S. (2000). "The effect of sand-clay slurries on the
performance of centrifugal pumps." Canadian Journal of Chemical Engineering, 78 (4):
764-769.
Sellgren, A. and Addie, G.R. (1993). Solid effects on characteristics of centrifugal
slurry pumps. Hydrotransport 12, Belgium.
Shahin, M.A. and Symons, S.J. (2005). "Seed sizing from images of non-singulated
grain samples.", Canadian Biosystems Engineering, 47: 49-55.
Shahin, M.A., Symons, S.J. and Poysa, V.W. (2006). "Determining soya bean seed size
uniformity with image analysis." Biosystems Engineering, 94 (2): 191-198.
Sheth, K.K., Morrison, G.L. and Peng, W.W. (1987). "Slip factors of centrifugal slurry
pumps." Journal of Fluids Engineering-Transactions of the Asme, 109 (3): 313-318.
Shook, C.A., Gillies, R.G. and Sanders, R.S. (2002). Pipeline hydrotransport with
applications in the oil sand industry. Saskatoon, SK, SRC Publicatin.
Shook CA, S.R. (2002). Pipeline hydrotransport with application in oilsand industry.
SRC publication No. 11508-1E02.
SIL Industrial Minerals Inc.
http://www.sil.ab.ca/images/stories/pdf/Products/playsand.pdf, Accessed: Jan, 2014.
Sokhansanj, S., Turhollow, A., Cushman, J. and Cundiff, J. (2002). "Engineering aspects
of collecting corn stover for bioenergy." Biomass and Bioenergy, 23 (5): 347-355.
221
Soucy, A. (1968). Data supplied to R.R. Faddick for Ph.D. thesis by Laval University.
Quebec City, Quebec.
Sun, D.W. and Brosnan, T. (2002). "Inspection and grading of agricultural and food
products by computer vision systems - a review." Computers and Electronics in
Agriculture, 36 (2-3): 193-213.
Sulzer Pumps. (2010). Suzler Pumps - Chapter three - Acceptance tests with centrifugal
pumps. Centrifugal Pump Handbook (Third Edition). Oxford, Butterworth-Heinemann:
69-88.
TAPPI (2007). The Technical Association of the Pulp and Paper Industry (TAPPI).
Generalized method for determining the pipe friction loss of flowing pulp suspensions.
TIP 0410-14. Atlanta, GA, USA.
Technical Association of the Pulp and Paper Industry (TAPPI) (2010). TAPPI usefull
methods NO.21, SCAN CM 40:88
Thomas, A.D. (1976). "Scale-up methods for pipeline transport of slurries."
International Journal of Mineral Processing, 3 (1): 51-69.
TRAPIL. Petrolum pipeline transport company. How pipelines work? Available from
http://www.trapil.fr/uk/comcamarche4.asp. Accessed: April 2013.
UN (1991). Green energy: biomass fuels and the evironment. Geneva, Switzerland
United Nations.
U.S. Department of Energy, Advanced Manufacturing Office. (2012). Adjustable speed
drive part-load efficiency - Motor systems tip sheet#11. Washington, DC, US.
United States Department of Energy. (1992). Energy Policy Act of 1992,
https://www1.eere.energy.gov/femp/regulations/epact1992.html. Accessed: May, 2013.
Vaezi, M., Katta, A.K. and Kumar, A. (2014). "Investigation into the mechanisms of
pipeline transport of slurries of wheat straw and corn stover to supply a bio-refinery."
Biosystems Engineering, 118: 52-67.
222
Vaezi, M. and Kumar, A. (2014). "Devevopment of correlations for the flow of
agricultural waste biomass slurries in pipes ". Biosystems Engineering, XX (XX).
Vaezi, M. and Kumar, A. (2014). "The flow of wheat straw suspensions in an open-
impeller centrifugal pump." Biomass and Bioenergy, XX (XX).
Vaezi, M. and Kumar, A. (2014). "Pipeline hydraulic transport of biomass materials: A
review." Biomass and Bioenergy, XX (XX).
Vaezi, M., Pandey, V., Kumar, A. and Bhattacharyya, S. (2013). "Lignocellulosic
biomass particle shape and size distribution analysis using digital image processing for
pipeline hydro-transportation." Biosystems Engineering, 114 (2): 97-112.
Vaezi, M.N., B. and Kumar, A. (2014). "Is pipeline hydro-transport of wheat straw and
corn stover to a biorefinery realistic?" Biofuels, Bioproducts and Biorefining, XX (XX).
Vaseleski, R.C. and Metzner, B. (1974). "Drag reduction in the turbulent flow of fiber
suspensions." AlChE, 20 (2): 301-308.
Viamajala, S., McMillan, J.D., Schell, D.J. and Elander, R.T. (2009). "Rheology of corn
stover slurries at high solids concentrations - Effects of saccharification and particle
size." Bioresource Technology, 100 (2): 925-934.
Visen, N.S., Paliwal, J., Jayas, D.S. and White, N.D.G. (2004). "Image analysis of bulk
grain samples using neural networks." Canadian Agricultural Engineering, 46 (7): 11-
15.
Vocadlo, J.J., Koo, J.K. and Prang, A.J. (1974). Performance of centrifugal pumps in
slurry service. Hydrotransport 3, BHRA Fluid Engineering.
Wallace, B., Yancey, M. and Easterly, J. (2003). Bioethanol co-location with a coal-
fired power plant. 25th Symposium on Biotechnology for Fuels and Chemicals
Breckenridge, CO.
Wallbom-Carlson, A. (1998). "Energy comparison. VFD vs. on-off controlled pumping
stations." Scientific impeller, ITT Flygt AB: 29-32.
223
Wang, W. and Paliwal, J. (2006). "Separation and identification of touching kernels
and dockage components in digital images." Canadian Biosystems Engineering, 48 (7):
1-7.
Wasp, E.J., Aude, T.C., Thompson, T.L. and Bailey, C.D. (1967). "Economics of chip
pipelining." Tappi, 50 (7): 313-318.
Wasp, E.J., Regan, T.J., Withers, J., Cook, P.A.C. and Clancey, J.T. (1963).
"Crosscountry coal pipeline hydraulics." Pipeline News, 35 (7): 20-28.
Webster, I.W. and Sauermann, H.B. (1978). "Pressure gradient scale-up methods for
slurry pipelines." The South African Mechanical Engineer, 28: 312-317.
Weston, M.D. and Worthen, L. (1987). Chevron Phosphate slurry pipeline
commissioning and start-up. 12th International Conference on Coal and Slurry
Technology. Washington, DC.
White, F.M. (2011). Fluid mechanics. New York, N.Y., McGraw Hill.
Wilson, G. (1987). Effect of slurries on centrifugal pump performance. Fourth
International Pump Symposium, Houston, TX, USA.
Wilson, K.C. (1989). Two mechanisms for drag reduction. Drag reduction in fluid
flows : techniques for friction control. Ed. Sellin H.R.J. and Moses, R.T.,. New York,
NY, USA, Chichester .
Wilson, K.C., Addie, G.R., Sellgren, A. and Clift, R. (2006). Slurry transport using
centrifugal pumps. New York, NY, USA, Springer.
Womac, A.R., Igathinathane, C., Bitra, P., Miu, P., Yang, T. and Sokhansanj, S. (2007).
Biomass pre-processing size reduction with instrumented mills. ASABE Paper No.
076046.
Wood, D.J. (1966). "An explicit friction factor relationship." Civil Engineering, 36 (12):
60-61.
Worster, R.C. (1952). Hydraulic transport of solids. Colloquim on hydraulic transport of
coal conference London.
224
Yadeta, R. and Durst, R.E. (1970). The behavior of gas-water-fiber systems in
centrifugal pumps. Hydrotransport 1. Coventry, UK.
Zandi, I. and Govatos, G. (1967). "Hetrogeneous flow of solids in pipelines." ASCE
Journal of the Hydraulic Devision, 93: 145-159.