Embed Size (px)
Citation preview
Experimental and analytical investigation of seismic performance of nonductile RC frames strengthened with CFRP
Daiyu WangPh.D. Lecturer
Email: [email protected]
Date: 2015.12.07

Outline of the presentation
Research background
Axial stress-strain behavior of FRP-confined RC columns
Seismic performance of FRP strengthened RC members
Seismic performance of FRP strengthened RC frames
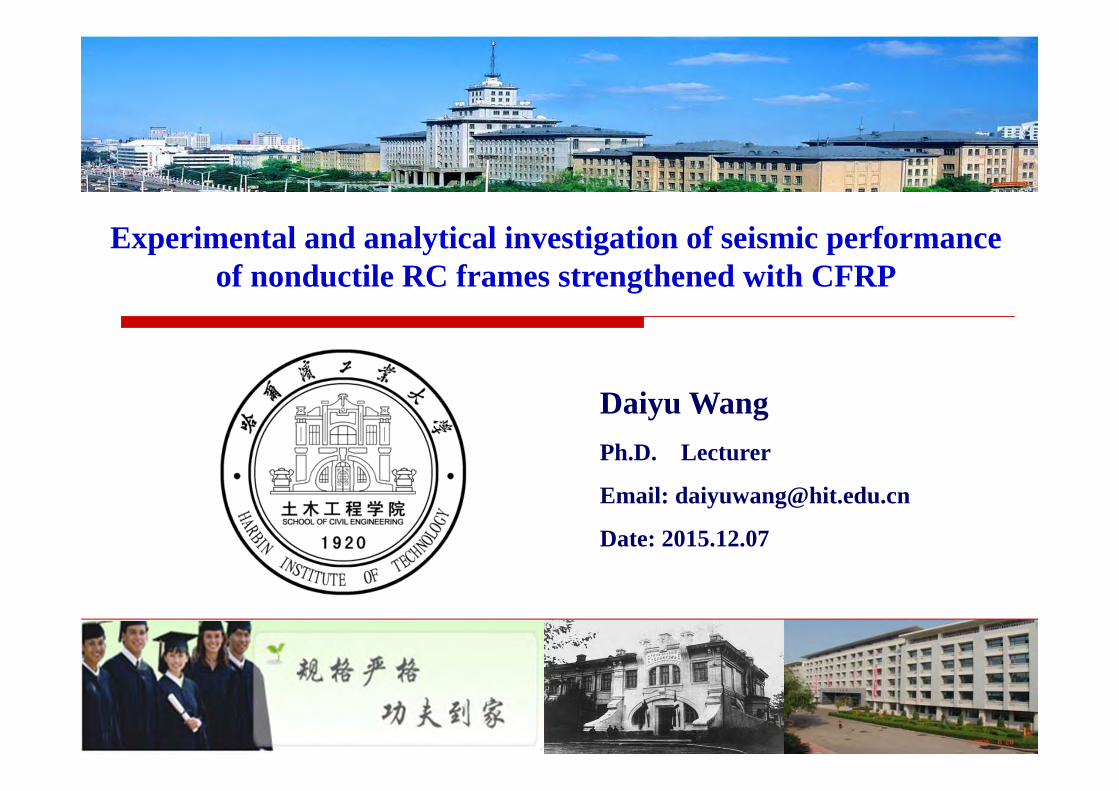
Research background
Nonductile frames: designed and built according to out-of-date codes, in which the earthquake loads are either not considered or not sufficiently considered. Insufficient ductility and energy dissipation capacity, deficient lateral load resistance,high risk level of severe damage or collapses in future strong earthquakes.
FRP (Fiber-Reinforced Polymer)
CFRP GFRP AFRP
Characters:High strength-to-weight ratioResistance to corrosion Ease of installation
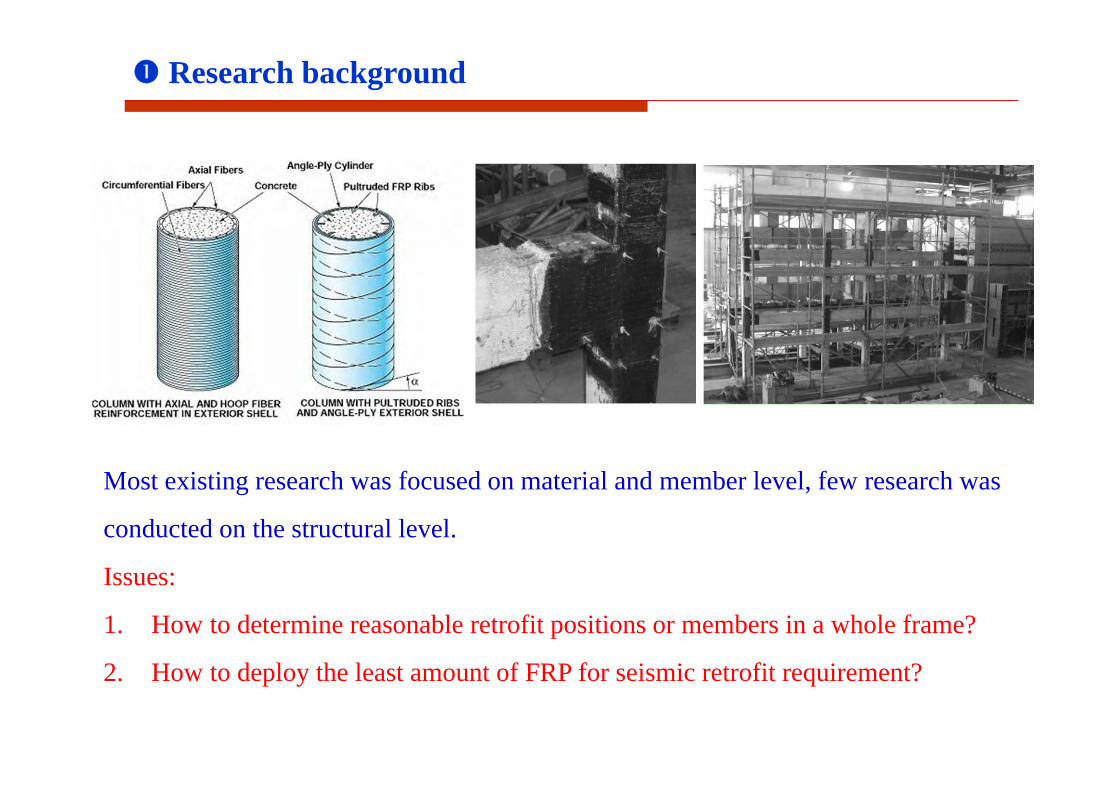
Research background
Most existing research was focused on material and member level, few research was
conducted on the structural level.
Issues:
1. How to determine reasonable retrofit positions or members in a whole frame?
2. How to deploy the least amount of FRP for seismic retrofit requirement?
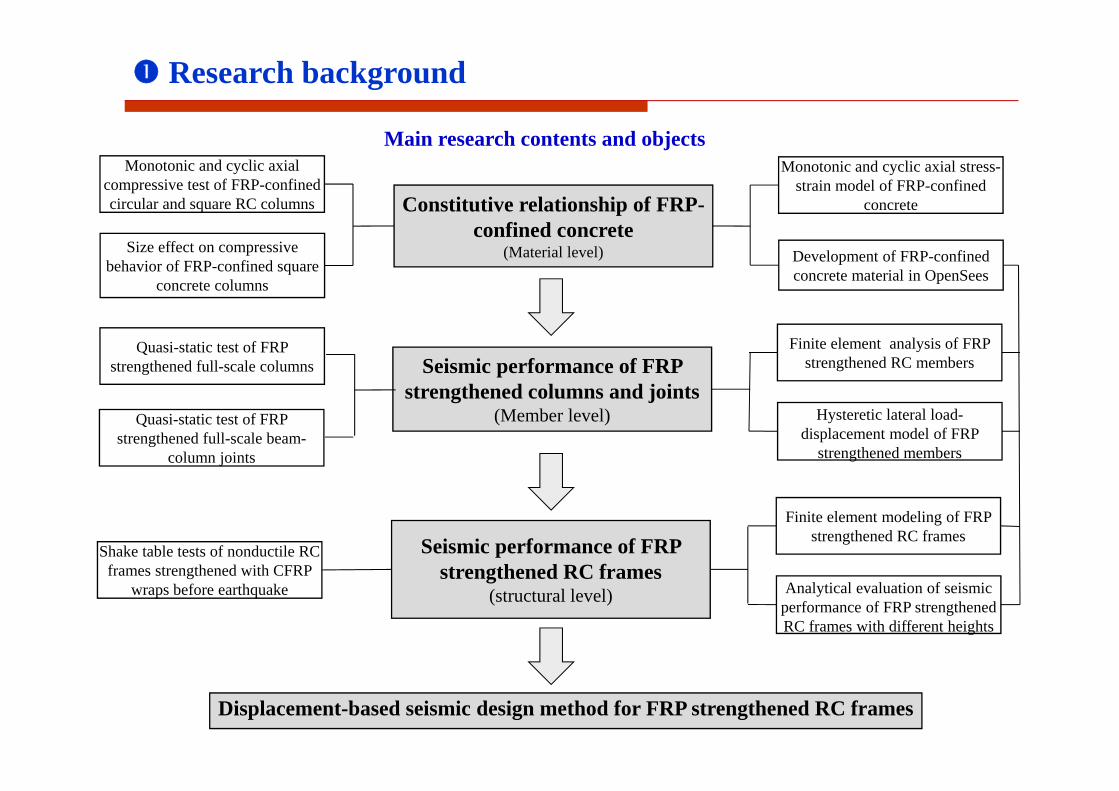
Research background
Constitutive relationship of FRP-confined concrete
(Material level)
Monotonic and cyclic axial compressive test of FRP-confined circular and square RC columns
Size effect on compressive behavior of FRP-confined square
concrete columns
Monotonic and cyclic axial stress-strain model of FRP-confined
concrete
Development of FRP-confined concrete material in OpenSees
Seismic performance of FRP strengthened columns and joints
(Member level)
Quasi-static test of FRP strengthened full-scale columns
Finite element analysis of FRP strengthened RC members
Hysteretic lateral load-displacement model of FRP
strengthened members
Seismic performance of FRP strengthened RC frames
(structural level)
Shake table tests of nonductile RC frames strengthened with CFRP
wraps before earthquake
Finite element modeling of FRP strengthened RC frames
Analytical evaluation of seismic performance of FRP strengthened RC frames with different heights
Displacement-based seismic design method for FRP strengthened RC frames
Main research contents and objects
Quasi-static test of FRP strengthened full-scale beam-
column joints
Outline of the presentation
Research background
Axial stress-strain behavior of FRP-confined RC columns
Seismic performance of FRP strengthened RC members
Seismic performance of FRP strengthened RC frames
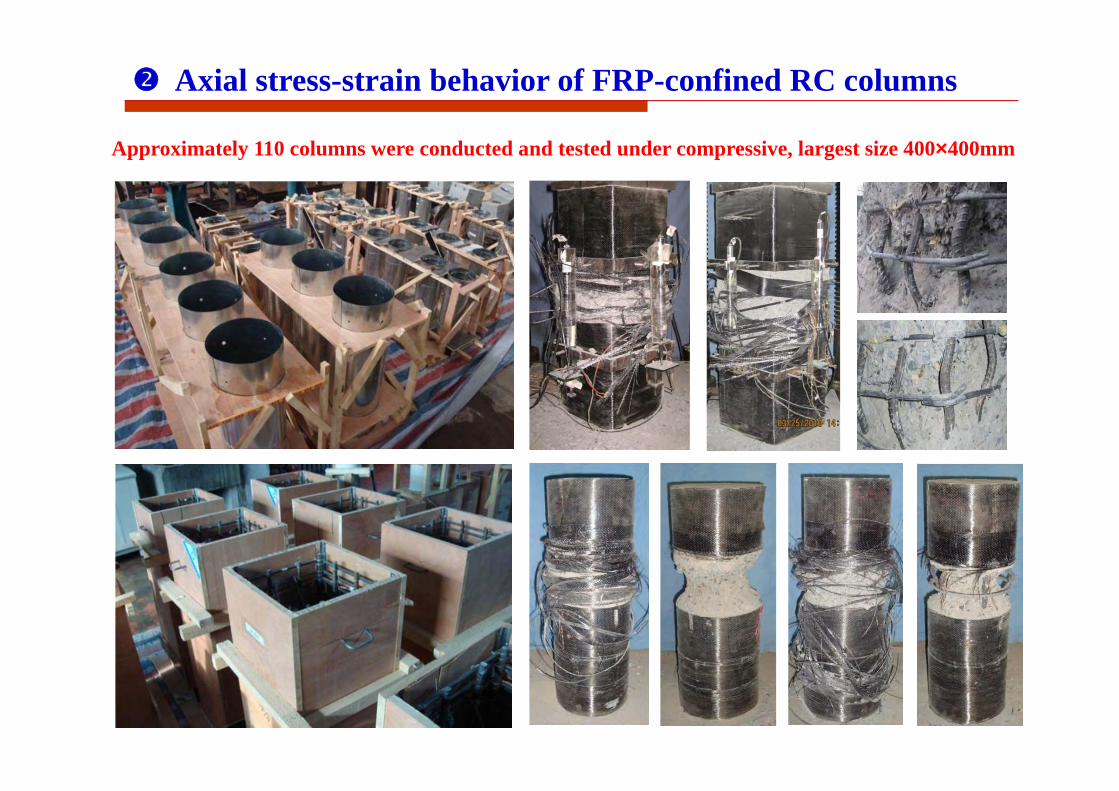
Axial stress-strain behavior of FRP-confined RC columns
Approximately 110 columns were conducted and tested under compressive, largest size 400×400mm
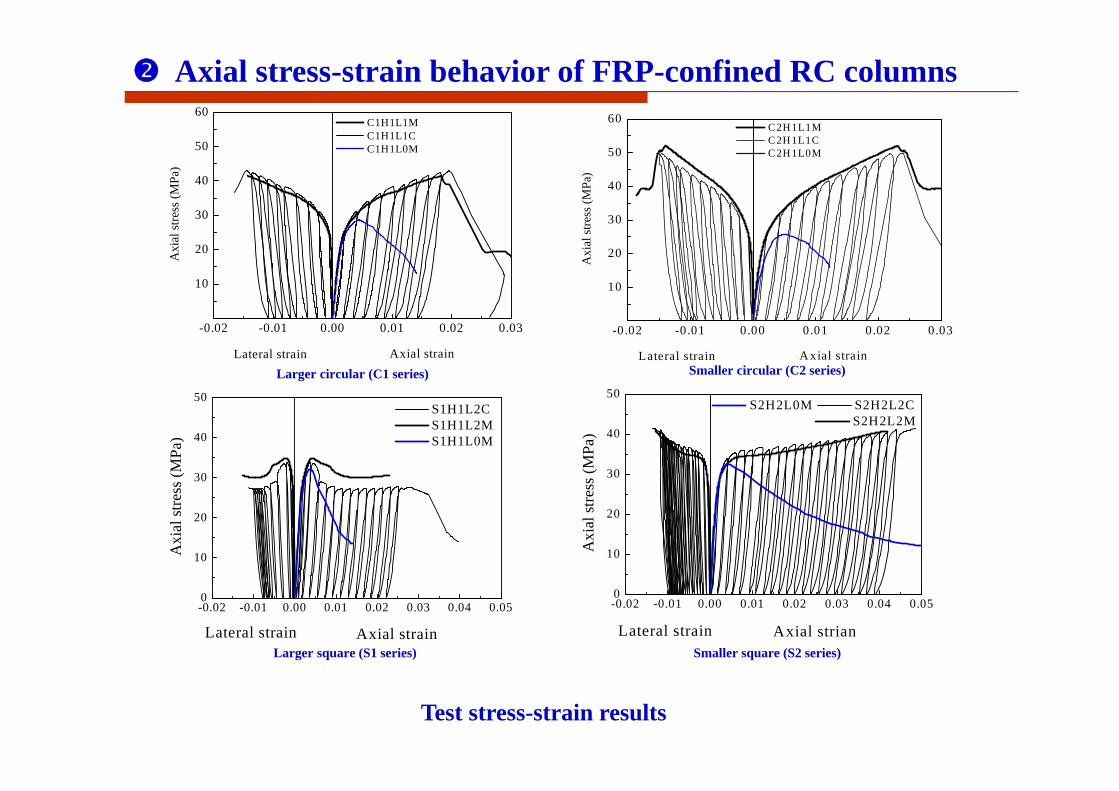
Larger circular (C1 series) Smaller circular (C2 series)
-0.02 -0.01 0.00 0.01 0.02 0.03
10
20
30
40
50
60
Lateral strain Axial strain
C1H1L1M C1H1L1C C1H1L0M
Axi
al st
ress
(MPa
)
-0 .02 -0.01 0.00 0.01 0.02 0.03
10
20
30
40
50
60
Lateral strain A xial strain
C2H 1L1M C2H 1L1C C2H 1L0M
Axi
al st
ress
(MPa
)
Axial stress-strain behavior of FRP-confined RC columns
Test stress-strain results
-0.02 -0.01 0.00 0.01 0.02 0.03 0.04 0.050
10
20
30
40
50 S1H1L2C S1H1L2M S1H1L0M
Lateral strain Axial strain
Axi
al st
ress
(MPa
)
-0.02 -0.01 0.00 0.01 0.02 0.03 0.04 0.050
10
20
30
40
50 S2H2L0M S2H2L2C
S2H2L2M
Lateral strain Axial strian
Axi
al st
ress
(MPa
)
Larger square (S1 series) Smaller square (S2 series)
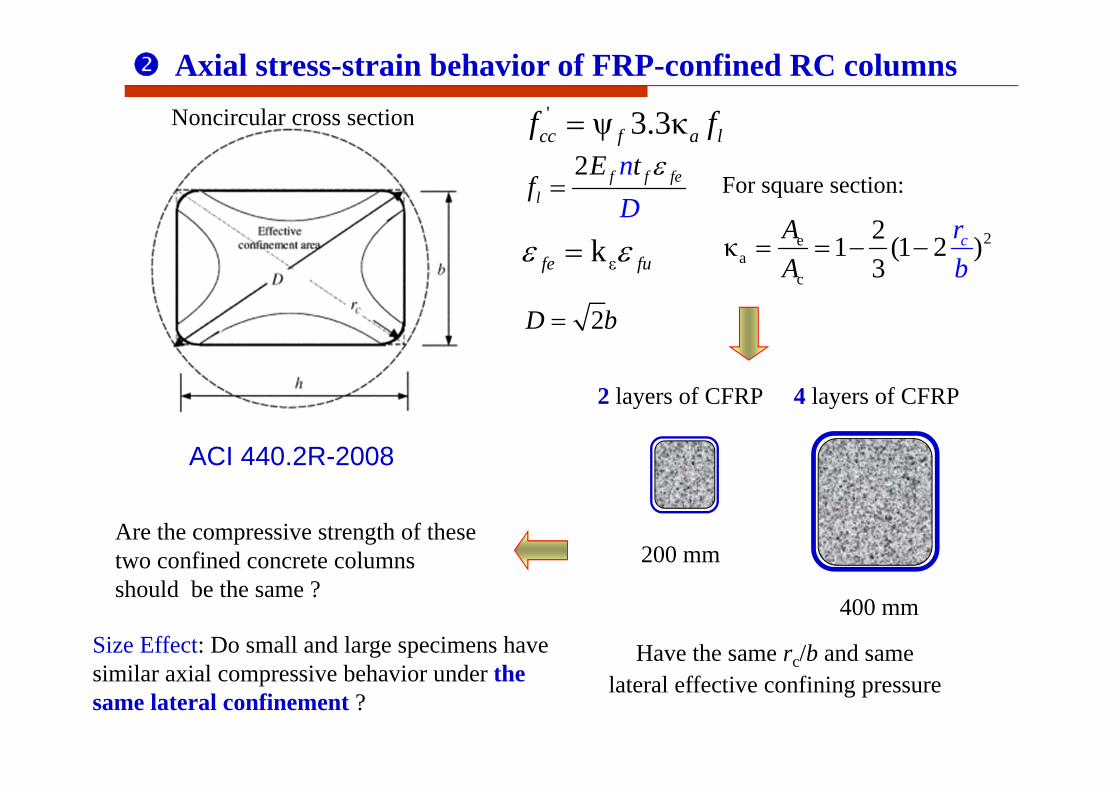
Have the same rc/b and same lateral effective confining pressure
200 mm
400 mm
2 layers of CFRP 4 layers of CFRP
2 f f fel
ntf
DE
εkfe fu
2D b
' ψ 3.3κcc f a lf f
2ea
c
2κ 1 (1 2 )3
cAA
rb
For square section:
Are the compressive strength of these two confined concrete columns should be the same ?
Noncircular cross section
ACI 440.2R-2008
Size Effect: Do small and large specimens have similar axial compressive behavior under the same lateral confinement ?
Axial stress-strain behavior of FRP-confined RC columns
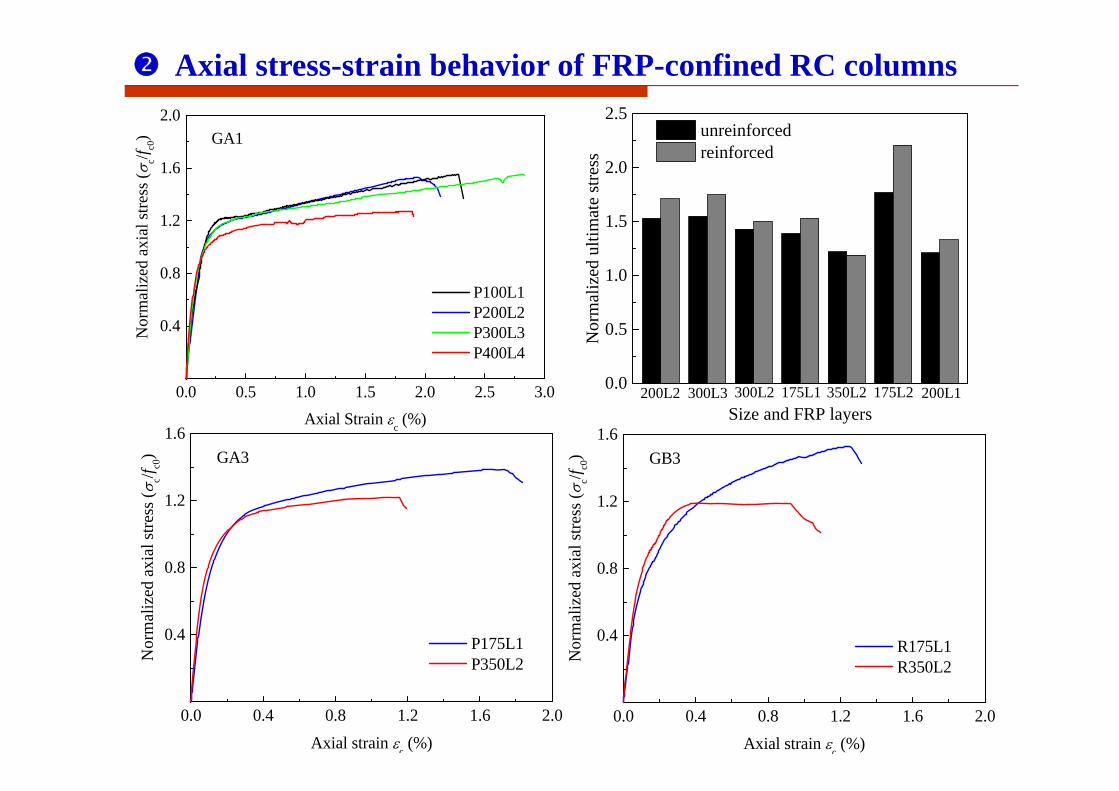
Axial stress-strain behavior of FRP-confined RC columns
0.0 0.5 1.0 1.5 2.0 2.5 3.0
0.4
0.8
1.2
1.6
2.0N
orm
aliz
ed a
xial
stre
ss (
c/f c0)
Axial Strain c (%)
P100L1 P200L2 P300L3 P400L4
GA1
0.0 0.4 0.8 1.2 1.6 2.0
0.4
0.8
1.2
1.6
Nor
mal
ized
axi
al st
ress
(c/f c0
)
Axial strain c (%)
P175L1 P350L2
GA3
0.0 0.4 0.8 1.2 1.6 2.0
0.4
0.8
1.2
1.6
Nor
mal
ized
axi
al st
ress
(c/f c0
)
Axial strain c (%)
R175L1 R350L2
GB3
0.0
0.5
1.0
1.5
2.0
2.5
200L1175L2350L2175L1300L2300L3
Nor
mal
ized
ulti
mat
e st
ress
Size and FRP layers
unreinforced reinforced
200L2
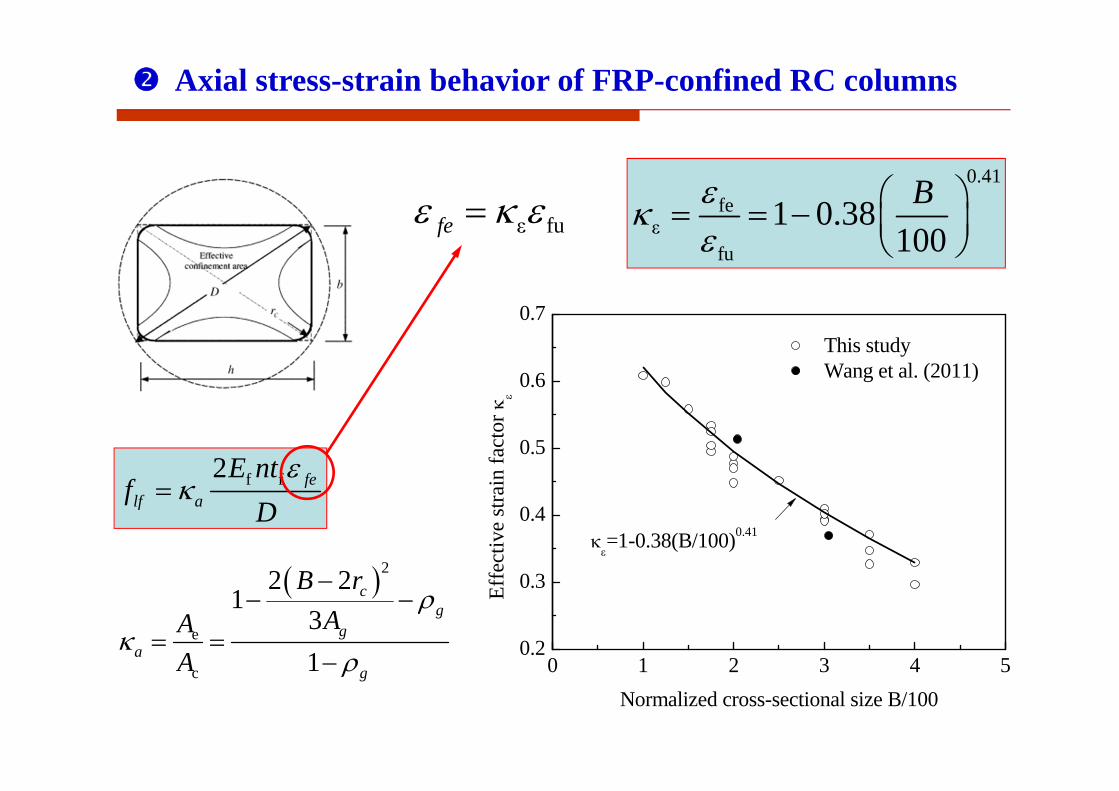
0 1 2 3 4 50.2
0.3
0.4
0.5
0.6
0.7 This study Wang et al. (2011)
Effe
ctiv
e st
rain
fact
or
Normalized cross-sectional size B/100
=1-0.38(B/100)0.41
ε fufe 0.41
feε
fu
1 0.38100B
f f2 felf a
E ntf
D
2
e
c
2 21
31
cg
ga
g
B rAA
A
Axial stress-strain behavior of FRP-confined RC columns
Axial stress-strain behavior of FRP-confined RC columns
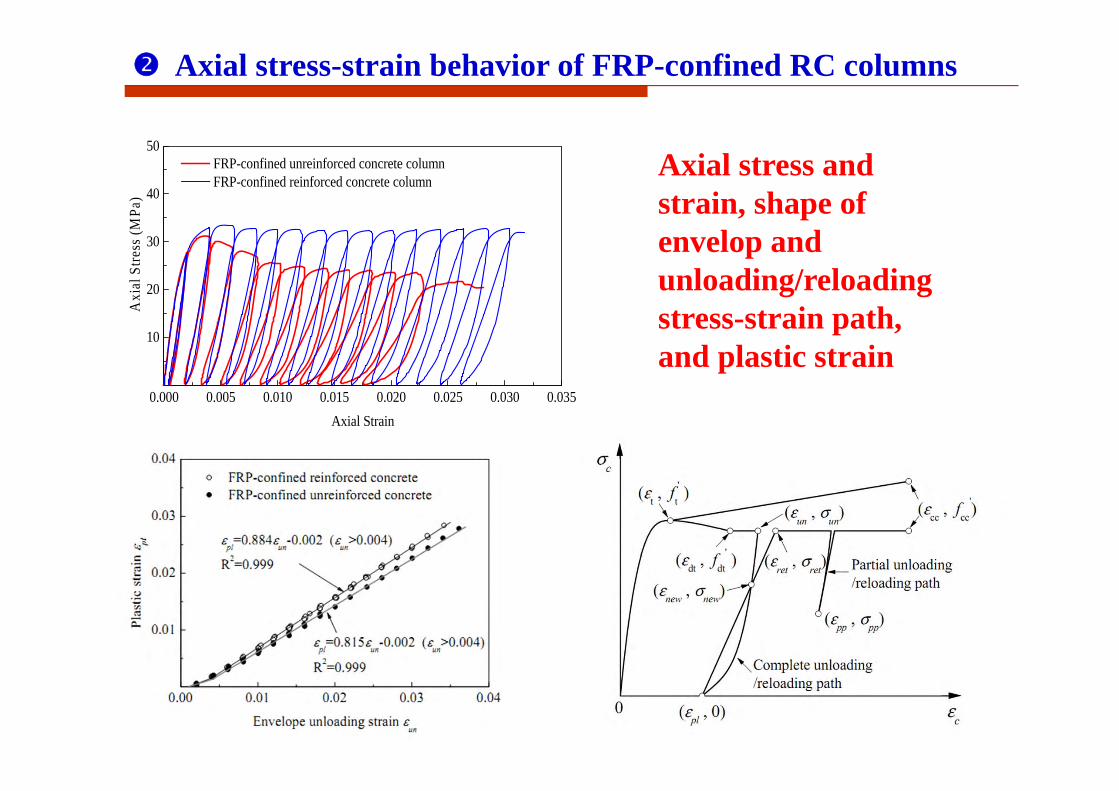
0.000 0.005 0.010 0.015 0.020 0.025 0.030 0.035
10
20
30
40
50A
xial
Stre
ss (M
Pa)
Axial Strain
FRP-confined unreinforced concrete column FRP-confined reinforced concrete column
Axial stress and strain, shape of envelop and unloading/reloading stress-strain path, and plastic strain
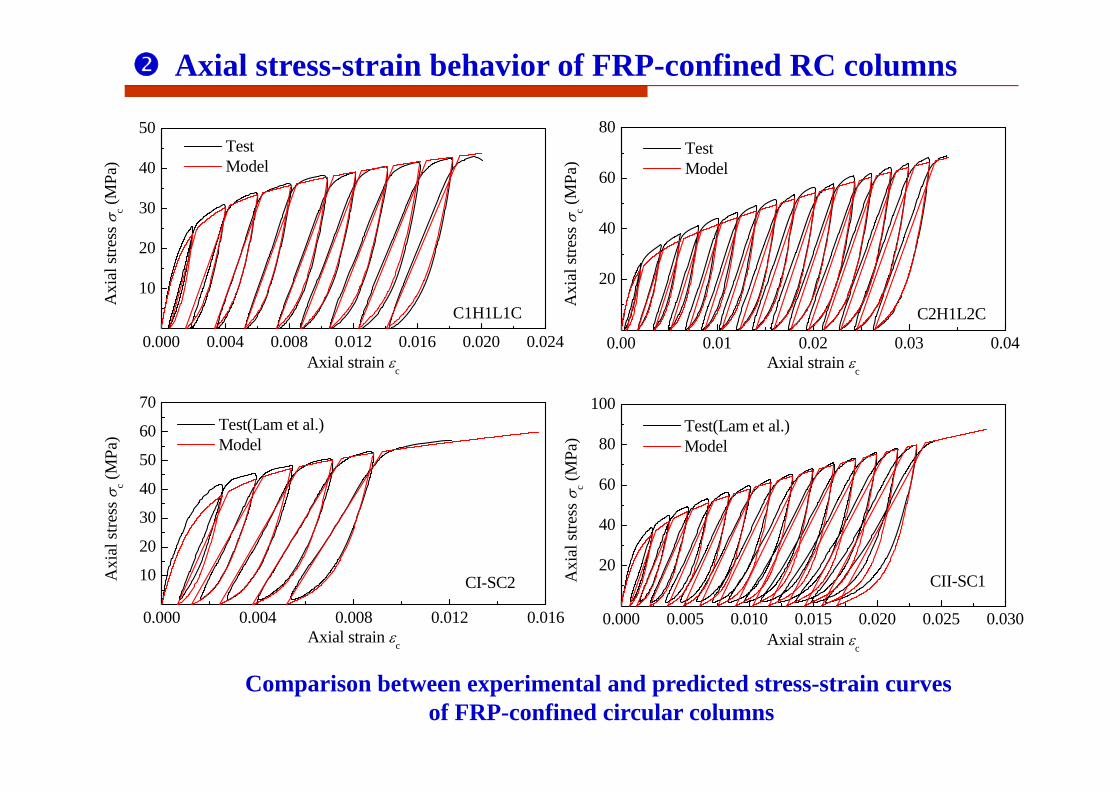
Axial stress-strain behavior of FRP-confined RC columns
0.000 0.004 0.008 0.012 0.016
10
20
30
40
50
60
70
CI-SC2
Test(Lam et al.) Model
Axi
al st
ress
c (M
Pa)
Axial strain c
0.000 0.004 0.008 0.012 0.016 0.020 0.024
10
20
30
40
50 Test Model
Axi
al st
ress
c (M
Pa)
Axial strain c
C1H1L1C
0.00 0.01 0.02 0.03 0.04
20
40
60
80 Test Model
Axi
al st
ress
c (M
Pa)
Axial strain c
C2H1L2C
0.000 0.005 0.010 0.015 0.020 0.025 0.030
20
40
60
80
100
CII-SC1
Test(Lam et al.) Model
Axi
al st
ress
c (M
Pa)
Axial strain c
Comparison between experimental and predicted stress-strain curves of FRP-confined circular columns
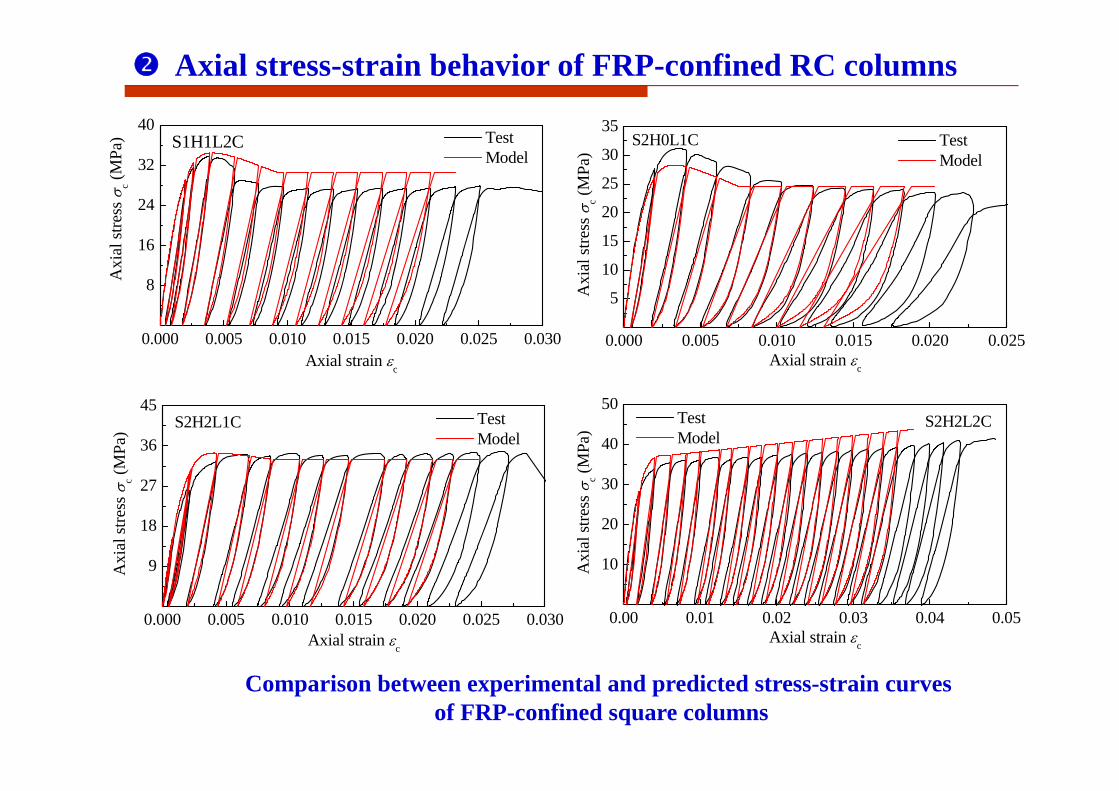
Axial stress-strain behavior of FRP-confined RC columns
Comparison between experimental and predicted stress-strain curves of FRP-confined square columns
0.000 0.005 0.010 0.015 0.020 0.025 0.030
8
16
24
32
40 Test Model
Axi
al st
ress
c (M
Pa)
Axial strain c
S1H1L2C
0.000 0.005 0.010 0.015 0.020 0.025
5
10
15
20
25
30
35 Test Model
Axi
al st
ress
c (M
Pa)
Axial strain c
S2H0L1C
0.00 0.01 0.02 0.03 0.04 0.05
10
20
30
40
50
Axi
al st
ress
c (M
Pa)
Axial strain c
Test Model
S2H2L2C
0.000 0.005 0.010 0.015 0.020 0.025 0.030
9
18
27
36
45
Axi
al st
ress
c (M
Pa)
Axial strain c
Test Model
S2H2L1C
Outline of the presentation
Research background
Axial stress-strain behavior of FRP-confined RC columns
Seismic performance of FRP strengthened RC members
Seismic performance of FRP strengthened RC frames
Seismic performance of FRP strengthened RC members
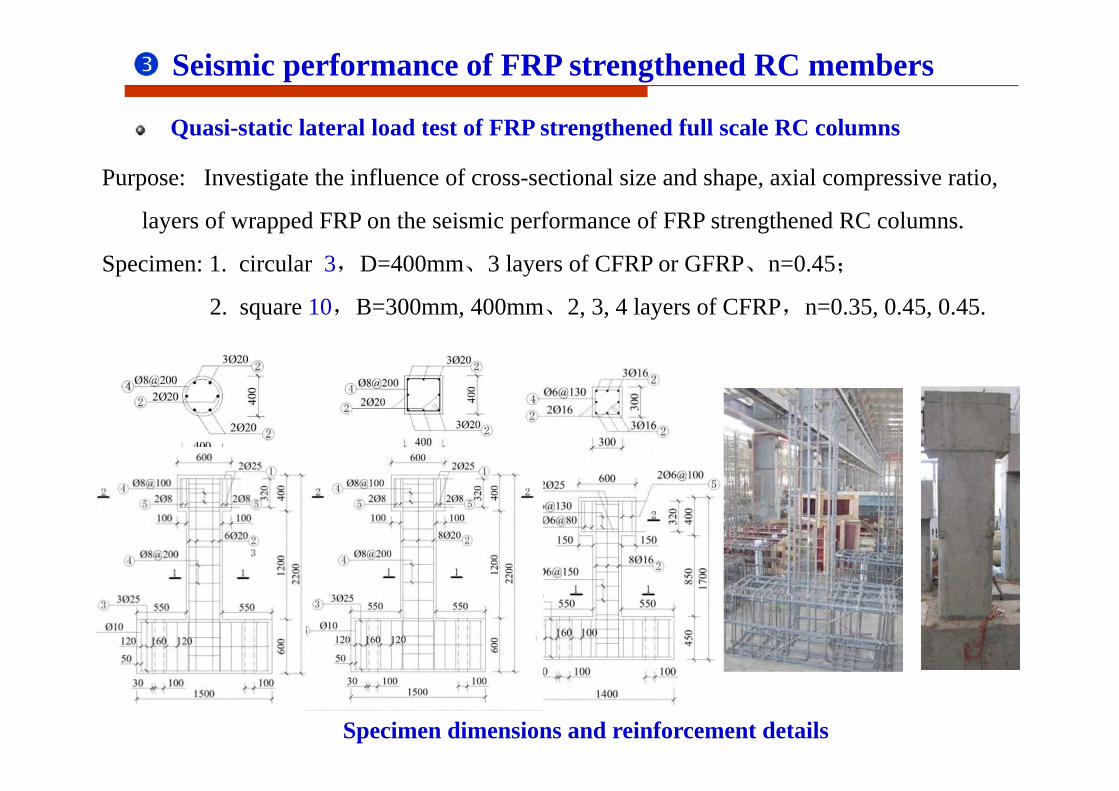
Quasi-static lateral load test of FRP strengthened full scale RC columns
Purpose: Investigate the influence of cross-sectional size and shape, axial compressive ratio,
layers of wrapped FRP on the seismic performance of FRP strengthened RC columns.
Specimen: 1. circular 3,D=400mm、3 layers of CFRP or GFRP、n=0.45;
2. square 10,B=300mm, 400mm、2, 3, 4 layers of CFRP,n=0.35, 0.45, 0.45.
Specimen dimensions and reinforcement details
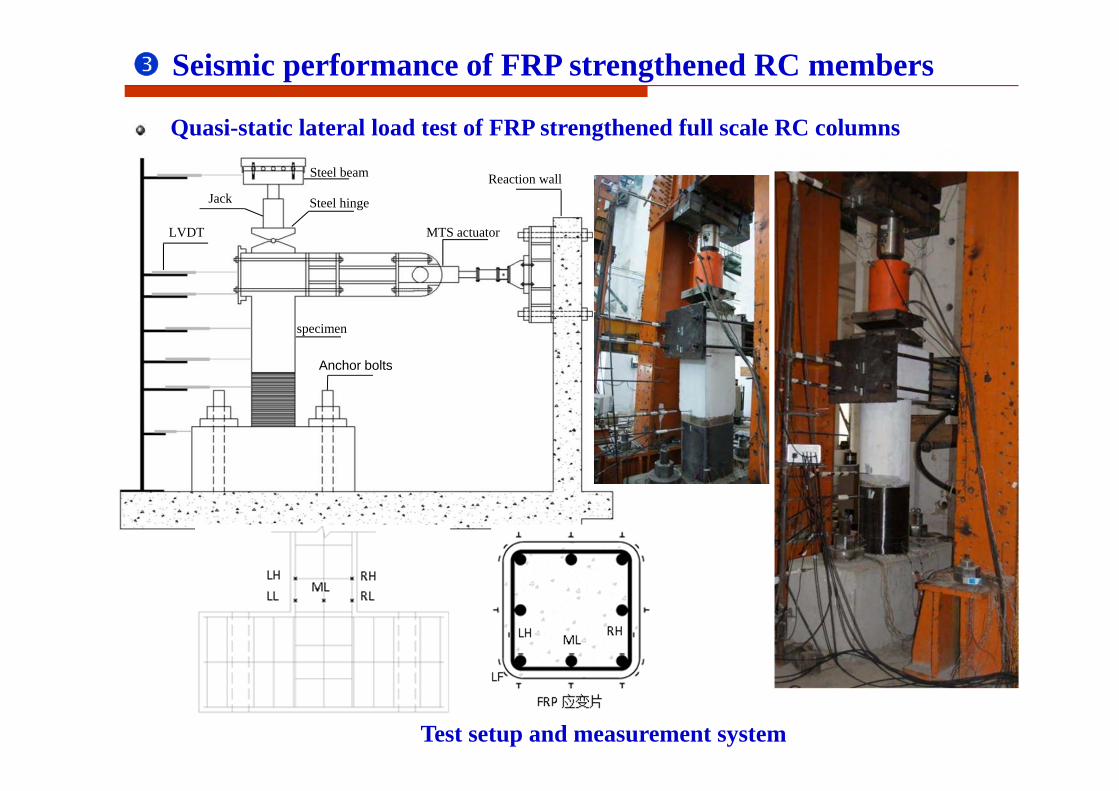
Seismic performance of FRP strengthened RC members
Quasi-static lateral load test of FRP strengthened full scale RC columns
Anchor bolts
MTS actuator
Reaction wall
specimen
LVDT
Steel hingeJack
Steel beam
Test setup and measurement system
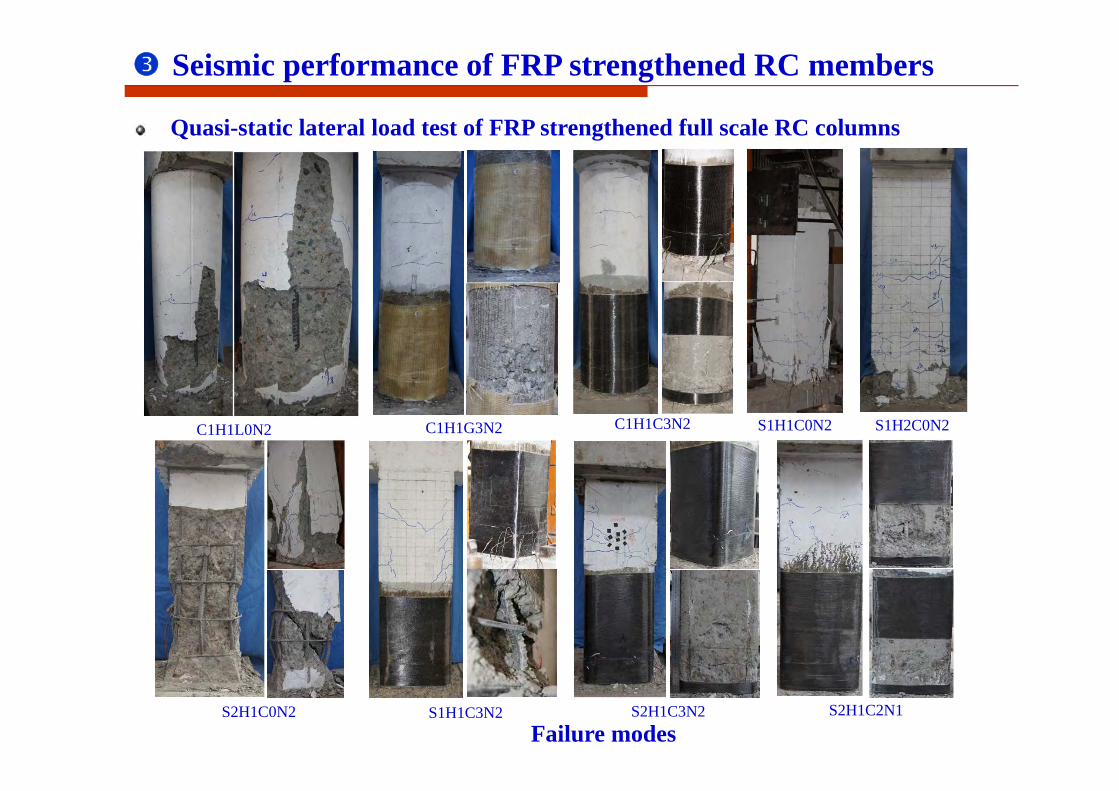
Seismic performance of FRP strengthened RC members
Quasi-static lateral load test of FRP strengthened full scale RC columns
Failure modes
C1H1C3N2C1H1L0N2 C1H1G3N2 S1H1C0N2 S1H2C0N2
S2H1C0N2 S1H1C3N2 S2H1C3N2 S2H1C2N1
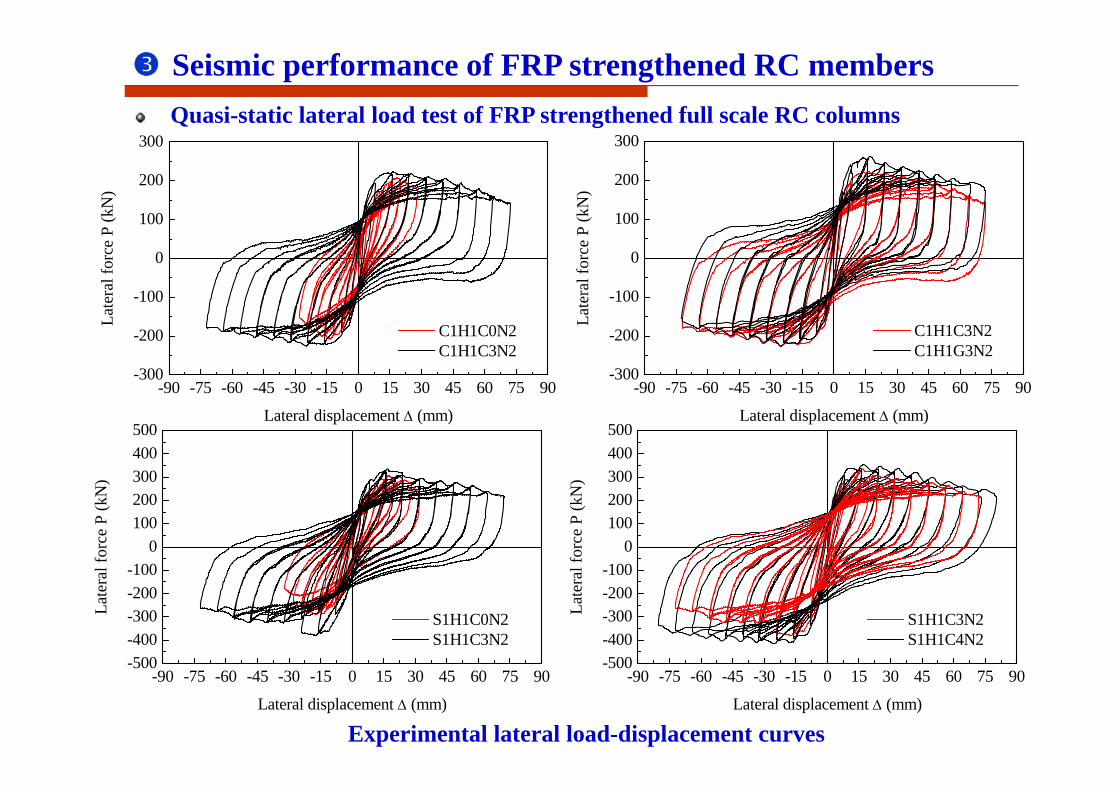
Seismic performance of FRP strengthened RC membersQuasi-static lateral load test of FRP strengthened full scale RC columns
Experimental lateral load-displacement curves
-90 -75 -60 -45 -30 -15 0 15 30 45 60 75 90-500-400-300-200-100
0100200300400500
S1H1C0N2 S1H1C3N2
Late
ral f
orce
P (k
N)
Lateral displacement (mm)
-90 -75 -60 -45 -30 -15 0 15 30 45 60 75 90-500-400-300-200-100
0100200300400500
S1H1C3N2 S1H1C4N2
Late
ral f
orce
P (k
N)
Lateral displacement (mm)
-90 -75 -60 -45 -30 -15 0 15 30 45 60 75 90-300
-200
-100
0
100
200
300
C1H1C3N2 C1H1G3N2
Late
ral f
orce
P (k
N)
Lateral displacement (mm)
-90 -75 -60 -45 -30 -15 0 15 30 45 60 75 90-300
-200
-100
0
100
200
300
C1H1C0N2 C1H1C3N2
Late
ral f
orce
P (k
N)
Lateral displacement (mm)
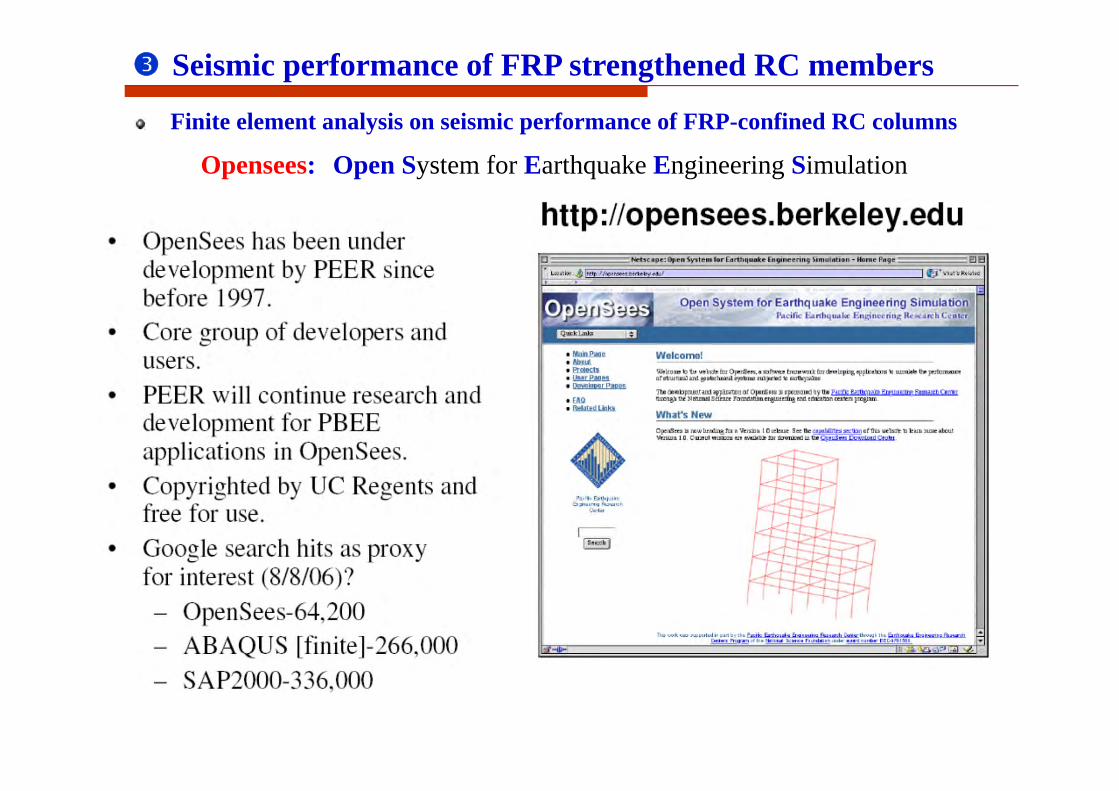
Open System for Earthquake Engineering SimulationOpensees:
Seismic performance of FRP strengthened RC members
Finite element analysis on seismic performance of FRP-confined RC columns
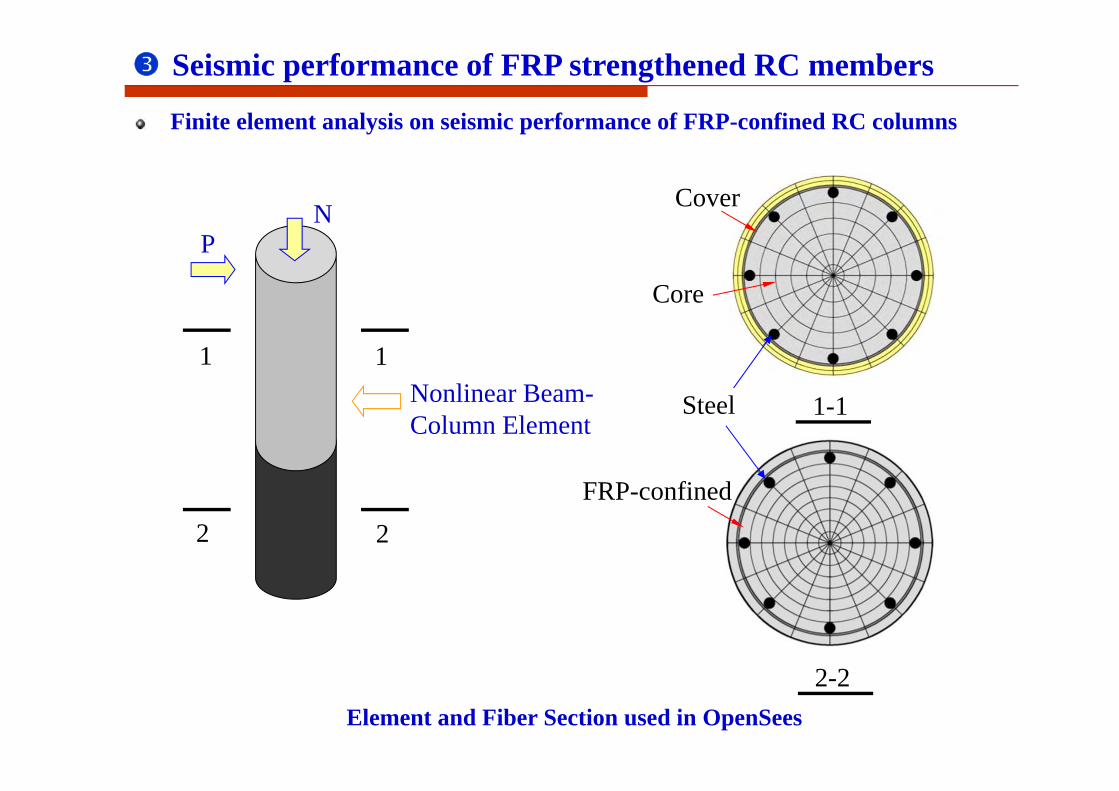
1 1
2 2
NP
Nonlinear Beam-Column Element
Cover
Core
1-1
2-2
Steel
FRP-confined
Element and Fiber Section used in OpenSees
Seismic performance of FRP strengthened RC members
Finite element analysis on seismic performance of FRP-confined RC columns
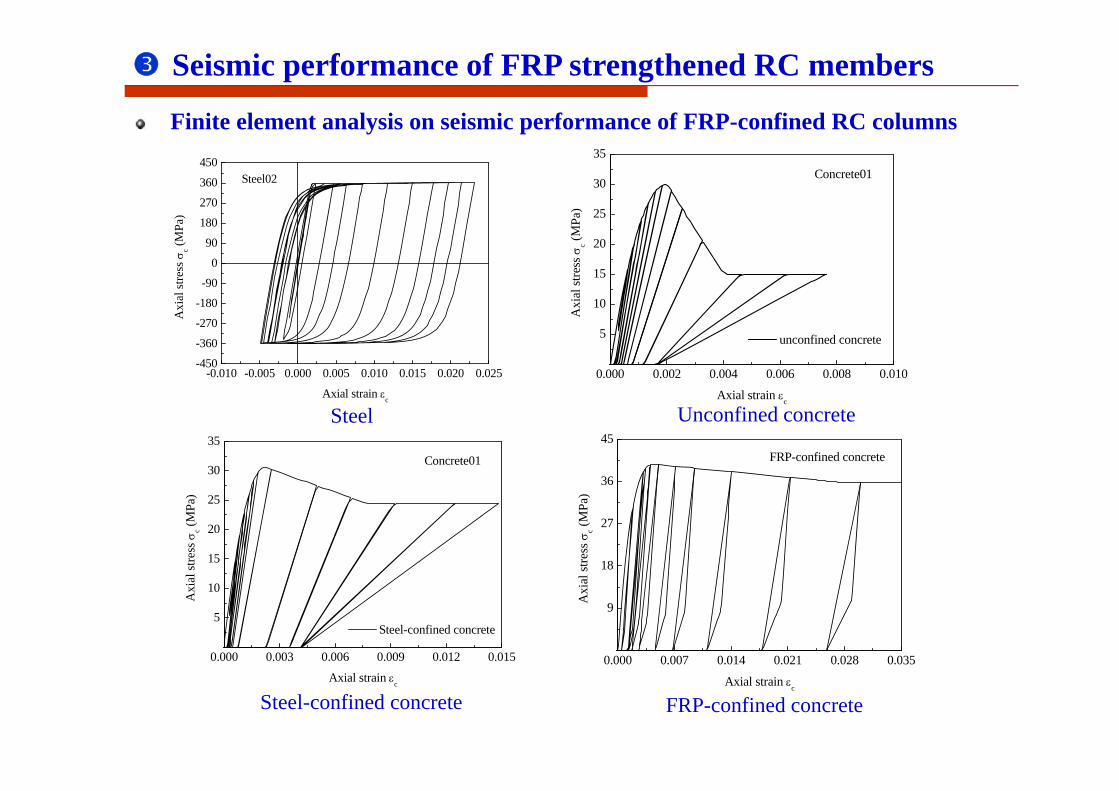
Seismic performance of FRP strengthened RC members
Finite element analysis on seismic performance of FRP-confined RC columns
-0.010 -0.005 0.000 0.005 0.010 0.015 0.020 0.025-450
-360
-270
-180
-900
90
180
270
360
450A
xial
stre
ss
c (MPa
)
Axial strain c
Steel02
0.000 0.002 0.004 0.006 0.008 0.010
5
10
15
20
25
30
35
unconfined concrete
Axi
al st
ress
c (M
Pa)
Axial strain c
Concrete01
0.000 0.003 0.006 0.009 0.012 0.015
5
10
15
20
25
30
35
Steel-confined concrete
Axi
al st
ress
c (M
Pa)
Axial strain c
Concrete01
0.000 0.007 0.014 0.021 0.028 0.035
9
18
27
36
45
Axi
al st
ress
c (M
Pa)
Axial strain c
FRP-confined concrete
Steel Unconfined concrete
Steel-confined concrete FRP-confined concrete
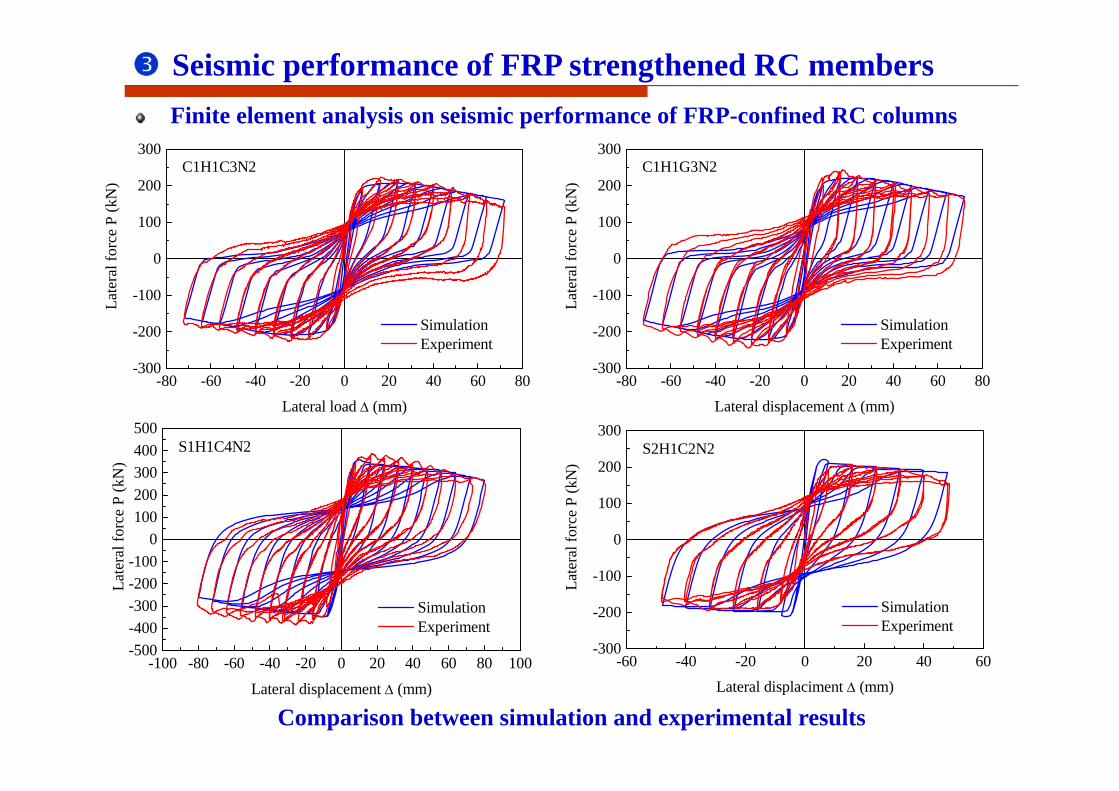
Comparison between simulation and experimental results
Seismic performance of FRP strengthened RC membersFinite element analysis on seismic performance of FRP-confined RC columns
-80 -60 -40 -20 0 20 40 60 80-300
-200
-100
0
100
200
300
Simulation Experiment
Late
ral f
orce
P (k
N)
Lateral load (mm)
C1H1C3N2
-80 -60 -40 -20 0 20 40 60 80-300
-200
-100
0
100
200
300
Simulation Experiment
Late
ral f
orce
P (k
N)
Lateral displacement (mm)
C1H1G3N2
-60 -40 -20 0 20 40 60-300
-200
-100
0
100
200
300
Simulation Experiment
Late
ral f
orce
P (k
N)
Lateral displaciment (mm)
S2H1C2N2
-100 -80 -60 -40 -20 0 20 40 60 80 100-500-400-300-200-100
0100200300400500
Simulation Experiment
Late
ral f
orce
P (k
N)
Lateral displacement (mm)
S1H1C4N2
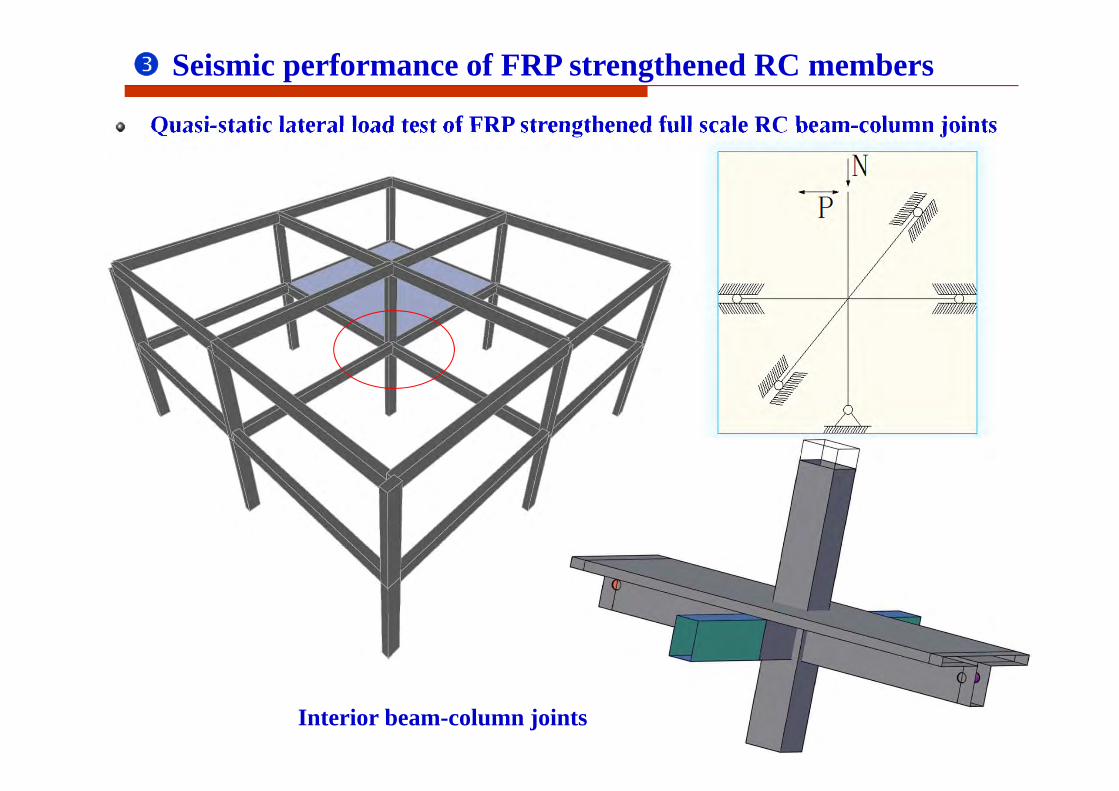
Seismic performance of FRP strengthened RC members
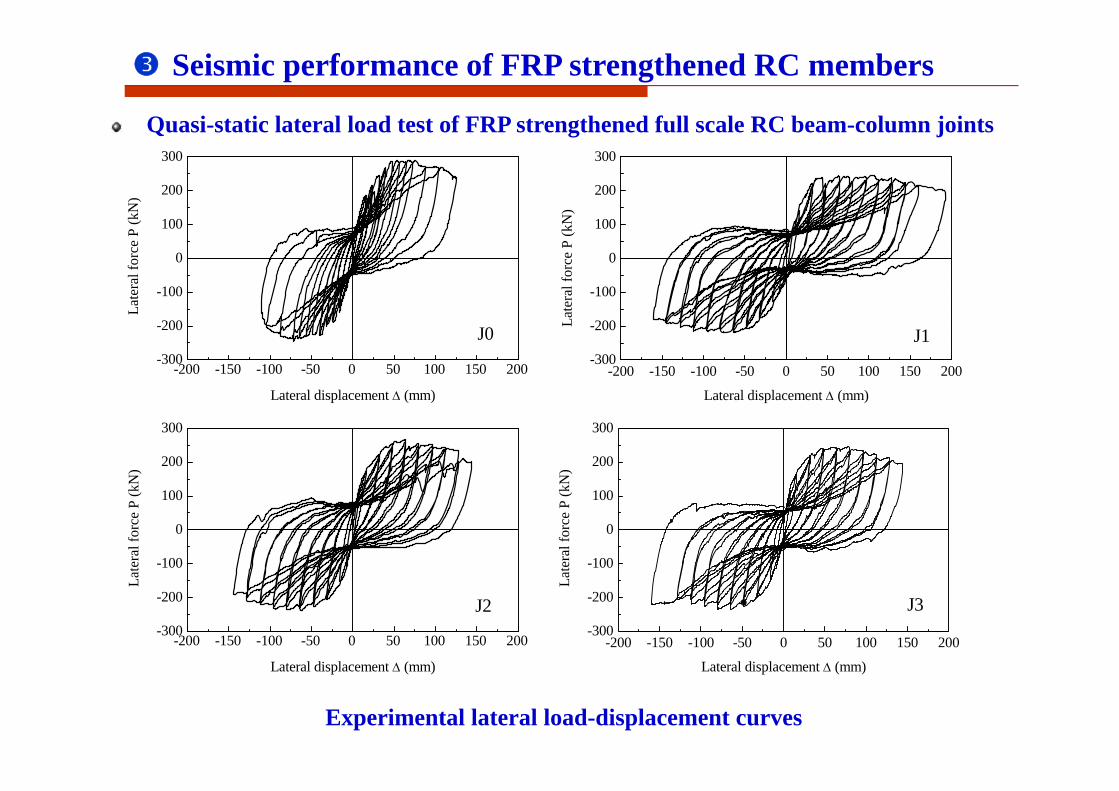
Quasi-static lateral load test of FRP strengthened full scale RC beam-column joints
Interior beam-column joints
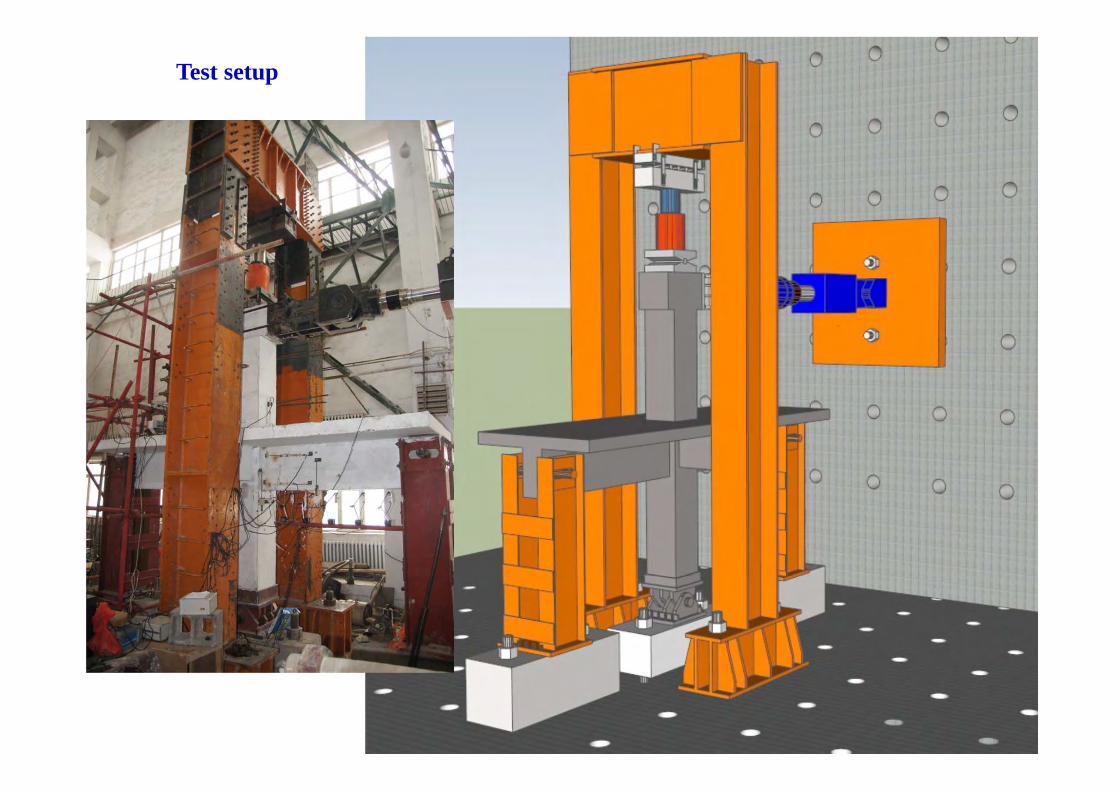
Test setup
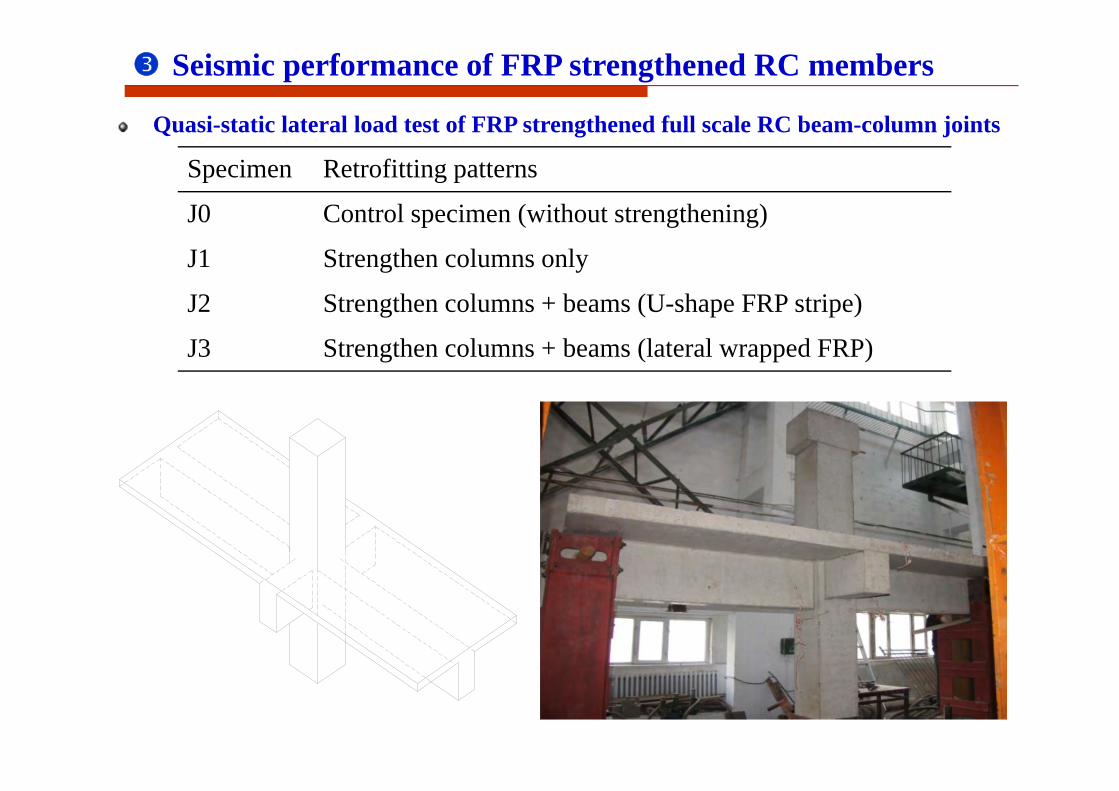
Seismic performance of FRP strengthened RC members
Quasi-static lateral load test of FRP strengthened full scale RC beam-column joints
Specimen Retrofitting patterns
J0 Control specimen (without strengthening)
J1 Strengthen columns only
J2 Strengthen columns + beams (U-shape FRP stripe)
J3 Strengthen columns + beams (lateral wrapped FRP)
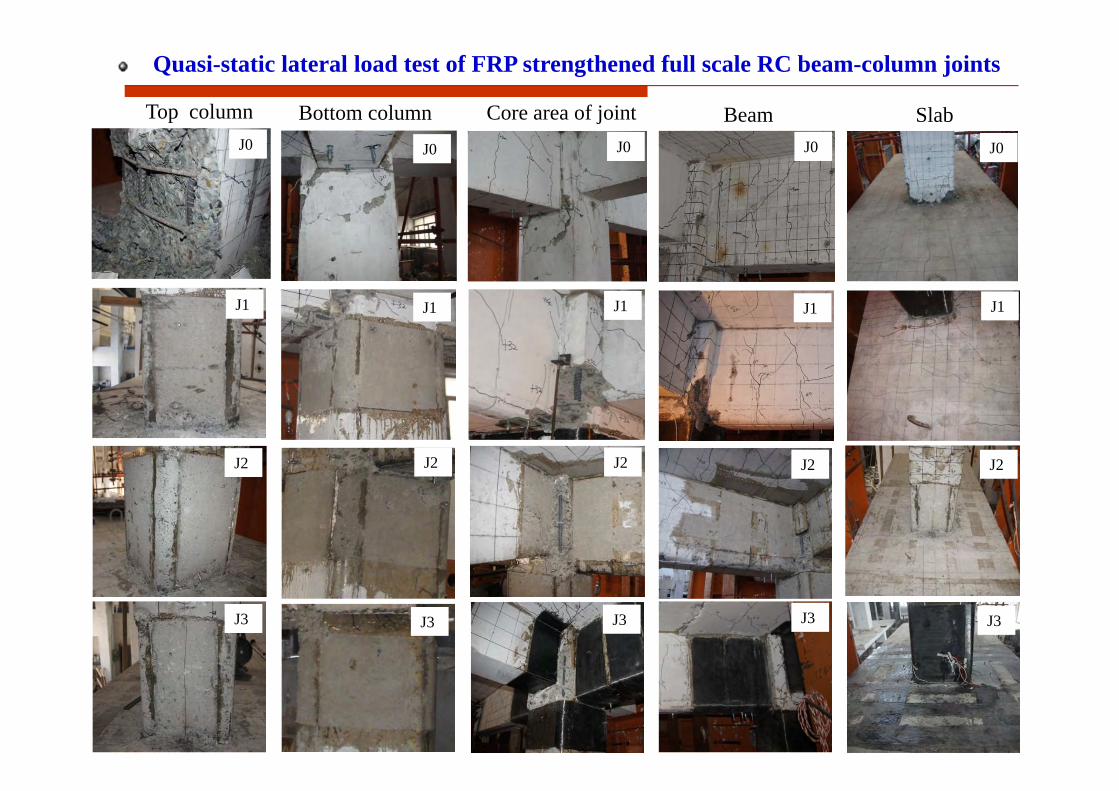
Quasi-static lateral load test of FRP strengthened full scale RC beam-column joints
Top column Core area of joint SlabBeam Bottom columnJ0 J0 J0 J0 J0
J1 J1 J1 J1 J1
J2 J2 J2 J2 J2
J3 J3 J3 J3 J3
Seismic performance of FRP strengthened RC members
-200 -150 -100 -50 0 50 100 150 200-300
-200
-100
0
100
200
300
J0
Late
ral f
orce
P (k
N)
Lateral displacement (mm)
-200 -150 -100 -50 0 50 100 150 200-300
-200
-100
0
100
200
300
J2
Late
ral f
orce
P (k
N)
Lateral displacement (mm)
-200 -150 -100 -50 0 50 100 150 200-300
-200
-100
0
100
200
300
J3
Late
ral f
orce
P (k
N)
Lateral displacement (mm)
-200 -150 -100 -50 0 50 100 150 200-300
-200
-100
0
100
200
300
Late
ral f
orce
P (k
N)
Lateral displacement (mm)
J1
Quasi-static lateral load test of FRP strengthened full scale RC beam-column joints
Experimental lateral load-displacement curves
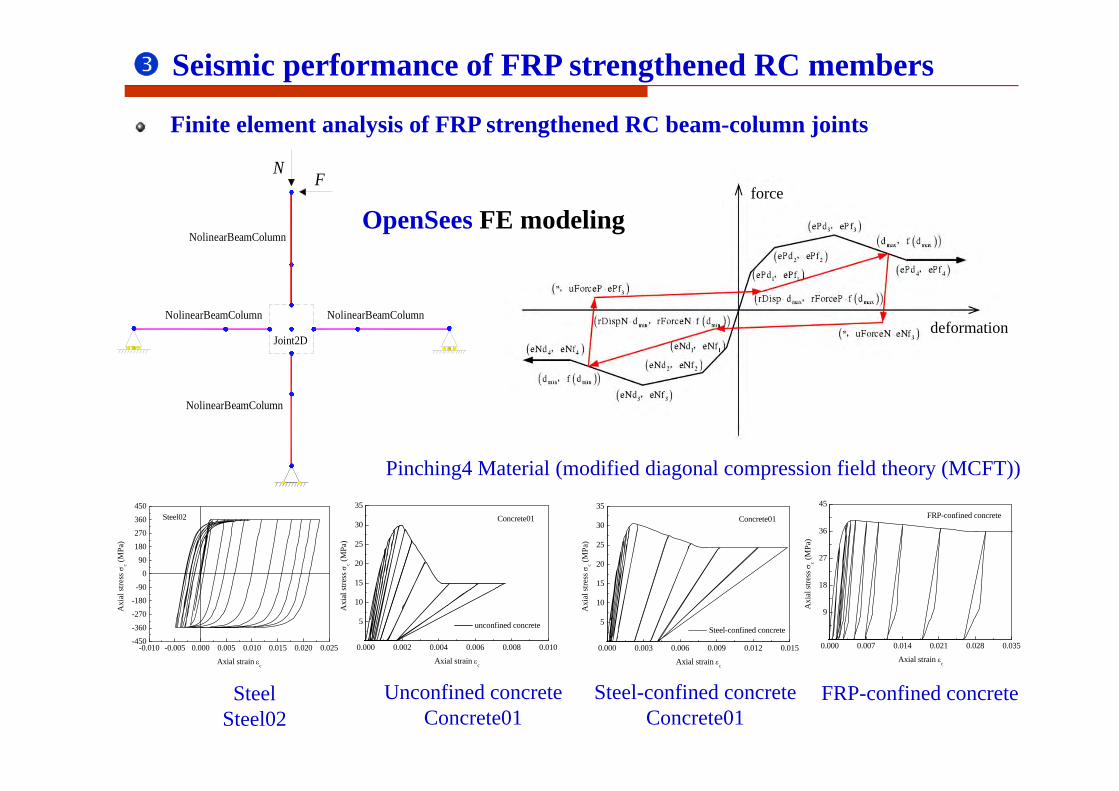
Seismic performance of FRP strengthened RC members
Finite element analysis of FRP strengthened RC beam-column joints
-0.010 -0.005 0.000 0.005 0.010 0.015 0.020 0.025-450
-360-270
-180-90
090
180
270360
450
Axi
al st
ress
c (M
Pa)
Axial strain c
Steel02
0.000 0.007 0.014 0.021 0.028 0.035
9
18
27
36
45
Axi
al st
ress
c (M
Pa)
Axial strain c
FRP-confined concrete
0.000 0.002 0.004 0.006 0.008 0.010
5
10
15
20
25
30
35
unconfined concrete
Axi
al st
ress
c (M
Pa)
Axial strain c
Concrete01
0.000 0.003 0.006 0.009 0.012 0.015
5
10
15
20
25
30
35
Steel-confined concrete
Axi
al st
ress
c (M
Pa)
Axial strain c
Concrete01
NF
Joint2D
NolinearBeamColumn
NolinearBeamColumn
NolinearBeamColumn
NolinearBeamColumn
SteelSteel02
Unconfined concrete Concrete01
Steel-confined concreteConcrete01
FRP-confined concrete
Pinching4 Material (modified diagonal compression field theory (MCFT))
OpenSees FE modeling
deformation
force
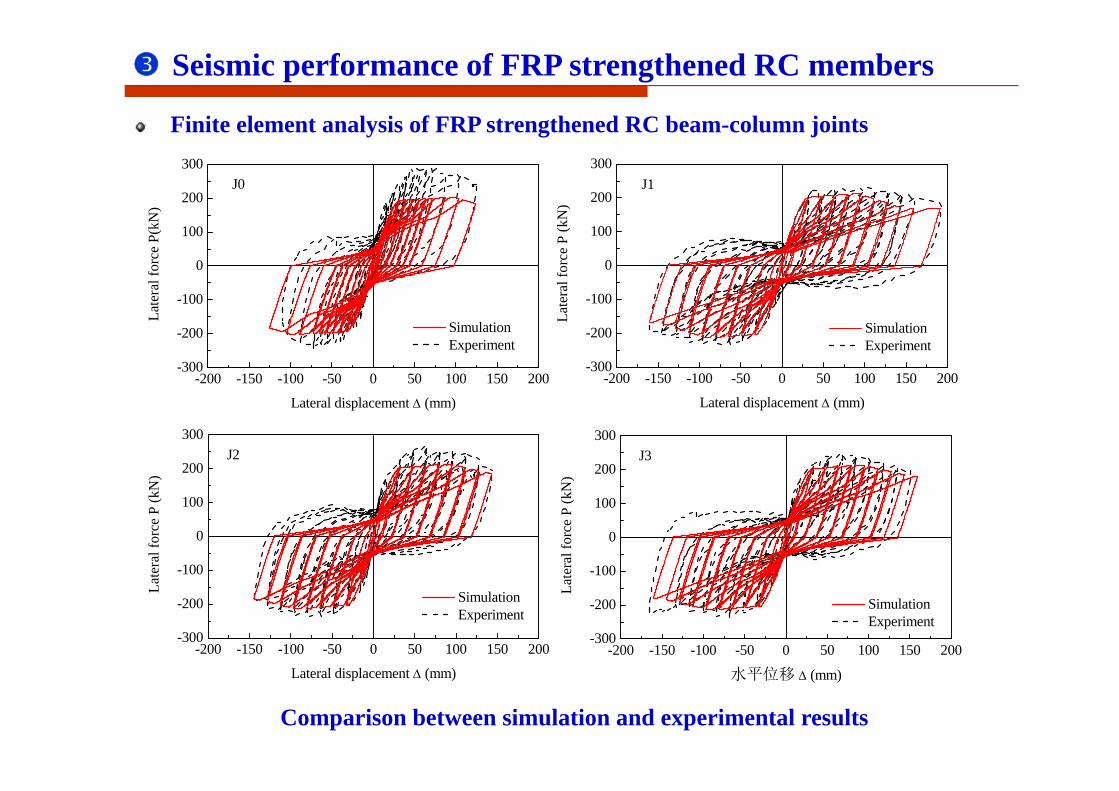
Seismic performance of FRP strengthened RC members
Finite element analysis of FRP strengthened RC beam-column joints
-200 -150 -100 -50 0 50 100 150 200-300
-200
-100
0
100
200
300
Simulation Experiment
Late
ral f
orce
P (k
N)
Lateral displacement (mm)
J2
-200 -150 -100 -50 0 50 100 150 200-300
-200
-100
0
100
200
300
Simulation Experiment
Late
ral f
orce
P (k
N)
水平位移 (mm)
J3
-200 -150 -100 -50 0 50 100 150 200-300
-200
-100
0
100
200
300
Simulation Experiment
Late
ral f
orce
P (k
N)
Lateral displacement (mm)
J1
-200 -150 -100 -50 0 50 100 150 200-300
-200
-100
0
100
200
300
Simulation Experiment
Late
ral f
orce
P(k
N)
Lateral displacement (mm)
J0
Comparison between simulation and experimental results
Outline of the presentation
Research background
Axial stress-strain behavior of FRP-confined RC columns
Seismic performance of FRP strengthened RC members
Seismic performance of FRP strengthened RC frames
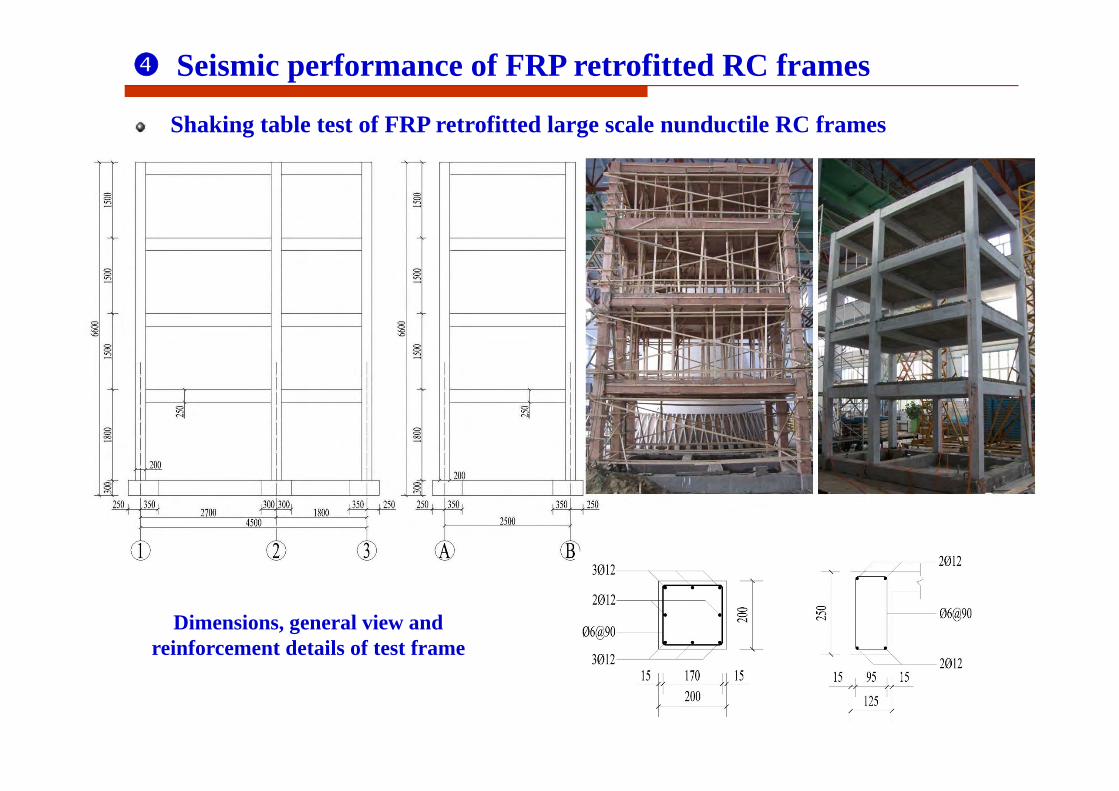
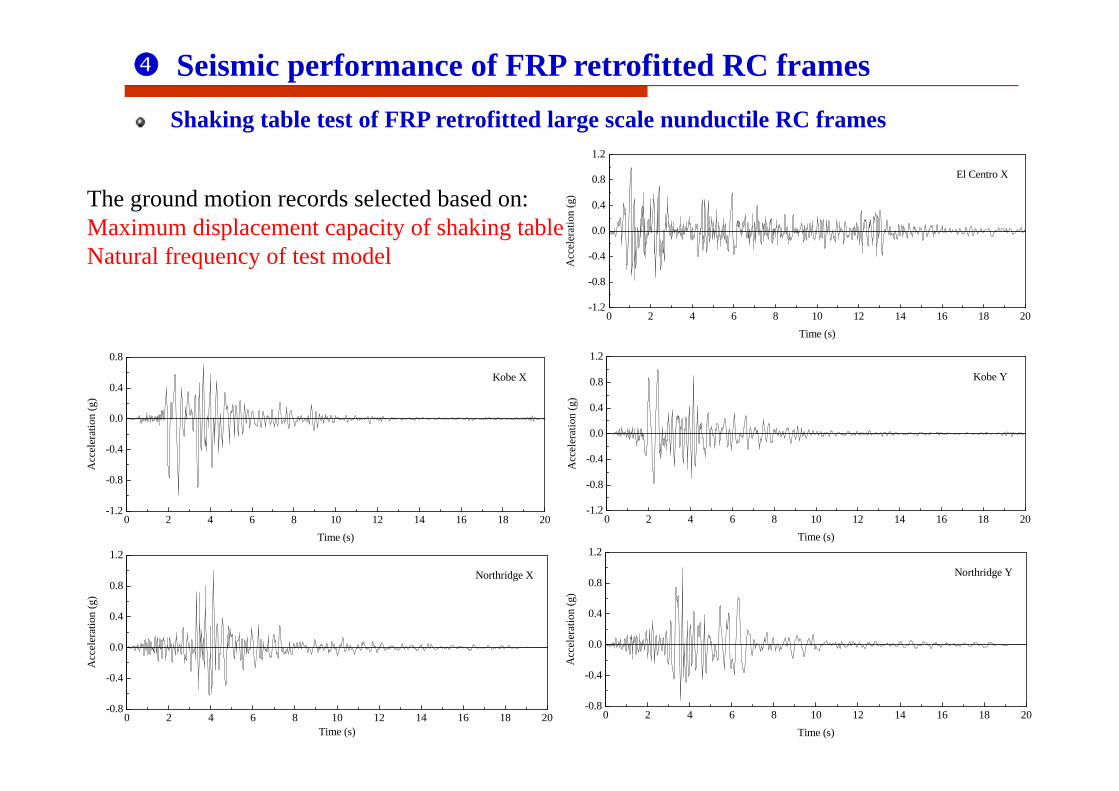
Shaking table test of FRP retrofitted large scale nunductile RC frames
Seismic performance of FRP retrofitted RC frames
Dimensions, general view and reinforcement details of test frame
Shaking table test of FRP retrofitted large scale nunductile RC frames
Seismic performance of FRP retrofitted RC frames
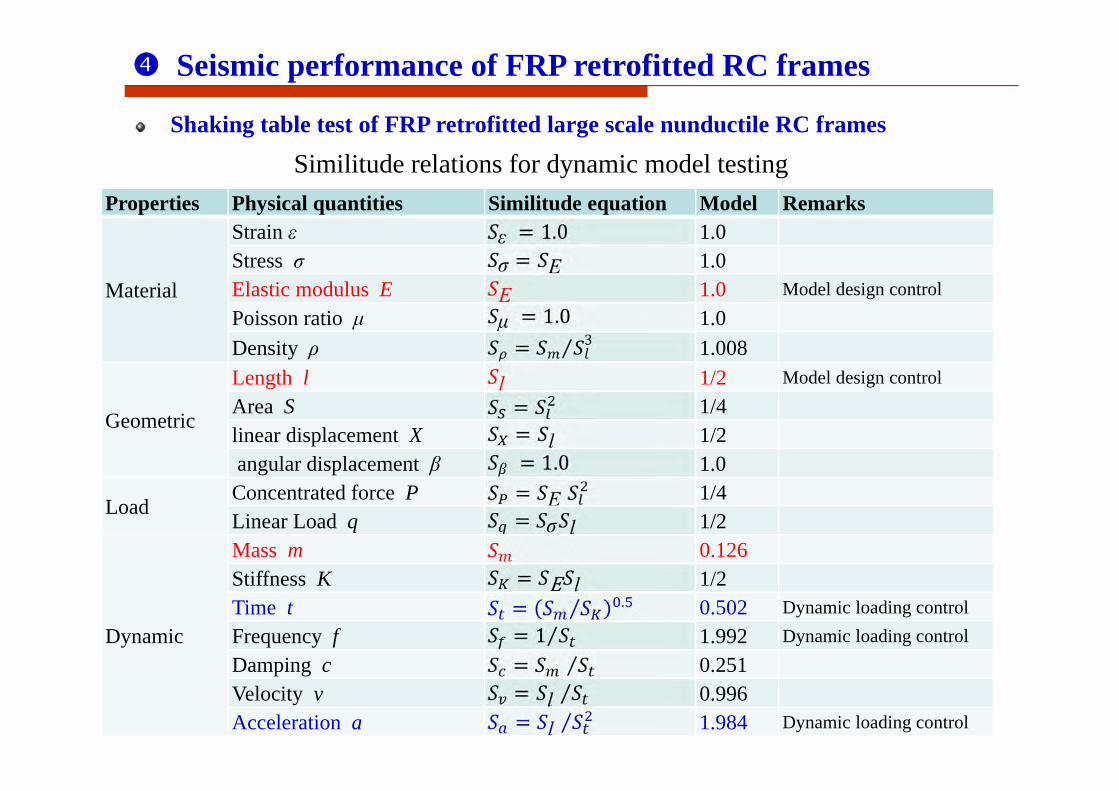
Properties Physical quantities Similitude equation Model Remarks
Material
Strain ε 1.0Stress σ 1.0Elastic modulus E 1.0 Model design controlPoisson ratio μ 1.0Density ρ 1.008
Geometric
Length l 1/2 Model design controlArea S 1/4linear displacement X 1/2angular displacement β 1.0
LoadConcentrated force P 1/4Linear Load q 1/2
Dynamic
Mass m 0.126Stiffness K 1/2Time t 0.502 Dynamic loading controlFrequency f 1.992 Dynamic loading controlDamping c 0.251Velocity v 0.996Acceleration a 1.984 Dynamic loading control
Similitude relations for dynamic model testing
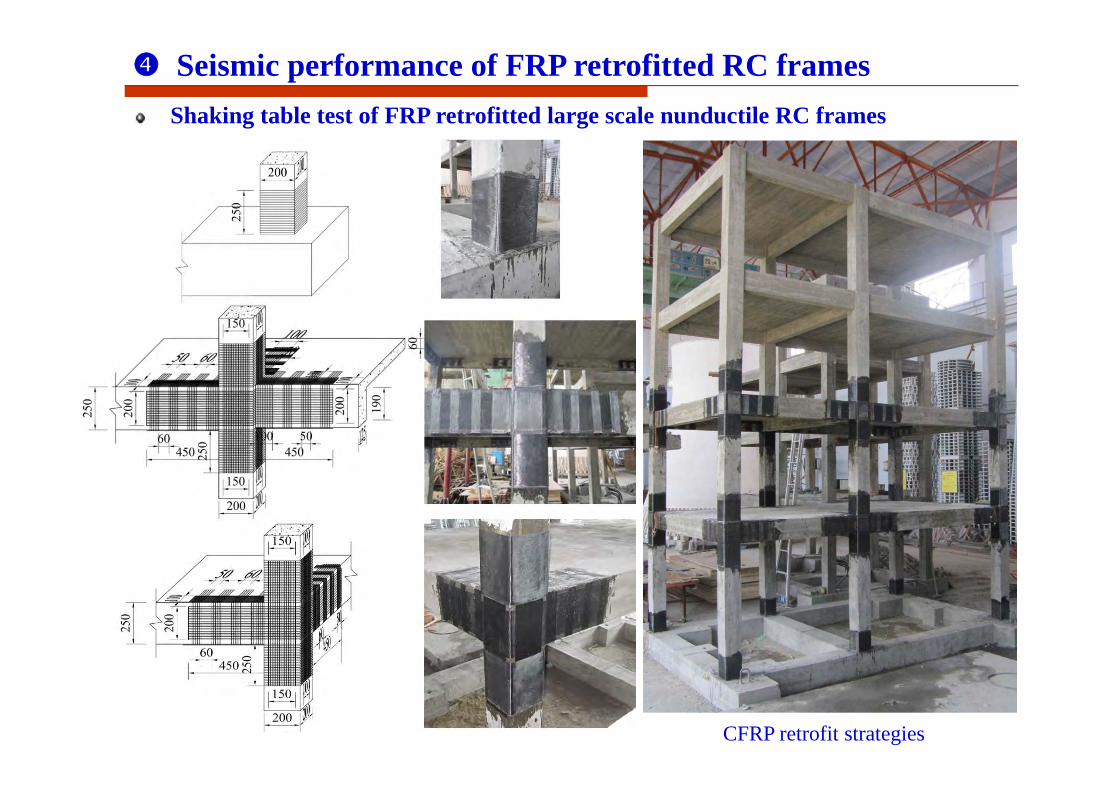
Shaking table test of FRP retrofitted large scale nunductile RC frames
Seismic performance of FRP retrofitted RC frames
CFRP retrofit strategies
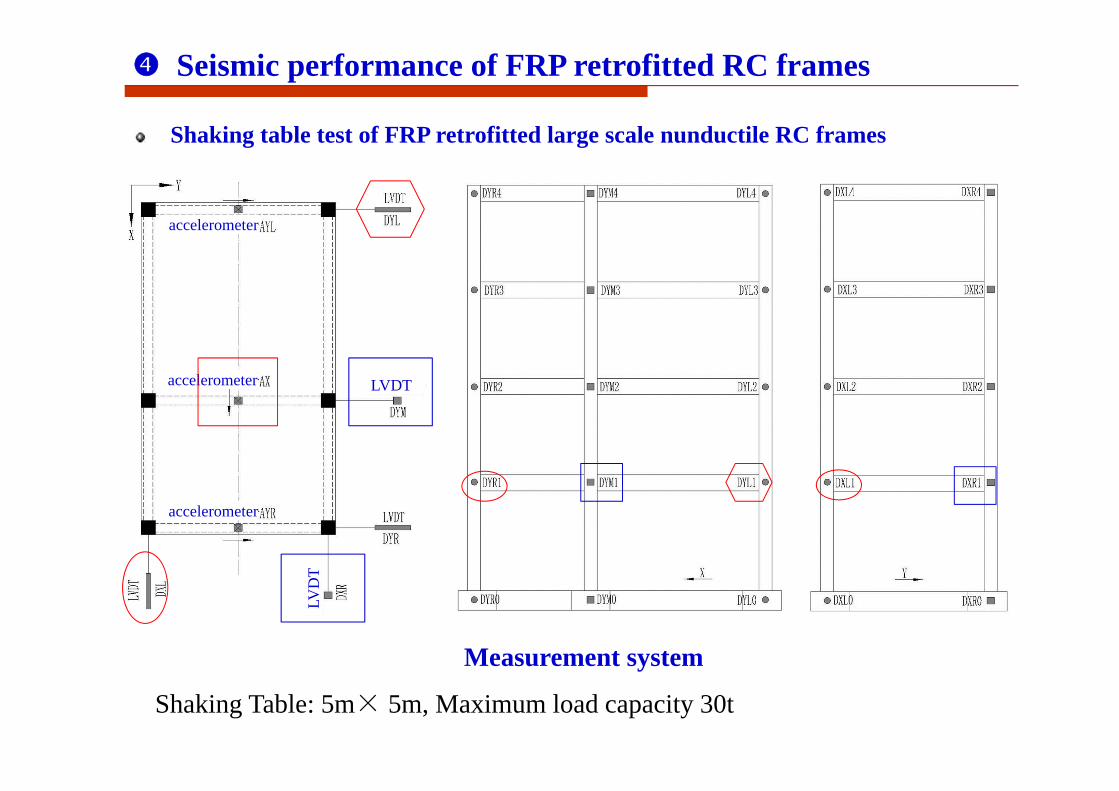
Shaking table test of FRP retrofitted large scale nunductile RC frames
Seismic performance of FRP retrofitted RC frames
Measurement system
LVDT
LVD
T
accelerometer
accelerometer
accelerometer
Shaking Table: 5m× 5m, Maximum load capacity 30t
Shaking table test of FRP retrofitted large scale nunductile RC frames
Seismic performance of FRP retrofitted RC frames
0 2 4 6 8 10 12 14 16 18 20-0.8
-0.4
0.0
0.4
0.8
1.2
Acc
eler
atio
n (g
)
Time (s)
Northridge X
0 2 4 6 8 10 12 14 16 18 20-1.2
-0.8
-0.4
0.0
0.4
0.8
Acc
eler
atio
n (g
)
Time (s)
Kobe X
0 2 4 6 8 10 12 14 16 18 20-1.2
-0.8
-0.4
0.0
0.4
0.8
1.2
Acc
eler
atio
n (g
)
Time (s)
Kobe Y
0 2 4 6 8 10 12 14 16 18 20-0.8
-0.4
0.0
0.4
0.8
1.2
Acc
eler
atio
n (g
)
Time (s)
Northridge Y
0 2 4 6 8 10 12 14 16 18 20-1.2
-0.8
-0.4
0.0
0.4
0.8
1.2
Acc
eler
atio
n (g
)
Time (s)
El Centro X
The ground motion records selected based on:Maximum displacement capacity of shaking tableNatural frequency of test model
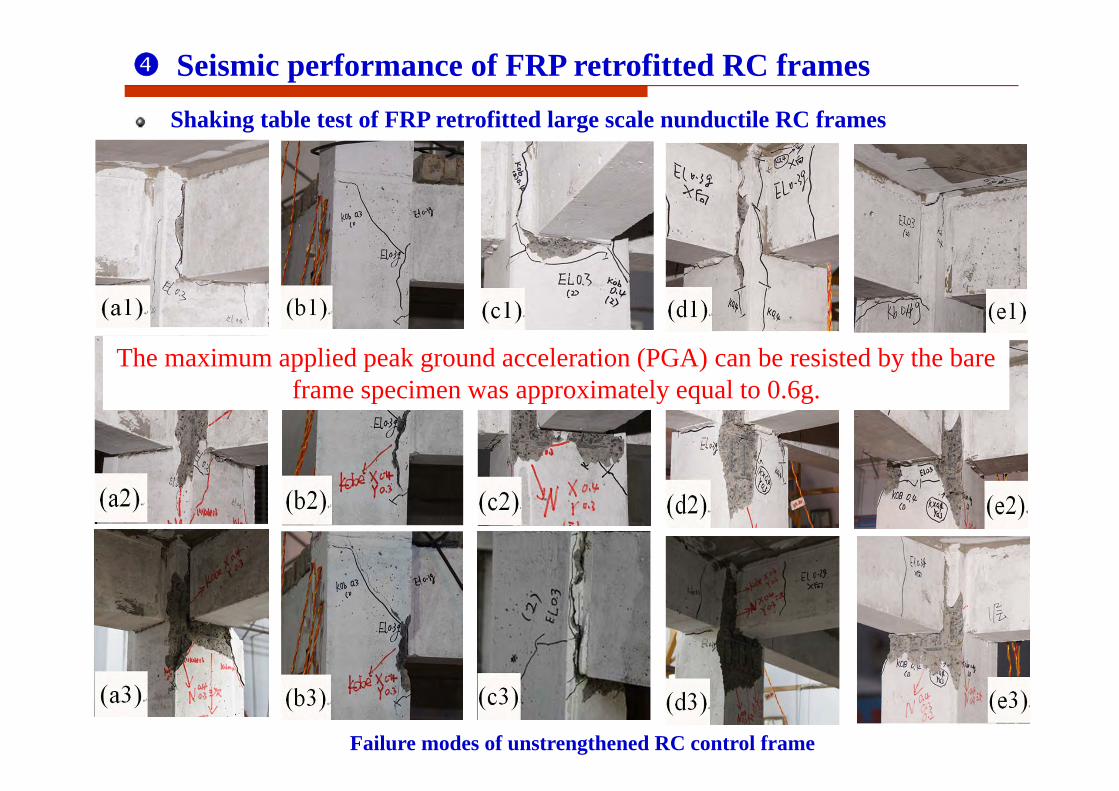
Failure modes of unstrengthened RC control frame
Shaking table test of FRP retrofitted large scale nunductile RC frames
Seismic performance of FRP retrofitted RC frames
The maximum applied peak ground acceleration (PGA) can be resisted by the bare frame specimen was approximately equal to 0.6g.
Shaking table test of FRP retrofitted large scale nunductile RC frames
Seismic performance of FRP retrofitted RC frames
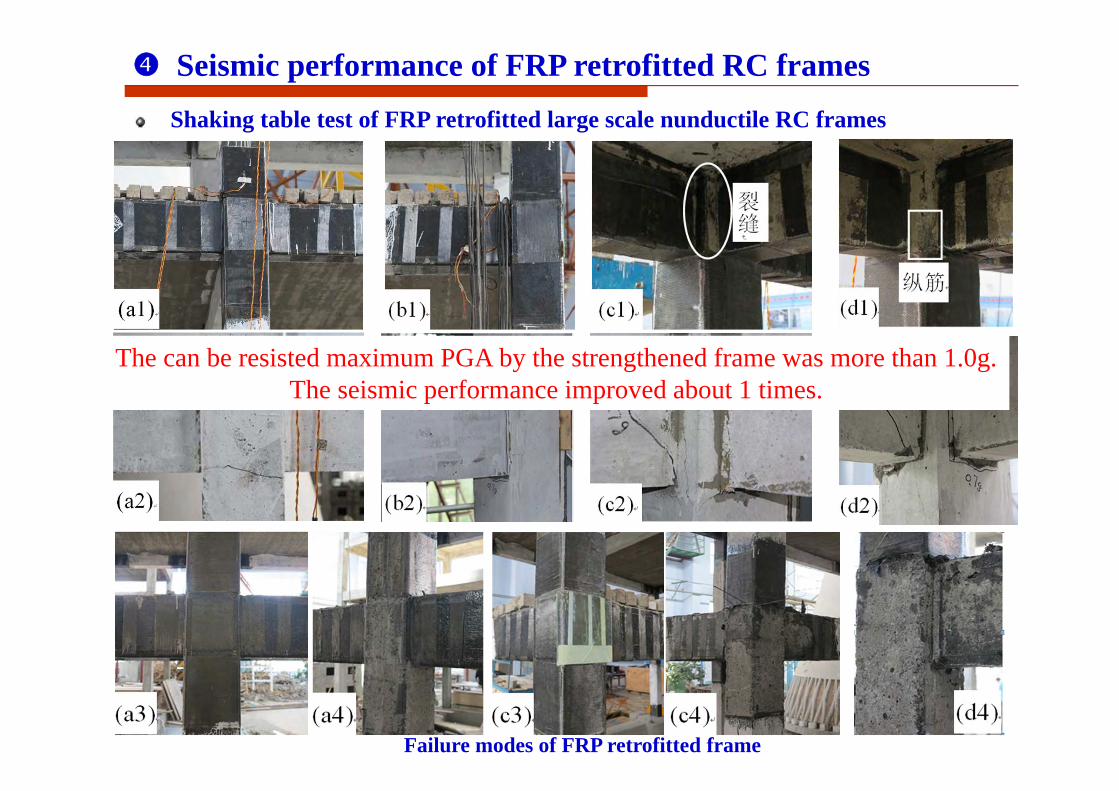
Failure modes of FRP retrofitted frame
The can be resisted maximum PGA by the strengthened frame was more than 1.0g.The seismic performance improved about 1 times.
Shaking table test of FRP retrofitted large scale nunductile RC frames
Seismic performance of FRP retrofitted RC frames
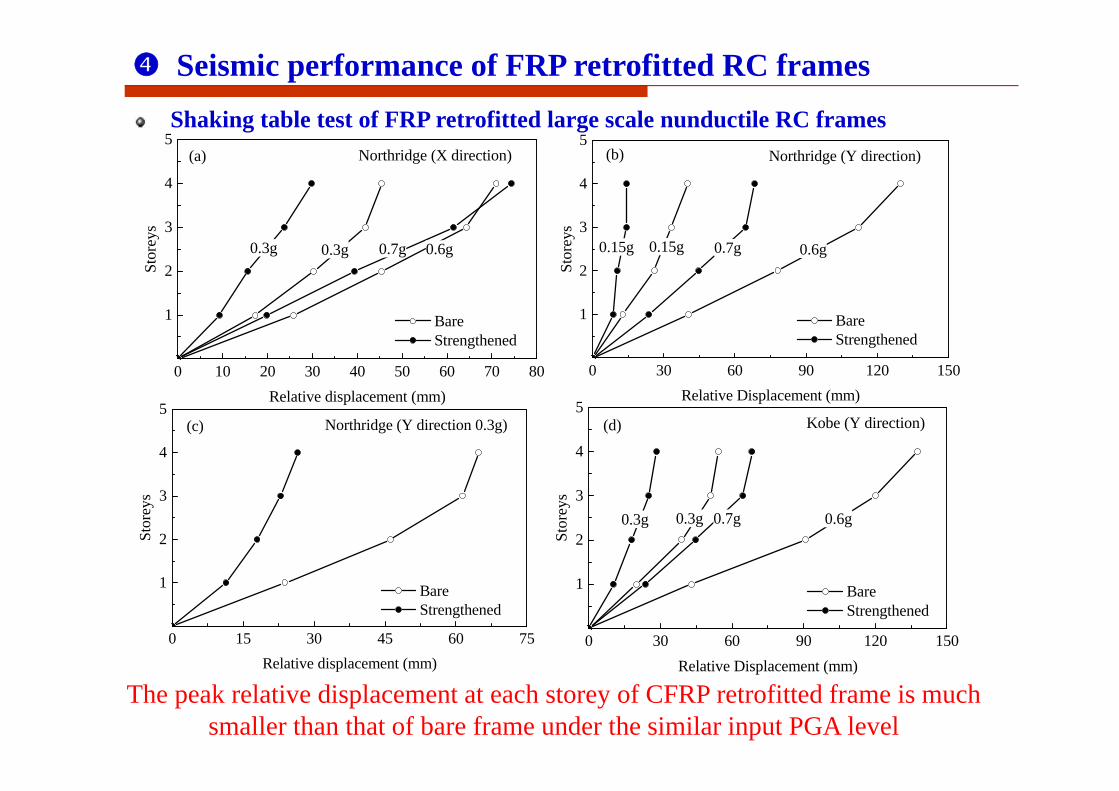
The peak relative displacement at each storey of CFRP retrofitted frame is much smaller than that of bare frame under the similar input PGA level
0 10 20 30 40 50 60 70 80
1
2
3
4
5
0.7g0.3g 0.6g0.3g
Stor
eys
Relative displacement (mm)
Bare Strengthened
Northridge (X direction)(a)
0 30 60 90 120 150
1
2
3
4
5
0.15g 0.7g0.15g 0.6g
Stor
eys
Relative Displacement (mm)
Bare Strengthened
Northridge (Y direction)(b)
0 15 30 45 60 75
1
2
3
4
5
Stor
eys
Relative displacement (mm)
Bare Strengthened
Northridge (Y direction 0.3g)(c)
0 30 60 90 120 150
1
2
3
4
5
0.3g 0.7g 0.6g0.3g
Stor
eys
Relative Displacement (mm)
Bare Strengthened
Kobe (Y direction)(d)
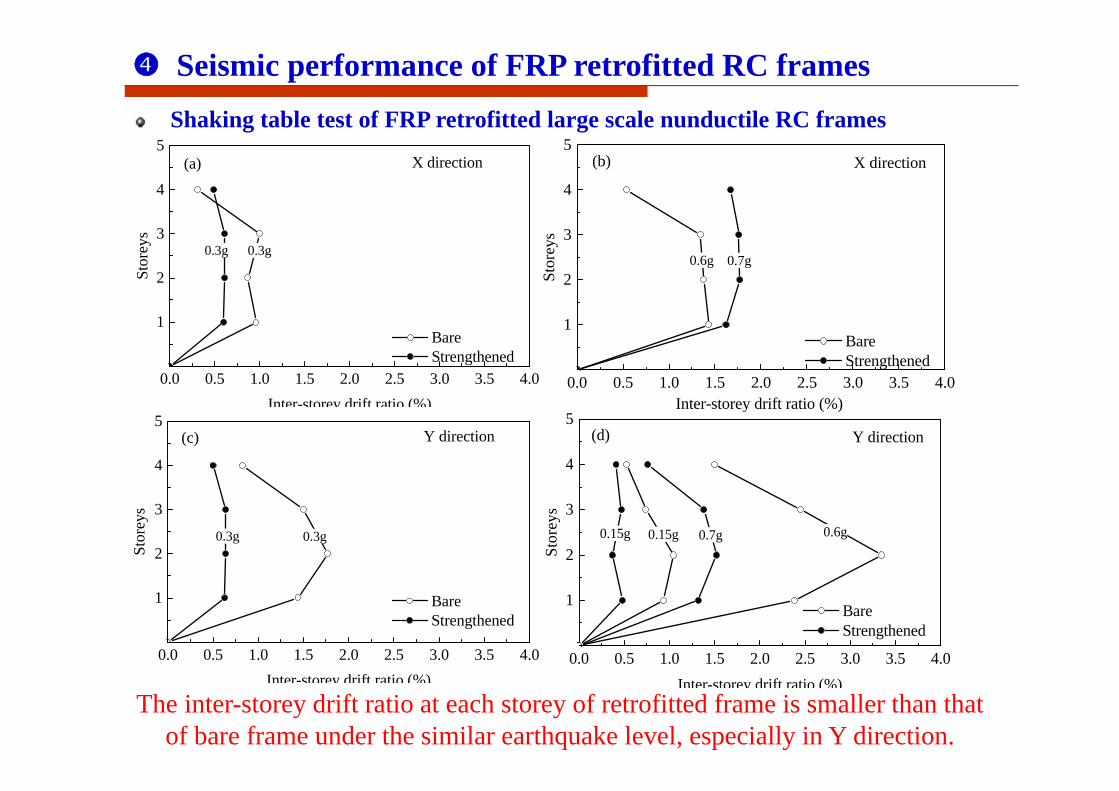
Shaking table test of FRP retrofitted large scale nunductile RC frames
Seismic performance of FRP retrofitted RC frames
The inter-storey drift ratio at each storey of retrofitted frame is smaller than that of bare frame under the similar earthquake level, especially in Y direction.
0.0 0.5 1.0 1.5 2.0 2.5 3.0 3.5 4.0
1
2
3
4
5
0.3g0.3g
Bare Strengthened
Stor
eys
Inter-storey drift ratio (%)
X direction(a)
0.0 0.5 1.0 1.5 2.0 2.5 3.0 3.5 4.0
1
2
3
4
5
Bare Strengthened
0.7g0.6g
Stor
eys
Inter-storey drift ratio (%)
X direction(b)
0.0 0.5 1.0 1.5 2.0 2.5 3.0 3.5 4.0
1
2
3
4
5
0.3g
Stor
eys
Inter-storey drift ratio (%)
Bare Strengthened
Y direction(c)
0.3g
0.0 0.5 1.0 1.5 2.0 2.5 3.0 3.5 4.0
1
2
3
4
5
0.6g0.7g0.15gSt
orey
s
Inter-storey drift ratio (%)
Bare Strengthened
Y direction
0.15g
(d)
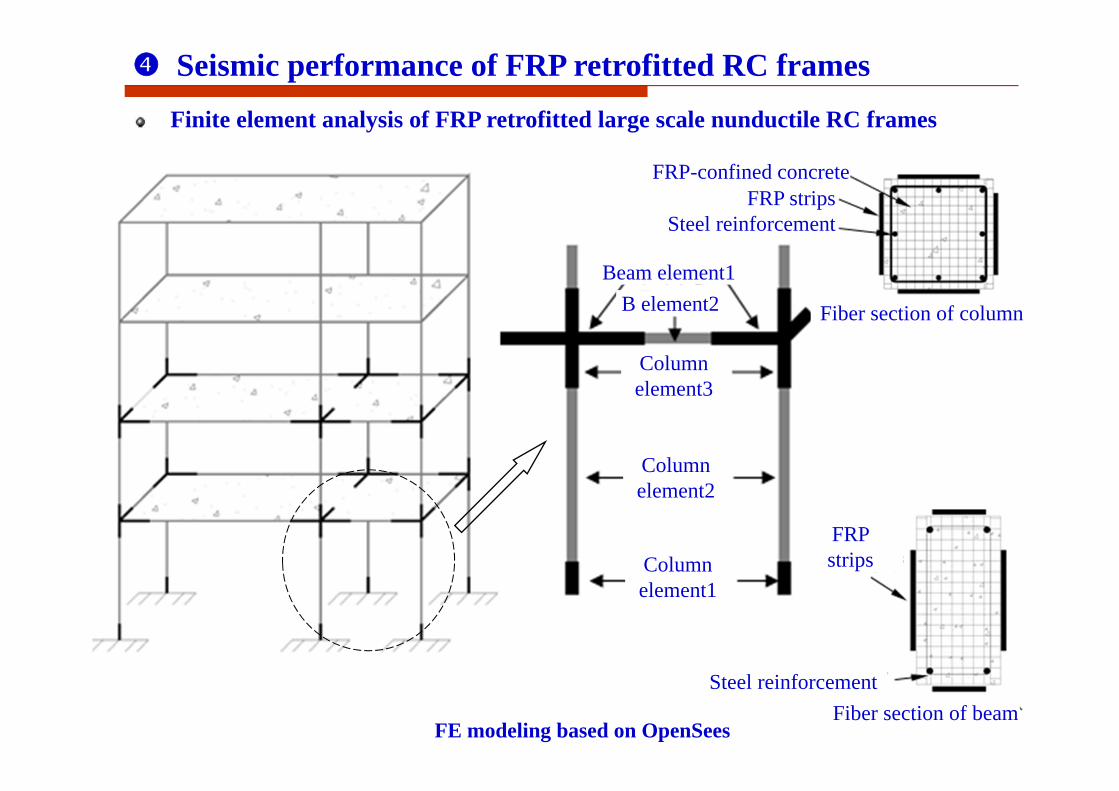
Finite element analysis of FRP retrofitted large scale nunductile RC frames
Seismic performance of FRP retrofitted RC frames
FE modeling based on OpenSees
Beam element1B element2
Column element3
Column element2
Column element1
Steel reinforcement
FRP strips
Fiber section of beam
Fiber section of column
Steel reinforcementFRP strips
FRP-confined concrete
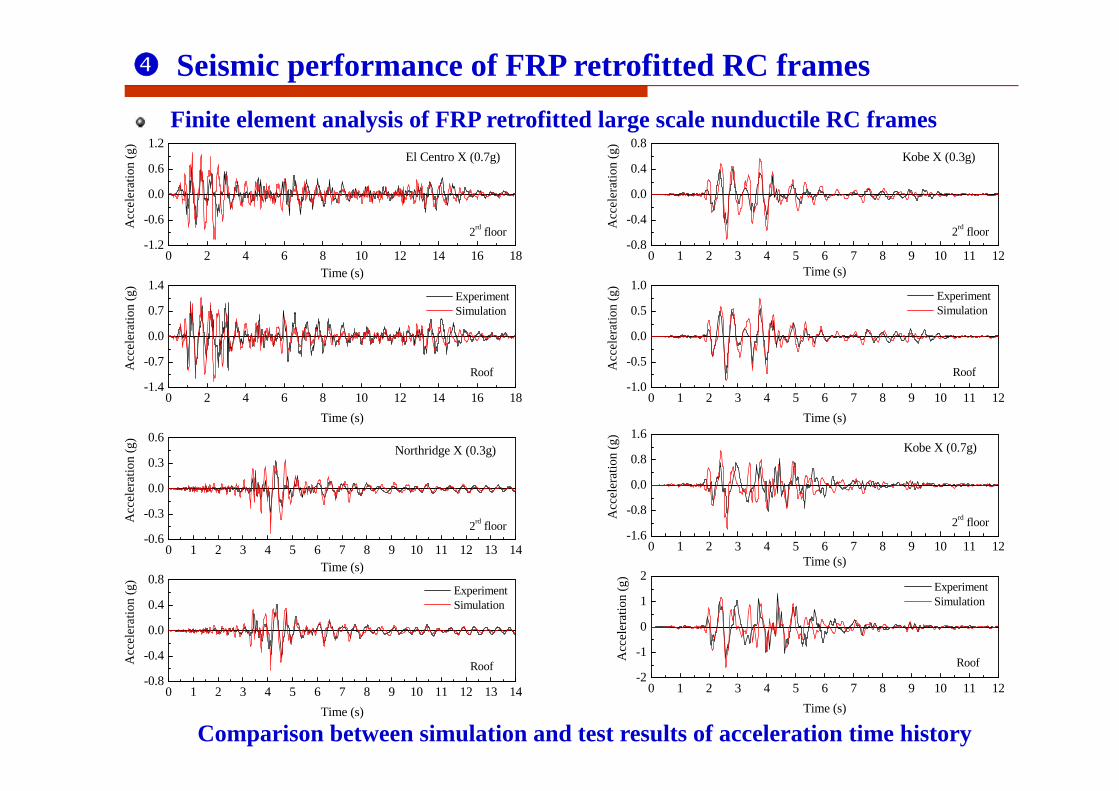
Finite element analysis of FRP retrofitted large scale nunductile RC frames
Seismic performance of FRP retrofitted RC frames
0 1 2 3 4 5 6 7 8 9 10 11 12 13 14-0.6
-0.3
0.0
0.3
0.6
0 1 2 3 4 5 6 7 8 9 10 11 12 13 14-0.8
-0.4
0.0
0.4
0.8
2rd floorAcc
eler
atio
n (g
)
Time (s)
Northridge X (0.3g)
RoofAcc
eler
atio
n (g
)
Time (s)
Experiment Simulation
0 2 4 6 8 10 12 14 16 18-1.2
-0.6
0.0
0.6
1.2
0 2 4 6 8 10 12 14 16 18-1.4
-0.7
0.0
0.7
1.4
2rd floorAcc
eler
atio
n (g
)
Time (s)
El Centro X (0.7g)
RoofAcc
eler
atio
n (g
)
Time (s)
Experiment Simulation
0 1 2 3 4 5 6 7 8 9 10 11 12-0.8
-0.4
0.0
0.4
0.8
0 1 2 3 4 5 6 7 8 9 10 11 12-1.0
-0.5
0.0
0.5
1.0
2rd floorAcc
eler
atio
n (g
)
Time (s)
Kobe X (0.3g)
RoofAcc
eler
atio
n (g
)
Time (s)
Experiment Simulation
0 1 2 3 4 5 6 7 8 9 10 11 12-1.6
-0.8
0.0
0.8
1.6
0 1 2 3 4 5 6 7 8 9 10 11 12-2
-1
0
1
2
2rd floorAcc
eler
atio
n (g
)
Time (s)
Kobe X (0.7g)
RoofAcc
eler
atio
n (g
)
Time (s)
Experiment Simulation
Comparison between simulation and test results of acceleration time history
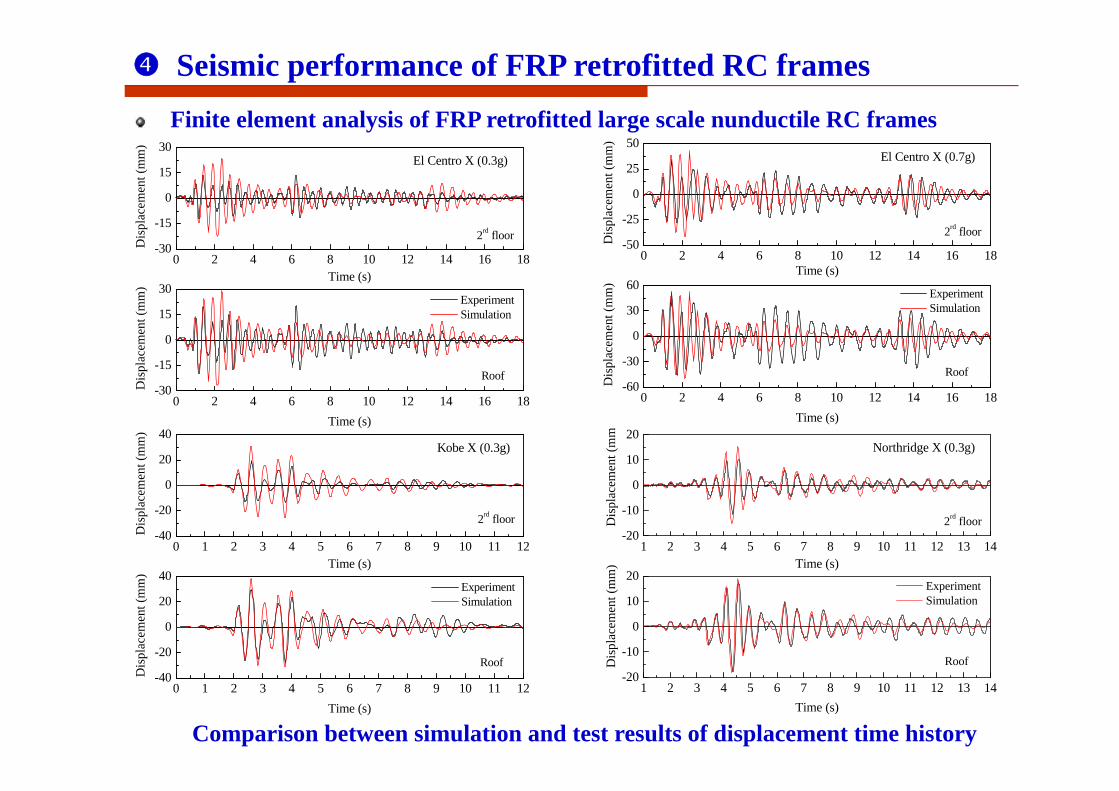
Finite element analysis of FRP retrofitted large scale nunductile RC frames
Seismic performance of FRP retrofitted RC frames
Comparison between simulation and test results of displacement time history
0 2 4 6 8 10 12 14 16 18-30
-15
0
15
30
0 2 4 6 8 10 12 14 16 18-30
-15
0
15
30
2rd floor
Dis
plac
emen
t (m
m)
Time (s)
El Centro X (0.3g)
Roof
Dis
plac
emen
t (m
m)
Time (s)
Experiment Simulation
0 1 2 3 4 5 6 7 8 9 10 11 12-40
-20
0
20
40
0 1 2 3 4 5 6 7 8 9 10 11 12-40
-20
0
20
40
2rd floor
Dis
plac
emen
t (m
m)
Time (s)
Kobe X (0.3g)
Roof
Dis
plac
emen
t (m
m)
Time (s)
Experiment Simulation
1 2 3 4 5 6 7 8 9 10 11 12 13 14-20
-10
0
10
20
1 2 3 4 5 6 7 8 9 10 11 12 13 14-20
-10
0
10
20
2rd floorDis
plac
emen
t (m
m
Time (s)
Northridge X (0.3g)
RoofDis
plac
emen
t (m
m)
Time (s)
Experiment Simulation
0 2 4 6 8 10 12 14 16 18-50
-25
0
25
50
0 2 4 6 8 10 12 14 16 18-60
-30
0
30
60
2rd floor
Dis
plac
emen
t (m
m)
Time (s)
El Centro X (0.7g)
Roof
Dis
plac
emen
t (m
m)
Time (s)
Experiment Simulation

Thanks for your attention